Abstract
This research investigates the enhancement of heat transfer in a heat exchanger that is made of a corrugated tube which has a twisted plate inserted in it; the corrugation and twisted plate are expected to increase the amount of heat transfer since the plate is acting as a connection between the center of the flow and the edges of the tube. The turbulence will cause an increase in pressure drop along the channel length, so the investigation will try to find the best compromise between the gain in heat transfer and loss of hydraulic energy by using well-established metrics. A positive heat transfer gain is achieved if the metric indicates a value equal to or greater than 1. This CFD research will be compared with the experimental results found in previous studies cited in the text. After validating the CFD results, it is proposed to investigate a new insert geometry to further improve the efficiency of the heat exchanger. The computational fluid dynamics (CFD) simulation was conducted to investigate and validate the CFD model, which evaluates the heat transfer performance in a spirally corrugated tube that has a twisted tape inserted. The heat transfer was then compared to a simple corrugated tube without the twisted tape and to a smooth tube with no corrugations and no twisted tape.
1. Introduction
The use and transfer of energy is necessary in our society today, but that does not come without drawbacks on our planet’s environment and our economy. Natural resources are decreasing, as is their cost to produce and transfer. Creating ways to maximize the energy transfer process is extremely valuable, and one way to do so is to increase the performance of heat exchangers to reduce energy loss, costs, and materials [1]. One of the best methods to enhance heat transfer in heat exchangers is compound enhancement, which is when different enhancement techniques are used simultaneously. This field is promising for future development [2].
The heat transfer coefficient can be increased significantly using compound enhancement by inserting different devices into a modified tube [2]. The aim of this study is to create a CFD model that is reliable for future attempts at different geometries. Many researchers relied on experiments to develop these enhancements. Heat transfer is increased by corrugation in turbulent flow by increasing the turbulence level and breaking the boundary layer of the flow [3]. Many researchers started using computational methods since these have been developed over recent decades and different computational calculation methods were created. Sparrow et al. (1983) [4] adopted a numerical simulation as early as the 1980s to simulate laminar flow in triangular corrugated tubes and study its heat transfer performance. These new methods allow researchers to save time and effort, as well as funds that would otherwise be needed to create experimental setups and structures [5].
Corrugated tubes are widely used in heat exchangers; Chorak et al. (2014) [6] used CFD to investigate the effect of pitch length over the heat transfer. The authors used different pitch distances ranging from 10 to 40 mm and an inlet velocity ranging from 0.5 to 2 m/s, with water as the working fluid. The grooves of the corrugation have a diameter of 1 mm, while the temperature on the walls of the tube is 58.6 °C. The authors pointed out that the diameter of the grooves plays a big role in the turbulence of the flow; the greater the diameter of the grooves is, the more turbulence is created, and hence more heat transfer. If the diameter decreases, the behavior of the flow looks like a smooth tube. The authors predict that the heat transfer is accomplished mainly by free convection when the ratio of the pitch and the groove decreases, while it is governed by forced convection when the opposite happens.
Rahimi et al. (2009) [7] discussed an experimental and computational fluid dynamics (CFD) investigation on the heat transfer and friction factor characteristics of a tube with modified twisted tape inserts. The study aimed to investigate the effect of different modified twisted tape inserts on heat transfer enhancement and friction factor characteristics. The experimental setup involved a horizontal test section with a heated tube and a modified twisted tape insert. The modified twisted tapes were made of aluminum and had various modifications to the geometrical parameters, such as tape width, twist ratio, and cut angles. The heat transfer coefficient and friction factor were measured experimentally, and CFD simulations were also carried out to validate the experimental results, which showed that the modified twisted tape inserts significantly enhanced the heat transfer coefficient and friction factor compared to the plain tube. Furthermore, the CFD simulations agreed well with the experimental data. The study also investigated the effect of different flow rates on the heat transfer and friction factor characteristics. It was found that increasing the flow rate increased the heat transfer coefficient and friction factor for all the modified twisted tape inserts. In conclusion, the study showed that the modified twisted tape inserts can significantly enhance the heat transfer coefficient and friction factor of a tube. The results can be useful for the design of heat exchangers and other thermal systems where heat transfer enhancement is important [8].
Lou et al. (2011) [9] conducted a simulation study of heat transfer tubes equipped with twisted tape inserts, which are commonly used in heat exchangers to enhance heat transfer. The simulations were conducted using computational fluid dynamics (CFD) techniques to investigate the effects of different twisted tape geometries on heat transfer and fluid flow characteristics. The study found that the twisted tape inserts significantly enhanced the heat transfer rate in the tubes, with the best results achieved using tapes with a twist ratio of 5 and a width ratio of 0.156. Additionally, the twisted tape inserts caused an increase in friction factor, which is a measure of the resistance to fluid flow. However, this increase was relatively small and considered a reasonable trade-off for the improved heat transfer performance. Overall, the study highlights the potential of twisted tape inserts as an effective method for enhancing heat transfer in heat exchangers and provides valuable insights into the optimal design of these inserts for different applications [10].
Salman et al. (2014) [11] ran experiments and numerical simulation to study the effects of the twist ratio and Reynolds number on the heat transfer distribution on a plate heat exchanger. Three twisted tapes were used with twist ratios of 2.93, 3.91, and 4.89. Reynolds numbers ranged from 4000 to 16,000. The authors conducted numerical simulations using k-omega and k-epsilon models. The k-omega model was more accurate relative to the experiment for a conventional jet, while the k-epsilon was more accurate for the jet with swirls. However, the heat transfer rate was more substantial in the conventional jet than in the jet with twisted tapes, but among the jet with a twisted tape group, the heat transfer was greater with a twist ratio of 4.89 than 2.93 and 3.91.
Amini et al. (2015) [12] investigated the effect of twisted tapes as well on the heat transfer of impinging jets. The authors focused on three parameters: Re ranging from 4000 to 16,000, the distance between the jet and the plate with ratios of 2, 4, 6, and 8, and the twist ratio of the twisted plate ranging from 3 to 6. The optimal conditions were found to be at a jet-to-plate interspace of 6 and 8 and twist ratio of 6. These conditions produced a maximum Nusselt number of just under 100 at a Reynolds number of 16,000. However, the authors did notice that the exit velocity dropped by more than half compared to the inlet velocity, which points to a high pressure drop, but no further investigation was conducted to evaluate the energy loss against the heat transfer gain.
Mat Lazim et al. (2014) [13] numerically investigated the impact of spiral corrugation features on overall thermal performance in their study using two-start spirally corrugated tubes. According to the findings, a shape with smooth spiral corrugations can greatly improve heat transmission at low and medium Reynolds numbers. While the rise in friction factor after Re of 700 is significantly more than the increase in heat transmission, the corrugation profile was found to be the master key for generating better heat transfer with the least amount of pressure drop, and it needed to be adjusted to create more heat transfer with the least amount of pumping power. The severity index u has a significant impact on heat transfer enhancement and friction factor, with heat gained accompanied by pressure loss, particularly at high Re. It was also discovered that this corrugation profile created harmony and ordered swirls in the secondary flow region, lowering pressure drop and saving pumping power.
Vahidifar and Banihashemi (2023) [14] studied a simple geometry of turbulators; a tube with the disc, ring, and O-ring turbulators with an area ratio equal to the cross-section of the turbulator to the pipe (40%) were assessed in different pitches. The effect of stimulating the main air flow in increasing the Nu and thermal performance was investigated. The Nu for the pipe in the presence of turbulators is much higher than that of the smooth pipe in turbulators, and heat transfer increases. By inserting a ring turbulator, the highest value of convection heat transfer coefficient is obtained.
The Nu increases between 2.59- and 3.21-fold at PR = 2 (PR is pitch ratio distancing) for ring, and as the Re increases, so does the heat transfer. The Nu value for the circular ring turbulator is higher than that for the O-ring turbulator, because the vortices’ strength, number, and magnitude are important in transferring heat energy. The friction coefficient of the O-ring and circular ring turbulators decreases with the increase of Reynolds number, and the friction coefficient of the circular ring turbulator is higher than that of the O-ring turbulator due to the lack of a streamlined shape and the aerodynamic shape.
Various aspects of shell-and-tube heat exchangers were discussed in Su et al. (2022) [15], emphasizing the use of U-tube heat exchangers with one tube plate for disassembly convenience and suitability in high-temperature, high-pressure applications. This study introduces different baffle designs proposed by researchers, including quadrant helical baffles and circumferential overlap trisection helical baffles.
A new heat exchanger structure involving special-shaped hole or orifice baffles is also presented, aiming to reduce flow resistance, prevent vibration damage, and facilitate tube bundle cleaning. The experimental setup involves heat exchangers with replaceable tube bundle cores, and the testing system uses water in both sides with hot and cold water flowing in the shell-side and tube-side, respectively.
The text details the experimental apparatus, including the testing system, data measurement system, and data control system. It emphasizes the importance of experimental methods in validating simulation models for heat exchangers. The experimental data processing method involves determining fluid properties and analyzing uncertainty.
The performance evaluation section compares helical and segmental baffle schemes, highlighting higher heat transfer coefficients for helical designs. Orifice baffle schemes are shown to outperform segmental baffles, producing a jet effect for enhanced heat transfer. The comparison of different heat exchanger types concludes that helical and orifice baffle schemes exhibit superior overall and shell-side heat transfer coefficients compared to segmental schemes, with ladder helical schemes slightly outperforming orifice baffle schemes according to comprehensive indexes.
The text by Gu et al. (2020b) [16] discusses helical flow applications in heat exchangers, particularly focusing on twisted elliptical tube heat exchangers (TETHX). It emphasizes the advantages of TETHX over segmental baffle heat exchangers, highlighting better flow and heat transfer characteristics. Previous studies on TETHX, considering factors such as aspect ratio and twist pitch, are cited.
A new type of TETHX with alternating V-rows of coupling-vortices is proposed to improve heat transfer performance and energy utilization efficiency. The study involves constructing and simulating eleven geometric models, comparing a conventional parallel-vortex structure with the proposed coupling-vortex structure.
The physical model involves a unique tube layout configuration with 37 tubes of a fixed length of 1000 mm and a major axis fixed at 12.3 mm. The hydraulic diameter of the tube bundle is defined as the cross-sectional area on the shell side multiplied by four.
The simulation results are validated against experimental correlations, and the analysis includes velocity, pressure, and temperature fields. The unique coupling-vortex technology is proposed as an effective enhancement for TETHX without additional manufacturing costs.
Comprehensive performance analysis considers Nusselt number, friction factor, and a comprehensive index. The study concludes that the coupling-vortex schemes in TETHX exhibit higher heat transfer coefficients, slightly higher pressure drops, and more uniform temperature fields compared to parallel-vortex schemes. The mean values for the coupling-vortex schemes are reported as 7.8%, 8.7%, and 4.9% for heat transfer coefficients, pressure drops, and temperature field uniformity, respectively. The unique coupling-vortex technology is suggested as a promising enhancement for TETHX with improved thermal and hydraulic performance.
The study conducted by Li et al. (2021) [17] delves into the intricacies of shell-side convection heat transfer and hydraulic resistance in double tube heat exchangers (DTHEs) employing twisted oval tubes (TOTs). Notably, the research identifies Case 10 as yielding the highest comprehensive heat transport performance.
In the realm of double tube heat exchangers, renowned for their widespread application in diverse industries, the investigation concentrates on the deployment of twisted oval tubes (TOTs). This choice stems from the notable heat transfer performance exhibited by TOTs, prompting a departure from previous studies primarily focused on high Reynolds numbers. Instead, this research deliberately explores the dynamics at play in low Reynolds number flow scenarios.
The physical model under scrutiny involves DTHE configurations featuring coaxial TOTs and circular tubes (CTs). The investigation encompasses 14 distinct cases, each characterized by unique geometric dimensions. To facilitate clear communication, a nomenclature is introduced, aiding in the systematic description and differentiation of the various DTHE configurations.
Employing a sophisticated 3-D computational model, the study meticulously scrutinizes the heat transport and hydraulic resistance properties within the shell side of DTHEs. The turbulent regime is captured using the SST k-w turbulent model, and a comprehensive performance evaluation criterion (PEC) becomes the yardstick for assessing the multifaceted performance metrics.
Prior to delving into the specifics of the investigation, the study ensures the independence of the computational grid and validates the numerical model. The SST k-w turbulent model emerged as the most fitting choice for capturing the nuanced behavior of twisted oval tubes. Validation exercises demonstrated a commendable alignment between numerical simulations and experimental data.
In conclusion, the study illuminates the substantial augmentation of heat transport performance achievable in DTHEs through the strategic integration of TOTs and CTs. The observed enhancements range from 24.0% to 39.0%, underscoring the potential of this configuration. Additionally, it becomes evident that manipulating the inner aspect ratio (Ai/Bi) exerts a more discernible influence on performance than variations in the outer aspect ratio (Ao/Bo).
Pirbastami and Moujaes (2016) [18] present a computational fluid dynamics (CFD) study on heat enhancement in helically grooved tubes. The study explores the impact of different groove dimensions on the thermal performance and pressure drop of water inside grooved tubes. The authors investigate three rectangular grooved tubes with varying groove width (w) and depth (e) and analyze the Reynolds number (Re) range of 4000–10,000. The results show that the highest performance is achieved with specific groove dimensions (w = 0.2 mm and e = 0.2 mm). Additionally, the study examines the influence of pitch size to tube diameter (p/D) ratios on Nusselt number (Nu) and friction factor (f). The findings indicate that increasing the p/D ratio leads to a decrease in both Nu and f values. The paper provides empirical correlations for Nu and f as functions of p/D and Re number, suggesting that incorporating internal grooves with specific dimensions can enhance heat exchanger performance.
2. Numerical Method and Procedure
2.1. Geometry and Grid Generation
Zimparov [2] investigated eight 1.2 m long copper spirally corrugated tubes, and Table 1 represents the dimensionless parameters of the tubes. Figure 1 shows the different geometrical parameters of the corrugations and twisted tape. Tubes whose last digit ends with 0 are corrugated tubes (i.e., 5030), while a last digit of 3, 4, or 5 means that the tube has a twisted plate inserted with the following dimensions: t = 0.8 mm; 3—H/Di = 7.6; 4—H/Di = 5.7, and 5—H/Di = 4.7. The focus of this study is on the tube 5035 because, during Zimparov’s experiment, it had the best performance enhancement, and it is compared against a smooth tube and tube 5030. The smooth tube has a diameter of 16.0 mm with a wall thickness of 0.8 mm. Tube 5035 is 1.2 m long and has a diameter of 13.51 cm, a wall thickness of 2.2 mm, and the material is copper.

Table 1.
Geometric parameters of tube 5030.
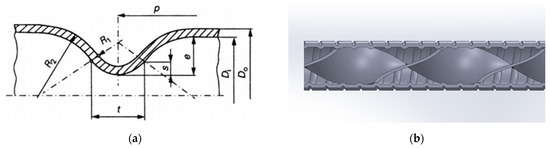
Figure 1.
(a,b) Pictures showing geometrical parameters presented in Table 1 [2].
The geometry was modeled using SOLIDWORKS 2022, then imported to STAR-CCM+ 2022.1 for simulation and analysis. A polyhedral mesh was used. Its main advantage is that each element has many adjacent cells, which helps reduce errors in gradients. Polyhedrons are also less susceptible to stretching than tetrahedrons, resulting in enhanced mesh quality and model numerical stability [6].
R1 = 0.5s [1 + 0.25(t/s)2] − 0.8
R2 = 0.5(e − s)[1 + 0.25(t/s)2] + 0.8
A prism layer was also used to make the mesh finer at the walls of the tube and make the twisted tape capture the change of the temperature gradient. Figure 2 shows the prism layer with a total thickness of 10% of the mesh size. The mesh size is 3 mm. It was found to be the best mesh supported by a grid independency study, which will be presented later.
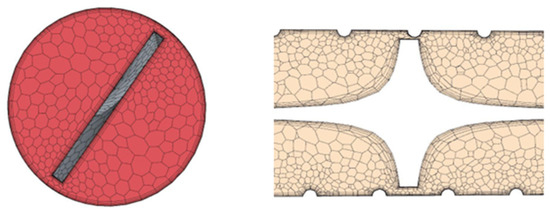
Figure 2.
Volume mesh showing prism layer at solid boundaries.
2.2. Governing Equations and Turbulence Model
This study focuses on turbulent flow at a range of Reynolds number of 3.5 × 10³ < Re < 5.0 × 10⁴, and the twisted plate mixes the flow and adds turbulence, as shown in Figure 3. The tubes are the same as the ones studied by Zimparov et al. (2012) [2].
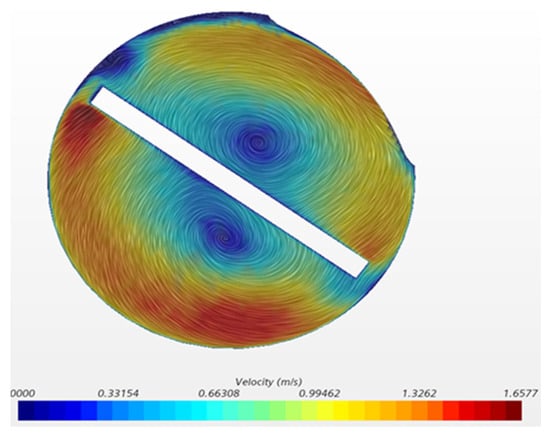
Figure 3.
Scalar scene showing swirls created by the twisted plate.
The governing equations of this simulation are the incompressible Reynolds averaged Navier–Stokes equations, the energy equation, and the steady 3-D form of the continuity [7].
Conservation of mass:
Navier–Stokes equations:
Conservation of energy:
Dissipation function:
The CFD model used is the k-ε model [1,8,9]. In the k-ε two equation model, the velocity and length scale of turbulence are defined with two additional partial-differential equations: one for the turbulent kinetic energy k, the other for the dissipation rate ε, and an algebraic demonstration for the eddy viscosity [1,8,9] is also given as in Equation (9).
Kinetic energy Equation k:
Dissipation rate equation ε:
Eddy viscosity:
The k and ε equations are solved with the mean Navier–Stokes equations. STAR-CCM+ offers a choice of eight different k-ε turbulence models. The constant variables of k-ε were suggested by STARCCM+ 2022.1 as follows [1]: Cμ = 0.09, Cε1 = 1.44, Cε2 = 1.92, σk = 1.3 and σε = 1.
Table 2, provided by Zimparov et al., represents the errors of the measured parameters, which will be useful to validate the CFD model, as the goal is to check that the CFD results fall within those margins of errors. The CFD simulation will not be concerned by the steam temperature, as the wall temperature is enough to be used as a boundary condition.
Table 2.
Uncertainties of measured and calculated parameters [2].
2.3. Flow and Boundary Conditions
As mentioned earlier, the flow has a Reynolds number that ranges between 3.5 × 10³ < Re < 5.0 × 10⁴. The working fluid is water and the pipe wall (assumed copper) thickness is neglected in the CFD analysis. The justification for that is given is it was found that the pipe thickness thermal resistance is about 50 times smaller than that of the convection flow thermal resistance (h is calculated as an average along the length of the pipe as in Equation (11)) in the pipe. Hence, from this fact, the temperature drop across the inside and outside surface of the pipe was calculated as negligible compared to that of the flow. Therefore it is deduced that the temperature outside the pipe can be assumed to be that inside the pipe without loss of accuracy. A temperature Tw is applied directly on the fluid according to Zimparov’s data.
The wall temperature ranged from 38 °C to 91.6 °C, the inlet temperature of the water ranged from 23.5 °C to 86.1 °C, and the inlet velocity of the water was calculated for each run from a given Re. A total of 16 runs were conducted for each tube. Table 3 and Table 4 show the boundary conditions for each experiment.
Table 3.
Boundary conditions for tube 5030 [2].
Table 4.
Boundary conditions for tube 5035 [2].
The water flow is considered incompressible, turbulent, three-dimensional, and at a steady state. A non-slip condition was considered for the walls, and the outlet pressure was the atmospheric pressure. The number of iterations needed to achieve convergence varied for each run as it got higher. As the Re number increased and the tube geometry changed, convergence ranged from 200 to 1500 iterations. Convergence was considered “achieved” when the energy equation residual reached 1 × 10⁻⁴ and the flow was thermally fully developed.
2.4. Parameters and Metric Definitions
The three parameters of interest in investigating in this study are the heat transfer coefficient and the friction factor. The inside heat transfer coefficient hi is represented as a function of Nu with the following relation:
while hi is:
is the heat transfer in (W) and it was an output from STAR-CCM+, then Equation (11) is used to calculate hi.
The same Equations (11)–(13) as Zimparov et al. [2] were used to maintain similarity. The accuracy of the temperature measurements was as follows: inlet and outlet water temperatures, steam temperature—0.1%, and mean tube wall temperature along the length—0.5%. The accuracy of the calculated heat transfer coefficients was estimated at 2.5% for the condensing heat transfer coefficient and at 15–20% for the inside heat transfer coefficient. All uncertainties of the measured quantities and calculated parameters are presented in Table 2 [1]. These uncertainties are used later to correlate between our CFD results and the experimental results.
The fanning friction factor is given by:
ΔP is the pressure drop. It is an output from STAR-CCM, then Equation (13) is used to calculate f. Coefficient (η) is introduced to evaluate the gain in heat transfer against the energy loss due to the increased pressure drop caused by the tubes’ geometry (i.e., corrugations and twisted tape) [1].
Nu is the Nusselt number of a given tube and Nus is for the smooth tube. The same applies to the friction factor.
The ratios Nu/Nus and f/fs are a dimensionless representation of the heat transfer and friction factor, respectively, that allows for the comparison of both properties. Other papers have used a similar factor, such as [13,14].
3. Results
3.1. Grid Independency Study
The grid independency study was conducted to achieve a 1–2% error between different mesh sizes, which helped to choose the right size that balances accuracy and computing time. Four grids were tested: grid 1: 1,250,789 elements; grid 2: 2,603,124 elements; grid 3: 3,762,700 elements; and grid 4: 5,341,023 elements. The approach to choose the most optimal grid is done by comparing the heat transfer parameters; in this case, axial velocity and temperature along the outlet diameter for all the grids (Figure 4 and Figure 5). When the change in results becomes minimal as meshes becomes finer, then grid independency has been achieved and the grid with the smaller number of elements is chosen, after which the results do not change significantly. In this case, it was mesh 3.
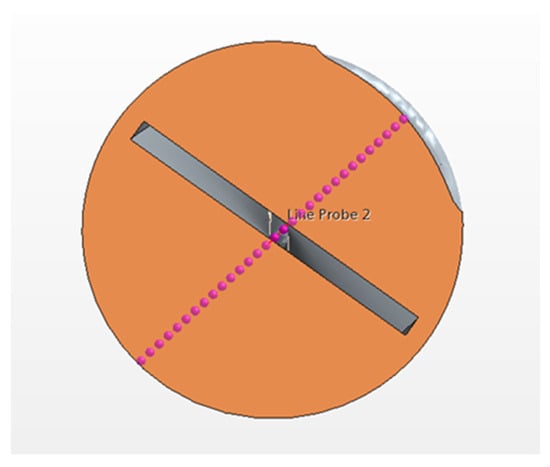
Figure 4.
Probe line along outlet diameter for axial velocity and temperature results.
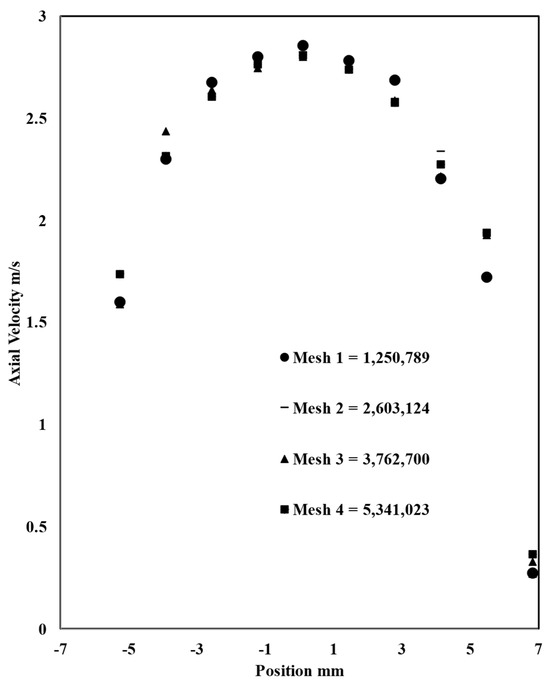
Figure 5.
Axial velocity for four different meshes along outlet diameter of the pipe.
3.2. Experimental Data and CFD Validation
To make sure the CFD model is correct, comparing the simulation results against experimental data [1] is necessary before conducting any further studies. The uncertainties from experimental measurement are represented by error bars (Table 2). The same boundary conditions from the experiment were used in the CFD simulation, courtesy of Dr. Zimparov. The Nusselt number, friction factor, and heat transfer coefficient were calculated from Equations (10), (11) and (13), while the pressure drop ΔP and heat transfer were obtained from the CFD results. In [1], the heat transfer coefficient was presented as Nu*Pr-0.4. The CFD validation is done by comparing key parameters (i.e., heat transfer coefficient, friction factor and the Nusselt number). The purpose of this validation is to be able to use the same model parameters to confidently run other simulations with different geometries and expect reasonable accuracy.
The friction factor was calculated by implementing Equation (12) into the software, while the area, mass flow rate, and pressure drop were calculated automatically from STAR-CCM+.
The CFD results agree with the experimental results as shown in Figure 6 for tube 5035.
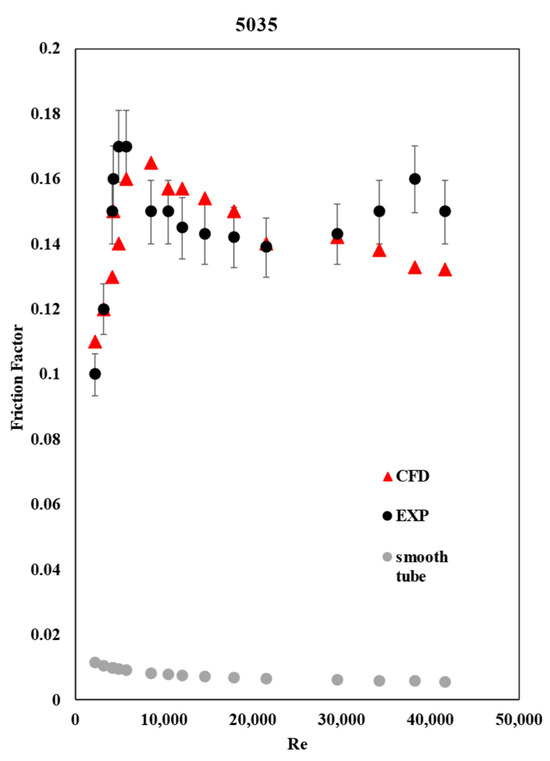
Figure 6.
Comparison of friction factor obtained from CFD simulation with experimental data [2] for tube 5035.
As expected, the friction factor increased substantially in tube 5035 due to the added friction by the twisted plate. This means that there is an increase in head loss, which will require more pumping power to transfer the water from one end to another.
For tube 5035, the Nusselt number kept increasing with Re as shown in Figure 7. Zimparov et al. [2] represents the Nusselt number as NuPr−0.4, where Pr is the Prandtl number for water, and Nu is calculated using Equation (10).
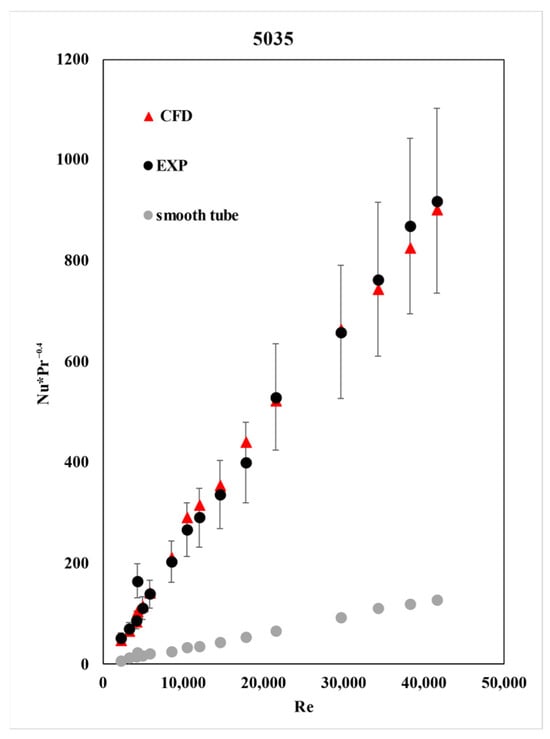
Figure 7.
Comparison of Nusselt number obtained from CFD simulation with experimental data [2] for tube 5035 and smooth tube.
As mentioned before, there was an increase in the amount of heat conducted by the twisted plate, along with more friction caused by the plate’s geometry, which resulted in head loss.
Our goal is to increase the heat transfer without increasing the pressure drop to a level where it is no longer beneficial due to the required pumping power.
The enhancement factor (Equation (14)) allows us to evaluate the gain in heat transfer against the energy loss where Nu5/Nus is the ratio of the Nusselt number of the smooth tube and tube 5035, and f5/fs is the ratio for the fanning factor.
If η < 1, that means that the friction factor is greater than the heat transfer, indicating that the tube’s design is not efficient for transferring heat without increasing the cost of energy consumption required for pumping.
On the other hand, if η ≥ 1, the tube design can be used for enhancement purposes.
The error bars represent the combined errors from the friction factor and the heat transfer coefficient, which is considered in the Nusselt number.
From Figure 8, the enhancement is beneficial when Re ranges from 10,000 to 28,000. Outside of this range, even though there is a greater heat transfer coefficient, the friction factor is high enough to require more energy to pump the water through the pipe, thus resulting in diminution of the η factor.
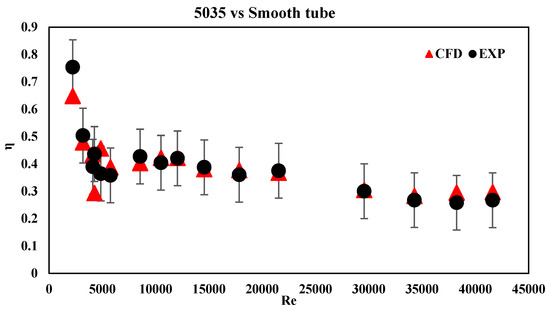
Figure 8.
Enhancement factor η comparing the performance of tube 5035 with smooth tube.
3.3. Proposed Vane Geometries
The purpose of this section is to introduce a new geometry that will make use of the same enhancement technique which is compound enhancement. The principle behind this is similar to the geometry discussed above, as it will induce turbulence inside the tubes using a different insert.
This geometry attempted to increase the heat transfer at the same level of tube 5035 while trying to keep the pressure drop at a reasonable level to maximize the η factor.
The new geometry was made of 21 vanes mounted on a 1 m long shaft and inserted inside a simple tube of 12 mm diameter, with equal spacing between each set of vanes.
The geometry was modeled using SolidWorks. The vanes were angled at 135° with respect to the shaft axis. The vanes were equally spaced around the shaft at 45° between each vane. Each vane set was rotated by 15° from its precedent until eventually completing a full 360° rotation. Four variations were made of this with different spacing between each vane set: 5 cm, 7.5 cm, 10 cm and 12.5 cm.
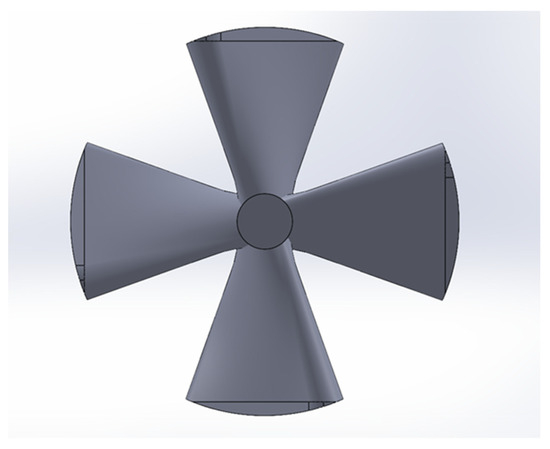
Figure 9.
Front view of vane insert.
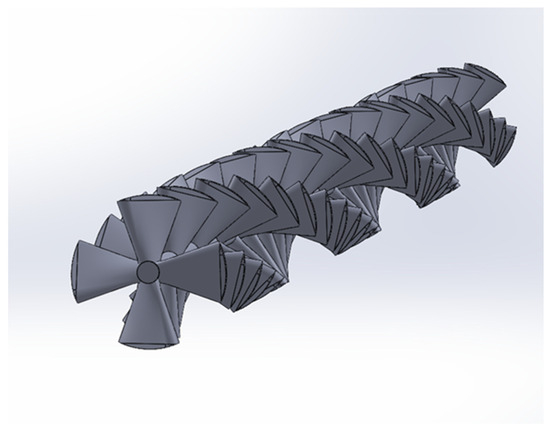
Figure 10.
Isometric view of vane insert.

Figure 11.
Side view of vanes.
Since the previous model was validated by the experimental data, the same mesh settings mentioned in Section 3.3 was used for this new geometry.
Figure 12 and Figure 13 show the construction of mesh after using the same settings as the tube 5035 model. The prism layer can be noticed near the tube wall to capture the temperature gradient, it can be noticed as well that the mesh has an adaptive size; it becomes finer near the walls of the tube and the walls of the vanes to predict turbulence more accurately.
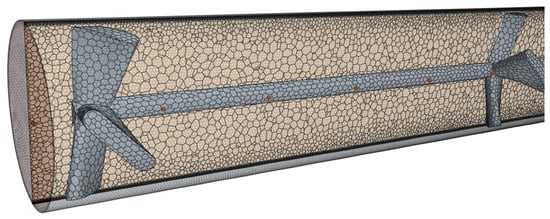
Figure 12.
Isometric view of mesh.
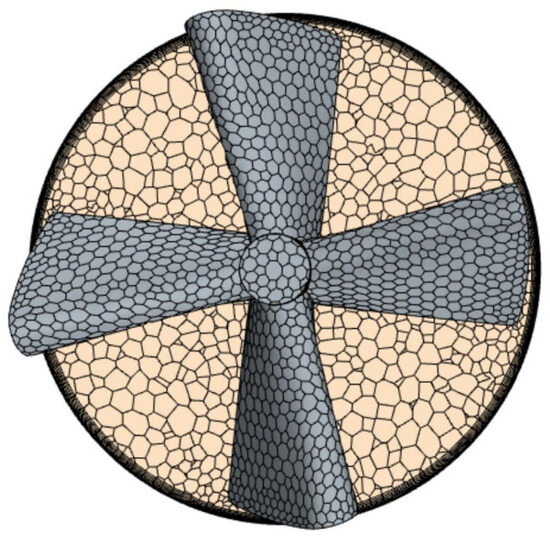
Figure 13.
Front view of mesh.
To keep similarity for comparison purposes with the previous model and experimental data, the same boundary conditions presented in Section 2.3 were applied for the vane geometry.
Figure 14, Figure 15, Figure 16 and Figure 17 show the different variations that were tested in this section.
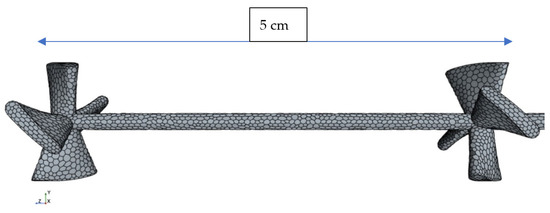
Figure 14.
Vanes spaced at 5 cm.
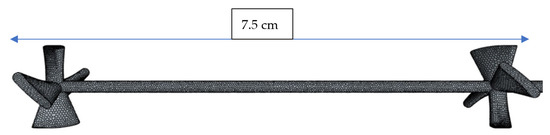
Figure 15.
Vanes spaced at 7.5 cm.
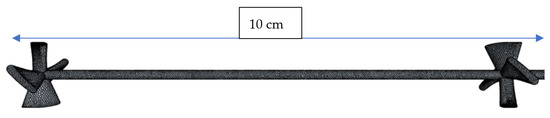
Figure 16.
Vanes spaced at 10 cm.

Figure 17.
Vanes spaced at 12.5 cm.
From Figure 18a, it can be noticed that the vanes variations had slightly less heat transfer than tube 5035, which was expected since the vanes do not run continuously through the tube, hence the heat transfer through conduction is lesser.
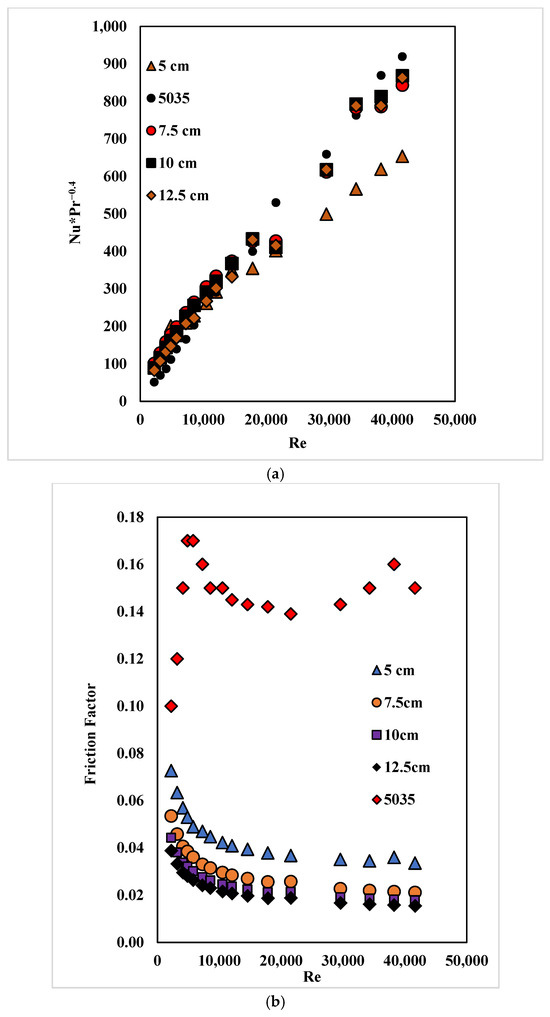
Figure 18.
(a) Comparison of Nusselt number for vane variations and tube 5035. (b) Friction factor comparison of the vane geometries and tube 5035.
The vane geometries had a considerably lower friction factor value than tube 5035. This was the attempted goal of these geometries, that by reducing material from the insert there will be less fluid friction and hence less hydro-mechanical losses.
3.4. Thermal Performance
The factor η allows for a direct comparison between the characteristics mentioned above and the different types of geometries mentioned thus far in this study. Figure 19 shows the η factor calculated for the vane geometry with tube 5035 as reference. It can be noticed that the thermal performance ranges from 4 to around 9 for the different variations. The 5 cm spaced vanes had the lowest increase. The 12.5 cm spaced vane geometry had the biggest enhancement in terms of the η factor. These results are mainly due to the significantly lower friction factor shown in Figure 18b, since the geometries with 7.5–10 and 12.5 cm had roughly the same heat transfer values.
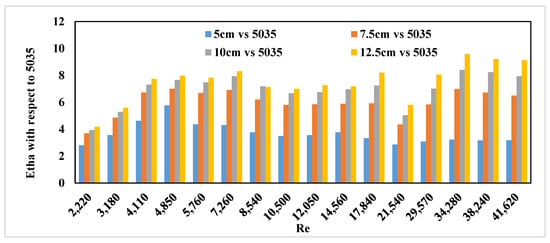
Figure 19.
η factor using ratios of vane geometries and tube 5035.
4. Conclusions
The enhancement in heat transfer is undeniable in tubes with a twisted insert, but according to this study’s CFD results, when the friction caused by the twisted plate is considered, the enhancement is optimal only for Re ranging from 10,000 to 28,000, where 39.6 C < Ti < 51.5 C, and 49.3 C < Tw < 91.8 C, where η > 1. For higher Re, the Nusselt number increased significantly due to the elevated turbulence, and thus an increased mixing of the flow in the transverse direction but with higher friction requires more power to pump the flow, where η < 1.
The CFD model accurately predicted the experimental data, and the parameters used in the model are appropriate and can be replicated in similar simulations.
Figure 11 and Figure 12 show that the compound enhancement method has an undeniable positive effect on the heat transfer coefficient. Tube 5035 with both corrugations and the twisted insert had a heat transfer coefficient two to three times higher than tube 5030 with only corrugations at the same Re number range. A practical use of such heat exchangers can be in nuclear reactor cooling, automotive radiators, and other applications where tubular heat exchangers are used.
On the other hand, the pressure drop increased significantly as well. Figure 13 and Figure 14 show that tube 5035 experienced more than two times the pressure drop when compared to tube 5030 at the same Re number range.
In this study, a new tubular heat exchanger geometry with vanes insert was proposed to enhance heat transfer while maintaining a reasonable pressure drop. The vanes were designed and modeled using SolidWorks, with 21 vanes mounted on a 1 m long shaft and inserted inside a 12 mm diameter tube.
CFD simulations were conducted to evaluate the thermal and hydrodynamic performance of the vane geometries. The Nusselt number was used to assess heat transfer, and it was found that the vanes insert achieved significantly higher Nusselt numbers compared to a smooth tube, up to nine times higher. However, the heat transfer of the vane geometries was slightly lower than a tube with continuous enhancement, such as the previously studied tube 5035.
Regarding the friction factor, the vane geometries exhibited higher values compared to a smooth tube, as expected due to increased flow obstruction. However, the friction factor of the vane geometries was considerably lower than the tube with continuous enhancement, indicating reduced hydro-mechanical losses.
The thermal performance, evaluated using the η factor, showed that the vane geometries achieved enhancement ratios ranging from 1 to around 3 for different variations. The 12.5 cm-spaced vane geometry demonstrated the highest η factor due to significantly lower friction factors which makes it the better option in this study.
Further analysis of the 5 cm-spaced vanes at high Reynolds numbers showed lower heat transfer coefficient and increased skin friction coefficient compared to the 12 cm-spaced vanes. This indicated that the closer spacing of the vanes resulted in lower overall performance.
Based on the findings of our study, it can be reasonably concluded that the implementation of vane inserts in the tubular heat exchanger demonstrates promise and effectiveness in enhancing heat transfer performance. These results suggest a potential avenue for further exploration and application in heat exchanger design and optimization. The 12 cm spacing between vanes appears to be a more favorable choice for achieving a balance between heat transfer enhancement and pressure drop. Further investigations and optimizations can be performed to refine the design and maximize the thermal performance of the vane geometries.
Overall, this study provides valuable insights into the potential of using vane inserts in tubular heat exchangers and lays the foundation for further research and development in this area.
Author Contributions
Conceptualization, S.F.M.; Methodology, S.F.M.; Validation, M.M.B.; Formal analysis, M.M.B. All authors have read and agreed to the published version of the manuscript.
Funding
This research received no external funding.
Data Availability Statement
The original contributions presented in the study are included in the article, further inquiries can be directed to the corresponding author.
Conflicts of Interest
The authors declare no conflict of interest.
Nomenclature
| A | heat transfer surface area, m2 |
| D | tube diameter, m |
| R | corrugation radius, m |
| e | ridge height, m |
| f | fanning friction factor |
| H | pitch of the twisted tape in 360° twist, m |
| h | heat transfer coefficient, W/(m2·K) |
| K | thermal conductivity, W/(m·K) |
| k | turbulent kinetic energy, m2/s2 |
| L | tube length, m |
| ṁ | mass flow rate in tube, kg/s |
| Nu | Nusselt number |
| p | pitch of ridging, m |
| Δp | pressure drop, Pa |
| Pr | Prandtl number |
| η | performance factor |
| q | heat transfer rate, W |
| Re | Reynolds number |
| s | cap height of the ridge, m |
| t | cap width of the ridge, m |
| ΔT | temperature difference, K |
| U | overall heat transfer coefficient, W/(m2·K) |
| u,v,w | velocity components in x,y,z directions respectively, m/s |
| u’,v’,w’ | instantaneous fluctuating components in x,y,z; m/s |
| β | helix angle of rib, deg |
| Β* | Β* = β/90 |
| dissipation function | |
| µ | dynamic viscosity, Pa·s |
| ρ | fluid density, kg/m3 |
| σ | surface tension, kg/s2 |
| Subscripts | |
| i | inside/inlet, or value at x = 0 |
| m | mean value |
| o | outside/outlet, or value at x = L |
| s | smooth tube |
| w | wall |
| c | experimental constants |
References
- Pirbastami, S.; Moujaes, S.F.; Mol, S.G. Computational fluid dynamics simulation of heat enhancement in internally helical grooved tubes. Int. Commun. Heat Mass Transf. 2016, 73, 25–32. [Google Scholar] [CrossRef]
- Zimparov, V.; Petkov, V.; Bergles, A. Performance characteristics of deep corrugated tubes with twisted-tape inserts. J. Enhanc. Heat Transf. 2012, 19, 1–11. [Google Scholar] [CrossRef]
- Vicente, P.G.; Garcıa, A.; Viedma, A. Experimental investigation on heat transfer and frictional characteristics of spirally corrugated tubes in turbulent flow at different Prandtl numbers. Int. J. Heat Mass Transf. 2004, 47, 671–681. [Google Scholar] [CrossRef]
- Sparrow, E.M.; Prata, A.T. Numerical solutions for laminar flow and heat transfer in a periodically converging-diverging tube, with experimental confirmation. Numer. Heat Transf. 1983, 6, 441–461. [Google Scholar] [CrossRef]
- Yang, P.; Zhang, H.; Zheng, Y.; Fang, Z.; Shi, X.; Liu, Y. Investigation and optimization of heat transfer performance of a spirally corrugated tube using the Taguchi method. Int. Commun. Heat Mass Transf. 2021, 127, 105577. [Google Scholar] [CrossRef]
- Chorak, A.; Ihringer, E.; Abdellah, A.B.; Dhimdi, S.; Essadiqi, E.H.; Bouya, M.; Faqir, M. Numerical evaluation of heat transfer in corrugated heat exchangers. In Proceedings of the 2014 International Renewable and Sustainable Energy Conference (IRSEC), Ouarzazate, Morocco, 17–19 October 2014. [Google Scholar]
- Rahimi, M.; Shabanian, S.R.; Alsairafi, A.A. Experimental and CFD studies on heat transfer and friction factor characteristics of a tube equipped with modified twisted tape inserts. Chem. Eng. Process. Process Intensif. 2009, 48, 762–770. [Google Scholar] [CrossRef]
- Sosnowski, M.; Krzywanski, J.; Grabowska, K.; Gnatowska, R. Polyhedral meshing in numerical analysis of conjugate heat transfer. EPJ Web Conf. 2018, 180, 02096. [Google Scholar] [CrossRef]
- Lou, J.Z.; Li, J.P.; Dong, Y.J.; Wang, M. Study on Simulation of Heat Transfer Tubes with Twisted-Tape Inserted. Appl. Mech. Mater. 2011, 66–68, 1342. [Google Scholar] [CrossRef]
- Jiji, L.M. Heat Convection, 2nd ed.; Springer: Berlin/Heidelberg, Germany, 2006; pp. 22–45. [Google Scholar]
- Salman, S.D.; Kadhum, A.A.H.; Takriff, M.S.; Mohamad, A.B. Experimental and Numerical Investigations of Heat Transfer Characteristics for Impinging Swirl Flow. Adv. Mech. Eng. 2014, 6, 631081. [Google Scholar] [CrossRef]
- Amini, Y.; Mokhtari, M.; Haghshenasfard, M.; Barzegar Gerdroodbary, M. Heat transfer of swirling impinging jets ejected from Nozzles with twisted tapes utilizing CFD technique. Case Stud. Therm. Eng. 2015, 6, 104–115. [Google Scholar] [CrossRef]
- Mat Lazim, T.; S kareem, Z.; Mohd Jaafar, M.N.; Abdullah, S.; Abdulwahid, A. Heat Transfer Enhancement in Spirally Corrugated Tube. Int. Rev. Model. Simul. IREMOS 2014, 7, 970. [Google Scholar] [CrossRef]
- Vahidifar, S.; Banihashemi, S. Experimental and numerical evaluation of heat transfer enhancement by internal flow excitation. Int. J. Therm. Sci. 2023, 192, 108395. [Google Scholar] [CrossRef]
- Su, J.; Chen, Y.; Wu, J.; Fei, F.; Yang, S.; Gu, H. Experimental investigation on heat transfer performances in half-cylindrical shell space of different heat exchangers. Int. J. Heat Mass Transf. 2022, 189, 122684. [Google Scholar] [CrossRef]
- Gu, H.; Chen, Y.; Wu, J.; Sunden, B. Performance investigation on twisted elliptical tube heat exchangers with coupling-vortex square tube layout. Int. J. Heat Mass Transf. 2020, 151, 119473. [Google Scholar] [CrossRef]
- Li, X.; Wang, L.; Feng, R.; Wang, Z.; Liu, S.; Zhu, D. Study on shell side heat transport enhancement of double tube heat exchangers by twisted oval tubes. Int. Commun. Heat Mass Transf. 2021, 124, 105273. [Google Scholar] [CrossRef]
- Pirbastami, S.; Moujaes, S. Effect of Groove Dimension on Thermal Performance of Turbulent Fluid Flow in Internally Grooved Tube. In Proceedings of the ASME 2016 International Mechanical Engineering Congress and Exposition, Phoenix, AZ, USA, 11–17 November 2016. [Google Scholar] [CrossRef]
Disclaimer/Publisher’s Note: The statements, opinions and data contained in all publications are solely those of the individual author(s) and contributor(s) and not of MDPI and/or the editor(s). MDPI and/or the editor(s) disclaim responsibility for any injury to people or property resulting from any ideas, methods, instructions or products referred to in the content. |
© 2025 by the authors. Licensee MDPI, Basel, Switzerland. This article is an open access article distributed under the terms and conditions of the Creative Commons Attribution (CC BY) license (https://creativecommons.org/licenses/by/4.0/).