Article

Hysteresis-Induced Onset and Progressive Decay of Periodic and Metastable Sheet Cavitation in a Chamfered Circular Orifice

Institute of Space Propulsion, German Aerospace Center (DLR), D-74239 Lampoldshausen, Germany
*
Author to whom correspondence should be addressed.
Current address: Institut für Thermodynamik, Fakultät für Luft- und Raumfahrttechnik, Universität der Bundeswehr München, D-85577 Neubiberg, Germany.
Fluids 2025, 10(3), 59; https://doi.org/10.3390/fluids10030059
Submission received: 26 December 2024 / Revised: 18 February 2025 / Accepted: 23 February 2025 / Published: 26 February 2025
(This article belongs to the Special Issue Cavitation and Bubble Dynamics)

Abstract

:
This study investigates the onset and decay mechanisms of sheet cavitation within a chamfered orifice under turbulent conditions, using high-speed backlight imaging for detailed frame-by-frame analysis. A distinctive metastable sheet cavitation regime was identified, distinguished by its unique hysteresis behavior during onset conditions, with the ability to control periodicity through variations in cavitation numbers. This new sheet cavitation regime appears at high cavitation numbers, contrary to typical expectations of cavitation inception, highlighting a new potential risk within the range of safe operation for hydraulic systems equipped with control valves. Furthermore, linear growth and rapid collapse of the bubble sheet were observed, which differs from the conventional periodic behavior of sheet cavitation on hydrofoils. The new mechanism to intentionally initiate and control this sheet cavitation regime by manipulating the pressure drop across the orifice could potentially be adopted for industrial applications, particularly in the generation of controlled and dispersed bubbles. Future research should include quantifying bubble dynamics within this regime and assessing the effects of fluid properties and orifice geometries on cavitation characteristics. In summary, this study introduces a new perspective on metastable sheet cavitation, emphasizing its potential applications and importance in the design and operation of fluid systems.

1. Introduction

Cavitation occurs when the pressure in a liquid falls below its vapor pressure at constant temperature, leading to the formation of vapor bubbles. This process is driven by the liquid reaching its tensile strength and rupturing due to pressure reduction [1]. Cavitation commonly arises in mechanical devices inducing high pressure drops, such as hydraulic turbines [2], pumps [3], venturis [4], and orifices [5], potentially damaging these devices. In diesel injectors, cavitation bubbles formed from high pressure drops can erode the injector nozzle’s internal surfaces [6], while the hydraulic flip induced by strong cavitation alters spray characteristics [7]. In liquid rocket engines, cavitation not only can cause mechanical damage but can also trigger combustion instability, potentially leading to complete engine destruction. Cavitation may accidentally occur in the propellant supply system, especially in turbopumps, as the temperatures of cryogenic propellants are very close to their saturation temperature [8]. Despite careful design to prevent cavitation, it may still occur during transient starting conditions when the pressure drop through the supply line to the chamber is significantly higher than the design point, and the propellant temperature is higher than the design point due to not fully chilled supply lines and injector head [9].
Conversely, cavitation can be intentionally generated to harness its energy. Using the pressure wave and temperature variation from collapsing cavitation bubbles can enhance chemical reactions, turning the bubble-generating instrument into a reactor [10,11]. This approach finds applications in water waste purification [12,13] and in the food and beverage industries for chemical and physical processes [14]. Moreover, cavitation bubbles can be downsized to the nanoscale with precise design and control [15].
Son et al. [16] identified cavitation from the liquid oxygen (LOX) orifice as a potential source of rocket combustion instability by visualizing the orifice flow [16], showing periodic fluctuations that could induce oscillations in the injection flow rate, affecting the heat release rate within the combustion chamber [17,18]. Cavitation initiates at a cavitation number (K) of approximately 2.0, with its strength increasing as the cavitation number decreases with increasing pressure drop, a finding consistent with other studies [19]. Interestingly, a new type of cavitation regime appears when the pressure drop decreases after cavitation occurs, characterized by a metastable bubble sheet with cyclic growth and decay periods.
Metastable sheet cavitation under laminar flow conditions in a venturi has been previously studied [20], yet the sheet cavitation in this study occurs under turbulent flow conditions. Additionally, periodic sheet cavitation observed with a hydrofoil [21] differs in decay mechanism from that in the current study. While recent work by Ge et al. [22] identified periodic cavitation intensity modulated by thermal effects in a Venturi reactor, this study reveals a distinct pressure-driven hysteresis mechanism inducing sheet cavitation below the initial inception pressure. While hysteresis characteristics of cavitation have been observed on hydrofoil surfaces [23,24], this new regime in the orifice has not been previously reported or studied.
This study investigates periodic sheet cavitation induced at high cavitation numbers due to hysteresis. Using high-speed imaging with backlight, the onset and progressive decay processes are analyzed as a function of time. Furthermore, the bubble sheet length and periodic characteristics are compared as a function of the cavitation number.

2. Experimental Setup and Methods

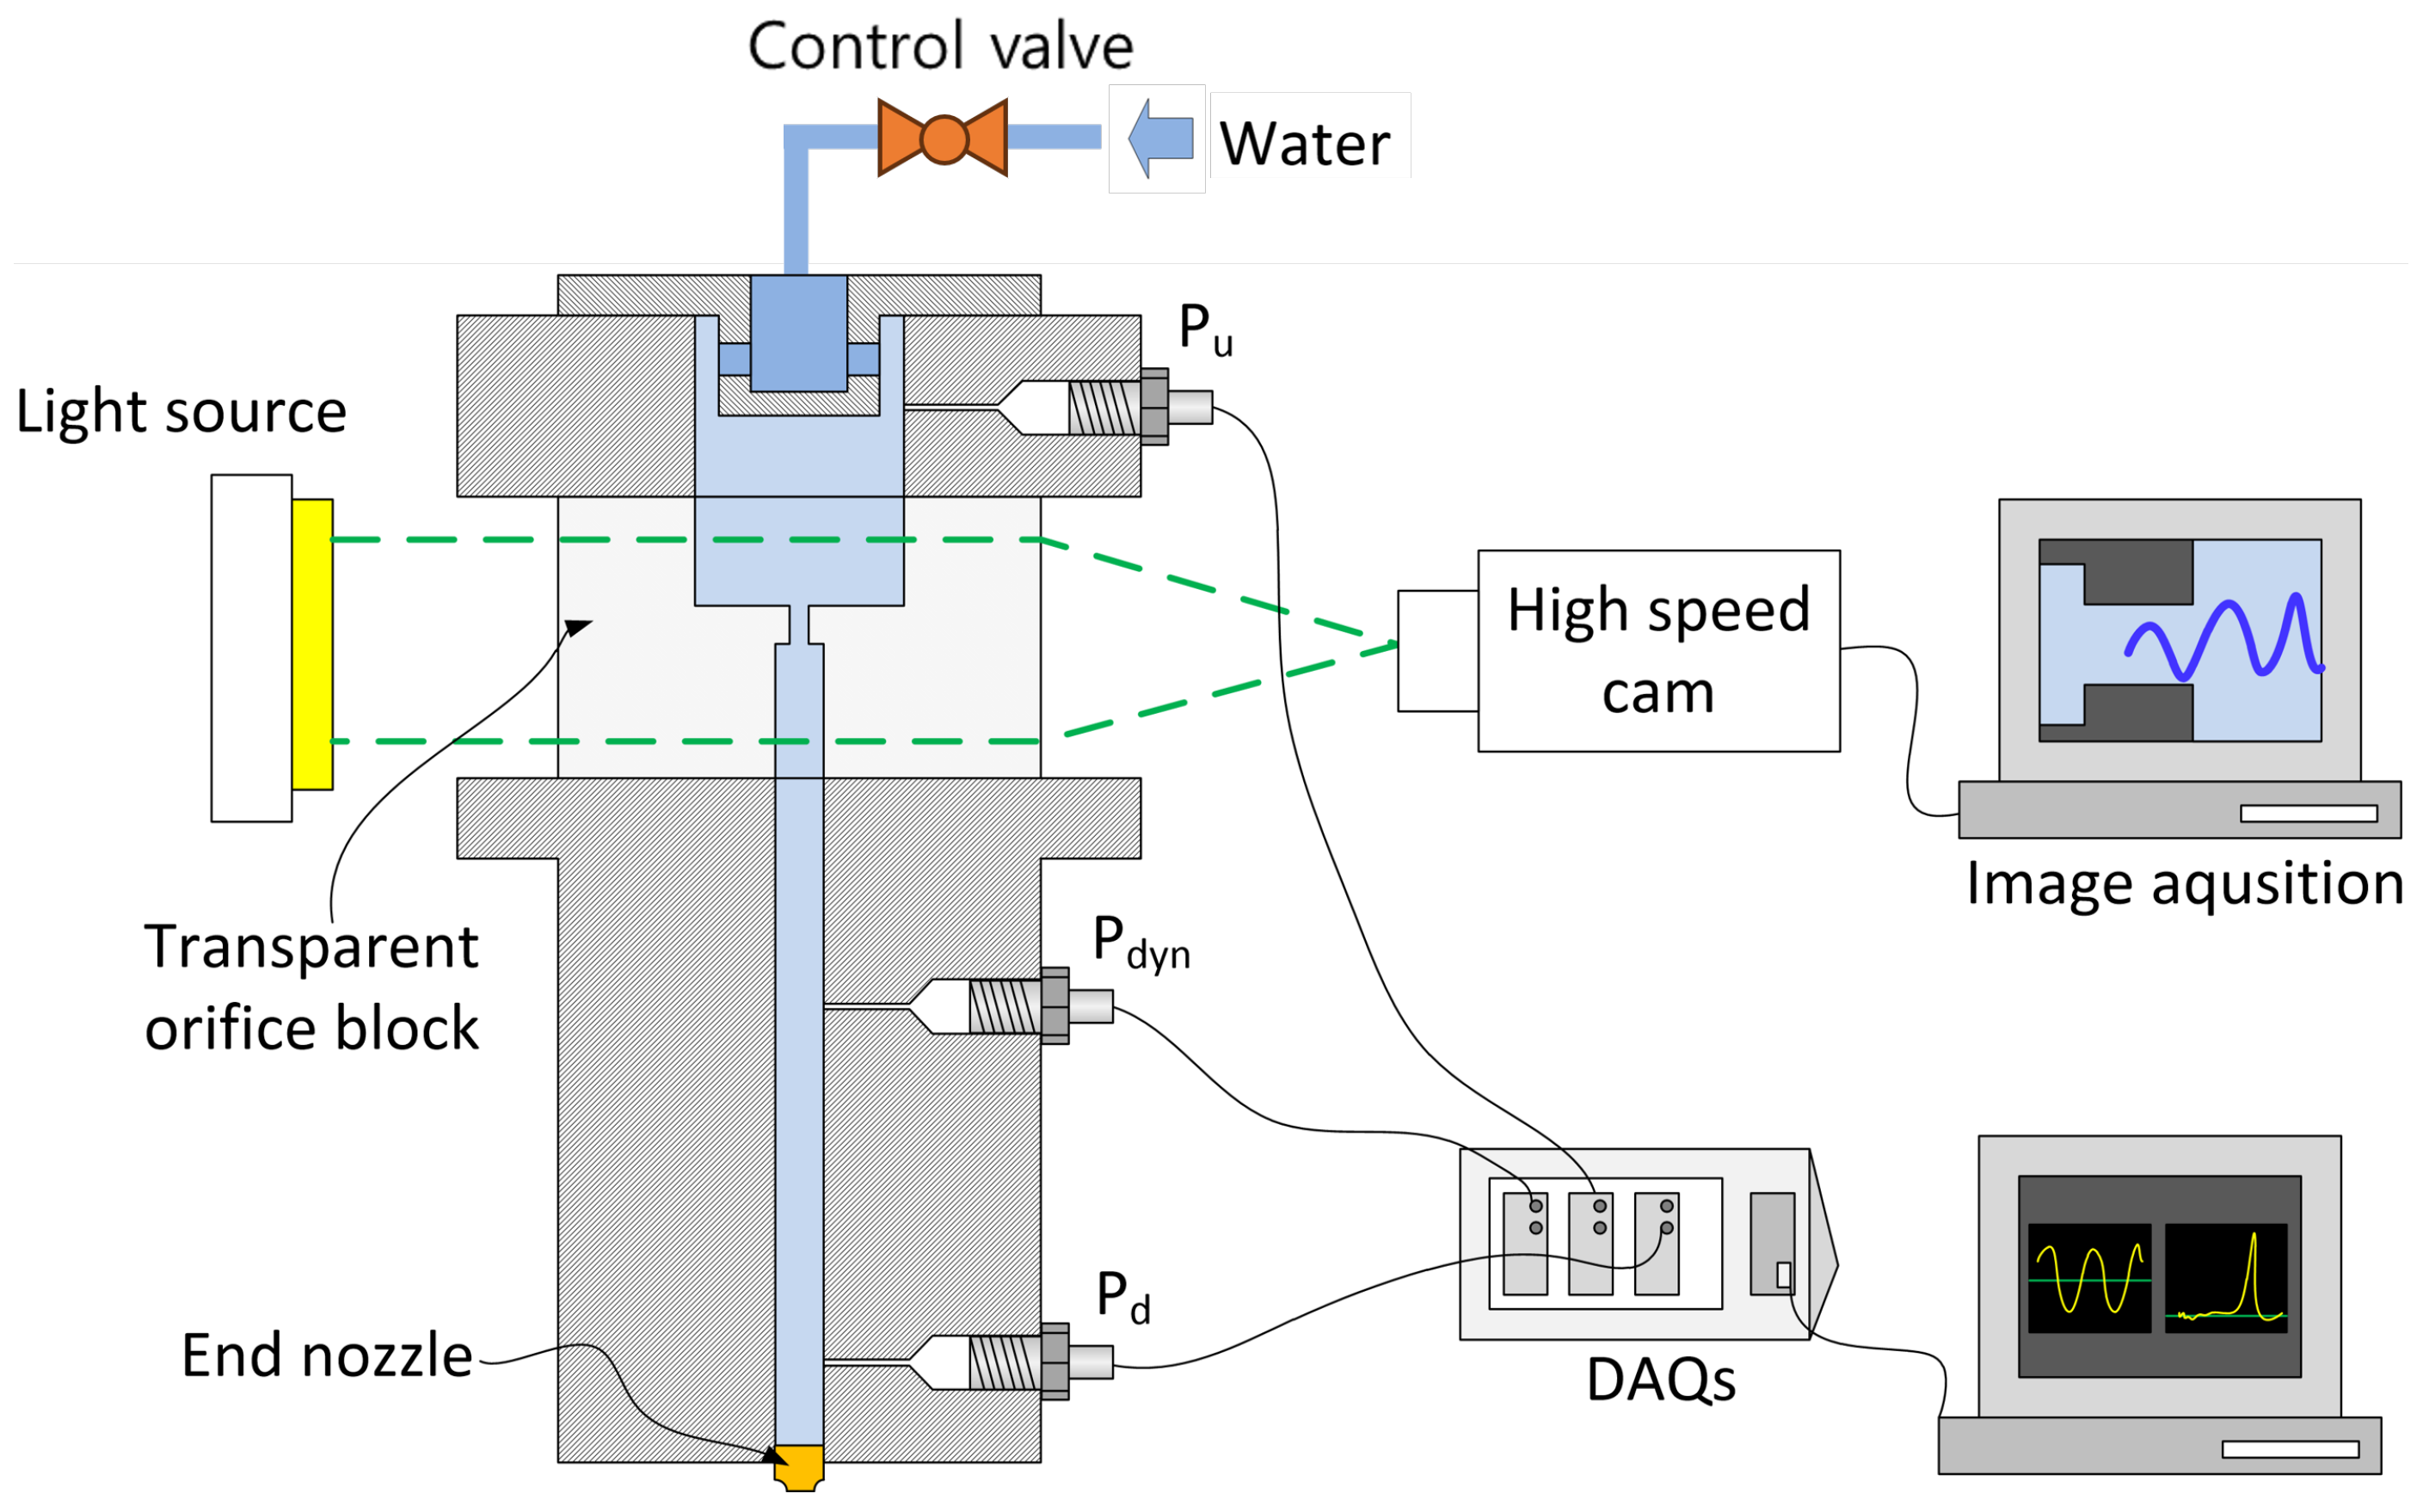
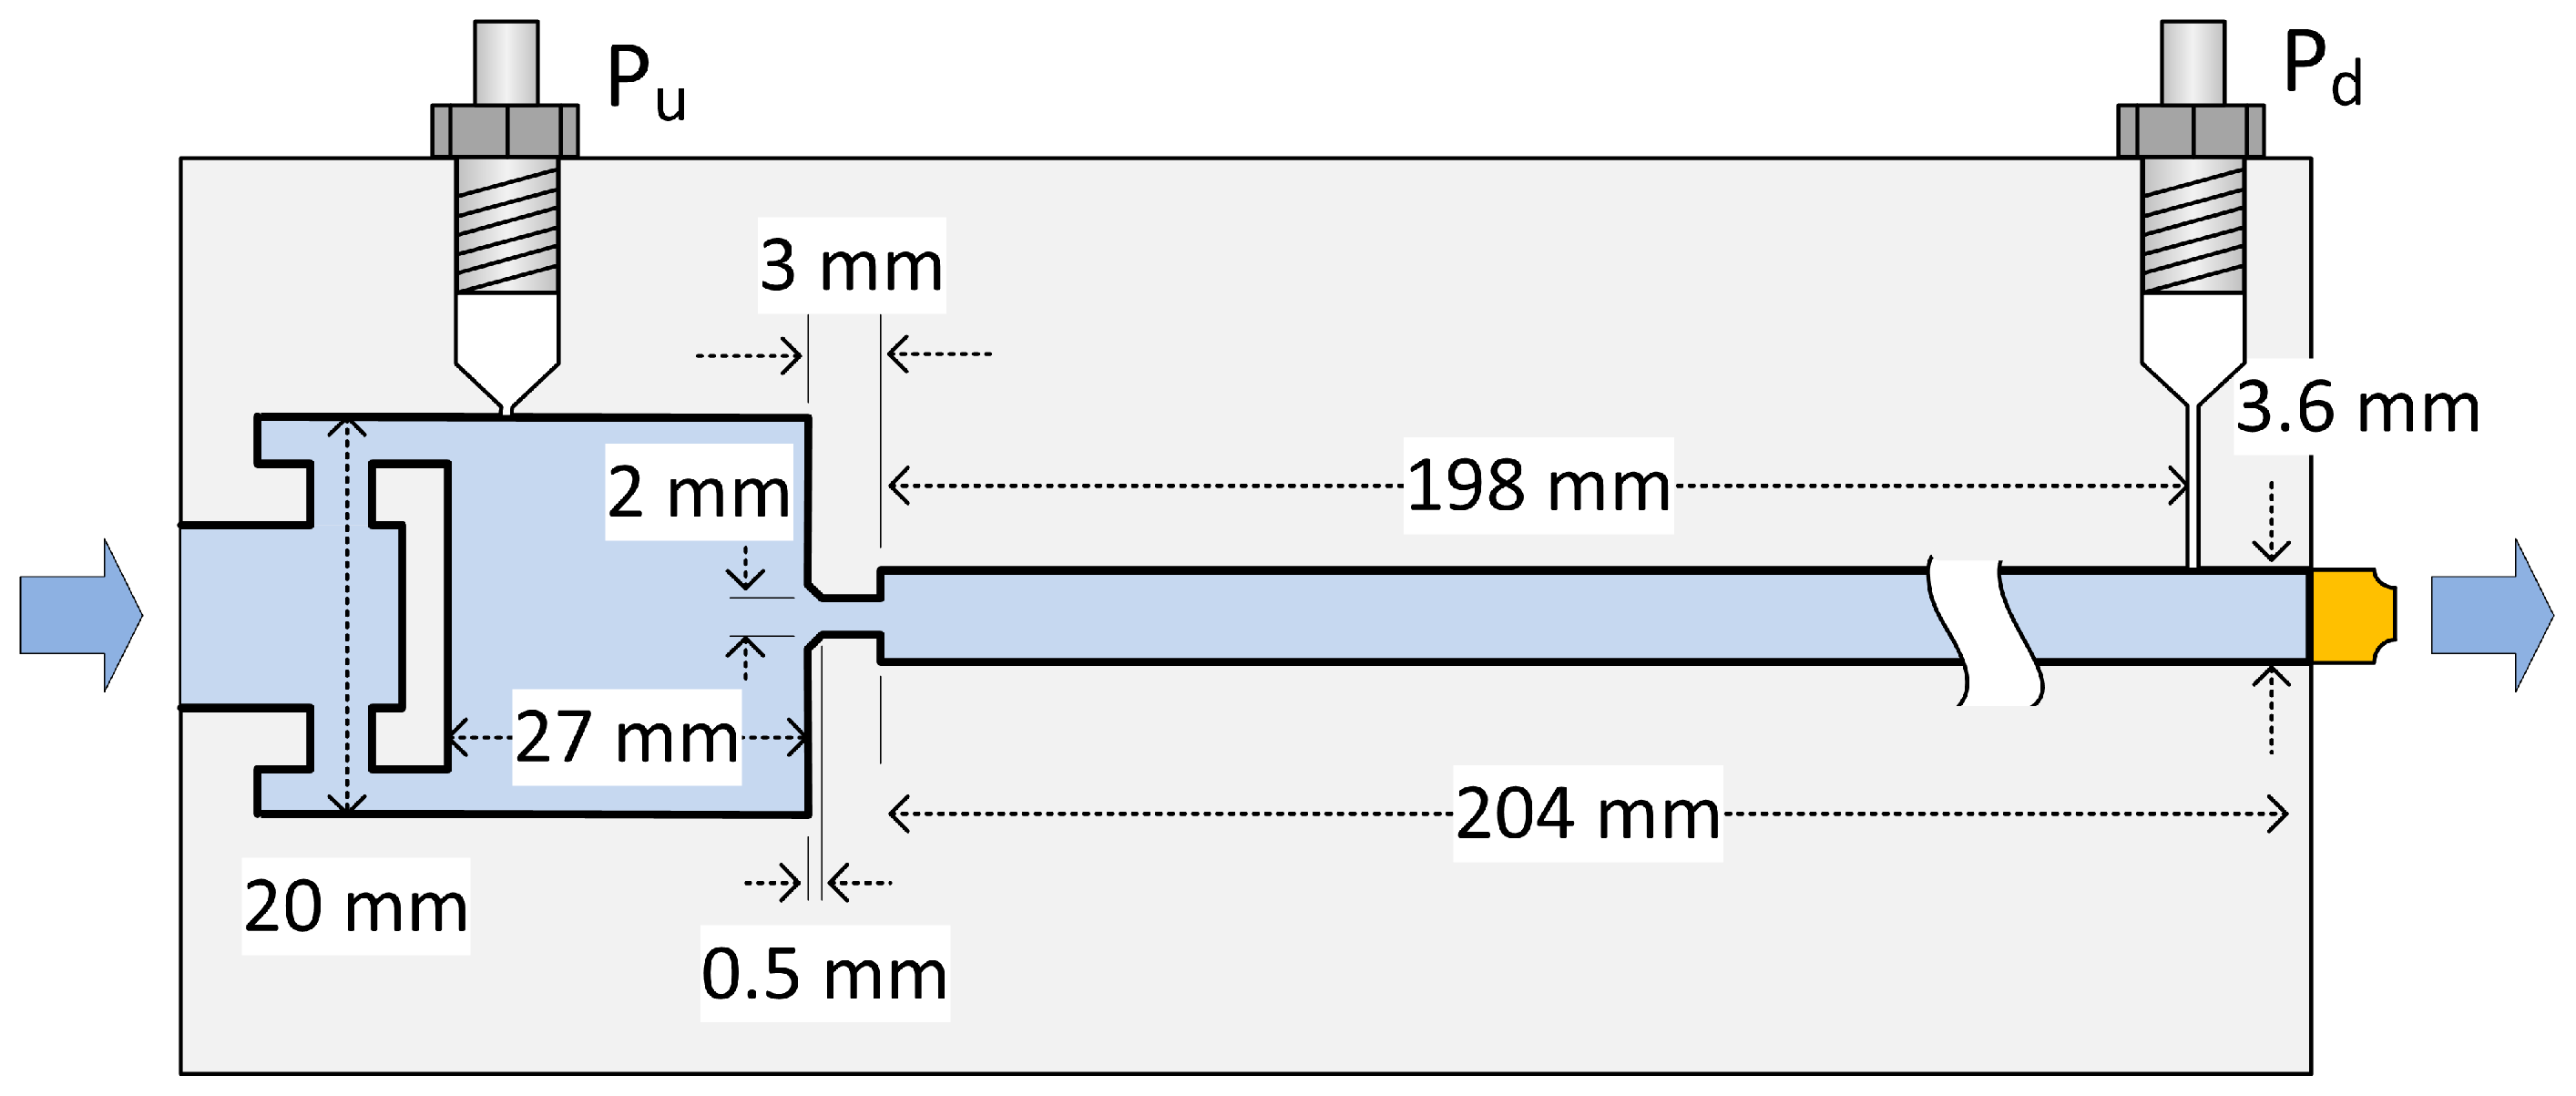
2.1. Experimental Setup

The experimental setup principally comprises four parts: the upstream valve, the manifold, the transparent orifice part, and the extended downstream module, as illustrated in Figure 1. Water, serving as the working fluid, was not specially treated to remove dissolved gases. The flow was controlled by a manual ball valve located upstream of the test module at a sufficient distance to avoid disturbances from the valve, which was smoothly adjusted to induce hysteresis. At the inlet section of the module, water flows through four radial holes to mitigate the pressure and mass flow fluctuation of inflow on the orifice flow. The transparent block, fabricated from polymethyl methacrylate (PMMA), is designed to capture the cavitation flow within the orifice; its dimensions are 40 × 40 mm. The orifice has a diameter of 2.0 mm, and a 45-degree chamfer with a depth of 0.5 mm was applied at the orifice entrance, as illustrated in Figure 2. This orifice design was inspired by the LOX injector used in rocket engine combustion chamber experiments [18]. An additional nozzle with a hydraulic diameter of 3.5 mm, closely matching the 3.6 mm tube diameter, is installed at the downstream module’s end. Static pressures upstream ( P u ) and downstream ( P d ) were measured using ’Kistler static pressure sensors (PiezoSmart 4043, Winterthur, Switzerland), and the flow rate was gauged by a turbine flow meter from Badger Meter (Vision 2006 2F66, Milwaukee, WI, USA).
To visualize cavitation behavior, a backlight imaging technique coupled with a high-speed camera was used. A Photron UX100 camera (Tokyo, Japan), capturing at a frame rate of 40,000 fps and an exposure time of 1 μs, was used. The camera was manually triggered once the flow reached a steady state after the flow conditions were changed. A multi-array LED lamp with a diffuser, specified at 37.5 W, 4350 lm, and 6500 K, was used as the backlight source. The LED lamp directly illuminated the cavitation flow through the transparent orifice block.

2.2. Experimental Conditions

Cavitation characteristics were investigated in relation to the cavitation number, which is defined by the difference between the flow pressure and the vapor pressure ( P v ) of the working fluid. The definition of the cavitation number varies according to the study’s purpose. The definition based on the pressure difference divided by the kinetic energy of the orifice flow, as in Equation (1), has primarily been used for wake cavitation of hydrofoils and venturi-like channels. Here, P r e f is chosen as the upstream pressure [20] or free flow pressure [23]. Another definition, as shown in Equation (2), was used for valves [25] and orifices [26]. In this study, the latter definition is adopted because the velocity in the orifice is not clearly defined due to the bubbly flow. P v = 2.34  kPa for water at 293 K was used, with the temperature measurement error impacting the cavitation number by less than ±1% within a ±5 K range. The detailed experimental conditions for the sheet cavitation regime are listed in Table 1, where d P represents the pressure drop across the orifice, m ˙ is the measured mass flow rate, R e is the Reynolds number in the orifice, and C d is the discharge coefficient. R e is defined using the bulk velocity, which is calculated from the measured mass flow rate, m ˙ . In this study, the pressure drop was mainly controlled by the upstream valve, and cavitation numbers and Reynolds numbers were calculated based on the measured pressures and mass flow rates.
K = P r e f P v 1 2 ρ V 2
K = P u P v P u P d
The initiation or inception of bubbly cavitation at K = 2.0 has been previously investigated by Son et al. [16], where the pressure drop was 1.0 bar, as illustrated in Figure 3. As the pressure drop increases, cavitation bubbles erupt downstream, as shown in Figure 4, potentially causing acoustic resonance along the downstream tube [16]. While cavitation is not expected when the cavitation number exceeds the inception cavitation number, in this case, K = 2.0 , a unique regime of metastable sheet cavitation was observed at higher cavitation numbers. This regime was induced solely by a hysteresis procedure when the pressure drop decreased after strong cavitation had already been initiated.

3. Results and Discussion

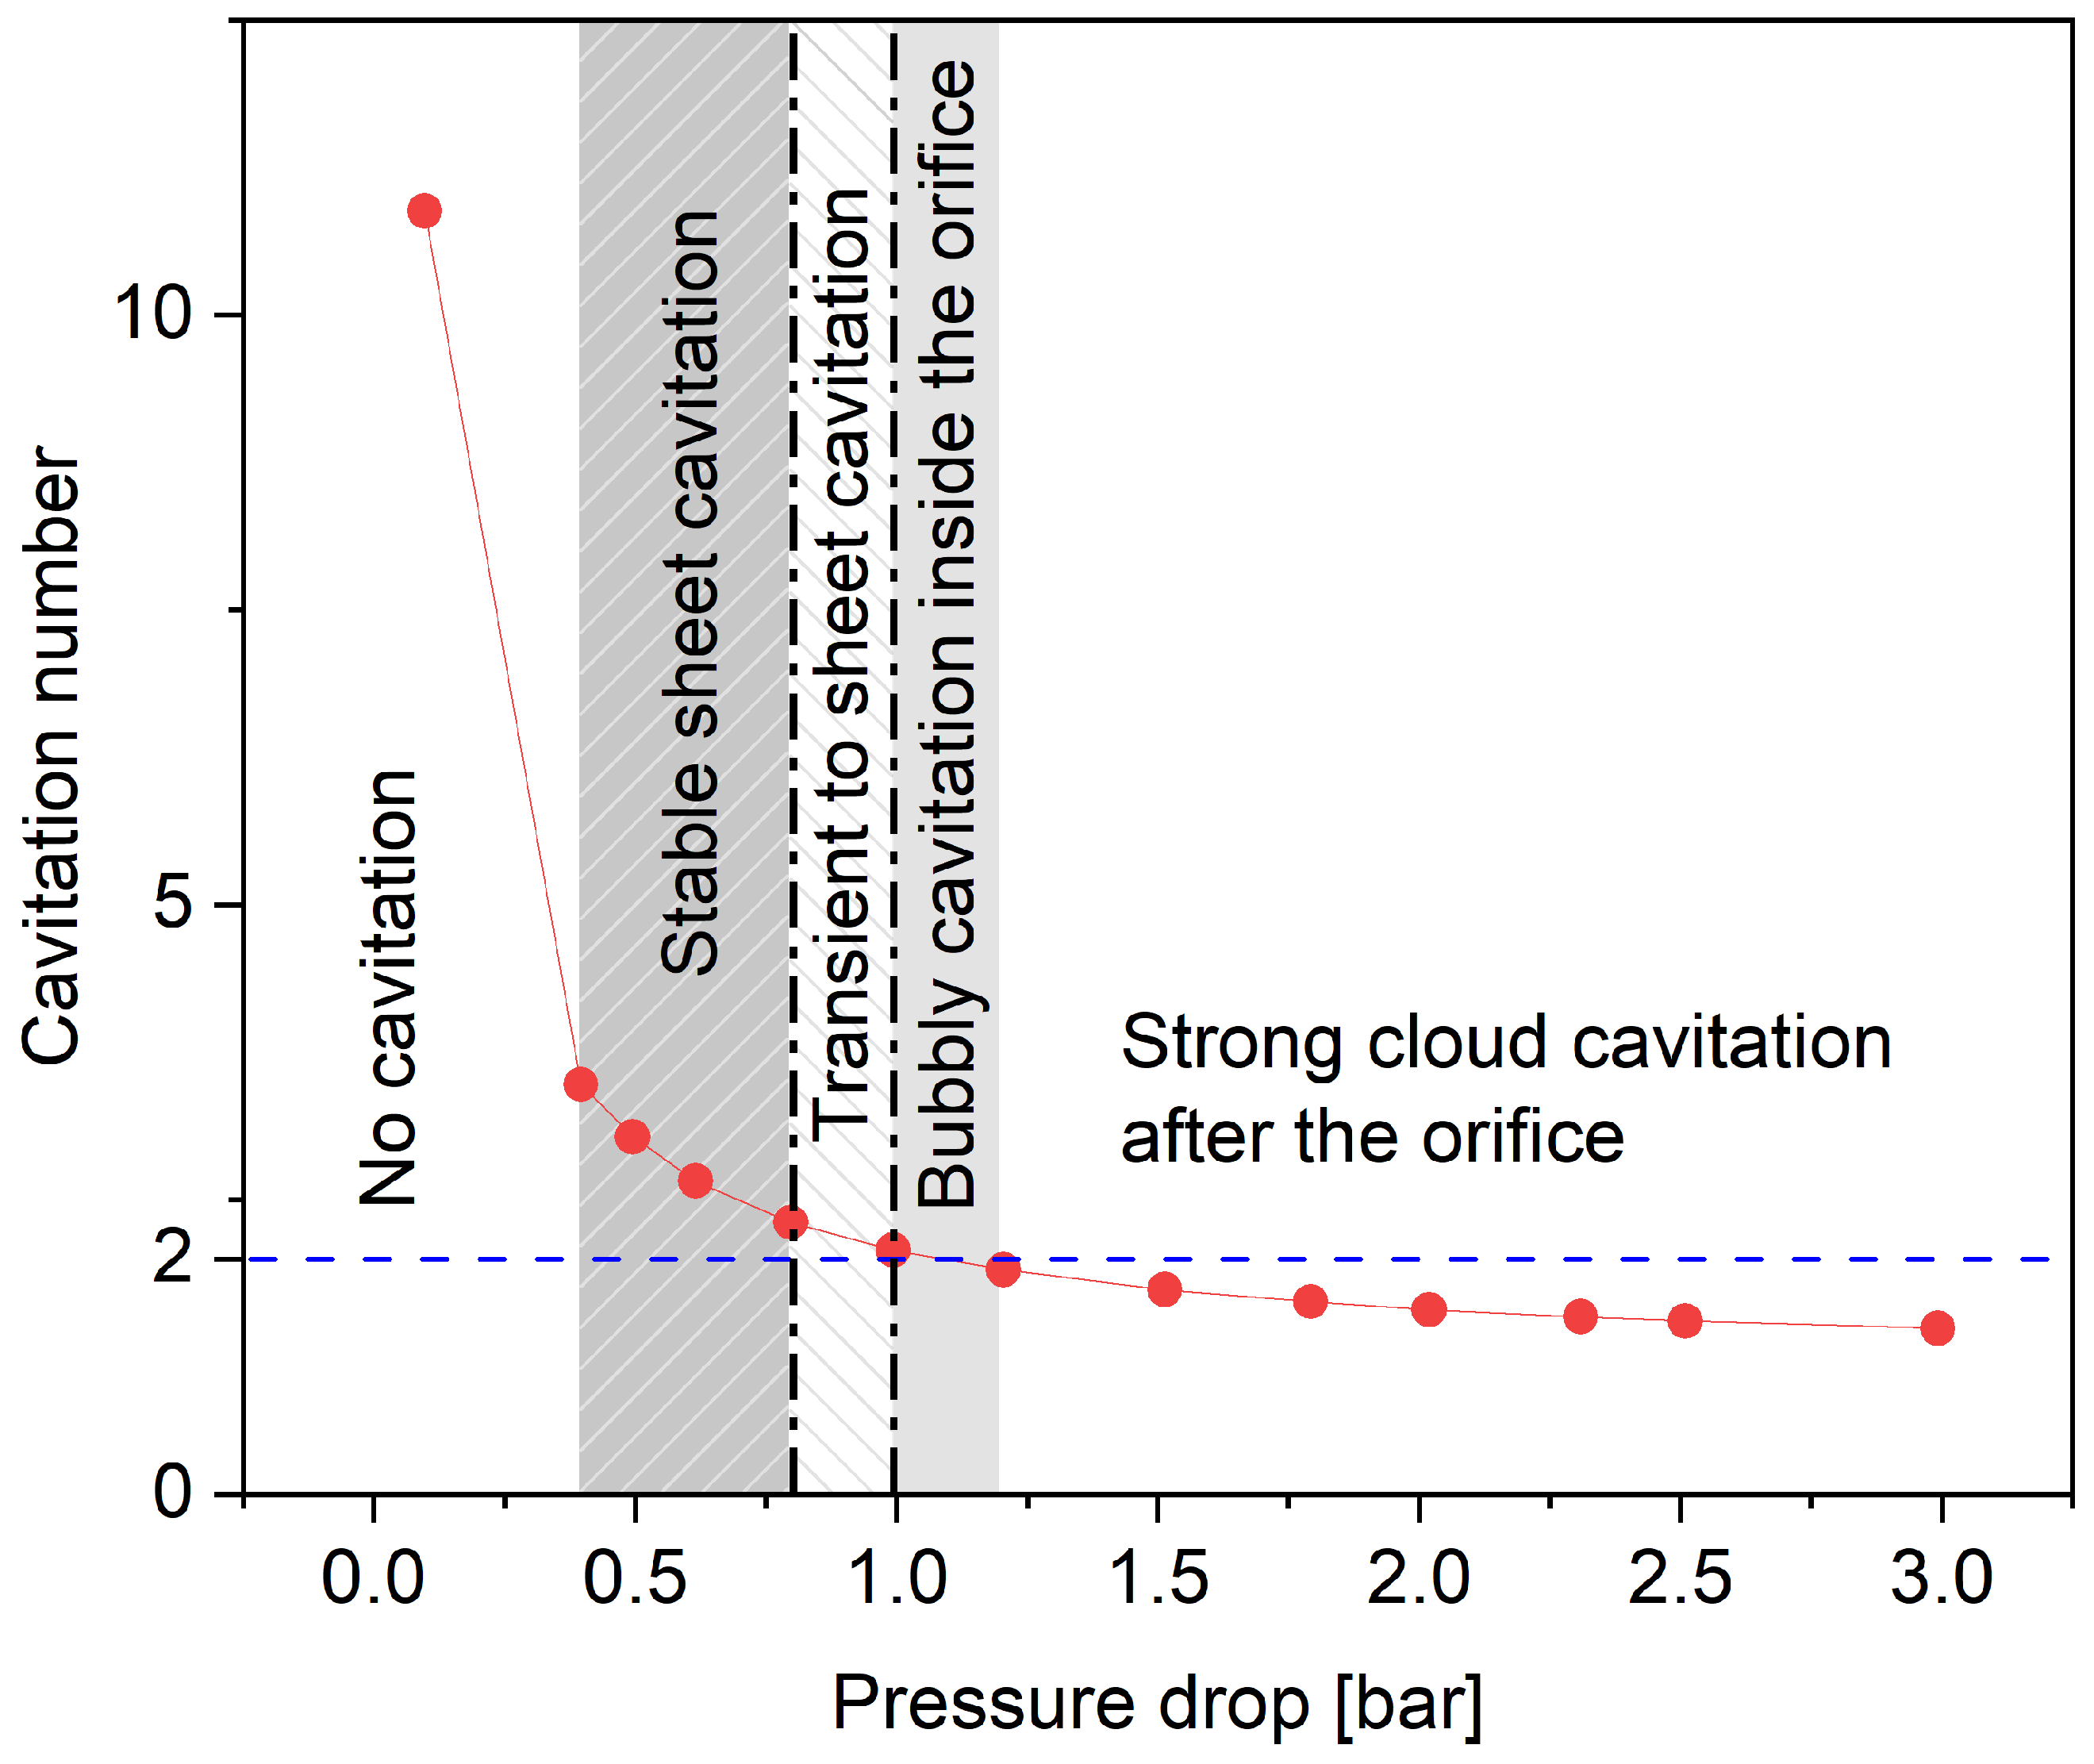
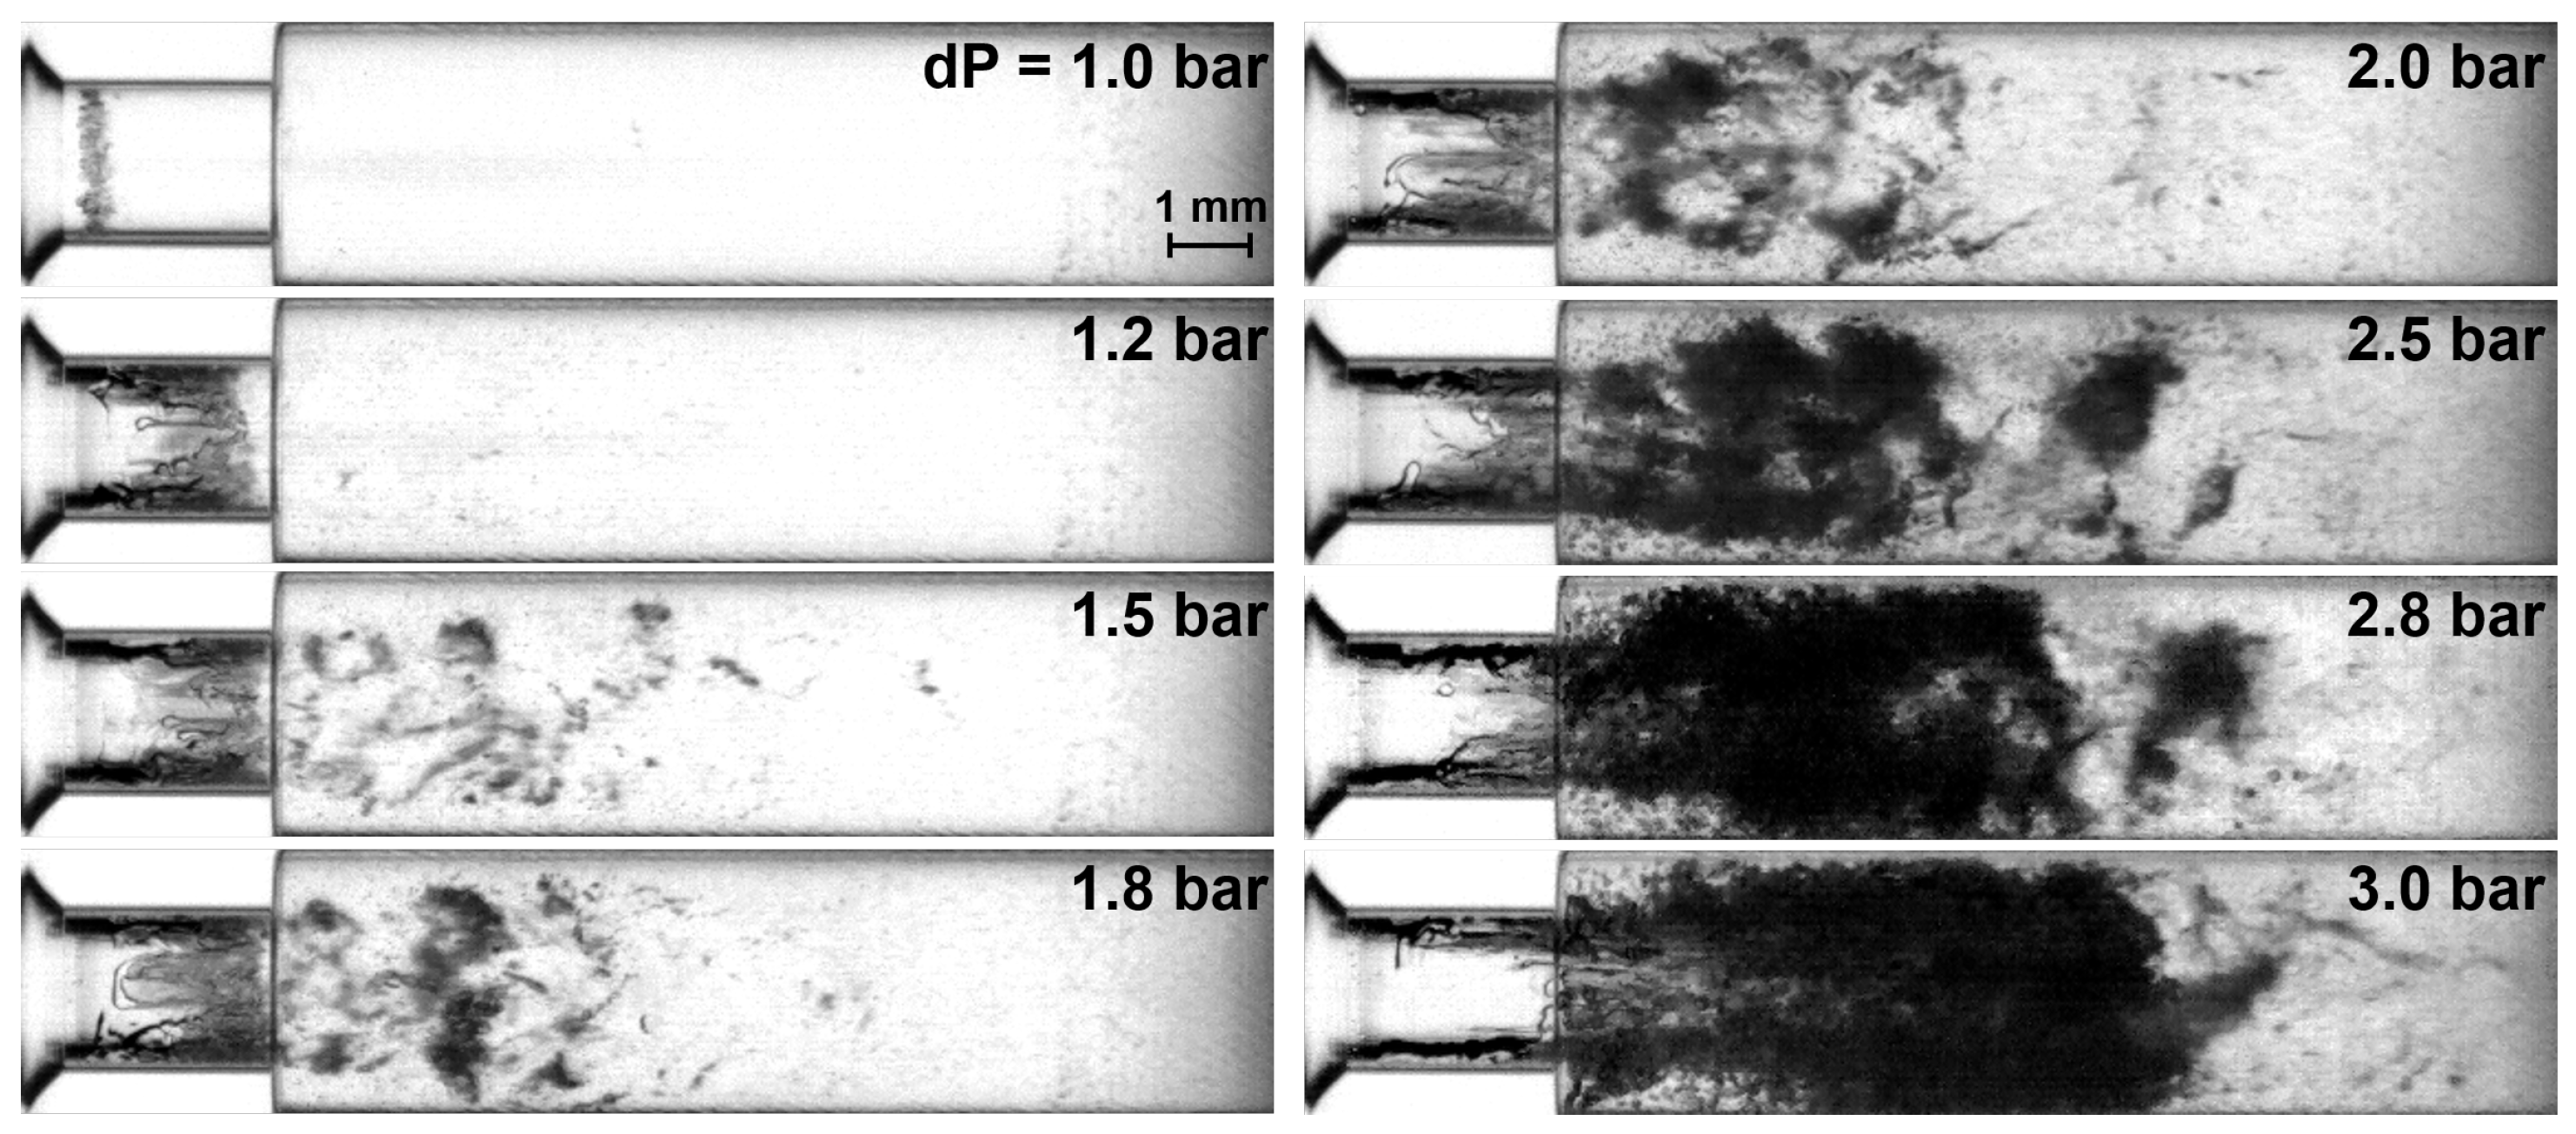
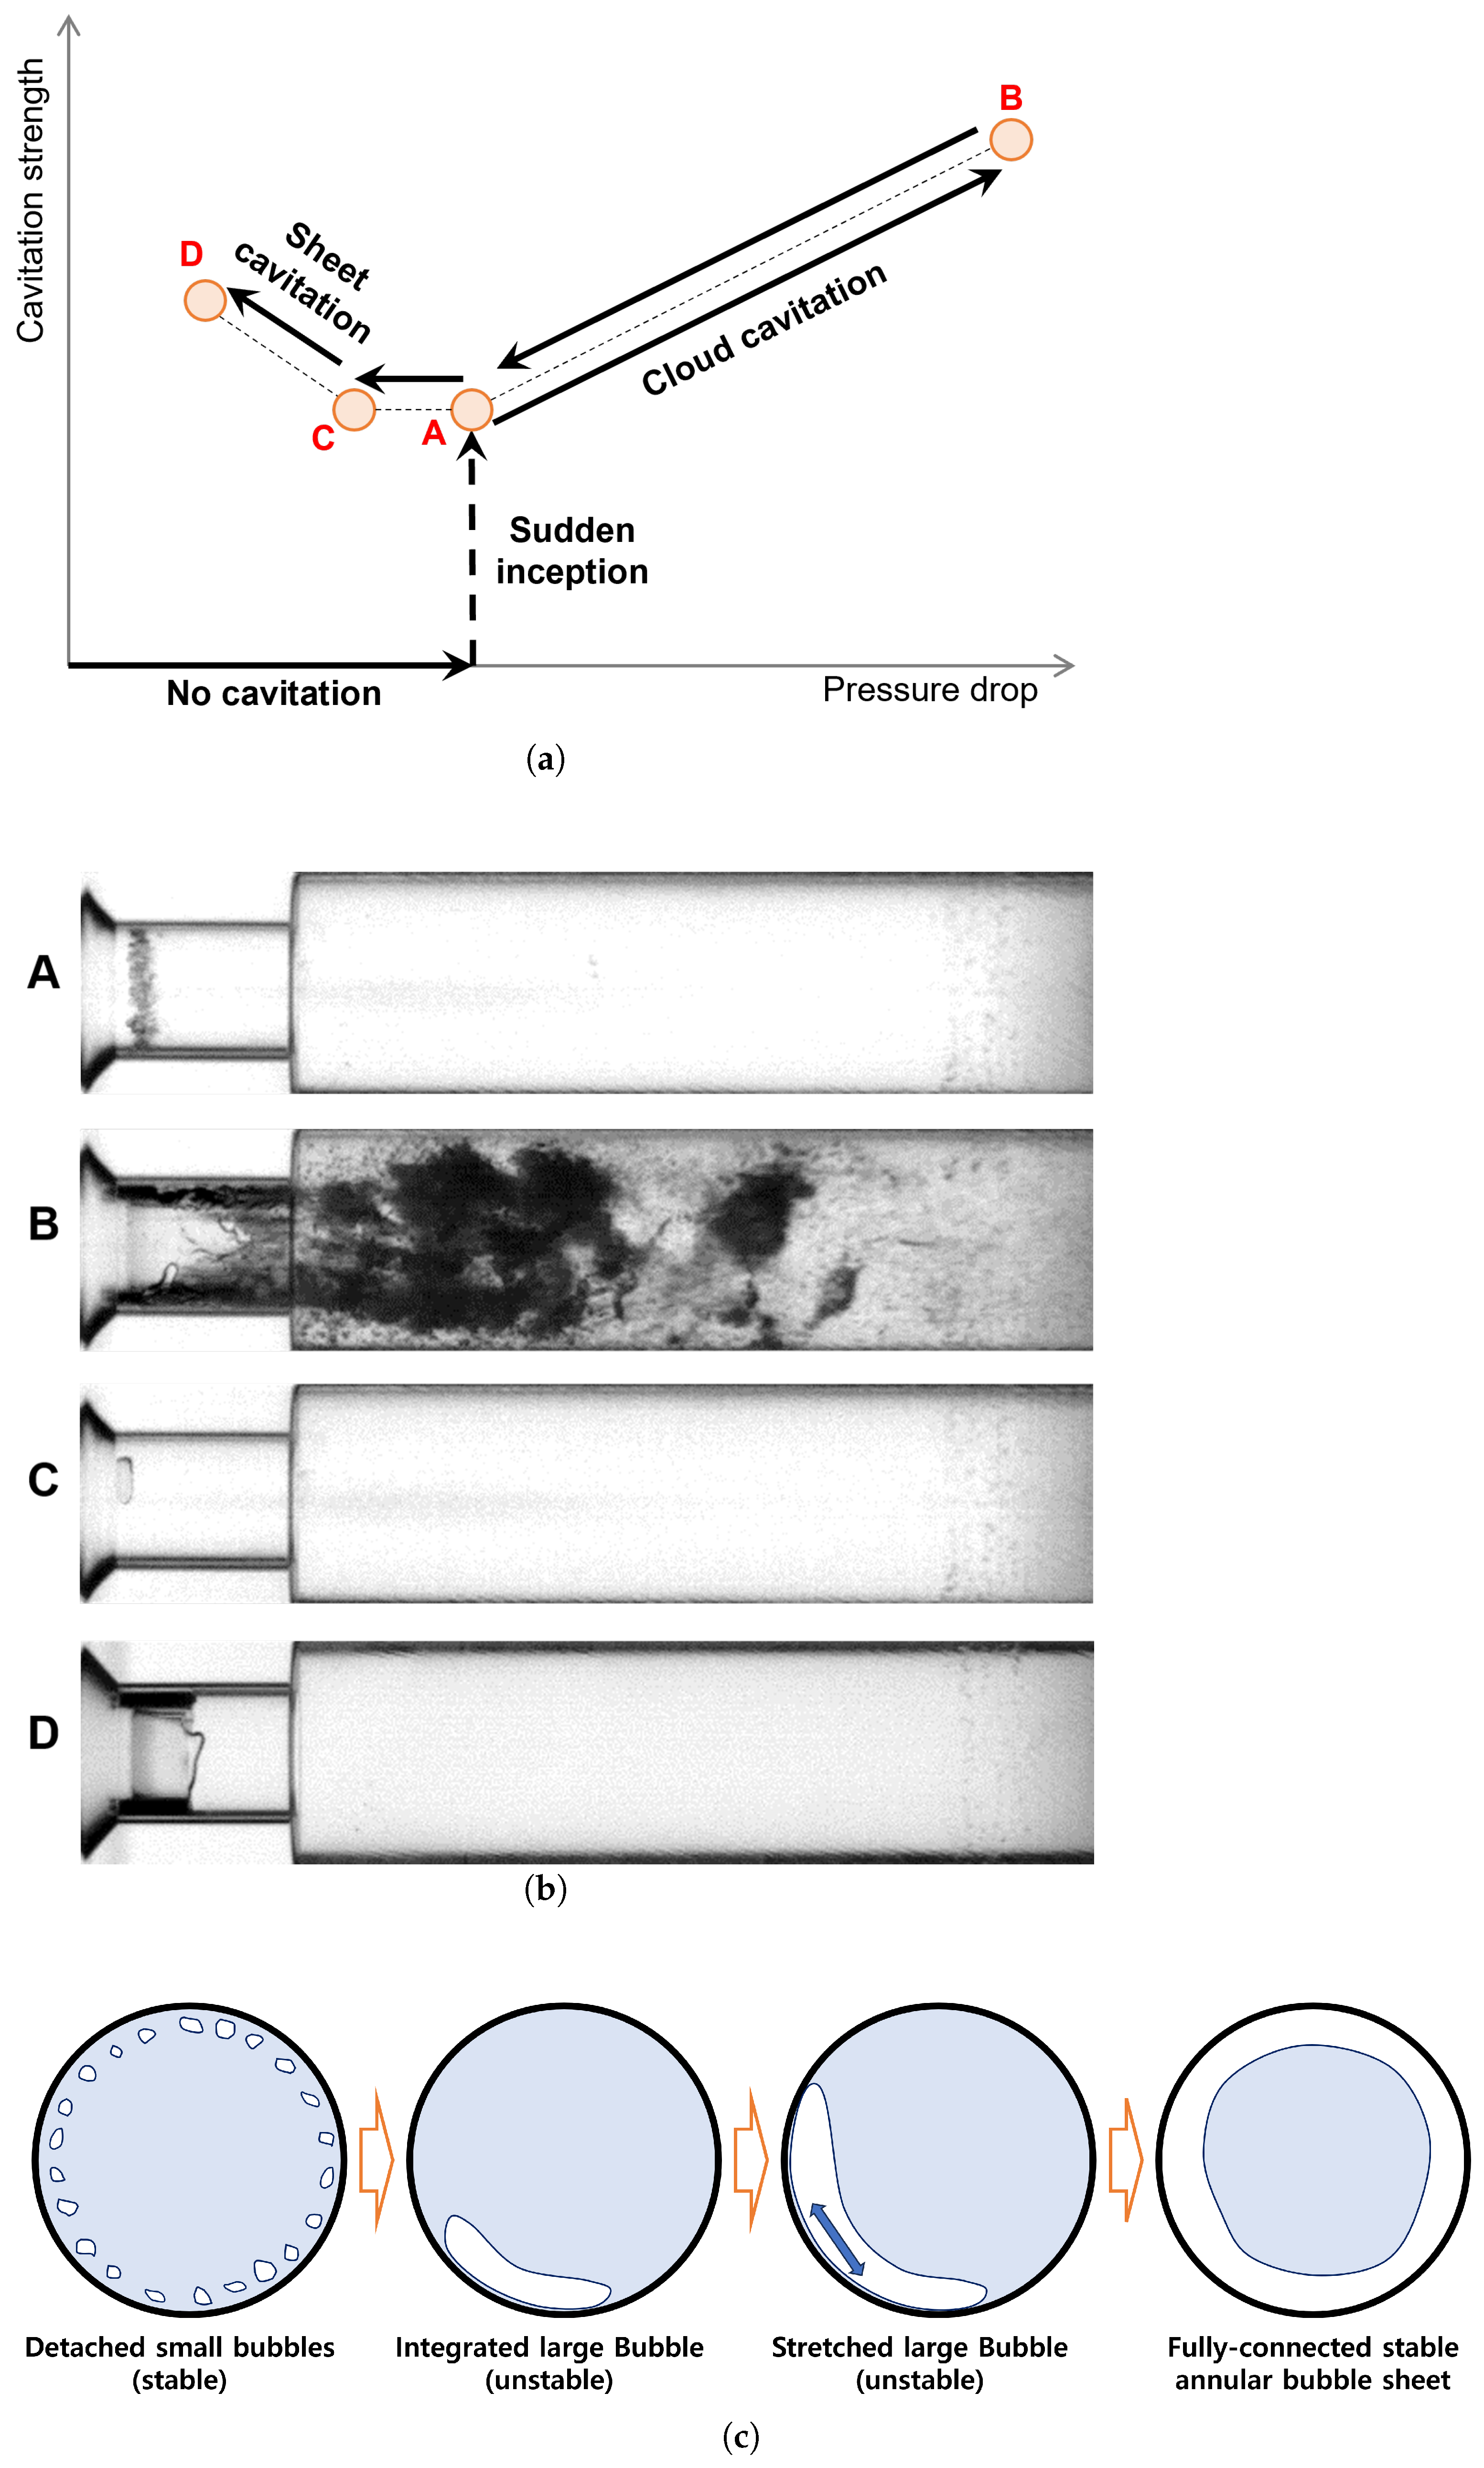
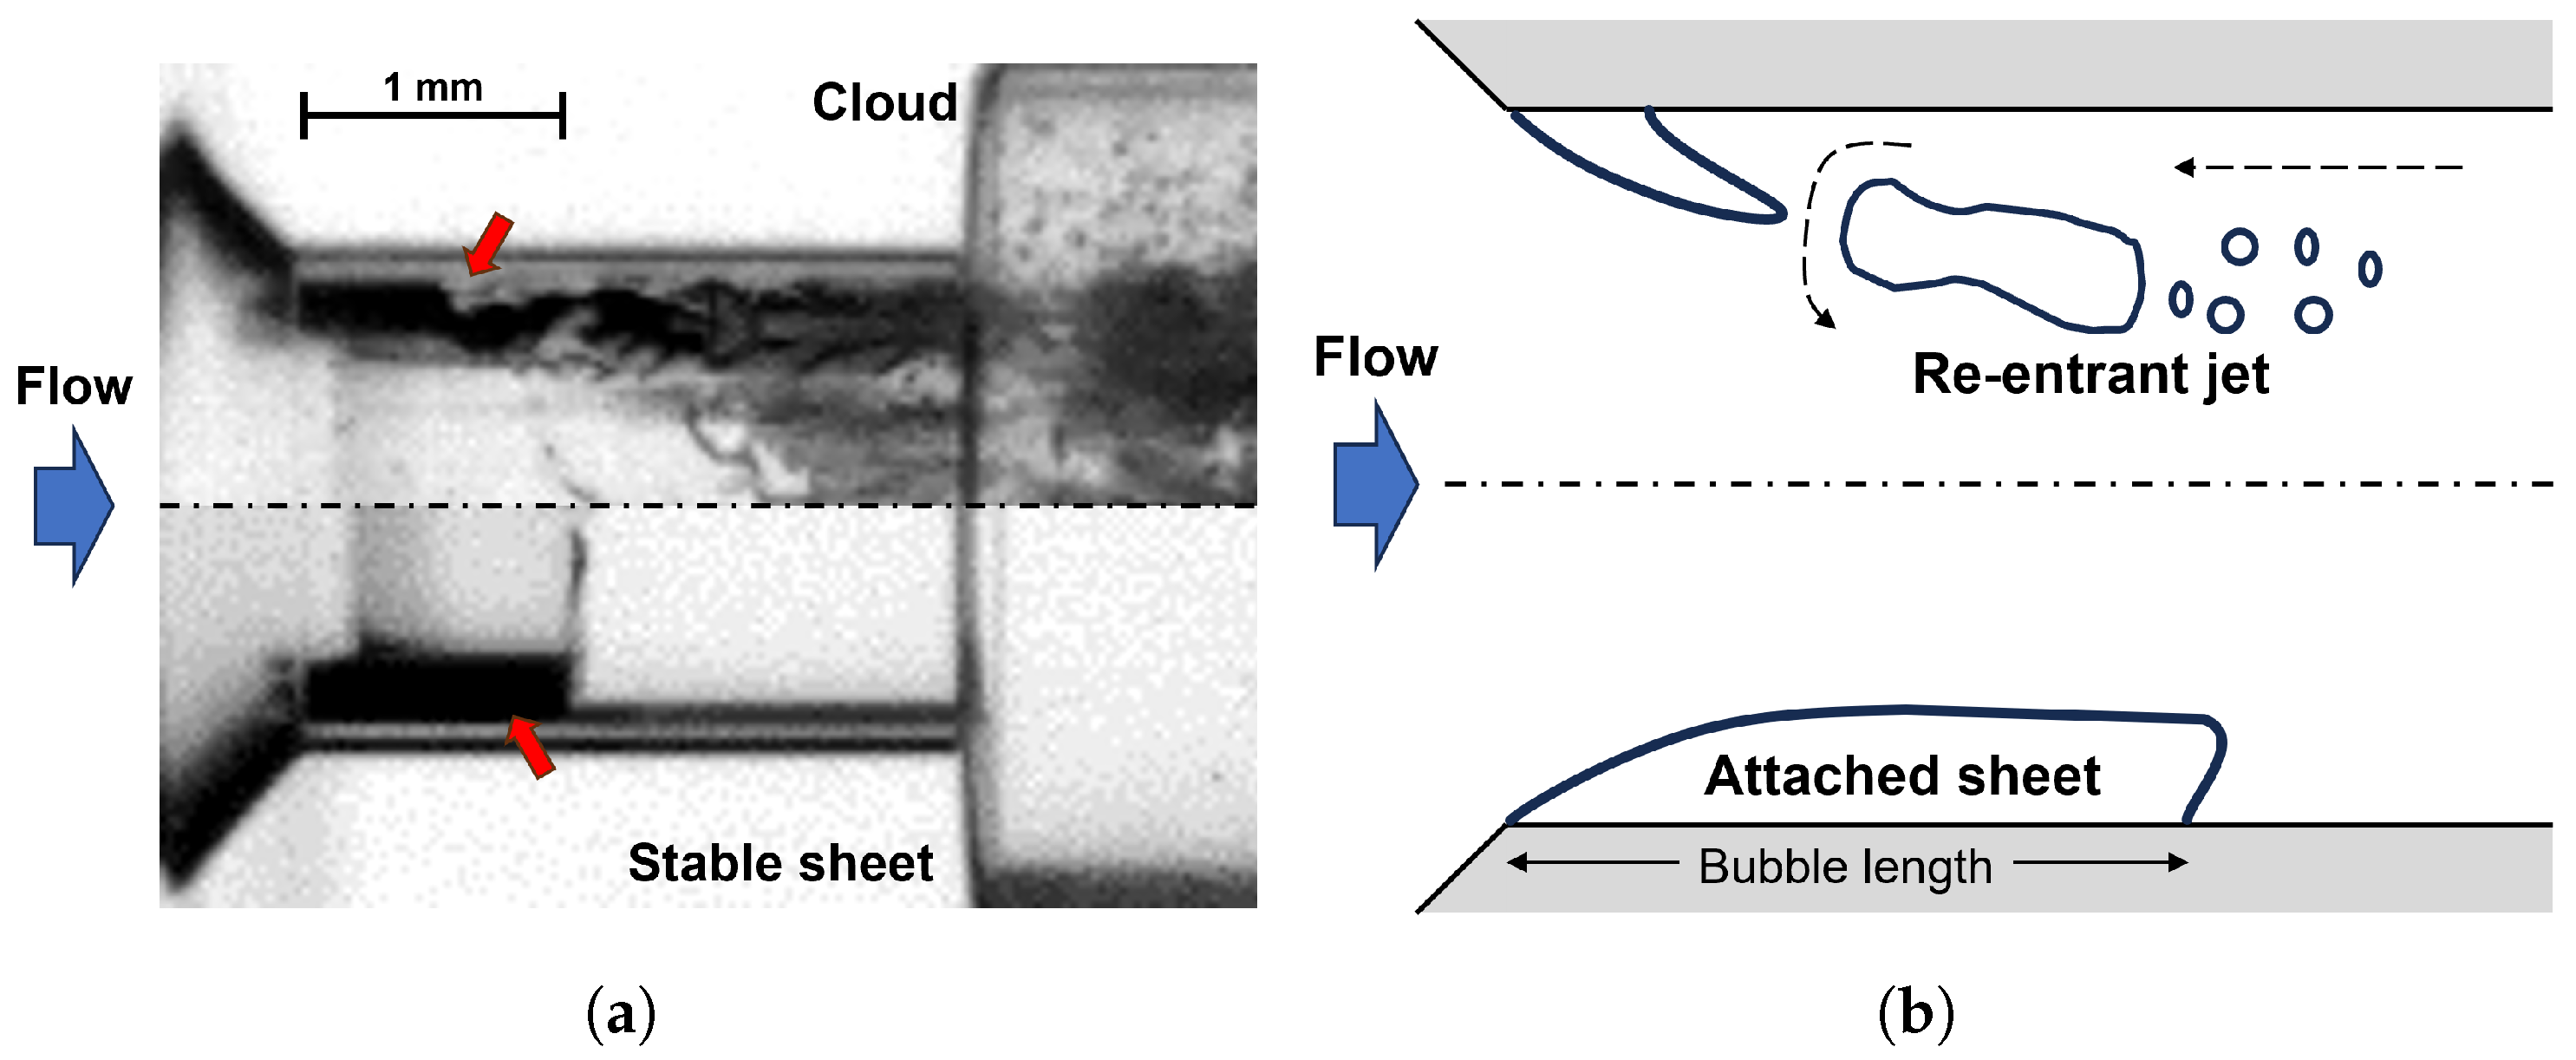
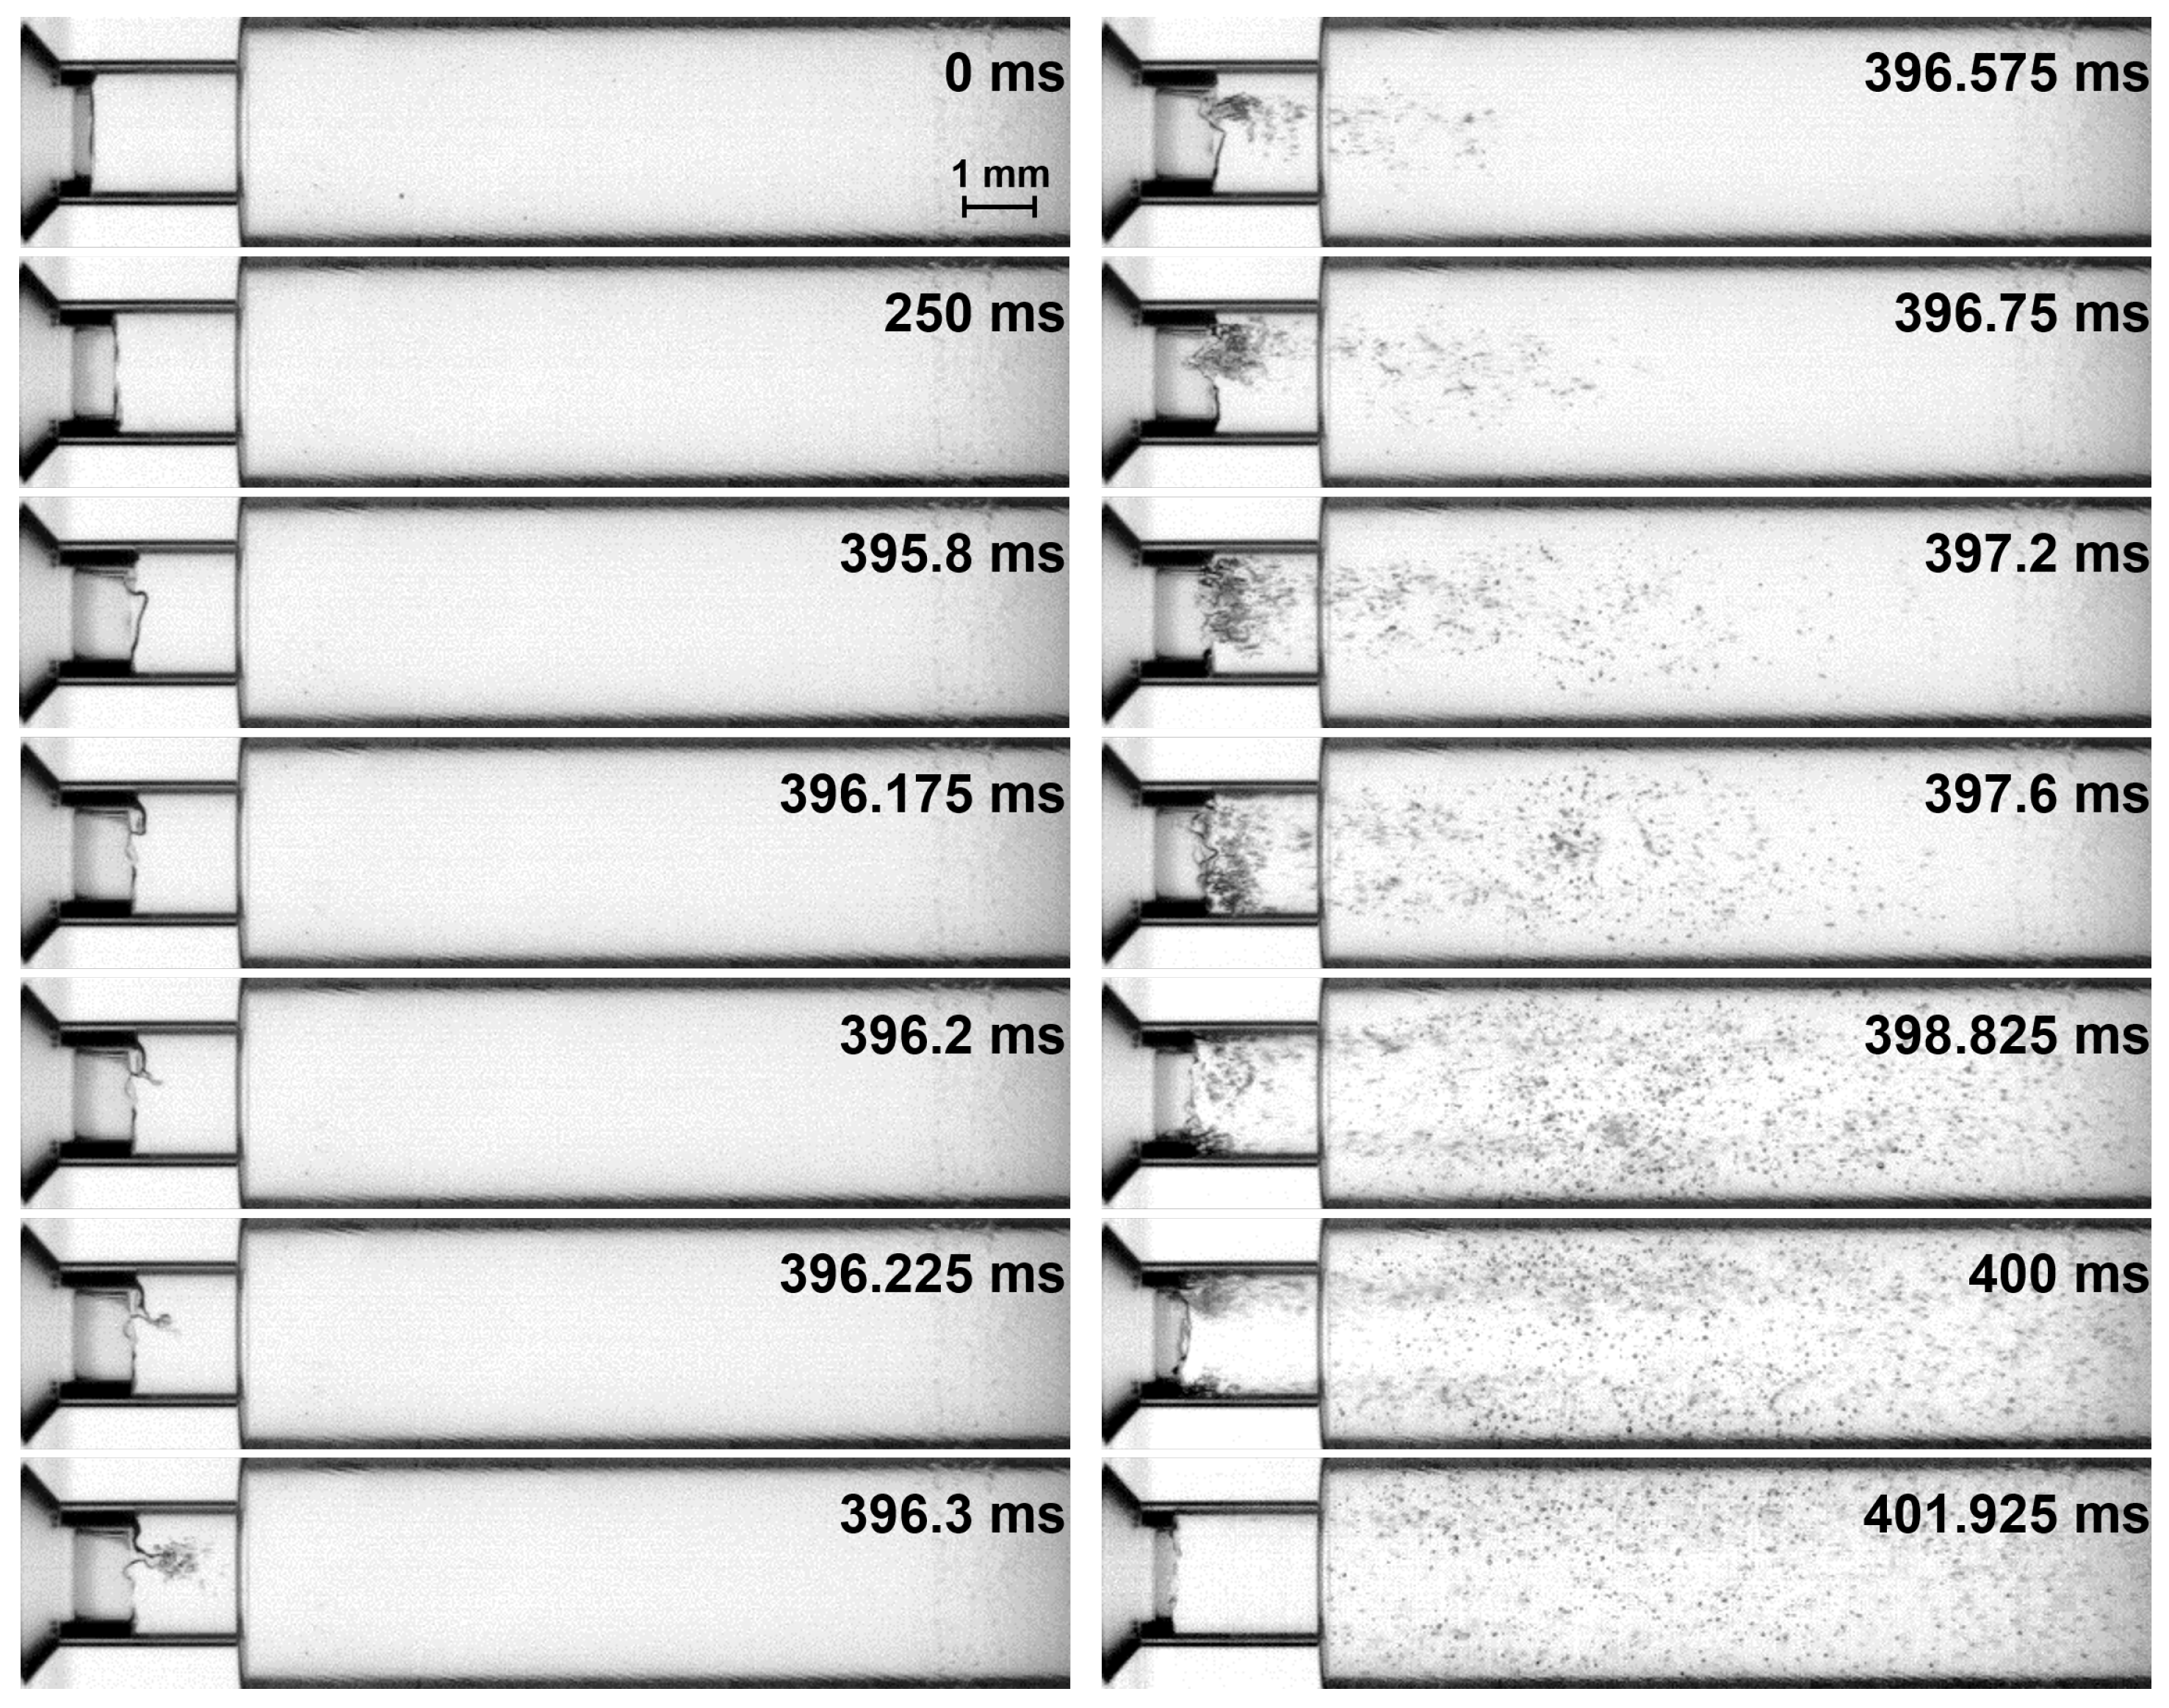
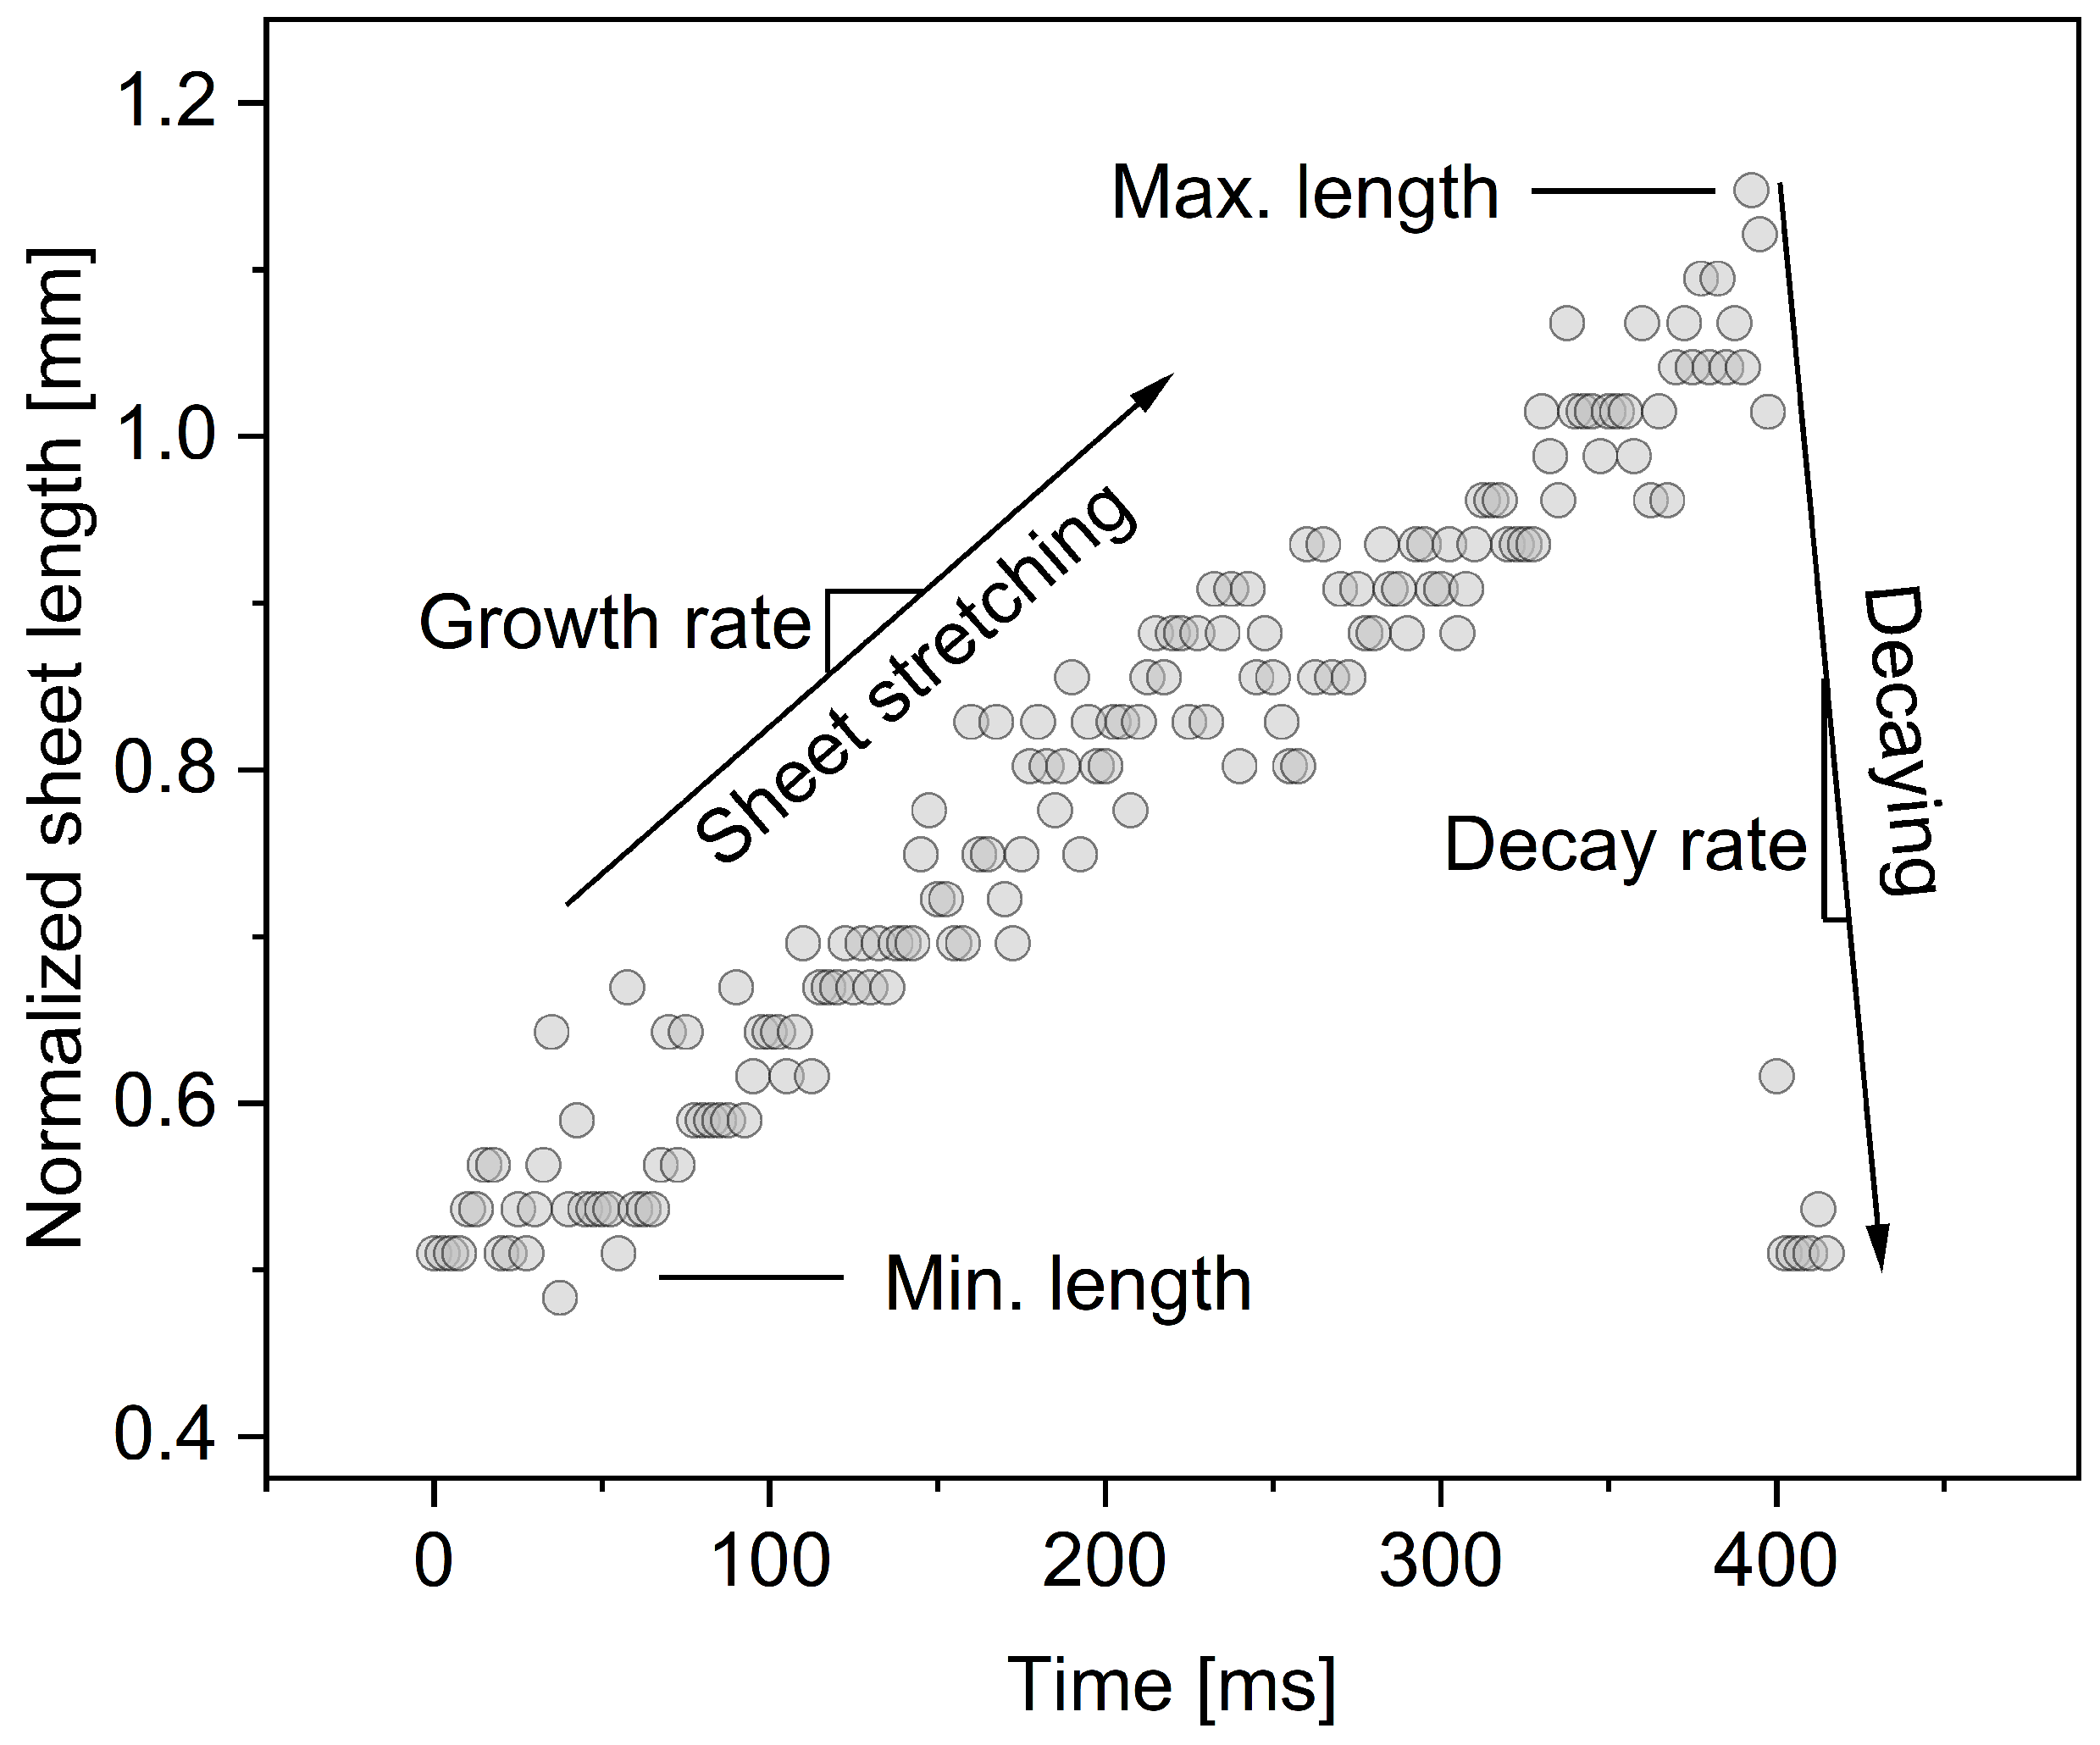
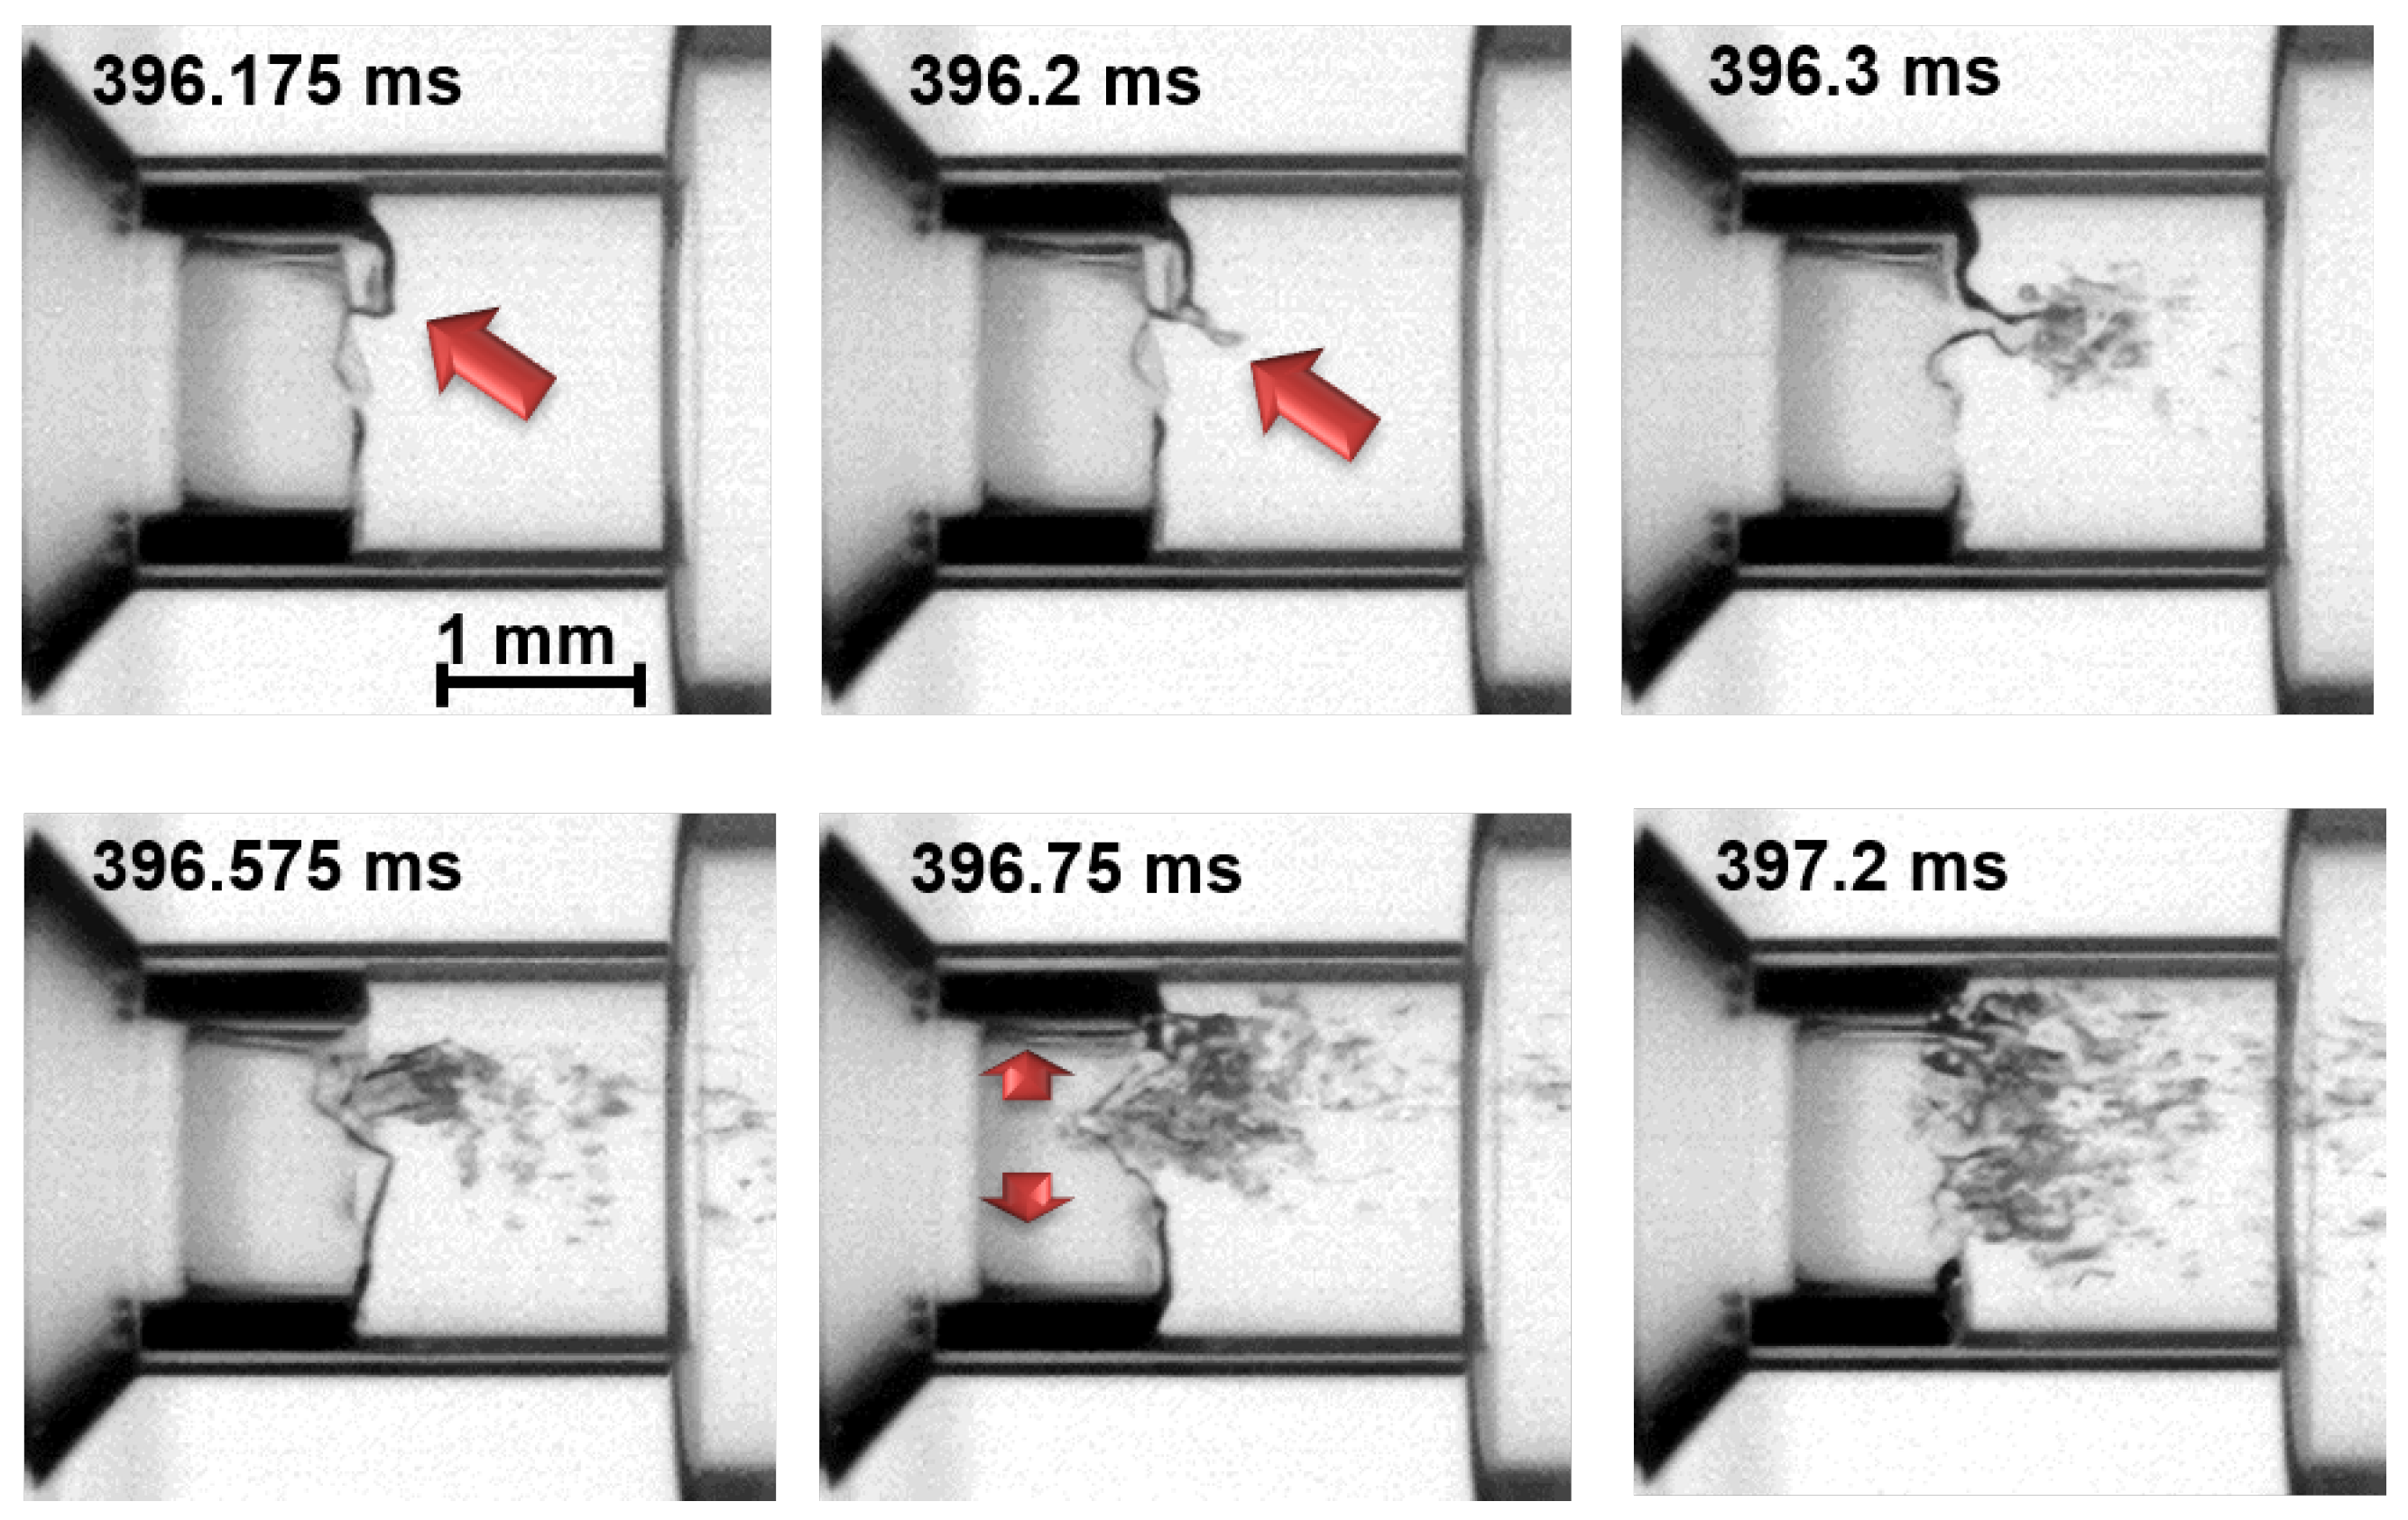
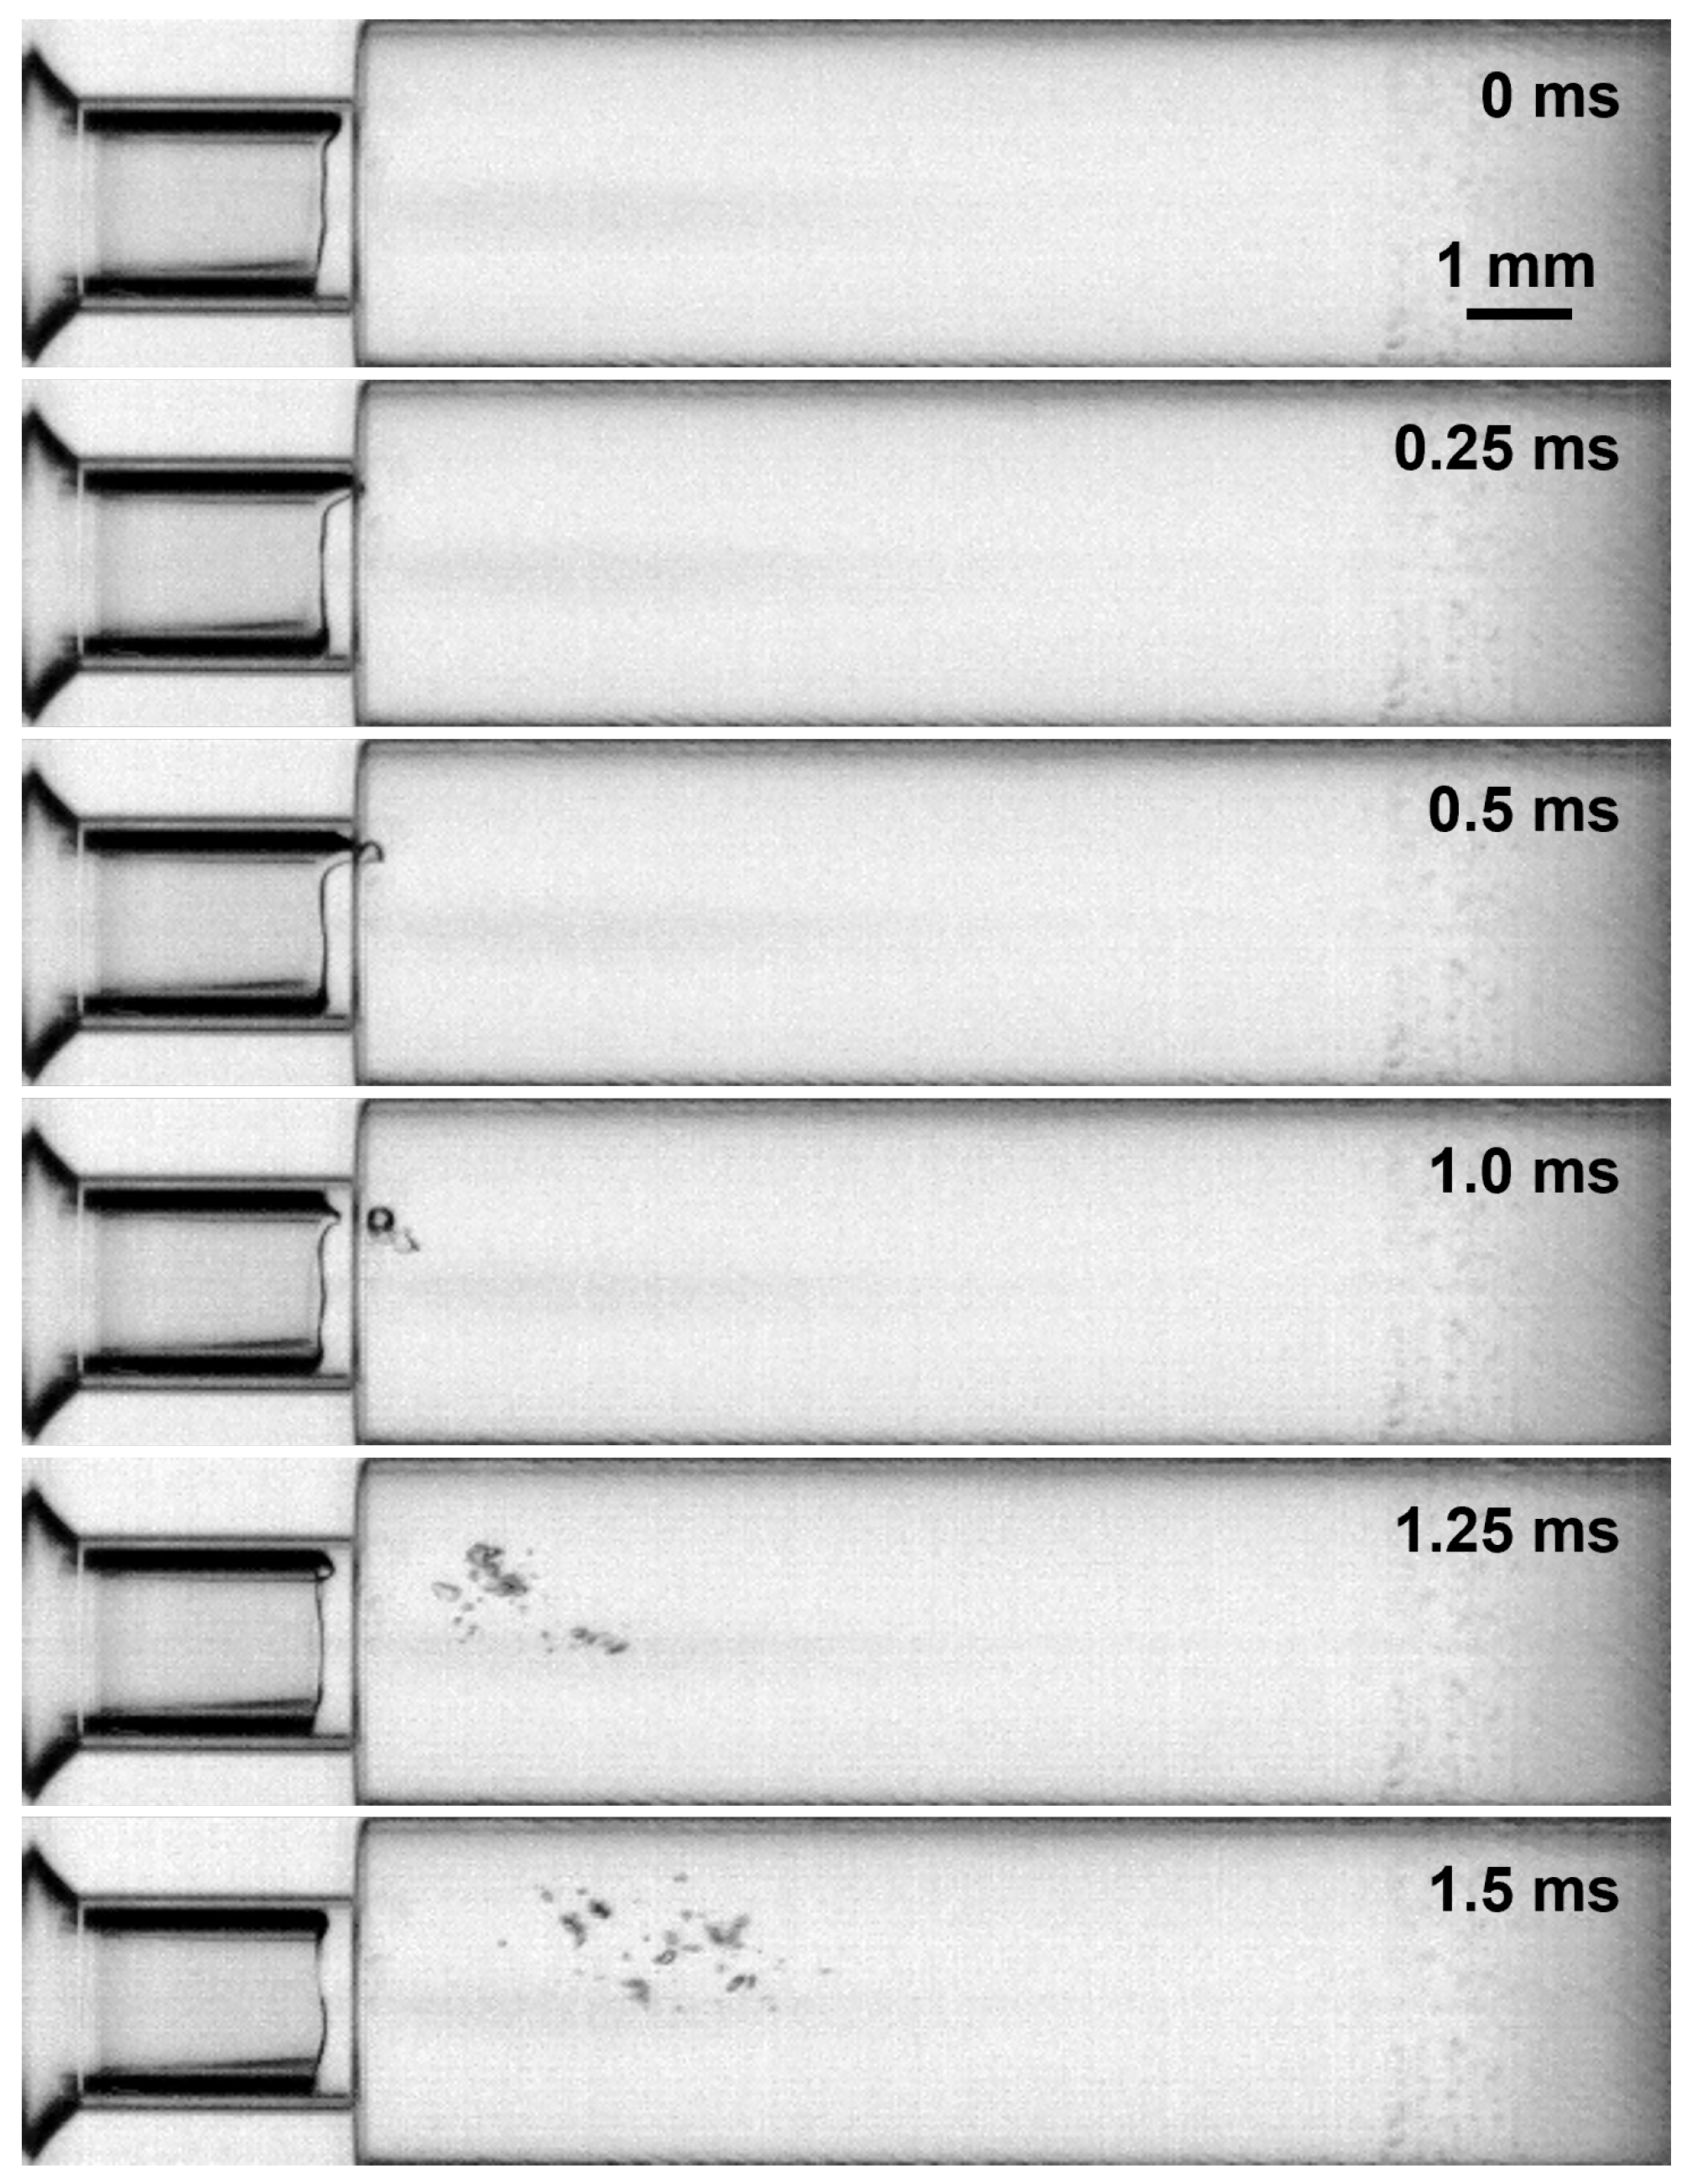
3.1. Onset and Decay Characteristics of Sheet Cavitation

Metastable sheet cavitation does not appear when the valve is initially opened and the pressure increases. Before the cavitation starts, the cavitation onset is solely controlled by the instantaneous pressure conditions without any memory effect. The onset process is illustrated in Figure 5a, with corresponding snapshots shown in Figure 5b. Initially, bubbly cavitation occurs suddenly at A when the pressure drop increases. In this study, the sudden inception point appears at d P = 1.0 bar [16]. Once cavitation with small bubbles is initiated, the bubble cloud transitions to B, generating strong cloud cavitation. Subsequently, when the pressure drop decreases back to A, closing the valve, the cloud cavitation reverts to small bubble cavitation at A again. The process between A and B is reversible and does not exhibit hysteresis. In this regime, the length of the bubble cloud is proportional to the pressure drop or the Reynolds number. Figure 6 clearly shows that the bubble length increases as the flow Reynolds number decreases, and the sheet almost reaches the orifice exit at d P = 1.0 bar.
When the valve is carefully and slowly closed, the pressure drop falls below the inception point of A ( d P = 1.0 bar in this study). In contrast to the cloud cavitation regime, this slow decrease in pressure allows the flow to retain the memory of bubble nucleation, thus introducing a hysteresis effect. As pressure drop and Reynolds number decrease further below the inception point, the small nucleated bubbles coalesce and grow into a larger bubble attached at the end of the chamfer, as shown in snapshot C in Figure 5b. Figure 5c illustrates this process. As the pressure drop continues to decrease, the integrated bubble expands in the circumferential direction, forming a uniform ring-shaped bubble sheet at approximately d P = 0.8 bar and R e = 3.22 × 10 4 . Here, the conservative forces, such as surface tension and reduced pressure gradients in the recirculation zone, stabilize the bubble sheet, maintaining its structure even below the original inception pressure. In this sheet cavitation regime, the bubble sheet length increases with decreasing pressure drop at point C, in contrast to the cloud cavitation regime. The transition from A to D does not occur before the initial cavitation inception and is induced only by this hysteresis-driven onset process, where the prior state of bubble nucleation controls the subsequent cavitation regimes. A detailed discussion of these mechanisms is presented in Section 3.2.
Sheet cavitation presents different attachment characteristics compared to cloud cavitation. Observing bubble traces near the orifice wall, as indicated by the red arrows in Figure 7a, shows a clear detachment point in cloud cavitation, while in sheet cavitation, the bubble sheet remains attached on the wall. Due to the re-entrant flow of the downstream jet, cloud cavitation detaches earlier and releases bubble clumps [27]. However, the low-pressure region with sheet cavitation at the chamfer exit sustains vaporization, while the absence of strong re-entrant jets, unlike in cloud cavitation, allows further elongation, as shown in Figure 7b.
Sheet cavitation experiences periodic growth and decay, as shown in Figure 8. Starting from a very short bubble layer, it gradually grows for about 400 ms before collapsing suddenly in just a few milliseconds. The bubble sheet repeats this cycle periodically. This behavior is highlighted when measuring the bubble sheet length over time, as presented in Figure 9. The length of the bubble sheet is defined as the distance from the end of the chamfer to the tip of the sheet, as illustrated in Figure 7b. The bubble sheet extends linearly over time and collapses from the maximum length to the minimum length. Similar periodic behavior in cloud cavitation, where decay results from the re-entrant jet, has been documented [27,28]. However, unlike previous studies in which cloud cavitation cycles had similar durations for growth and decay, decay occurs extremely rapidly in this study. During the decay, very small bubbles form, escaping into the downstream tube. These downstream bubbles are much smaller and more widely dispersed compared to those in strong cloud cavitation, as shown in Figure 5b.
Close investigation of the decay moment, as shown in Figure 10, reveals how the bubble initiates and propagates. When the bubble layer reaches its maximum length at 396.175 ms, the sheet tip develops wrinkles due to Kelvin–Helmholtz instabilities caused by velocity gradients between the bubble sheet and the orifice flow. A pronounced wrinkle, indicated by the red arrow at 396.2 ms, marks the beginning of a rapid collapse at 396.3 ms. The collapse point penetrates the bubble sheet by 396.575 ms, deepening into a V-shape by 396.75 ms. This collapsing momentum can be explained by a micro jet generated by a shock wave from the energy released during bubble collapse [29,30]. The collapse spreads circumferentially due to shock waves from energy release, disrupting the entire sheet. Furthermore, this process may also induce a strong turbulent flow downstream, disturbing the flow equilibrium within the orifice and leading to the circumferential collapse.
The top of Figure 11 summarizes the maximum and minimum lengths of the bubble sheets caused by periodic growth and decay under all flow conditions. When the Reynolds number increases, both the maximum and minimum lengths decrease. In addition, a limit for the sheet length is observed. When the Reynolds number is reduced to 2.13 × 10 4 , the maximum and minimum lengths converge to a single value similar to the orifice length. The gap between the maximum and minimum lengths approaches zero, indicating that the decay amount is immeasurably small.
Figure 12 illustrates this immeasurable decay with sequential images at d P = 0.4 bar and R e = 2.13 × 10 4 . Under this condition, the bubble sheet stretches similarly to Figure 9, but only a small bubble separates from the sheet, unlike the destructive decay observed at R e = 3.22 × 10 4 . Therefore, the change in bubble sheet length is negligible. The separated bubble disintegrates into smaller bubbles downstream.
The sheet movement distance, defined as the difference between the maximum and minimum sheet lengths, is strongly influenced by the Reynolds number, as shown at the bottom of Figure 11. The results also indicate an upper limit for movement distance, which is reached at R e = 3.05 × 10 4 . Beyond this point, further increases in the Reynolds number do not significantly affect movement distance. However, it should be noted that the minimum and maximum sheet lengths continue to decrease as the Reynolds number increases beyond 3.05 × 10 4 .
Based on the definitions in Figure 9 and the decay cycle frequencies, the growth rate and decay rate are calculated, as shown in Figure 13. The decay rate is approximately 60 times faster than the growth rate. Both rates are proportional to the Reynolds number; however, measurements below R e = 2.13 × 10 4 are not feasible. The growth and decay rates follow similar trends, but both reach the maximum values at R e = 3.05 × 10 4 .
In this study, we do not focus on downstream bubbles; however, Figure 12 provides a rough comparison of the characteristics of the bubbles that escape from the orifice. Note that the snapshots in Figure 14 are not compared at the same periodic moment, and quantitative analysis is not feasible due to differences in the focusing points on the circumferential decaying regions. However, increases in pressure drop and Reynolds number result in an increased amount of downstream bubbles and reduced bubble sizes. Future studies are expected to quantify the downstream bubbles, which could be used for cyclic bubble generation control in terms of size, quantity, and frequency.

3.2. Discussion

The sheet cavitation observed in this study exhibits distinctive characteristics. Remarkably, it remains stable even at Reynolds numbers high enough to induce turbulent flow within the orifice, contrasting with the laminar sheet cavitation documented in previous research [20].
This new regime may be explained by bubbles trapped within the recirculation zone; however, the bubble sheet length exhibits a distinct trend compared to the reattachment behavior of a separated boundary layer in forward-facing step flows. Although the reattachment length of the recirculation zone in forward-facing step flows increases with increasing Reynolds numbers [31], the maximum bubble length in this study instead decreases, as shown in Figure 11. It should be noted that the Reynolds numbers in this study exceed 20,000, probably higher than the critical Reynolds number at which the reattachment length stops increasing [31]. Hence, the recirculation zone itself can be assumed to remain relatively similar in size for all cases in this study, and the maximum bubble sheet length is controlled by another mechanism.
The sheet cavitation regime arises from a metastable equilibrium between surface tension, flow-induced shear, and pressure gradients, as shown in Figure 15. Initially, small bubbles nucleated by sudden inception merge into a circumferentially connected sheet. This coalescence is stabilized by surface tension, which minimizes interfacial energy while resisting the shear force of the orifice flow and the turbulence from the recirculation zone downstream. The continuous annular geometry of the sheet enhances stability, as surface tension forces scale with curvature, creating a restoring force that counteracts flow-driven elongation.
As the sheet elongates, the recirculation region contracts, amplifying shear stresses at the sheet tip. This explains the inverse proportional relationship between the maximum sheet length and Reynolds number. The higher R e enhances turbulence strength in the recirculation behind the bubble sheet, reducing the critical length at which shear force overwhelms the resisting force of surface tension. The abrupt decay occurs when Kelvin–Helmholtz instabilities at the vapor–liquid interface at the end of the sheet exceed the attenuating capacity of surface tension, triggering microjet-driven disintegration [30].
In addition, the onset condition of this cavitation regime shows hysteresis. During slow valve closure, the cavitating flow can transition from cloud cavitation to a metastable sheet by reducing the turbulent energy that disturbs bubble coalescence. Once the metastable annular sheet is formed, it remains even below the inception pressure ( d P < 1.0 bar in this study) due to the balance between disturbing and resisting forces. This metastability can have a critical impact on flow systems. For example, in rocket engines, this cavitation regime could induce instability during throttle adjustments in the start-up transient phase, even when the evaluated cavitation number is higher than the typical limit.
On the other hand, the periodic generation of micro bubbles, as shown in Figure 12, can offer advantages in various fields. For instance, in biomedical applications, such as ultrasound imaging, sonoporation, tumor ablation, and targeted drug delivery, the precise control of bubble size and frequency by the new bubble sheet regime in this study may improve diagnostic accuracy and therapeutic efficiency without external actuators [32]. Additionally, in chemical reactors and industrial environments, this controlled bubble generation can improve mixing efficiency and mass transfer, supporting localized chemical reactions and efficient cleaning processes while reducing energy consumption and preventing bubble coalescence. Moreover, for optical flow diagnostics, controlled sheet cavitation could act as natural tracers in cases where seeding is not possible [33].
A limitation of this study should be noted; the dissolved gas was not controlled. Since dissolved gas can promote the inception of cavitation [34], the inception point of cavitation may change quantitatively. However, because the new regime begins after cavitation has already been initiated, the impact of dissolved gas can be considered minimal. Nevertheless, the effect of dissolved gas should be evaluated in future work.

4. Conclusions

This study has investigated the onset and decay mechanisms of sheet cavitation in a chamfered orifice. Through high-speed imaging and frame-by-frame analysis, a unique metastable sheet cavitation regime was identified, demonstrating notable stability due to equilibrium between surface tension, flow shear, and pressure gradients in recirculation behind the sheet even under turbulent conditions. This regime is characterized by its hysteresis behavior during the onset condition, and the periodicity can be controlled by cavitation numbers.
Key findings of our investigation include the following:
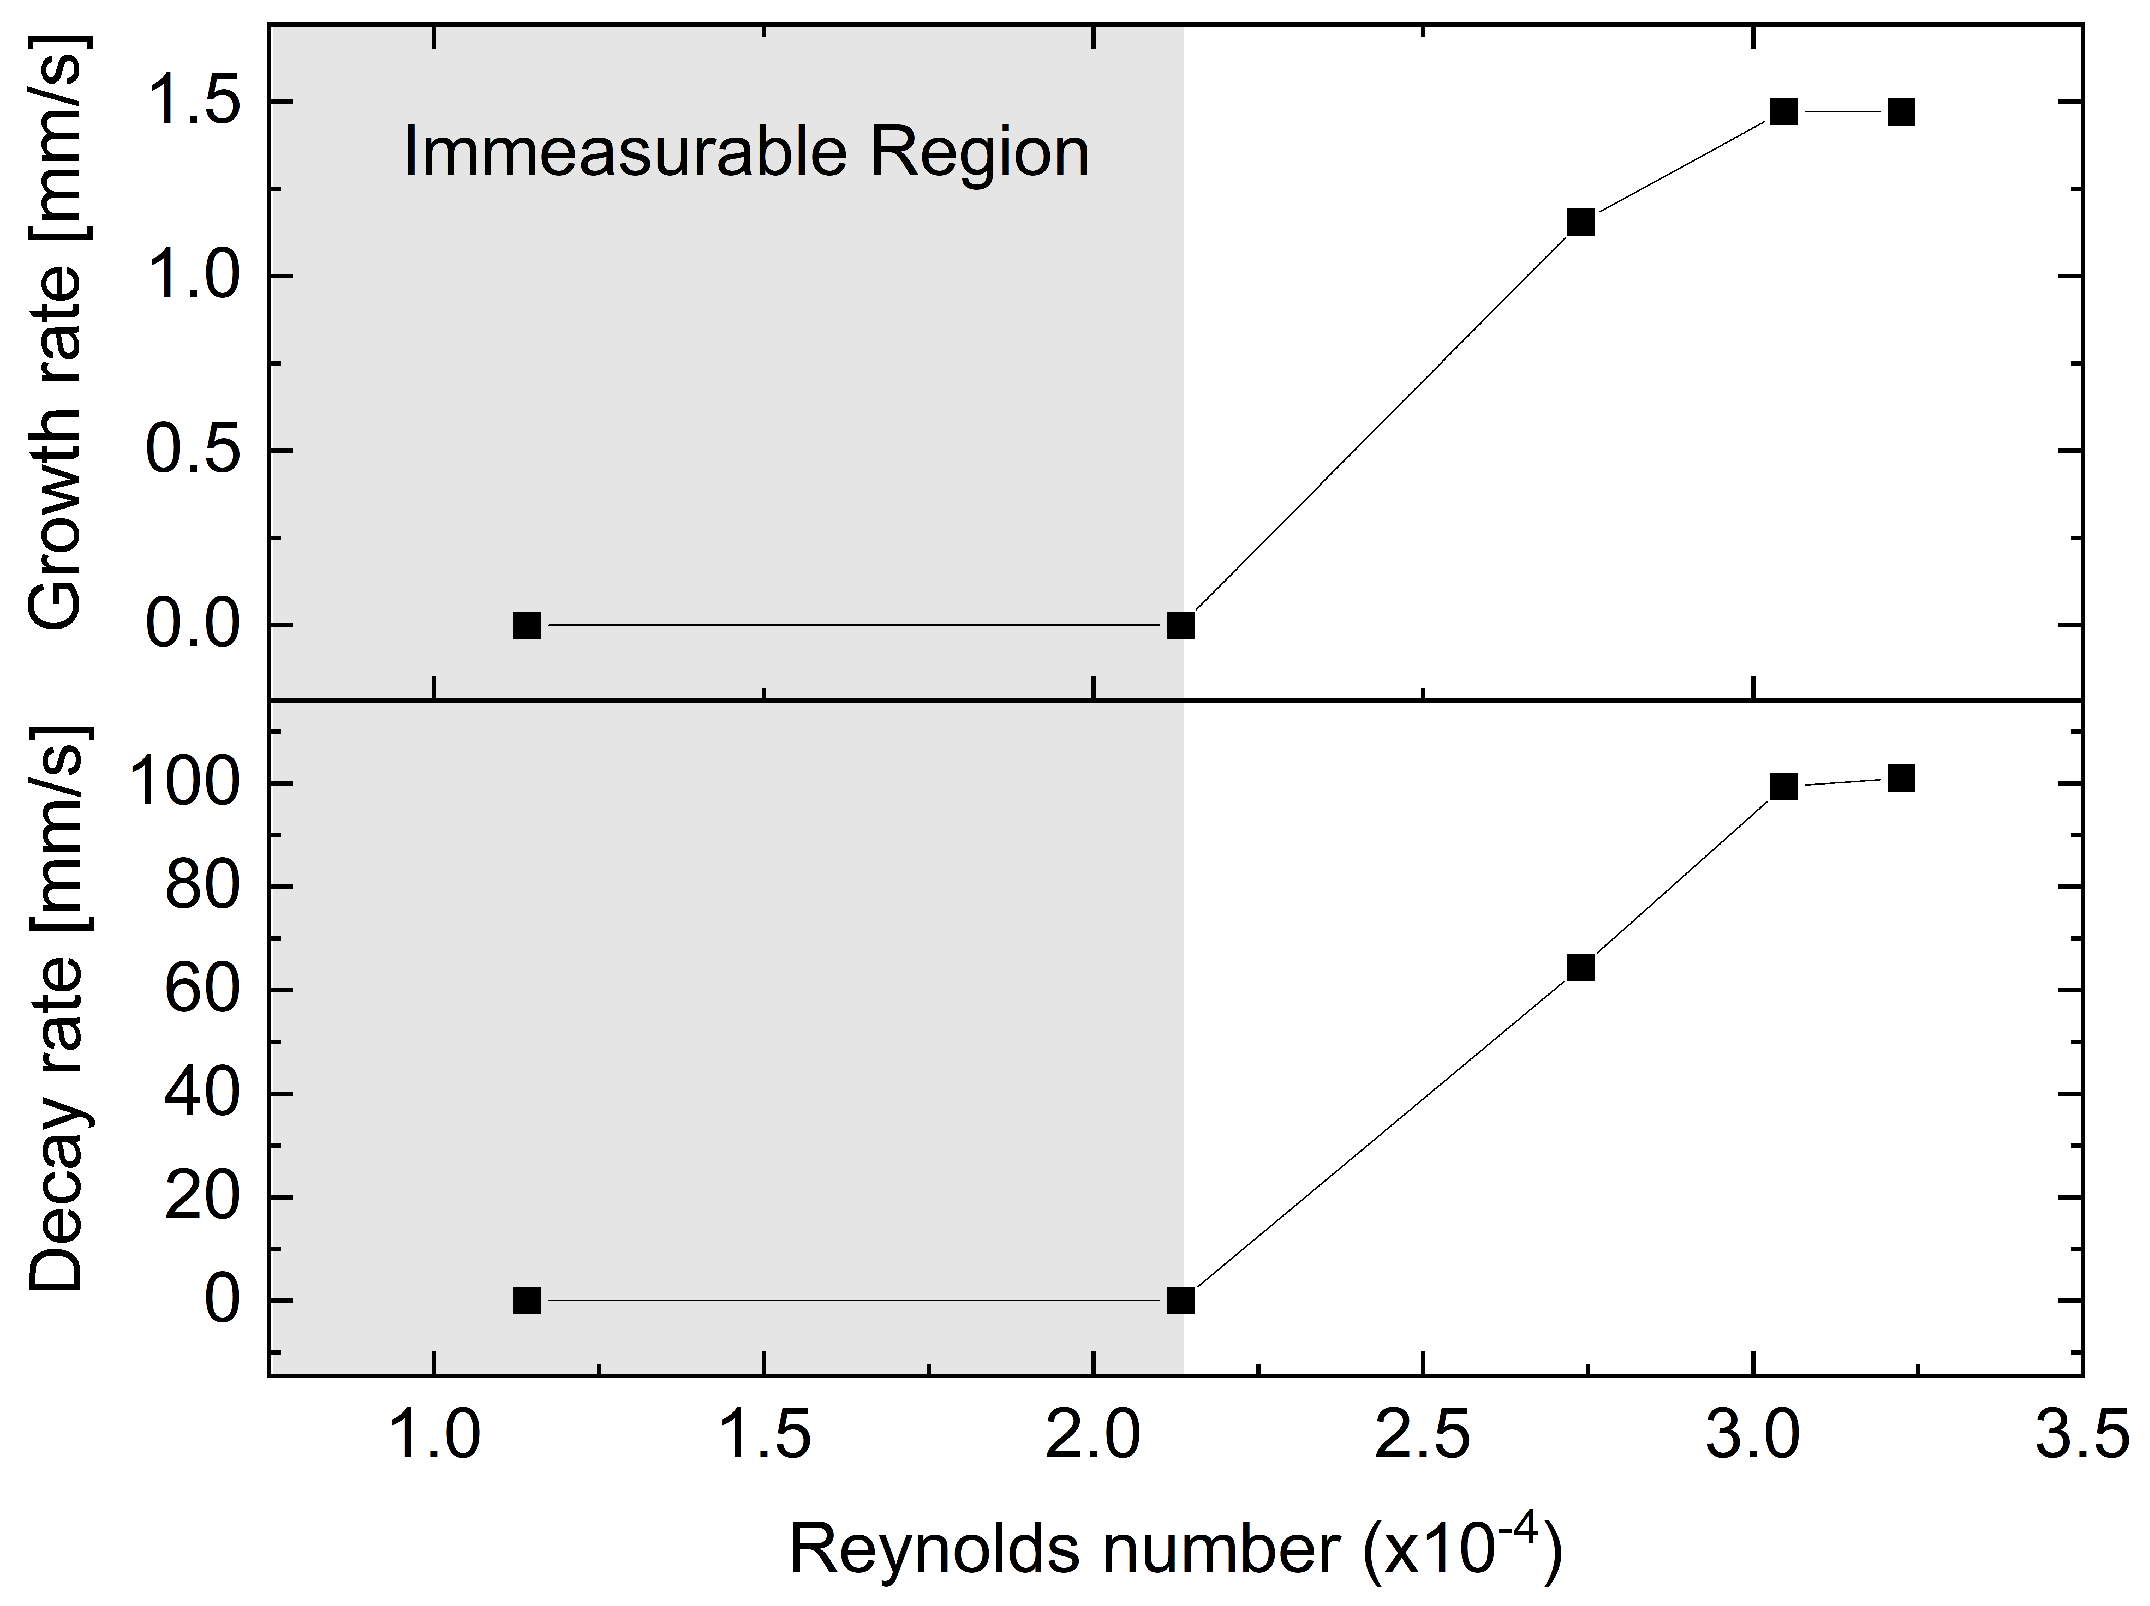
  • The new sheet cavitation regime appears at high cavitation numbers where cavitation inception is typically unexpected, presenting a distinct hysteresis effect governed by path-dependent energy barriers. This suggests a potential risk to hydraulic systems with control valves, particularly in transient operations like rocket engine throttling.
  • The behavior of sheet cavitation, particularly its linear growth and rapid collapse driven by tip instabilities and microjet penetration, provides insights into the dynamic stability of cavitation bubbles and their interactions with flow conditions.
  • Because the metastable sheet cavitation regime can be intentionally initiated and controlled through the manipulation of pressure drop across the orifice, it reveals new possibilities for utilizing the new cavitation regime in various research fields through controlled and dispersed bubble generation.
For future work, exploring the quantitative aspects of bubble dynamics within the metastable sheet cavitation regime, including bubble size distribution and velocity, could provide further insights into optimizing cavitation for specific applications. Additionally, investigating the impact of varying fluid properties (e.g., dissolved gas content) and orifice geometries, such as chamfer angle and L / D ratio, on the stability and characteristics of sheet cavitation could broaden the understanding and applicability of these findings.
In conclusion, this study identifies a new hysteresis-induced metastable sheet cavitation regime in an orifice, which persists below the cavitation inception pressure. This novel regime challenges conventional cavitation number thresholds and presents a dual role as both a potential factor in flow systems and a new bubble generation mechanism for research applications. Further research in this regime could improve our understanding of cavitation and lead to improved design and operation of fluid systems.

Supplementary Materials

The following supporting information can be downloaded at: https://www.mdpi.com/article/10.3390/fluids10030059/s1, Video S1: Close-up video of the bubble sheet decay process at d P = 0.8 bar, corresponding to Figure 10.

Author Contributions

Conceptualization, M.S. and J.S.H.; methodology, M.S.; software, M.S.; validation, W.A. and J.S.H.; formal analysis, M.S., M.B. and W.A.; investigation, M.S. and M.B.; resources, M.B.; data curation, M.S.; writing—original draft preparation, M.S.; writing—review and editing, M.S., M.B., W.A. and J.S.H.; visualization, M.S.; supervision, J.S.H.; project administration, J.S.H. All authors have read and agreed to the published version of the manuscript.

Funding

This activity was performed in the frame of the DLR internal project LUMEN.

Data Availability Statement

The data presented in this study are available on request from the corresponding author and with written permission of the DLR e.V.

Acknowledgments

Authors thank Arthur Walz-Steinbach, Jonas Vogel, Markus Dengler, and Michael Zepmeisel for technical support.

Conflicts of Interest

The authors declare no conflicts of interest.

References

  1. Brennen, C.E. Cavitation and Bubble Dynamics; Cambridge University Press: Cambridge, UK, 2014. [Google Scholar]
  2. Kumar, P.; Saini, R. Study of cavitation in hydro turbines—A review. Renew. Sustain. Energy Rev. 2010, 14, 374–383. [Google Scholar] [CrossRef]
  3. Binama, M.; Muhirwa, A.; Bisengimana, E. Cavitation effects in centrifugal pumps-A review. Int. J. Eng. Res. Appl. 2016, 6, 52–63. [Google Scholar]
  4. Garcia, R.; Hammitt, F.G. Cavitation damage and correlations with material and fluid properties. J. Basic Eng. 1967, 89, 753–763. [Google Scholar] [CrossRef]
  5. Testud, P.; Moussou, P.; Hirschberg, A.; Aurégan, Y. Noise generated by cavitating single-hole and multi-hole orifices in a water pipe. J. Fluids Struct. 2007, 23, 163–189. [Google Scholar] [CrossRef]
  6. Asi, O. Failure of a diesel engine injector nozzle by cavitation damage. Eng. Fail. Anal. 2006, 13, 1126–1133. [Google Scholar] [CrossRef]
  7. Abderrezzak, B.; Huang, Y. Investigation of the effect of cavitation in nozzles with different length to diameter ratios on atomization of a liquid jet. J. Therm. Sci. Eng. Appl. 2017, 9, 031014. [Google Scholar] [CrossRef]
  8. Hashimoto, T.; Yoshida, M.; Watanabe, M.; Kamijo, K.; Tsujimoto, Y. Experimental study on rotating cavitation of rocket propellant pump inducers. J. Propuls. Power 1997, 13, 488–494. [Google Scholar] [CrossRef]
  9. Hardi, J.; Martin, J.; Son, M.; Armbruster, W.; Deeken, J.C.; Suslov, D.; Oschwald, M. Combustion Stability Characteristics of a sub-scale LOX/LNG Rocket Thrust Chamber. In Proceedings of the Aerospace Europe Conference 2020, Bordeaux, France, 25–28 February 2020. [Google Scholar]
  10. Kumar, K.S.; Moholkar, V.S. Conceptual design of a novel hydrodynamic cavitation reactor. Chem. Eng. Sci. 2007, 62, 2698–2711. [Google Scholar] [CrossRef]
  11. Zheng, H.; Zheng, Y.; Zhu, J. Recent developments in hydrodynamic cavitation reactors: Cavitation mechanism, reactor design, and applications. Engineering 2022, 19, 180–198. [Google Scholar] [CrossRef]
  12. Tao, Y.; Cai, J.; Huai, X.; Liu, B.; Guo, Z. Application of hydrodynamic cavitation to wastewater treatment. Chem. Eng. Technol. 2016, 39, 1363–1376. [Google Scholar] [CrossRef]
  13. Abdrashitov, A.; Gavrilov, A.; Marfin, E.; Panchenko, V.; Kovalev, A.; Bolshev, V.; Karaeva, J. Cavitation Reactor for Pretreatment of Liquid Agricultural Waste. Agriculture 2023, 13, 1218. [Google Scholar] [CrossRef]
  14. Asaithambi, N.; Singha, P.; Dwivedi, M.; Singh, S.K. Hydrodynamic cavitation and its application in food and beverage industry: A review. J. Food Process Eng. 2019, 42, e13144. [Google Scholar] [CrossRef]
  15. Xiong, Y.; Peng, F. Optimization of cavitation venturi tube design for pico and nano bubbles generation. Int. J. Min. Sci. Technol. 2015, 25, 523–529. [Google Scholar] [CrossRef]
  16. Son, M.; Börner, M.; Armbruster, W.; Hardi, J.S. Orifice Flow Dynamics in a Rocket Injector as an Excitation Source of Injector-Driven Combustion Instabilities. Aerospace 2023, 10, 452. [Google Scholar] [CrossRef]
  17. Gröning, S.; Hardi, J.S.; Suslov, D.; Oschwald, M. Injector-driven combustion instabilities in a hydrogen/oxygen rocket combustor. J. Propuls. Power 2016, 32, 560–573. [Google Scholar] [CrossRef]
  18. Armbruster, W.; Hardi, J.S.; Suslov, D.; Oschwald, M. Injector-Driven Flame Dynamics in a High-Pressure Multi-Element Oxygen–Hydrogen Rocket Thrust Chamber. J. Propuls. Power 2019, 35, 632–644. [Google Scholar] [CrossRef]
  19. Esposito, C.; Steelant, J.; Vetrano, M.R. Impact of Cryogenics on Cavitation through an Orifice: A Review. Energies 2021, 14, 8319. [Google Scholar] [CrossRef]
  20. Croci, K.; Ravelet, F.; Danlos, A.; Robinet, J.C.; Barast, L. Attached cavitation in laminar separations within a transition to unsteadiness. Phys. Fluids 2019, 31, 063605. [Google Scholar] [CrossRef]
  21. Pelz, P.; Keil, T.; Groß, T. The transition from sheet to cloud cavitation. J. Fluid Mech. 2017, 817, 439–454. [Google Scholar] [CrossRef]
  22. Ge, M.; Sun, C.; Zhang, G.; Coutier-Delgosha, O.; Fan, D. Combined suppression effects on hydrodynamic cavitation performance in Venturi-type reactor for process intensification. Ultrason. Sonochem. 2022, 86, 106035. [Google Scholar] [CrossRef] [PubMed]
  23. Amini, A.; Reclari, M.; Sano, T.; Iino, M.; Dreyer, M.; Farhat, M. On the physical mechanism of tip vortex cavitation hysteresis. Exp. Fluids 2019, 60, 118. [Google Scholar] [CrossRef]
  24. Khoo, M.; Venning, J.; Pearce, B.; Brandner, P. Statistical aspects of tip vortex cavitation inception and desinence in a nuclei deplete flow. Exp. Fluids 2020, 61, 145. [Google Scholar] [CrossRef]
  25. McCloy, D.; Beck, A. Some cavitation effects in spool valve orifices. Proc. Inst. Mech. Eng. 1967, 182, 163–174. [Google Scholar] [CrossRef]
  26. Esposito, C.; Mendez, M.; Steelant, J.; Vetrano, M.R. Spectral and modal analysis of a cavitating flow through an orifice. Exp. Therm. Fluid Sci. 2021, 121, 110251. [Google Scholar] [CrossRef]
  27. Callenaere, M.; Franc, J.P.; Michel, J.M.; Riondet, M. The cavitation instability induced by the development of a re-entrant jet. J. Fluid Mech. 2001, 444, 223–256. [Google Scholar] [CrossRef]
  28. Trummler, T.; Schmidt, S.J.; Adams, N.A. Investigation of condensation shocks and re-entrant jet dynamics in a cavitating nozzle flow by Large-Eddy Simulation. Int. J. Multiph. Flow 2020, 125, 103215. [Google Scholar] [CrossRef]
  29. Sarkar, P.; Ghigliotti, G.; Franc, J.P.; Fivel, M. Mechanism of material deformation during cavitation bubble collapse. J. Fluids Struct. 2021, 105, 103327. [Google Scholar] [CrossRef]
  30. Obreschkow, D.; Tinguely, M.; Dorsaz, N.; Kobel, P.; De Bosset, A.; Farhat, M. Universal scaling law for jets of collapsing bubbles. Phys. Rev. Lett. 2011, 107, 204501. [Google Scholar] [CrossRef]
  31. Sherry, M.; Jacono, D.L.; Sheridan, J. An experimental investigation of the recirculation zone formed downstream of a forward facing step. J. Wind Eng. Ind. Aerodyn. 2010, 98, 888–894. [Google Scholar] [CrossRef]
  32. Rodríguez-Rodríguez, J.; Sevilla, A.; Martínez-Bazán, C.; Gordillo, J.M. Generation of microbubbles with applications to industry and medicine. Annu. Rev. Fluid Mech. 2015, 47, 405–429. [Google Scholar] [CrossRef]
  33. Liu, Z.; Zheng, Y.; Jia, L.; Zhang, Q. Study of bubble induced flow structure using PIV. Chem. Eng. Sci. 2005, 60, 3537–3552. [Google Scholar] [CrossRef]
  34. Li, B.; Gu, Y.; Chen, M. An experimental study on the cavitation of water with dissolved gases. Exp. Fluids 2017, 58, 164. [Google Scholar] [CrossRef]
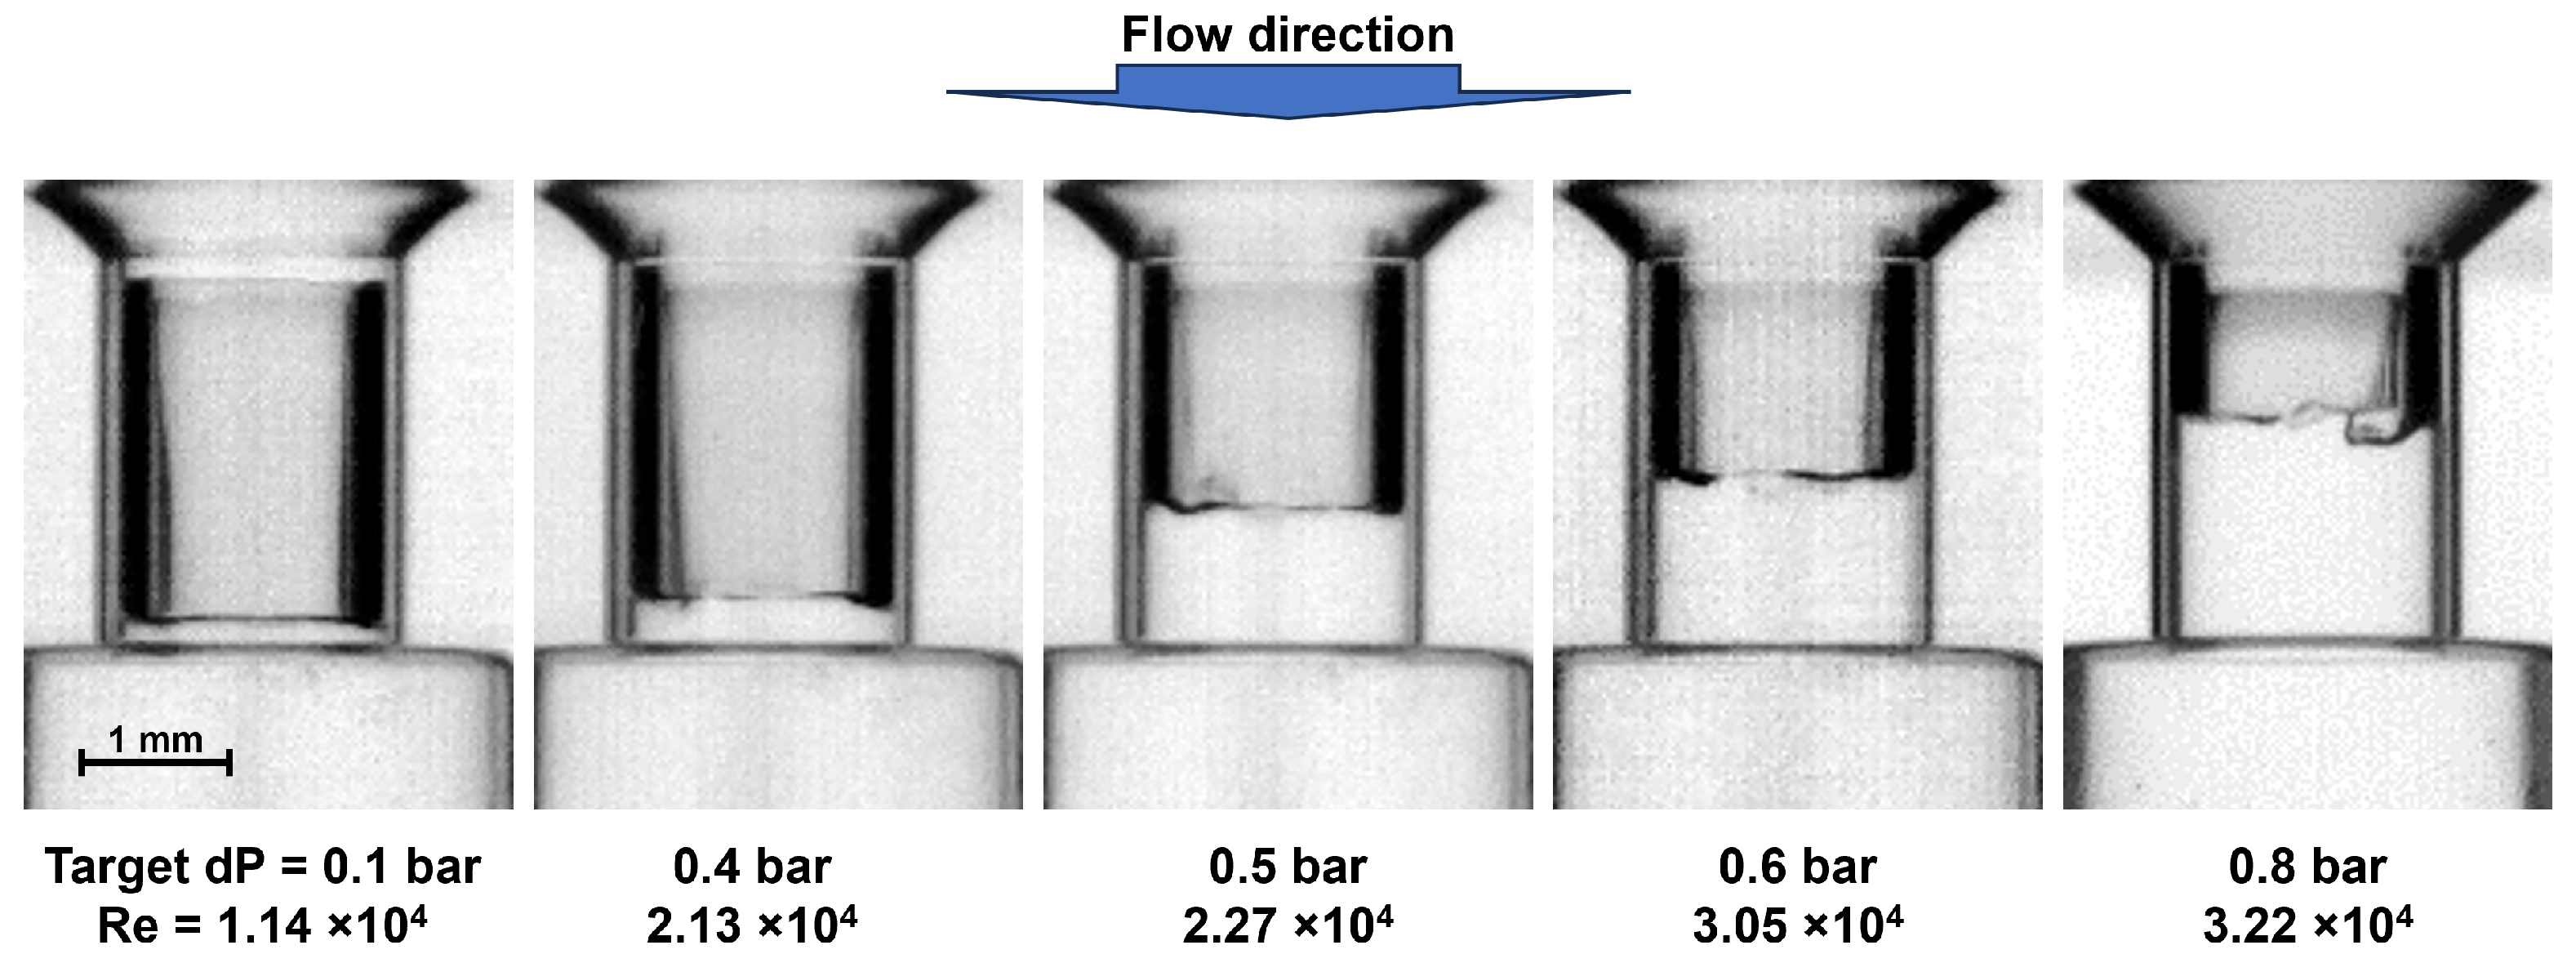
Figure 1. Experimental setup for flow visualization and data acquisition.
Fluids 10 00059 g001
Figure 2. Dimensions of internal geometries of the flow path.
Fluids 10 00059 g002
Figure 3. Cavitation regime based on orifice pressure drops.
Fluids 10 00059 g003
Figure 4. Visualized cloud cavitation as the pressure drop increases [16].
Fluids 10 00059 g004
Figure 5. Onset mechanism of stable sheet cavitation: (a) a schematic of the corresponding procedure, (b) visualized cavitation onset, and (c) sequential onset steps through A-C-D in cross-sectional views at the orifice inlet.
Fluids 10 00059 g005
Figure 6. Snapshots of the maximum bubble lengths at various flow conditions.
Fluids 10 00059 g006
Figure 7. Comparison of cloud and sheet cavitation: (a) captured images and (b) schematics of cavitation structures.
Fluids 10 00059 g007
Figure 8. Sequential snapshots of sheet cavitation at d P = 0.8 bar and R e = 3.22 × 10 4 .
Fluids 10 00059 g008
Figure 9. Measured bubble sheet lengths in a cycle at d P = 0.8 bar and R e = 3.22 × 10 4 .
Fluids 10 00059 g009
Figure 10. Close-up of the orifice at decaying moment at d P = 0.8 bar and R e = 3.22 × 10 4 (Video S1).
Fluids 10 00059 g010
Figure 11. The maximum and minimum sheet lengths during cyclic growth and decay according to Reynolds numbers. The lengths are normalized by the orifice length ( L o = 2.5 mm), except for the chamfer length.
Fluids 10 00059 g011
Figure 12. Decay sequence of sheet cavitation at d P = 0.4 bar and R e = 2.13 × 10 4 .
Fluids 10 00059 g012
Figure 13. Growth and decay rates of bubble sheets according to Reynolds numbers.
Fluids 10 00059 g013
Figure 14. Comparison of downstream bubbles after the start of the decay process.
Fluids 10 00059 g014
Figure 15. Schematic of bubble sheet generation inside the recirculation zone.
Fluids 10 00059 g015
Table 1. Experimental conditions for sheet cavitations.
Target dP [bar]Measured dP [bar] m ˙ [g/s]K Re C d
0.10.09715.310.881.14 × 10 4 0.74
0.40.39628.63.482.13 × 10 4 0.81
0.50.49636.73.032.74 × 10 4 0.93
0.60.61640.92.663.05 × 10 4 0.95
0.80.79844.62.313.22 × 10 4 0.94
Disclaimer/Publisher’s Note: The statements, opinions and data contained in all publications are solely those of the individual author(s) and contributor(s) and not of MDPI and/or the editor(s). MDPI and/or the editor(s) disclaim responsibility for any injury to people or property resulting from any ideas, methods, instructions or products referred to in the content.

