1. Introduction
In the past few years, aircraft aerodynamic design has been a major area of focus, with increasing reliance on computational optimization methods aimed at reducing fuel consumption and improving aerodynamic efficiency [
1]. All these activities come under numerous strategies like multi-objective optimization of aerodynamic surfaces [
2,
3,
4], enhancement of aerodynamic performance by implementation of flow control techniques on airfoils [
5,
6], high-lift devices [
7,
8], and vertical tails [
9], and other advanced methods [
10,
11,
12,
13]. In recent years, advances in computational fluid dynamics (CFD) and high-fidelity simulation tools have transformed the process of aerodynamic design and optimization. Modern vertical tail sizing no longer relies solely on empirical data and wind tunnel testing but increasingly integrates CFD-based optimization frameworks that enable detailed prediction of flow separation, side force generation, and yawing moment characteristics under complex flight conditions [
14,
15,
16]. These numerical methods are often combined with multi-disciplinary design optimization (MDO) approaches to balance aerodynamic efficiency, structural integrity, and control requirements [
17,
18]. Among these, the aircraft vertical tail has recently attracted considerable interest due to its substantial contribution to overall drag and the necessity for larger design margins under emergency conditions. The vertical tail of an aircraft plays a critical role of providing static and dynamic stability along the lateral-directional axis, as well as control and trimming ability under various flight conditions [
18]. Stability refers to the manner in which the aircraft returns to a stable flight condition after a disturbance. Control refers to the ability of the vertical tail to control lateral-directional attitude and movement of the aircraft such that specific maneuvers and course changes are achieved. During normal flight, the airplane remains on course without sensation from any lateral force [
19]. It serves effectively in resisting yawing moments caused by crosswinds, asymmetric thrust, or adverse yaw while flying maneuvers. Its effectiveness is particularly apparent when the sideslip angle is comparatively high, such as engine failure in multi-engine airplanes, gusty wind flights, or coordinated turns. Accordingly, the vertical tail is normally developed with symmetric airfoil sections so that it maintains the aircraft in balance. The rudder, or vertical control surface, on the vertical tail is utilized to produce lateral force in order to generate the desired yawing moment required for directional maneuvers [
20]. This side force is due to the asymmetry that is created in the flow about the vertical tail when rudder deflection occurs.
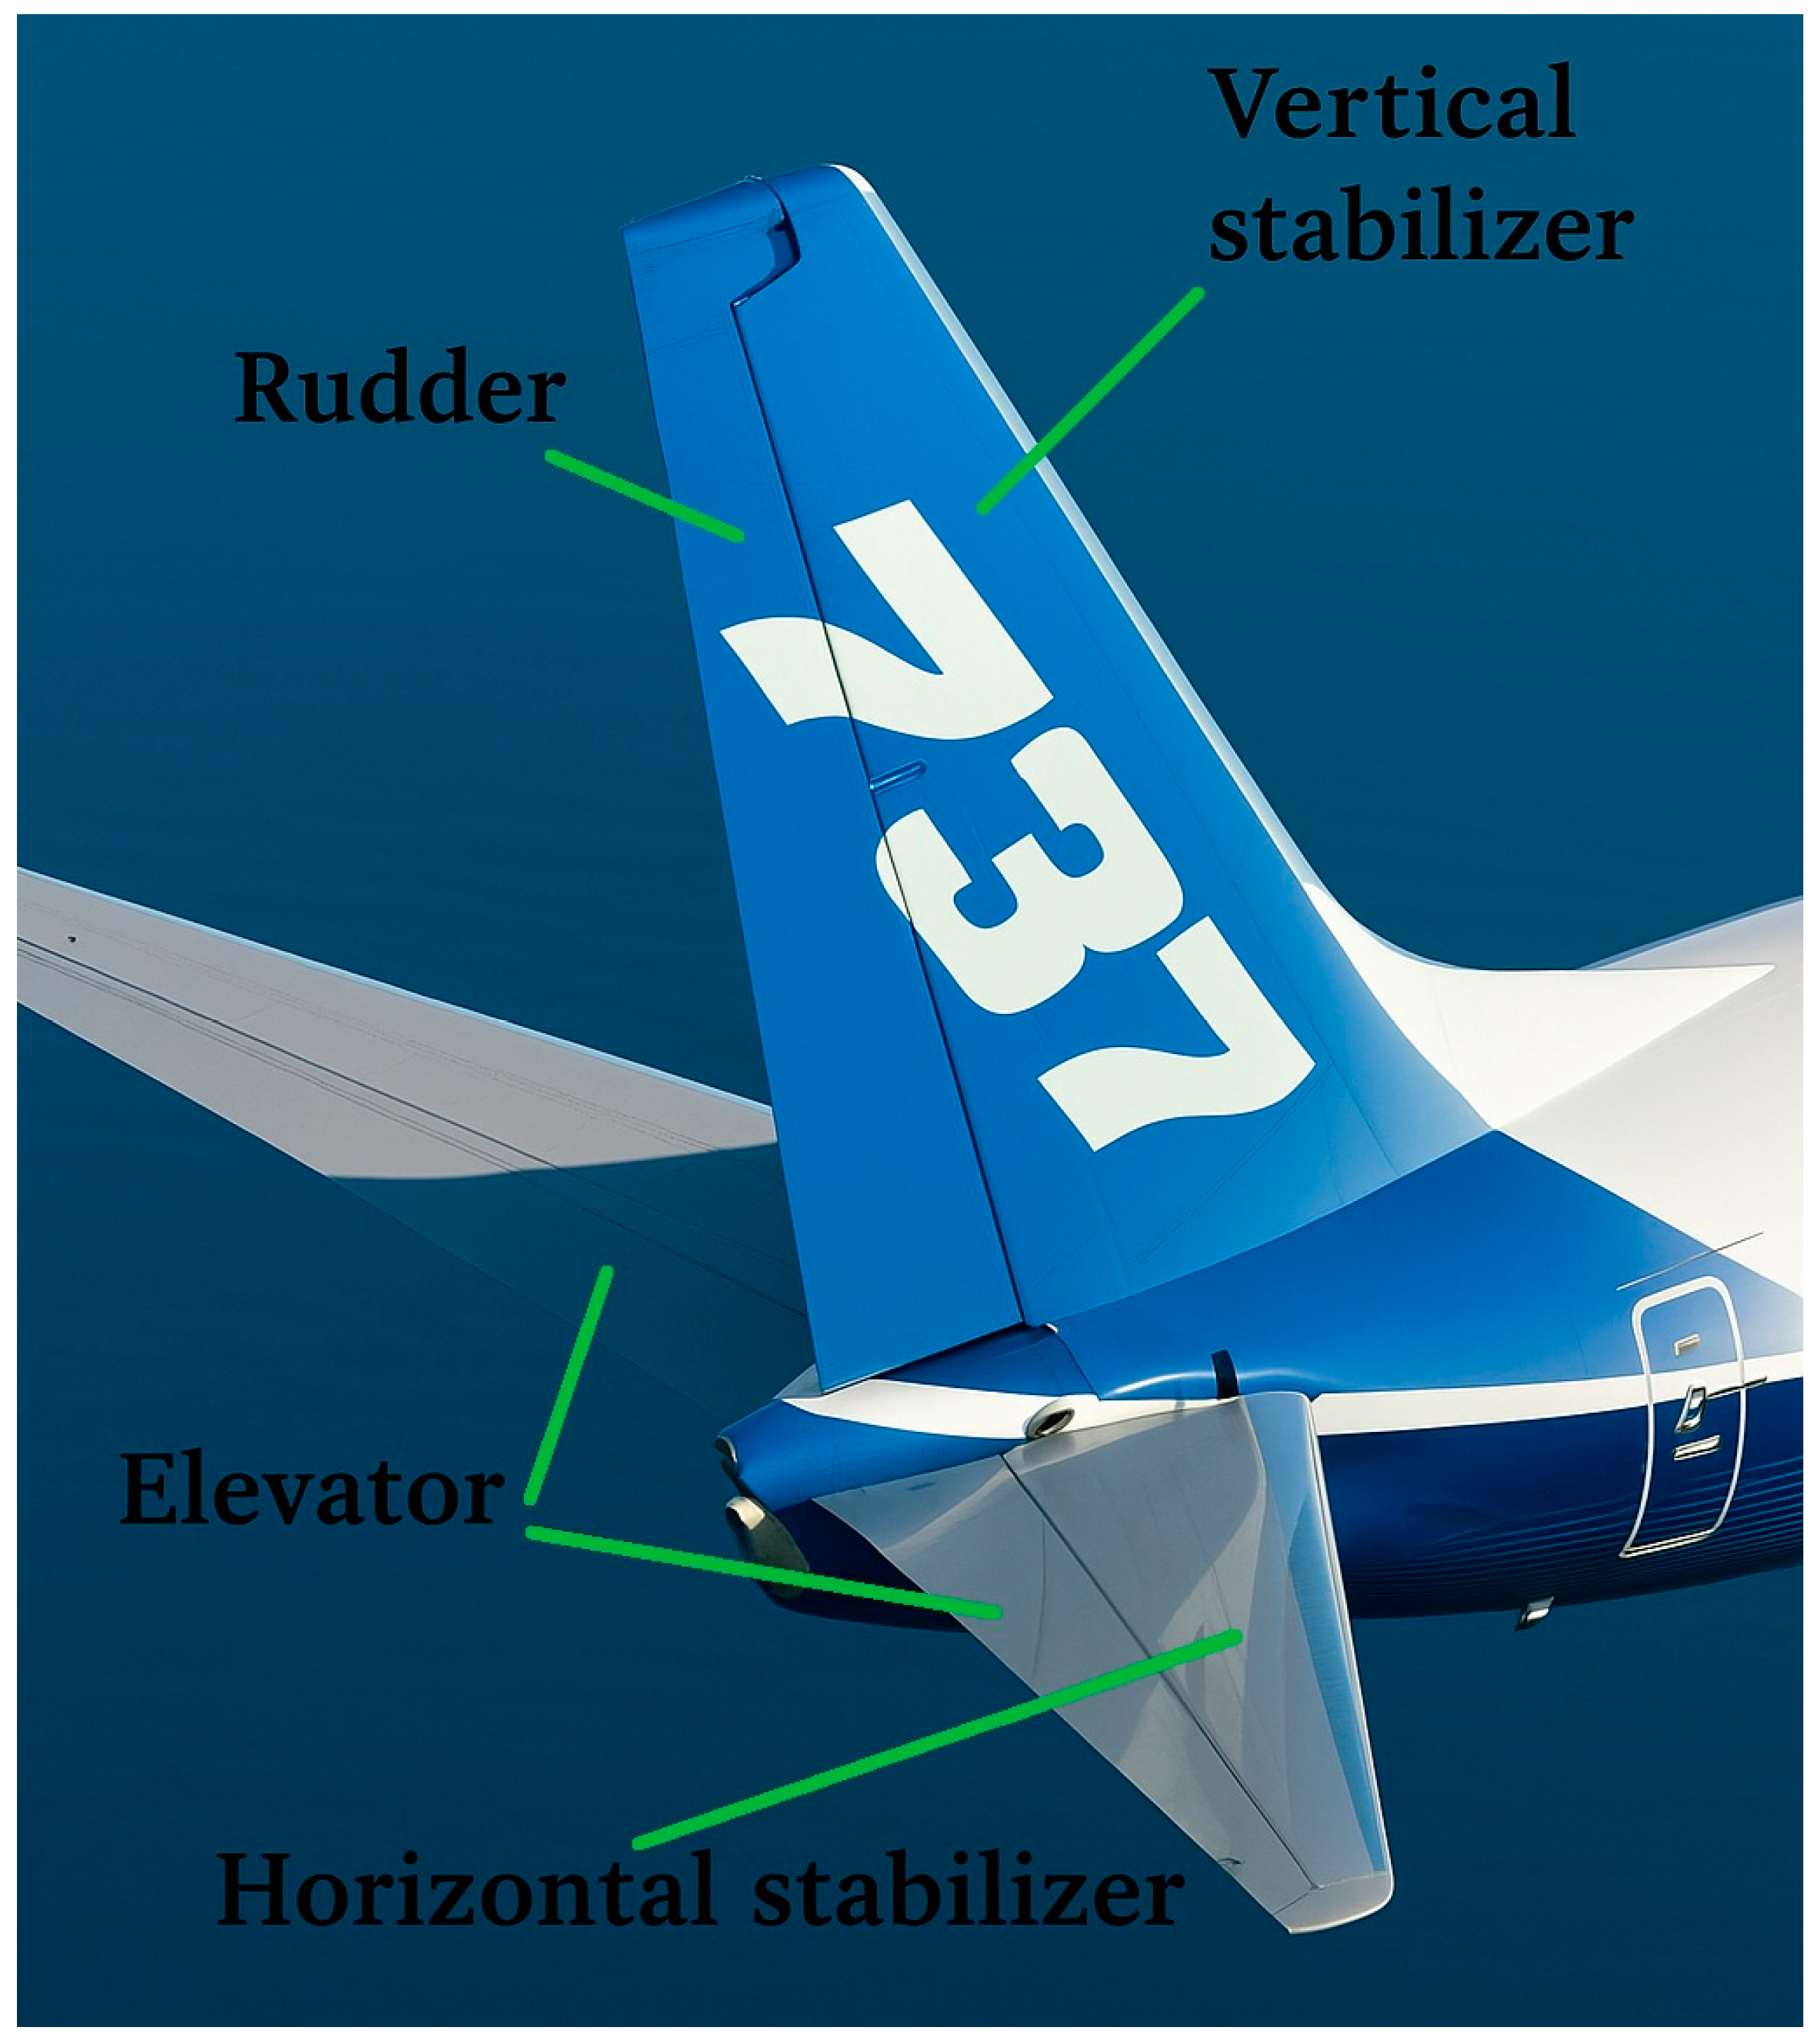
Figure 1 illustrates a schematic diagram of the vertical tail, with the vertical stabilizer shown as the stationary member and the rudder as the moving control surface. The vertical tail, from a design viewpoint, provides an aircraft’s stability margins and control effectiveness [
21]. Concurrently, it also contributes to parasitic drag and to the weight of the structure. Thus, achieving a balance between its size and aerodynamic efficiency under a range of working conditions remains one of the most significant challenges of military as well as commercial aircraft design. To facilitate this optimization process, a clear grasp of how aerodynamic forces and moments on the vertical tail vary with sideslip angle (β) and rudder deflection (δ) is required.
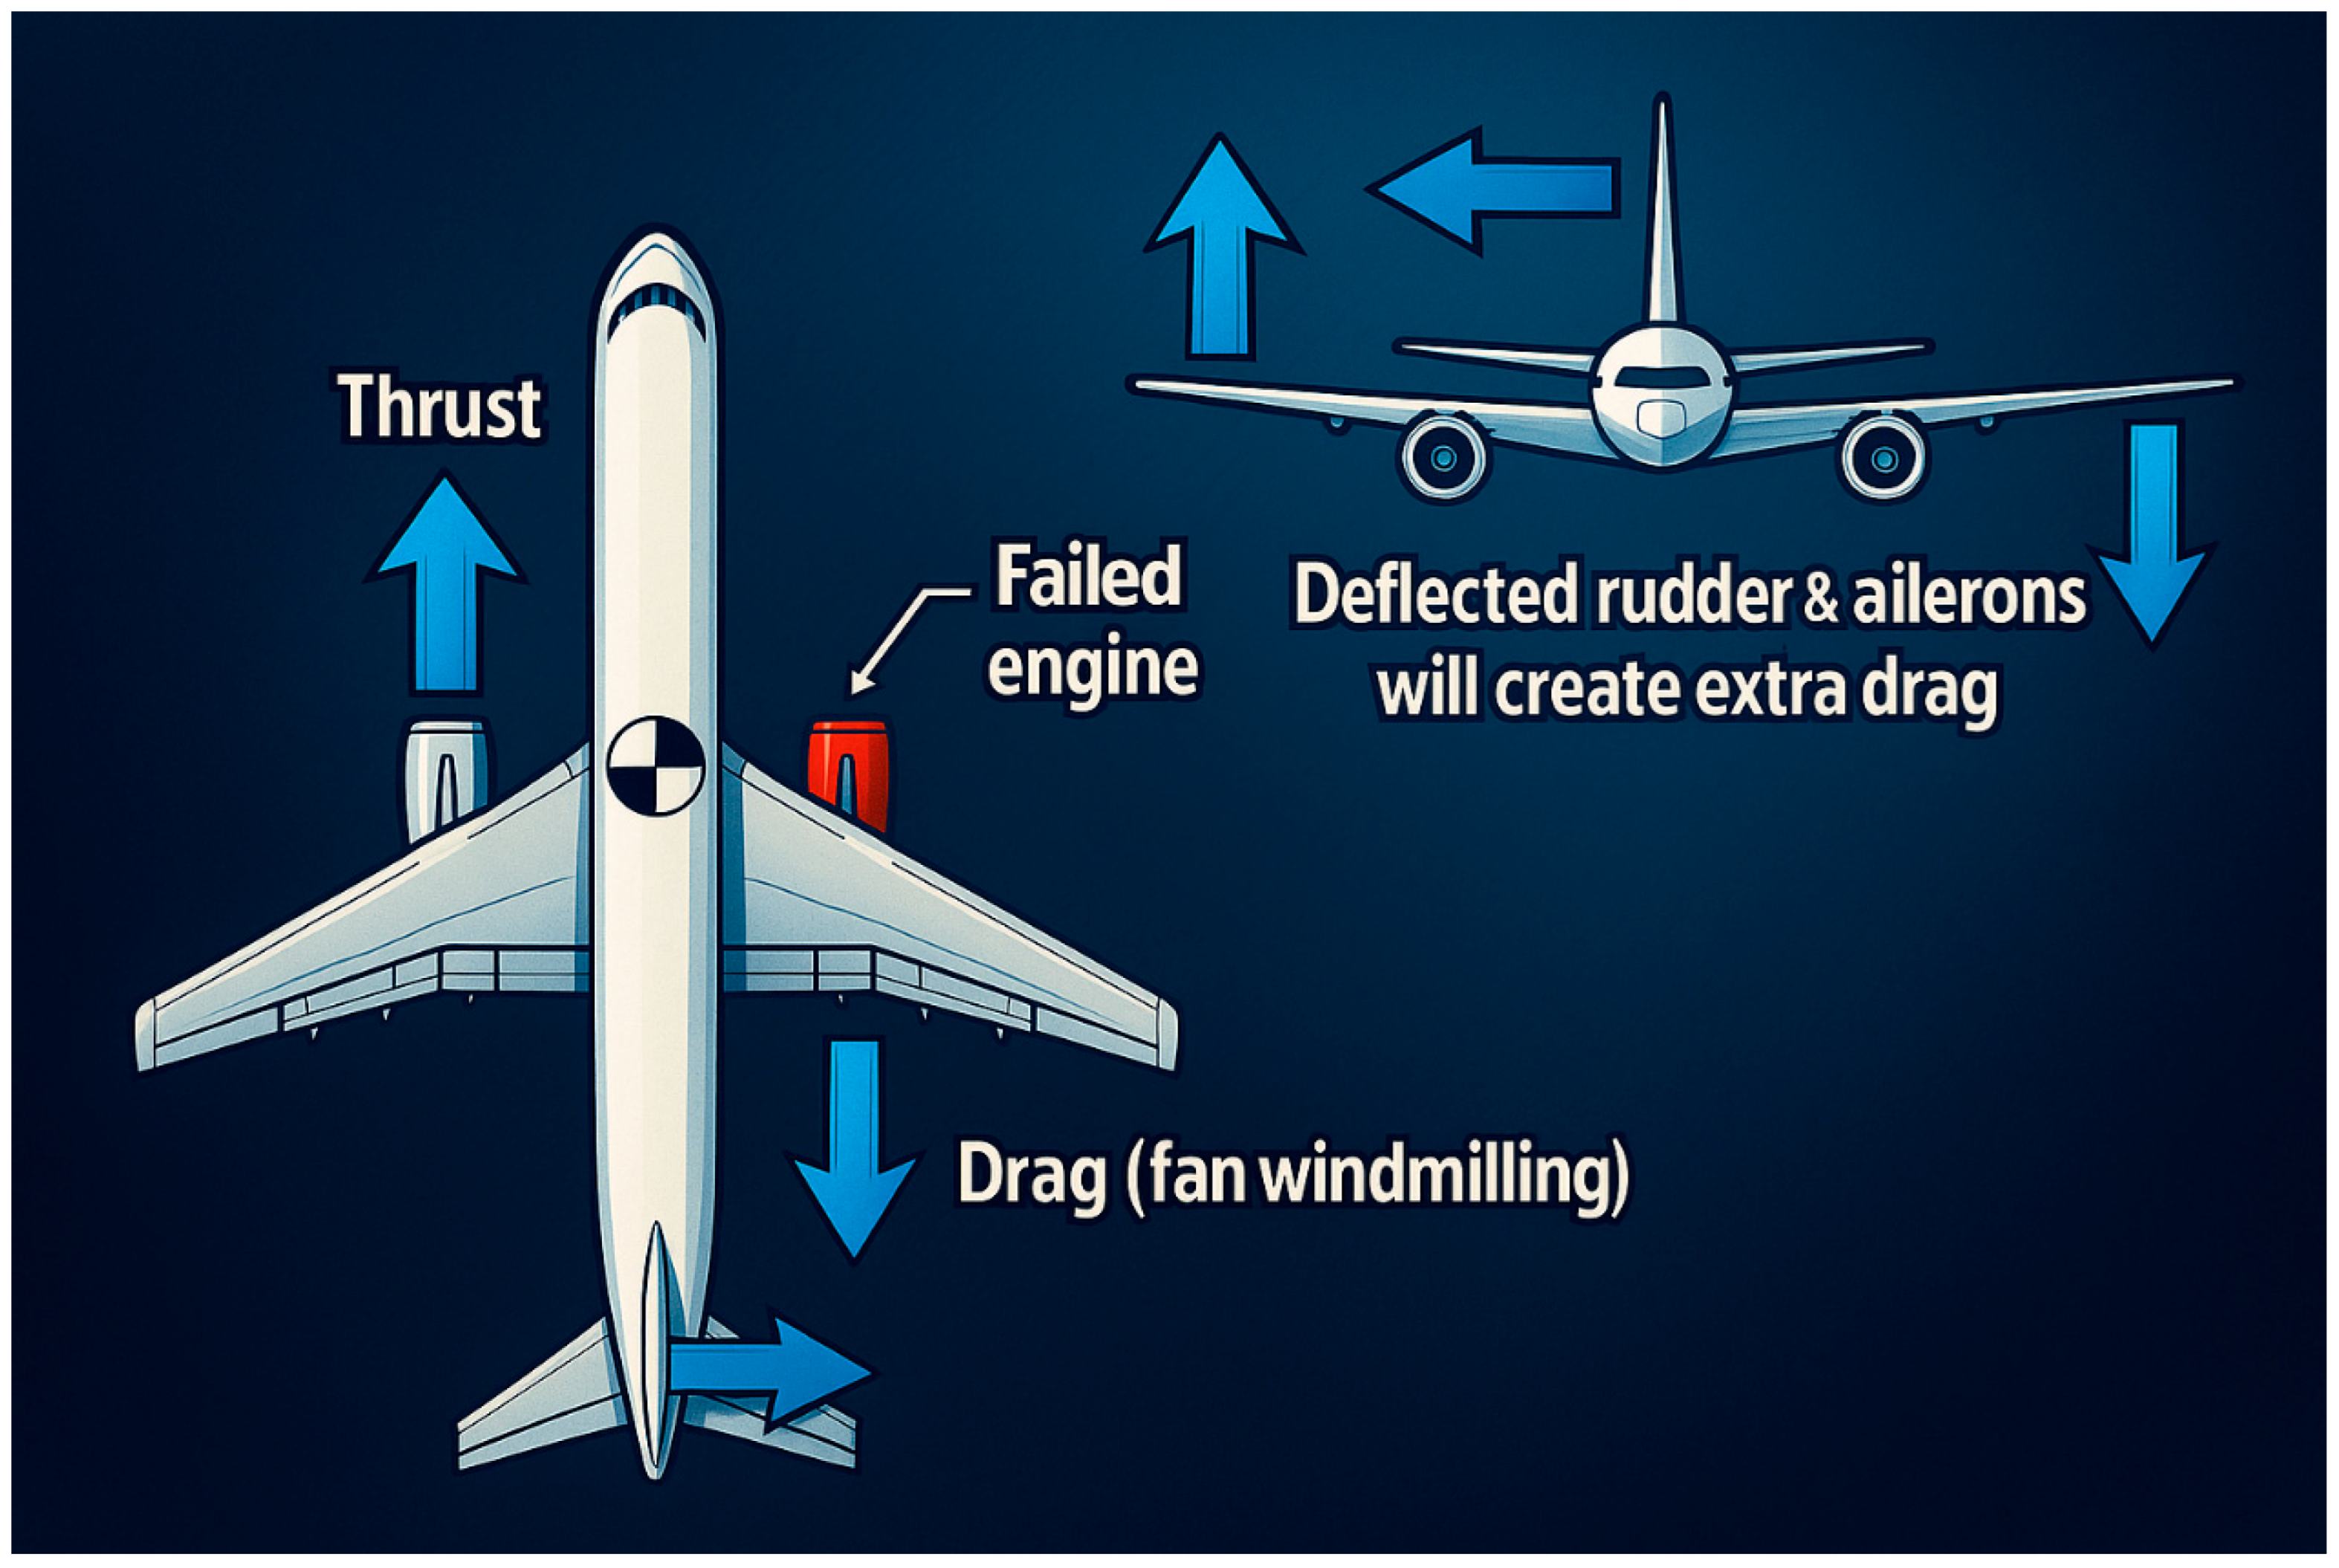
Unlike the wing, the tail generally operates at only a fraction of its potential lift capability (for the vertical tail, the lateral force is equivalent to the lift produced by the wing). During normal flight, the aircraft experiences symmetrical conditions, resulting in no unbalanced aerodynamic yawing moment, and therefore, no trimming is required. However, trim becomes necessary in multi-engine aircraft under one-engine-inoperative (OEI) conditions [
22]. The lack of thrust on one side of the plane, as well as the increased drag from the failed engine, or so-called “windmilling” effect, results in a yawing moment [
23]. Windmilling in aviation refers to the process where the turbine blades of the engine keep rotating due to airflow through the engine without generating thrust anymore [
24]. This can occur when an engine fails or is intentionally shut down in flight, and the aircraft’s forward motion drives air through the engine, causing it to spin freely and the turbine blades to rotate. This condition is illustrated in
Figure 2. Under such circumstances, the vertical tail also contributes to maintaining yaw stability. While it is theoretically possible to design a directionally stable aircraft without a vertical tail, doing so typically imposes additional design trade-offs in other areas [
25].
The aerodynamic behavior of the vertical tail is highly sensitive to variations in sideslip angle and rudder deflection, both of which give rise to complex three-dimensional flow phenomena [
26,
27]. Under low β and δ values, in general, the flow is attached, and linear aerodynamic models are able to predict fairly satisfactorily yawing moment behavior. However, with sideslip and rudder input being combined at larger values of these angles, nonlinear aerodynamic effects such as flow separation [
28], vortex formation, and unsteady wake interaction become highly significant. These effects diminish the efficiency of the rudder, alter the yawing moment derivatives, and under extreme conditions, cause directional instability. The combined effect of β and δ not only shapes the pressure distribution on the vertical tail surface but also identifies the onset and development of flow separation. High-fidelity aerodynamic modeling is thus essential for accurate prediction. An accurate appreciation of this interaction is important not only for the design of robust control laws but also for the sake of ensuring that the structural and operational limits of the empennage are not violated in the certification of the aircraft.
The form of the vertical tail is inseparable from that of the vertical control surface, or rudder. For the rudder, sufficient control authority must be ensured under all critical conditions, such as engine-out scenarios at low airspeeds, crosswind landings, maximum roll rates, and spin recovery situations [
29]. Control capability refers to the increase in lateral force generated by the vertical tail as a result of rudder deflection. This capability depends on factors such as the size, type of rudder, and the overall surface area of the vertical tail [
30,
31].
The design requirements and criteria for the vertical tail can be summarized as follows [
32,
33,
34,
35]:
- ▪
Provide adequate static lateral stability, which entails generating sufficient force to counteract the total aerodynamic forces and moments in the lateral plane of motion.
- ▪
Ensure sufficient dynamic stability.
- ▪
Prevent vertical tail stall at high sideslip angles resulting from rudder-induced oscillations or sudden engine failure.
The principal requirements on the rudder are as follows:
- ▪
Permitting the aircraft to achieve a trimmed, stable flight condition.
- ▪
Providing a method of rejection of disturbances, e.g., in gust encounters.
- ▪
Having sufficient directional control authority, even at high sideslip and rudder deflection angles (e.g., to fly maximum yaw-rate maneuvers, to provide control in critical engine-out conditions, or to perform crosswind landings with wind speeds of up to 55 km/h).
- ▪
Maintaining low control forces.
Of these, the most critical requirements tend to be safe landing in maximum crosswind conditions, directional control during engine-out at low speeds, and high-angle-of-attack conditions on the horizontal tail. The vertical tail, as such, is sized to meet these three specifications, and one additional requirement of possessing adequate directional and lateral static stability. The overarching goal is to satisfy these demands with a configuration that minimizes both drag and structural weight.
These requirements guide the design variables of the vertical tail in various directions. For managing high angles of attack, a low aspect ratio and greater sweep angle are desirable, while high static stability is better achieved with a high aspect ratio and minimal sweep. Among all, the most demanding requirement is coping with high-angle-of-attack conditions. Therefore, vertical tail designs are typical of low aspect ratios and heavily swept leading edges [
36,
37].
The vertical tail plays a critical role in directional stability and control throughout the flight envelope [
38]. The most difficult part of designing the vertical tail is to find the best compromise between aerodynamic performance and structural stability. The tail must be capable of withstanding aerodynamic loads but minimal in drag to enhance overall aircraft performance [
39]. Additionally, optimizing the tail size and shape to ensure sufficient yaw stability without causing unnecessary drag and weight is another key challenge. To determine the most effective vertical tail configuration, airspeed, weight, and center of gravity of the aircraft must be carefully considered. Furthermore, gust response, flutter characteristics, and the effectiveness of the control system must be considered in the design. A condition that the vertical tail can resist adverse yaw and deliver the necessary control authority is essential to maintaining flight safety and stability [
40,
41,
42].
To achieve optimal performance and safety, vertical tail design must balance aerodynamic, structural, and control considerations. Understanding and optimizing aircraft stability and control characteristics requires studying aerodynamic forces, such as side forces and drag at various sideslip and rudder deflection angles. Yaw motion is controlled by the side force, which acts perpendicular to the flight path. It is possible to identify configurations that yield stable yaw control by analyzing side force variations with sideslip angle and rudder deflection angle [
43,
44]. Similarly, drag affects overall aircraft performance and efficiency. It is through knowing how drag changes with varying sideslip and rudder deflection angles that aircraft engineers are able to discover where drag can be minimized and fuel efficiency enhanced. It is crucial to use this information in ensuring the vertical tail is optimized to avoid drag at a minimum while stability and control properties are maintained as required. It also renders engineers capable of anticipating and making provision against potential issues, such as aerodynamic instability or excessive drag. Through detailed studies and simulations of these forces, designers can make informed decisions that enhance the aircraft’s overall performance, safety, and efficiency. As such, evaluating the behavior of side force and drag across different sideslip and rudder angles is fundamental to optimizing the vertical tail for stability, control, and efficiency.
The lateral stability of aircraft has been extensively addressed in the literature [
37,
45,
46]. Regarding lateral control, it has been shown that rudder control authority is strongly influenced by the slope of the side force curve, control surface effectiveness, and the vertical tail volume coefficient [
45]. Therefore, aircraft designers require an accurate estimation of the side force slope. Nicolosi et al. [
45] demonstrated that conventional aircraft design methods tend to underestimate rudder effectiveness at high deflection angles by approximately 15% to 25%, which can lead to an overestimation of the required control surface area. Optimization of the rudder for a given aircraft model has been achieved using multilevel optimization methods [
47]. Required rudder deflection angles for flying under sideslip conditions have been investigated for a turboprop aircraft with two different vertical tail cross-section shapes [
37].
A review of previous research shows that most aerodynamics effort has been focused on wing sections and control surfaces, and there is a lack of published data on the aerodynamic coefficients for the vertical tail fin. Additionally, most of the aerodynamic coefficients for vertical tails that have been reported are for high Reynolds numbers. There isn’t much data available for low Reynolds numbers for passenger aircraft vertical tails. Thus, this study seeks to furnish aerodynamic coefficients for the Boeing 777-200 vertical tail at low speeds, pertinent to flight phases such as takeoff and landing, serving as a reference benchmark for subsequent research. The primary objective of this research, given the existing research gap and lack of aerodynamic coefficients for vertical tails at various rudder deflection angles and sideslip angles, is to provide experimental aerodynamic data for a vertical tail with a given geometry as a reference and validation baseline in future research works dealing with aerodynamic enhancement using flow control actuators. This study offers beneficial information that will contribute to the design process, which in turn will lead to more reliable and safer aircraft with improved performance capabilities. Based on the available data, it is possible to perform preliminary sizing of the vertical tail as an isolated component during the early stages of design. In later stages, with the inclusion of information on the horizontal tail and other aircraft components such as the wing and fuselage, along with a comprehensive analysis of directional and lateral stability and control characteristics, the final sizing of the tail surfaces can be determined.
2. Statistical Analysis of Key Vertical Tail Parameters
In this section, the key parameters of the vertical tail of about 65 passenger jet aircraft are analyzed. The data pertaining to the vertical tails of these 65 aircraft are provided in the attached Excel file (
Supplementary file). The primary source for this information is Jane’s series of annual publications [
48], with the relevant data organized as presented in reference [
40]. Most of this data is from well-known aircraft manufacturers such as Boeing, Airbus, and Douglas, and the rest is from other companies such as British Aerospace, Canadair, Embraer, and Fokker. The most important geometric parameters of the vertical tail of an aircraft are area, height, aspect ratio, taper ratio, tail arm, and volume coefficient. The surface area of an aircraft’s vertical tail is a fundamental design parameter that determines the directional stability and yaw controllability of the aircraft, and the larger this area, the more efficient the tail is in responding to disturbances caused by side slip, asymmetric thrust conditions and crosswind operations. The size of the vertical tail area has to be such that it provides sufficient aerodynamic torque to counteract the yaw tendencies. It should be minimized simultaneously to avoid additional weight and drag that can negatively effect fuel efficiency and overall performance. Determining this area during the design stages requires multi-objective optimization involving aerodynamic, structural, and operational considerations to obtain a compromise between stability, controllability, and efficiency. For this reason, this parameter is a critical component of the overall aircraft design framework.
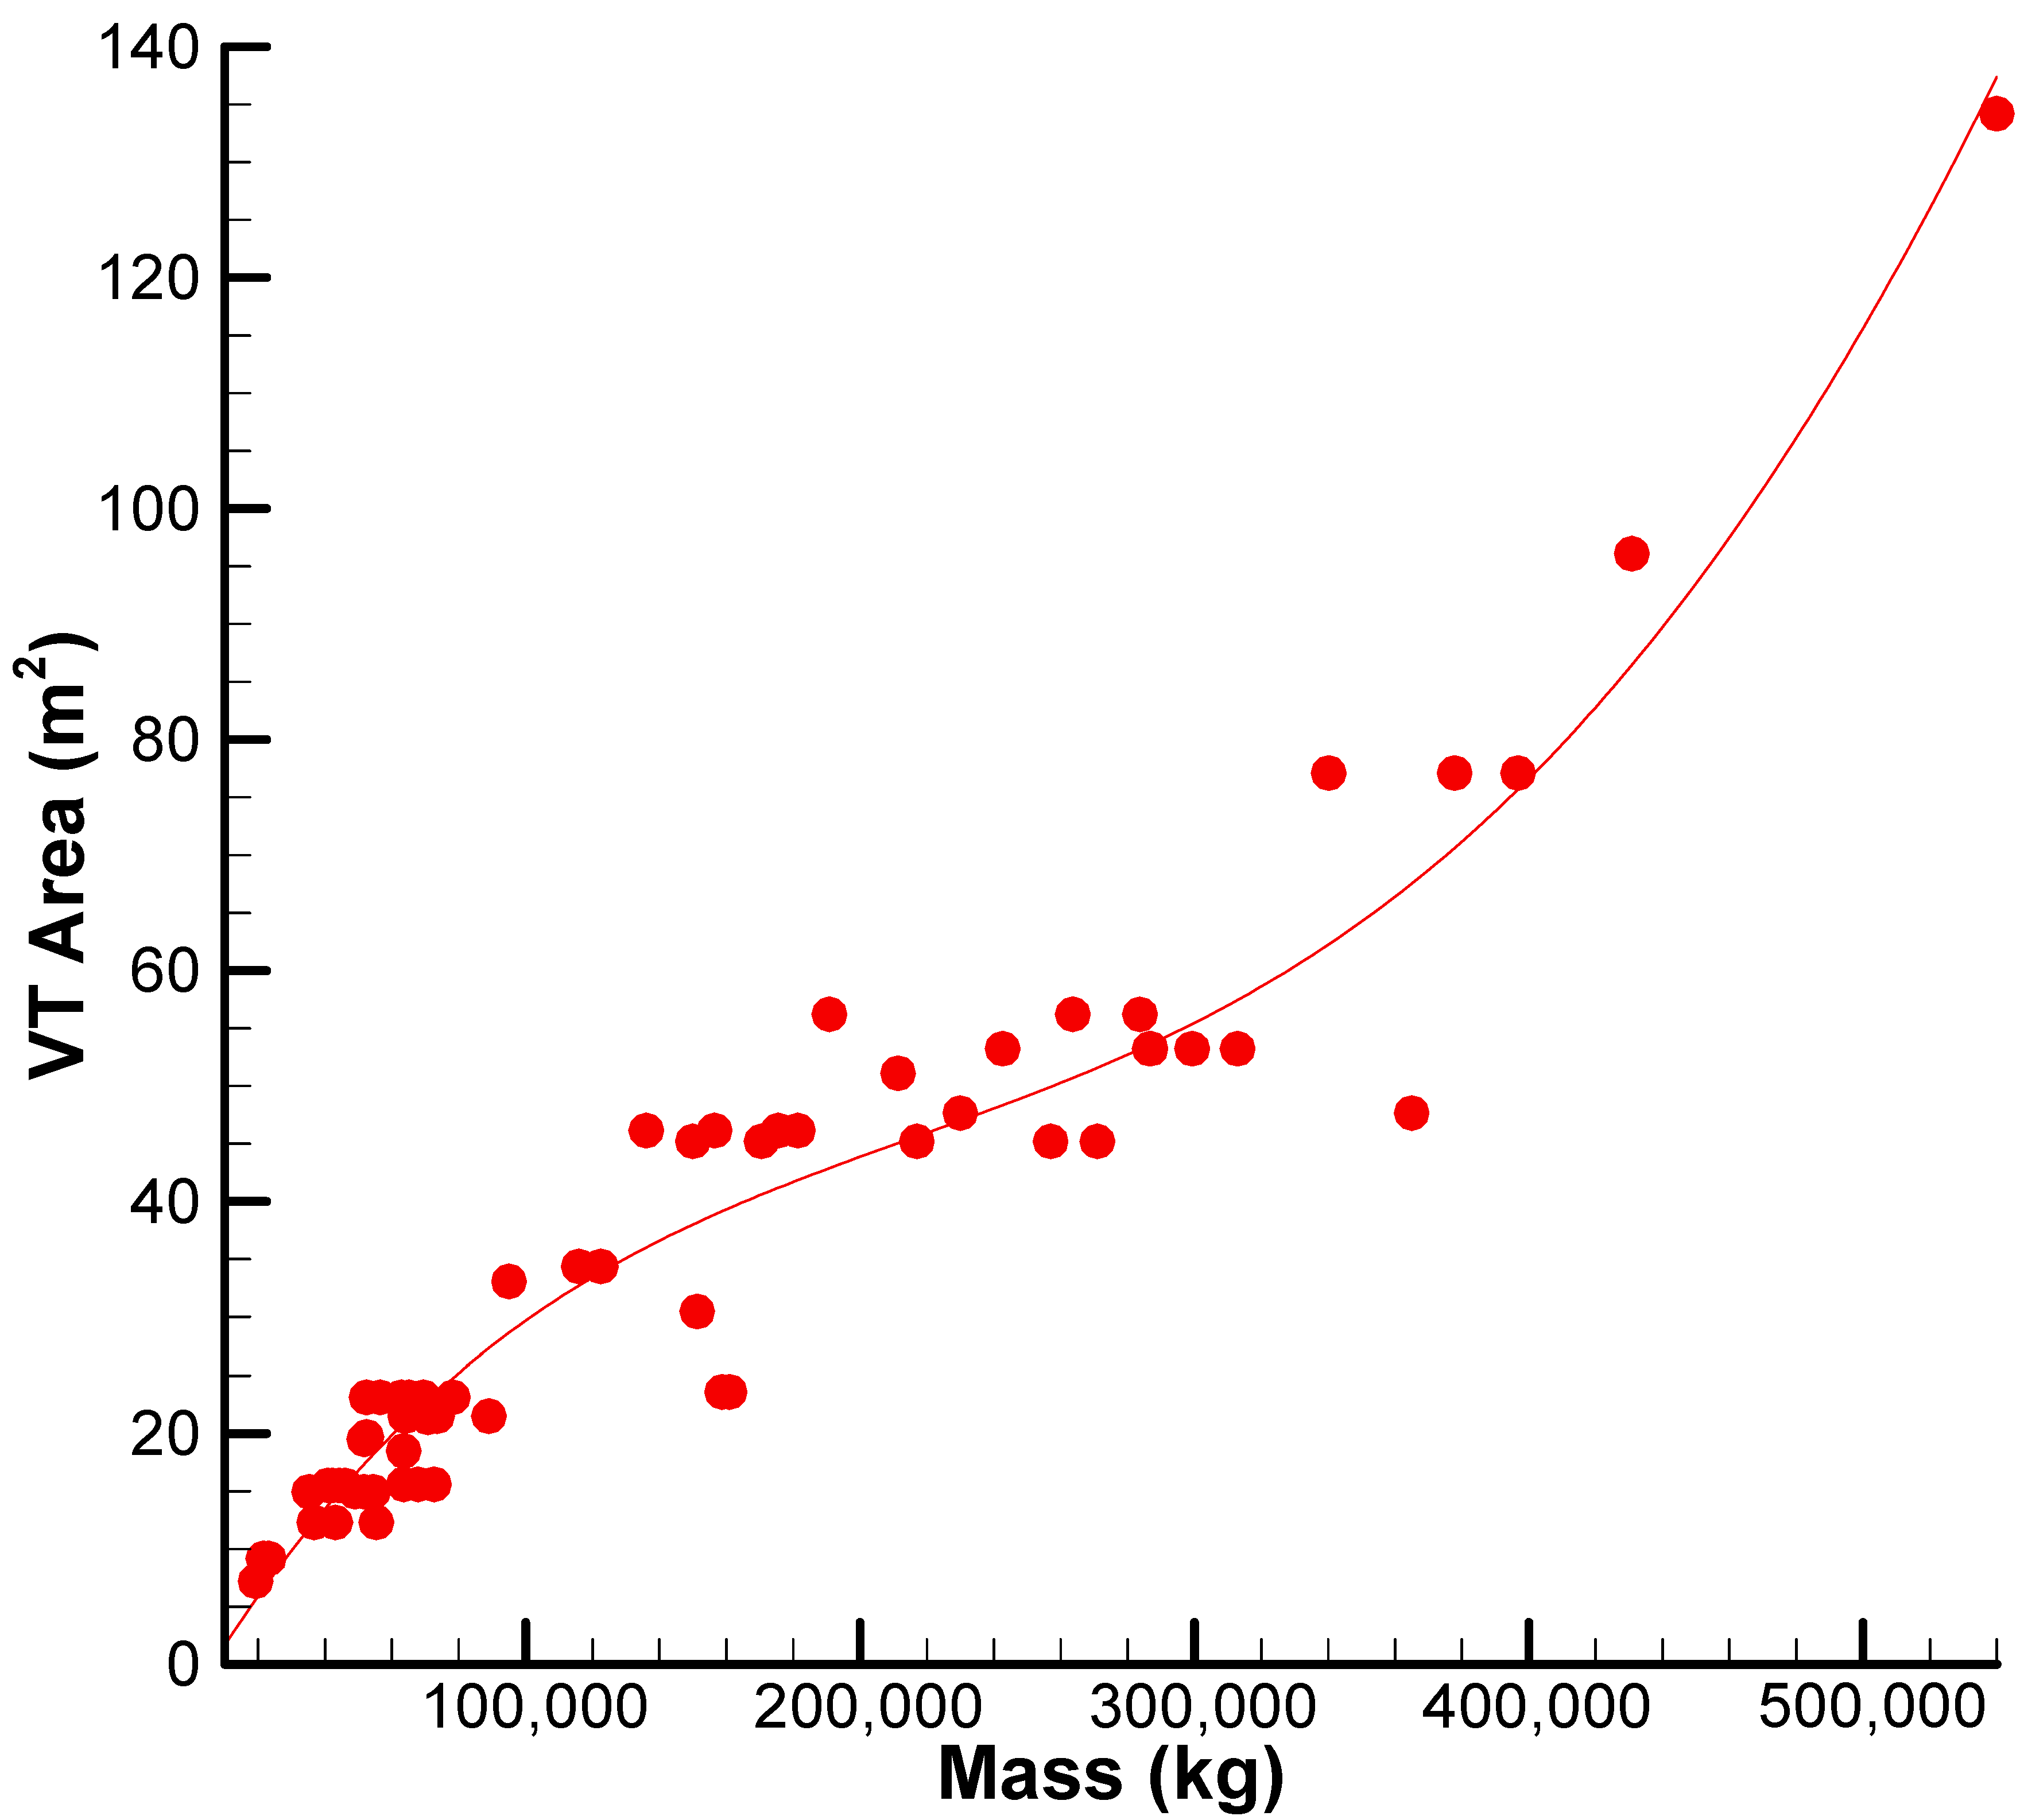
Figure 3 shows the statistical value of the vertical tail (VT) surface area against the maximum takeoff mass for 65 civil jet aircraft. The fourth-order polynomial trend of the best-fit curve can be seen in the scatter plot as having an obvious nonlinear relationship between VT and M, where for lower values of M, the area increases slowly. However, with growing M beyond a certain threshold, the rise in VT is more pronounced, indicating the growing need for directional stability and controllability in heavier aircraft. This increase in VT with M can be explained in terms of nonlinear aerodynamic and structural effects, including yaw stability margins, engine failure modes, and fuselage length. It must be noted that some data are exceptions from the overall tendency that may be caused by unique design philosophies or unique operating requirements of some aircrafts. Generally, the figure indicates the significance of vertical tail area size in large aircraft design and shows the increasing relevance of vertical stabilizer effectiveness with mass of the aircraft.
Airplane vertical tail height, or the distance from the bottom to the top of the vertical tail, is an important geometric parameter with implications on aerodynamic performance, structure design, and overall empennage integrity in civil jet airplanes. This dimension directly affects the moment arm available for the rudder and thus impacts yaw control authority and the aircraft’s ability to maintain directional stability under asymmetric flight conditions. An increase in the vertical tail increases the area of the surface exposed to the airflow above the fuselage boundary layer, and thus, it becomes aerodynamically more efficient, particularly at high sideslip angles. However, increasing the tail height also introduces structural challenges such as higher bending loads and added weight, as well as operational considerations including compatibility with hangars and airport height restrictions. In commercial passenger aircraft, vertical tail height is typically designed to range between 20% and 30% of the fuselage length, depending on configuration and mission requirements. Therefore, vertical tail height is a significant parameter for empennage geometry optimization that finds a balance between complementary interdependent requirements of aerodynamic efficiency, structural integrity, and operational practicability in modern civil aircraft design.
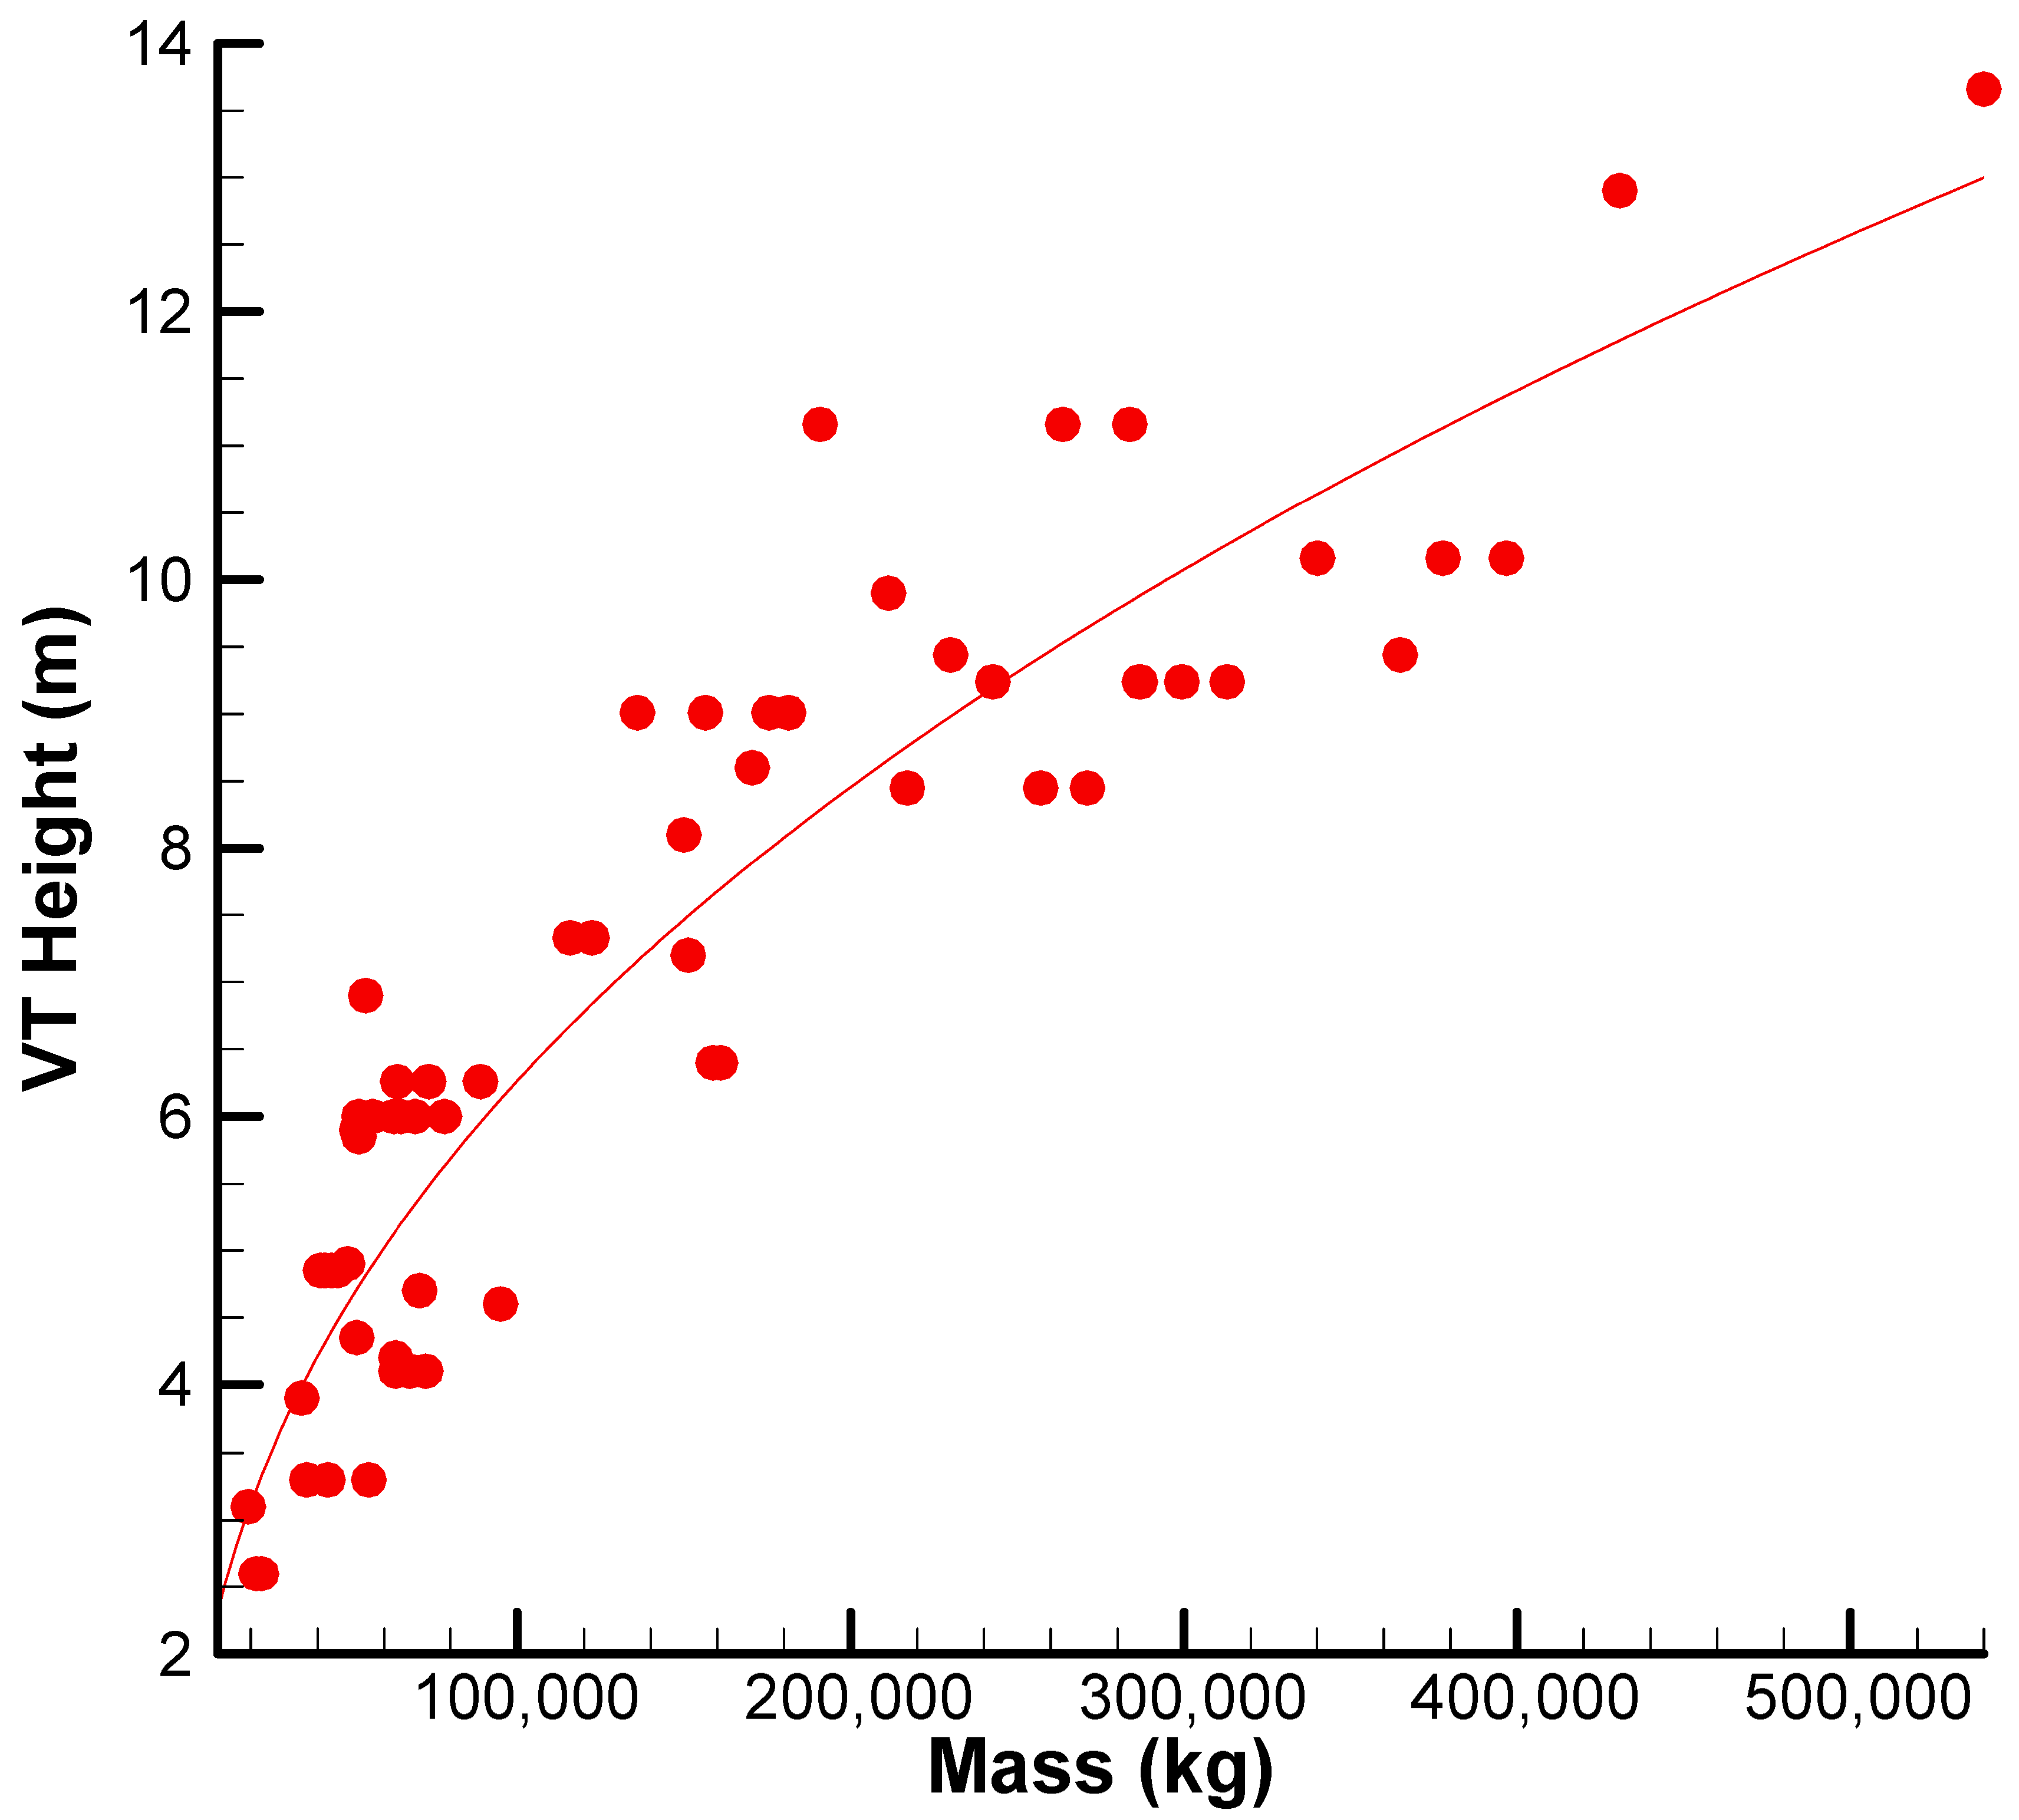
Figure 4 illustrates vertical tail height versus maximum takeoff mass for various civil jet aircraft. The data do have a clear and persistent pattern, which is well-fitted by a sub-linear power-law trend. Curve-fitting indicates vertical tail height to increase with aircraft mass but at a progressively diminishing rate as the aircraft gets heavier. A taller tail typically provides increased aerodynamic leverage by raising the vertical surface’s center of lift, thereby enhancing control effectiveness, especially during low-speed flight or asymmetric engine failure conditions.
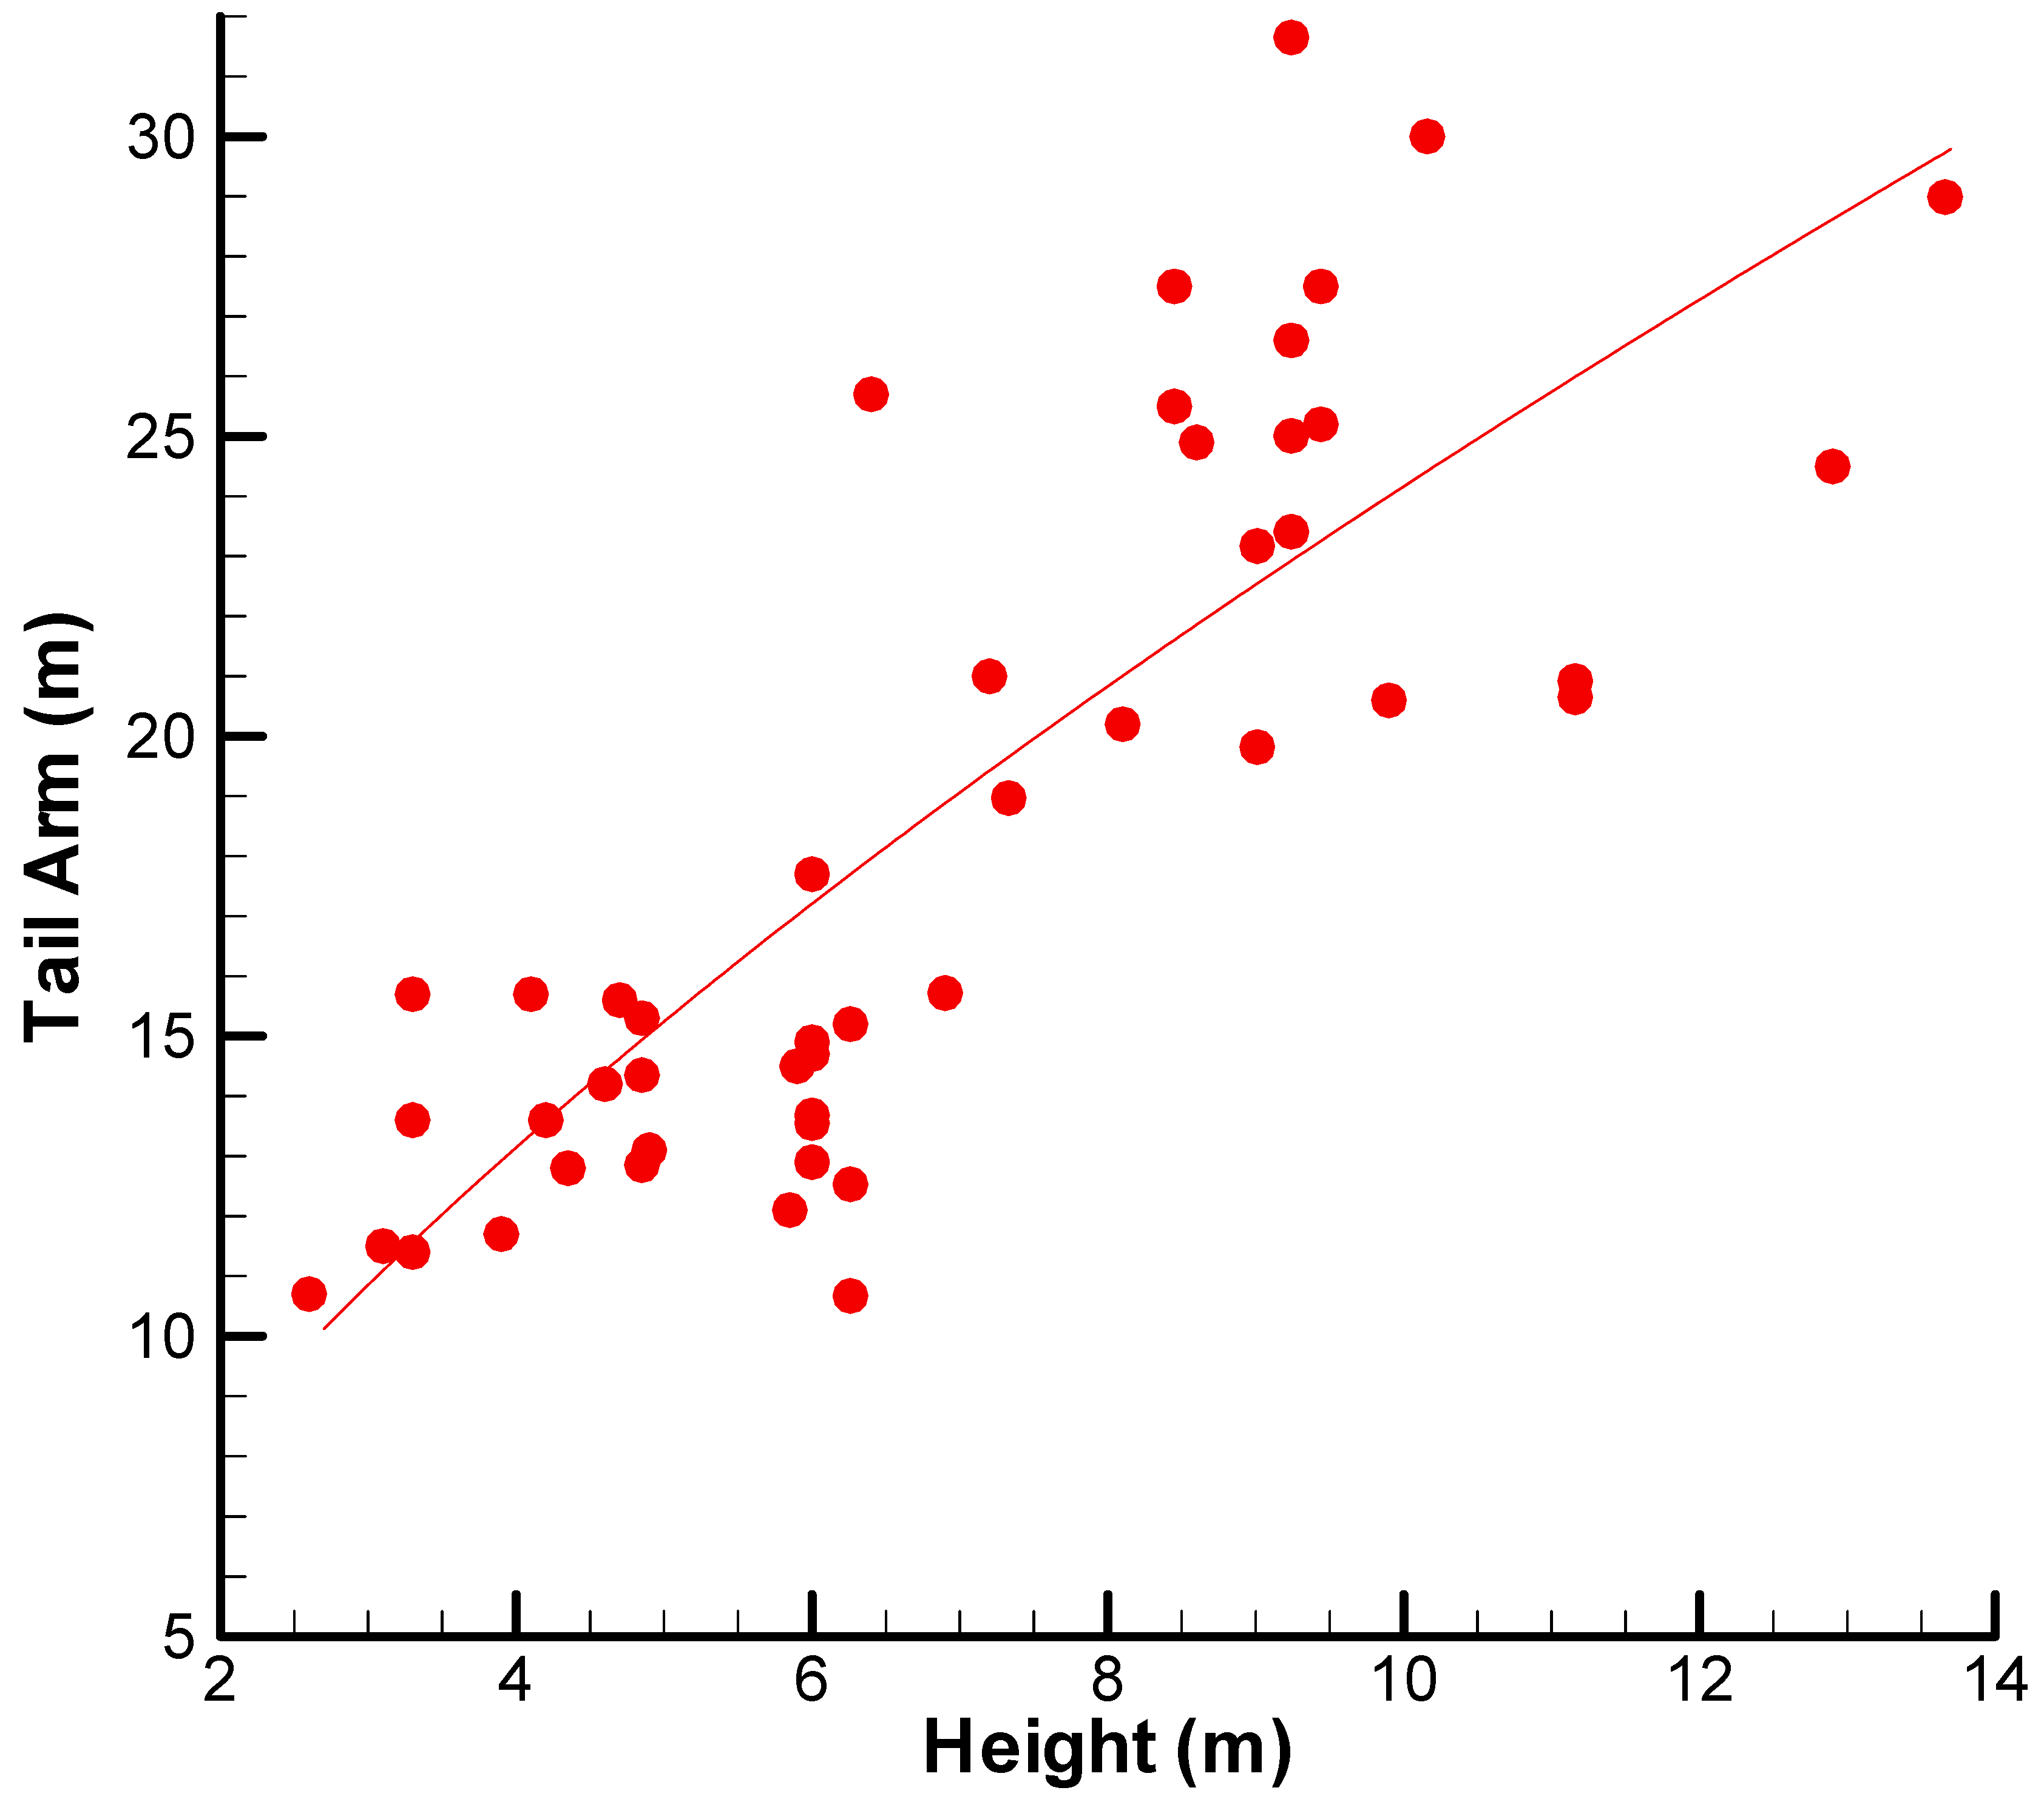
Figure 5 shows nonlinear increase in vertical tail arm as a function of tail height. Tail height escalation, however, is accompanied by structural concerns like high bending moments and potential vertical space constraints (e.g., hangar compatibility). The sub-linear trend in
Figure 4 shows the designers aim to keep vertical tail height growth as a percentage of aircraft mass low, opting for other geometrical parameters such as tail arm length and vertical tail surface area in order to achieve directional stability. The generally tight clustering of data points also implies that there is some standardization across manufacturers, a similar thinking of design that balances aerodynamic efficiency, structural weight, and producibility.
The aspect ratio of a vertical tail of an airplane is a key aerodynamic parameter with substantial influence on the vertical stabilizer’s performance and efficiency. It is calculated as the square of the tail span divided by the tail planform area. An increase in aspect ratio generally leads to a reduction in induced drag and enhances aerodynamic efficiency through a more favorable distribution of pressure along the span. However, increasing aspect ratios can also introduce structural challenges, such as increased bending moments and reduced torsional stiffness, particularly at the base of the vertical tail.
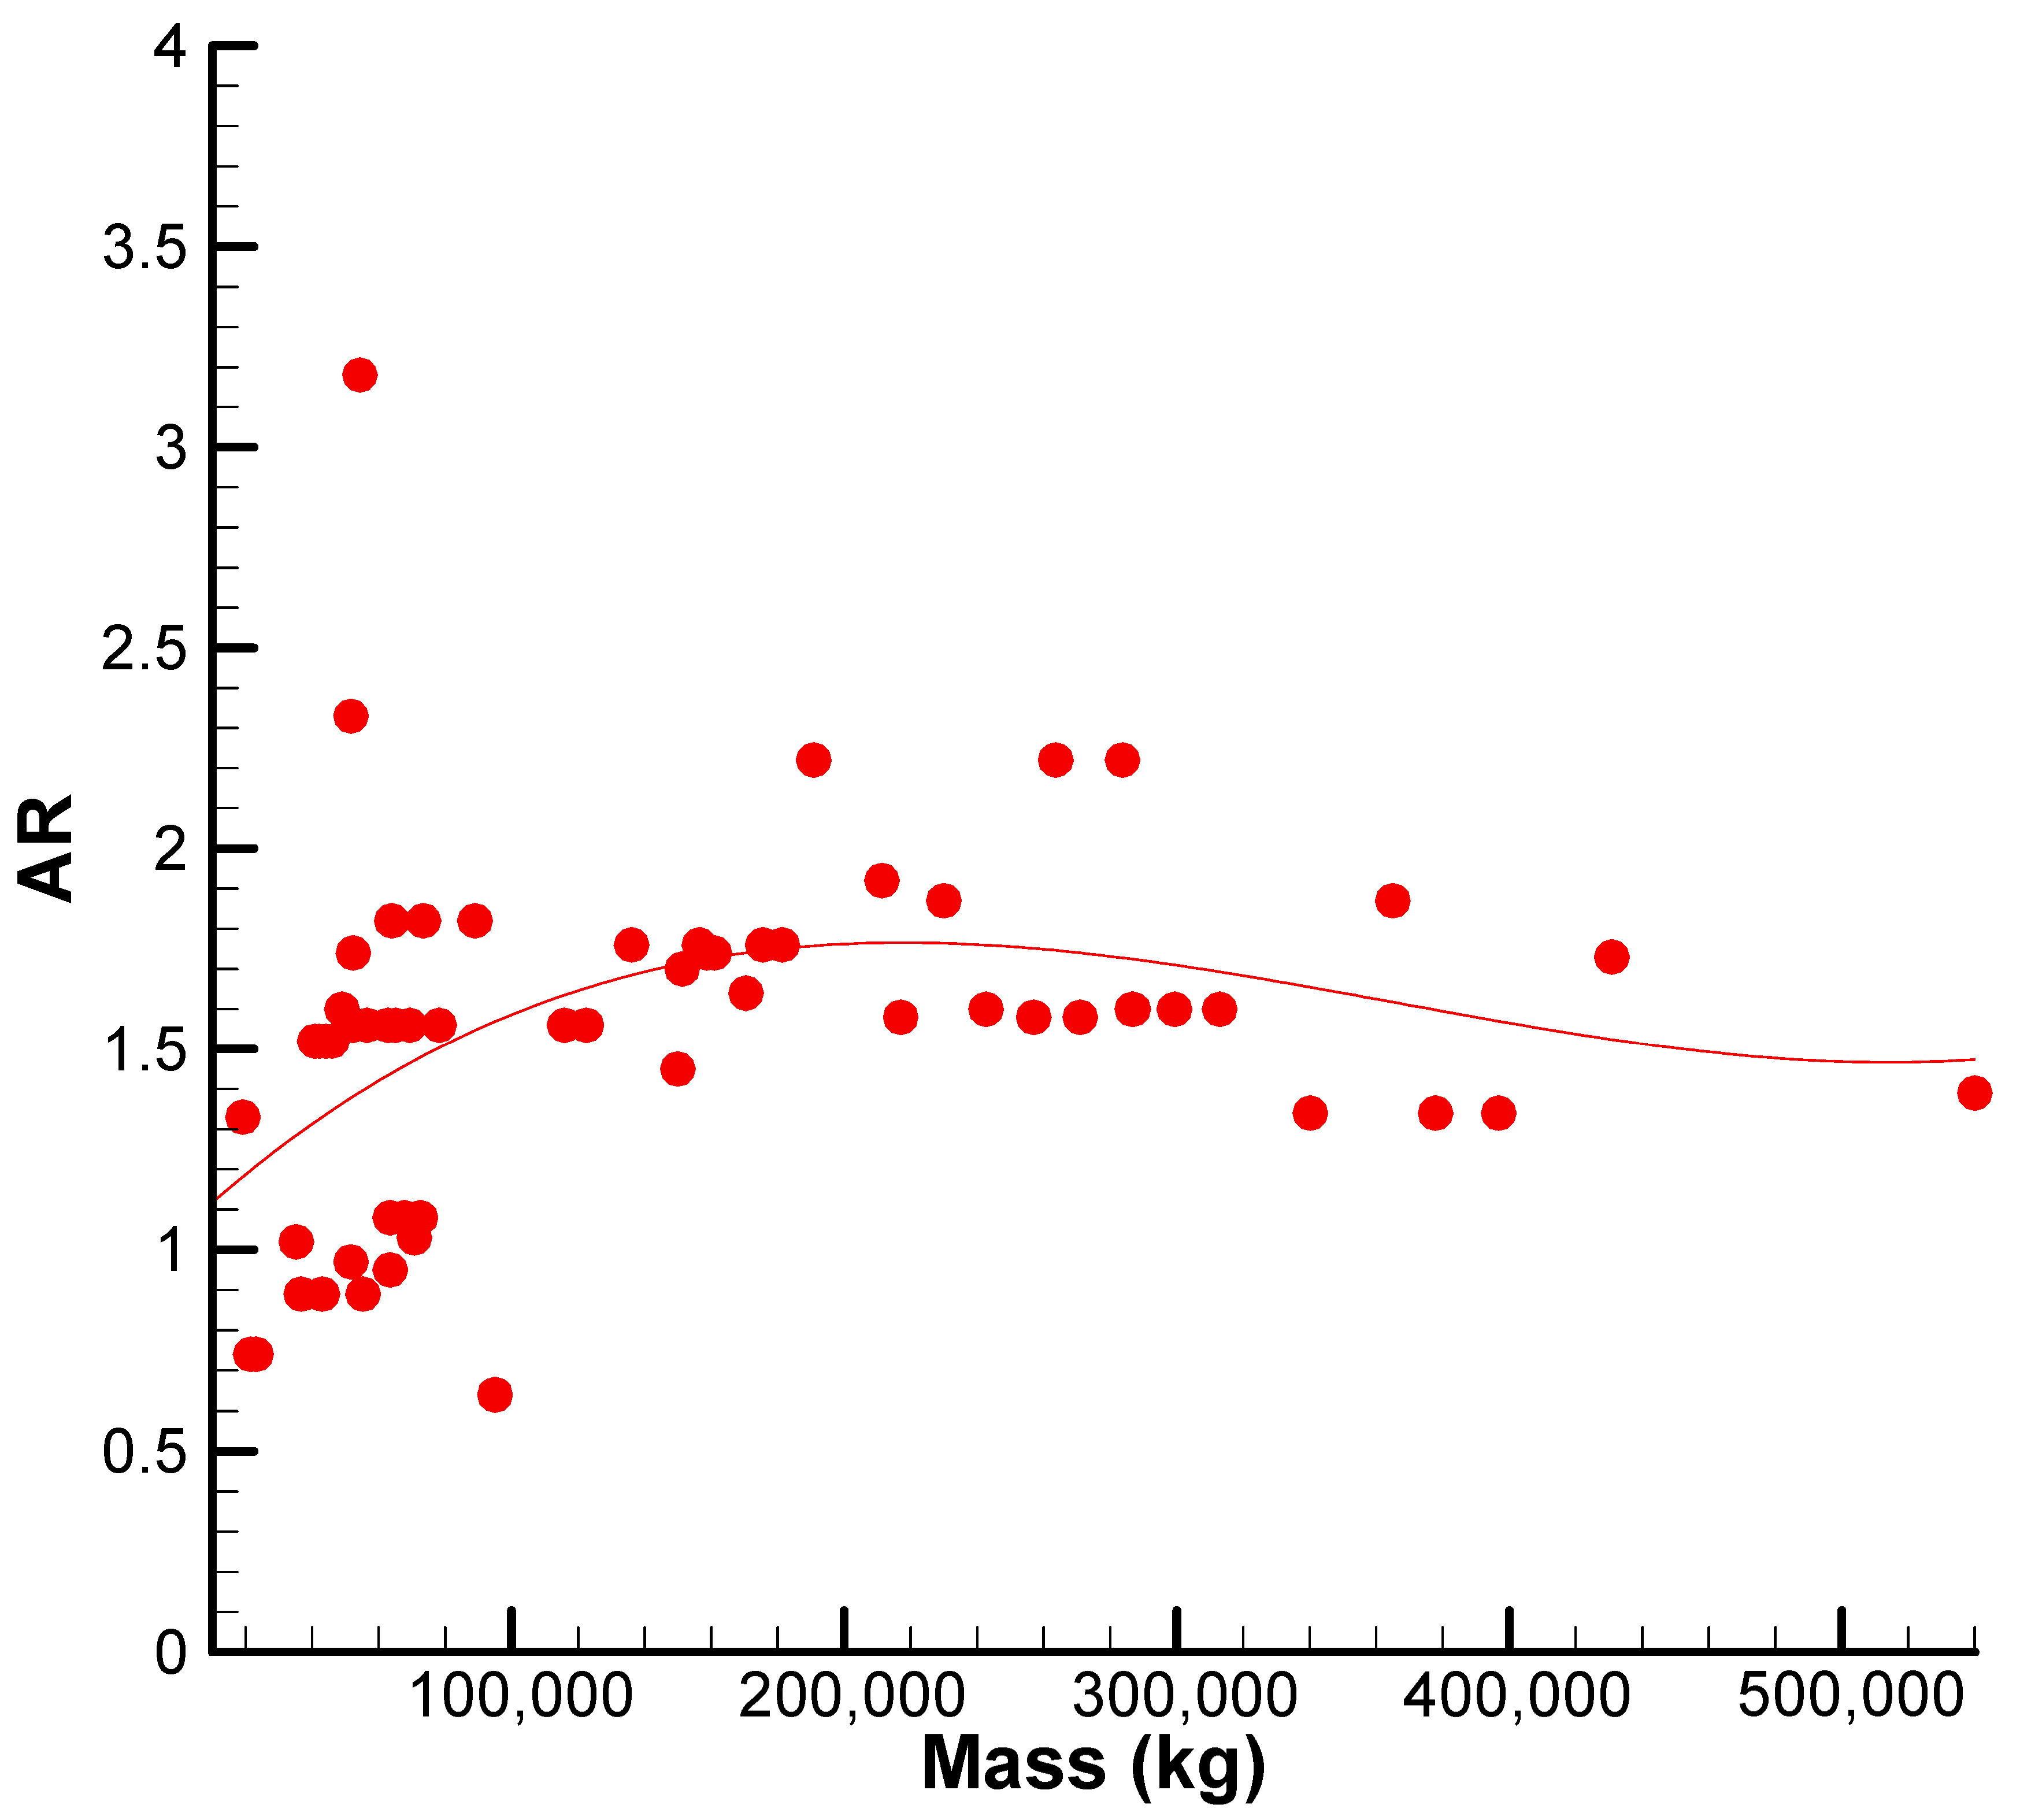
Figure 6 plots aspect ratio (AR) variation against maximum takeoff mass for a broad range of civil jet aircraft. The trend that is observed here is complex and non-monotonic and is typical of many subtle design compromises. The average aspect ratio for the dataset is AR = 1.55 and a standard deviation of 0.4. Most aircraft fall within an aspect ratio range of 0.9 to 1.9, indicating a balance between aerodynamic performance and structural feasibility. This variation is primarily driven by differences in operational requirements and aircraft design configurations. As the mass of aircraft increases, the range of AR values decreases and the aspect ratios converge to their statistical mean. This means lower vertical tail aspect ratios are desirable for heavier aircraft. Overall, the data indicate that lighter classes allow greater design flexibility in selecting a wider set of aspect ratios, whereas heavier classes have more converging design demands, tending vertical tail aspect ratios toward a narrower and more optimized lower end.
The taper ratio of the vertical tail of an airplane is one such key geometric parameter that influences both structural and aerodynamic performance. It is defined as the ratio of the tip chord length to the root chord length. It changes how pressure is spread across the vertical stabilizer, which helps the plane fly better and reduces drag. Further, the well-designed taper ratio enhances aircraft directional stability and the vertical tail’s effectiveness in flight under various conditions, particularly at high sideslip angles. Structurally, the taper ratio influences stress distribution, thus the weight and stiffness of the tail. It is possible to have uniform distribution of loading with higher taper ratios but this can also result in increased tip area and structure weight. Taper ratios of smaller magnitude, on the other hand, are used to reduce weight at the expense of compromising the efficiency of the control surface. Selecting an optimal taper ratio is thus a trade-off between aerodynamic requirements and structural constraints, playing a crucial role in the overall stability and control characteristics of the aircraft.
Figure 7 shows how the vertical tail taper ratio (TR) changes with maximum takeoff mass for different aircraft. The plot reveals a segmented, nonlinear relationship between TR and M. Most of the aircraft fall within a lower taper ratio band of 0.3 to 0.4, with the population mean at TR = 0.45 and a standard deviation of 0.18. Lighter aircraft, especially those under 100,000 kg, tend to have a wider and higher range of TR values, often going above 0.7. But as the takeoff mass goes up past that point, the taper ratio drops and starts to group together, mostly staying between 0.3 and 0.4 with not much variation. This grouping suggests that heavier aircraft are usually designed in a similar way, probably because of things like how strong they need to be, how easy they are to build, and what’s needed for stability in bigger planes.
Airplane vertical tail arm refers to the longitudinal distance between the aerodynamic center of the vertical stabilizer and the airplane’s center of gravity. The parameter is literally a crucial component in determining the yawing moment generated by the vertical tail and directly influences the airplane’s directional stability and control authority.
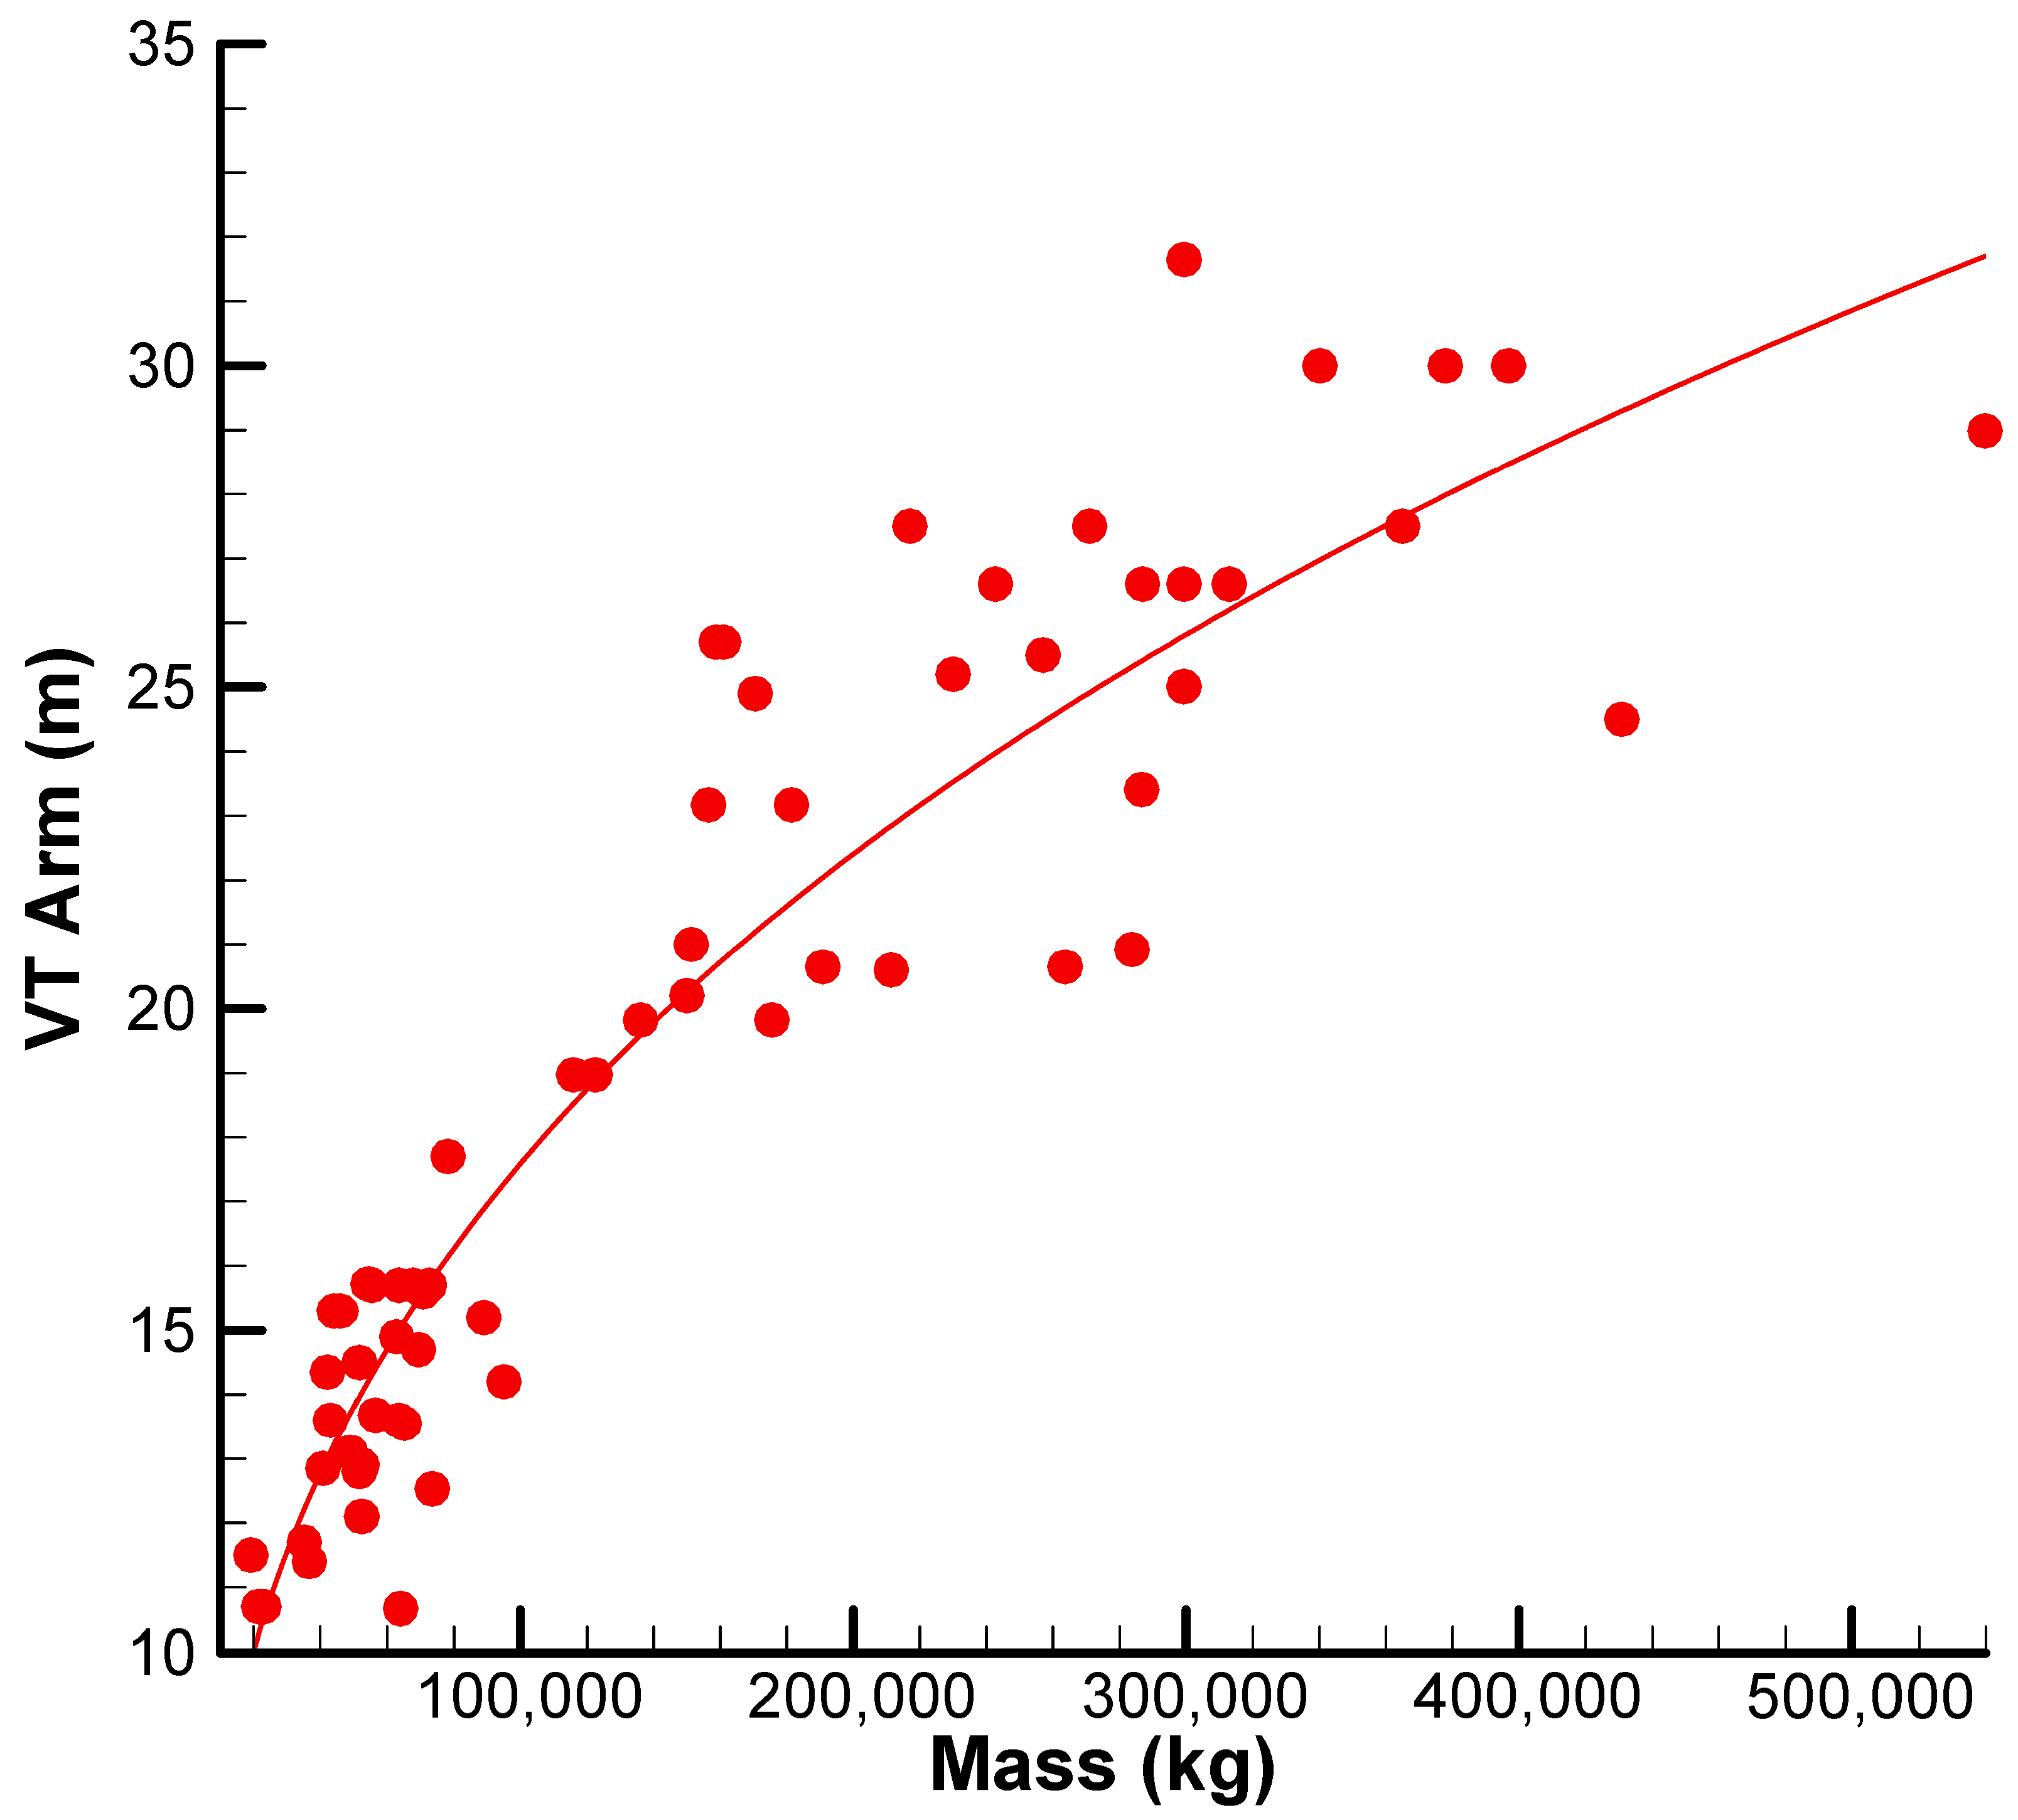
Figure 8 illustrates the variation of the vertical tail arm with maximum takeoff mass for certain civil jet aircraft. The data exhibit a clear correlation that is well-approximated by a sub-linear power-law curve. Although the vertical tail arm increases with aircraft mass, the rate of growth decreases for heavier aircraft.
From an engineering perspective, this phenomenon is a design trade-off. Longer moment arms increase the control authority of the vertical tail so that theoretically, tail surface area may be decreased to minimize structural weight and drag. Extremely long moment arms, however, can create structural challenges in the form of increased bending moments, increased stress levels, and tail integration problems with the aircraft fuselage. Accordingly, the tail arm is typically optimized for a limited range to reconcile the conflicting requirements of stability and control, structural efficiency, and overall aircraft configuration. The trend seen is in line with the notion that heavier aircraft require merely an incremental increase in length of tail arm and, to a larger degree, larger tail surface areas to meet directional stability requirements (also seen in
Figure 8).
The vertical tail volume coefficient is a dimensionless quantity that measures how effective the vertical tail is in contributing directional stability. For civil jet aircraft, the value of the coefficient depends on the overall aircraft configuration, engine position, and vertical tail design philosophy. The selection of an appropriate value will ensure that the aircraft has sufficient yaw stability without imposing weight penalties or drag-related unjustified vertical tail oversizing. As a result, it plays a vital role in the balance between stability, control, and aerodynamic efficiency in transport-category airplane design and optimization.
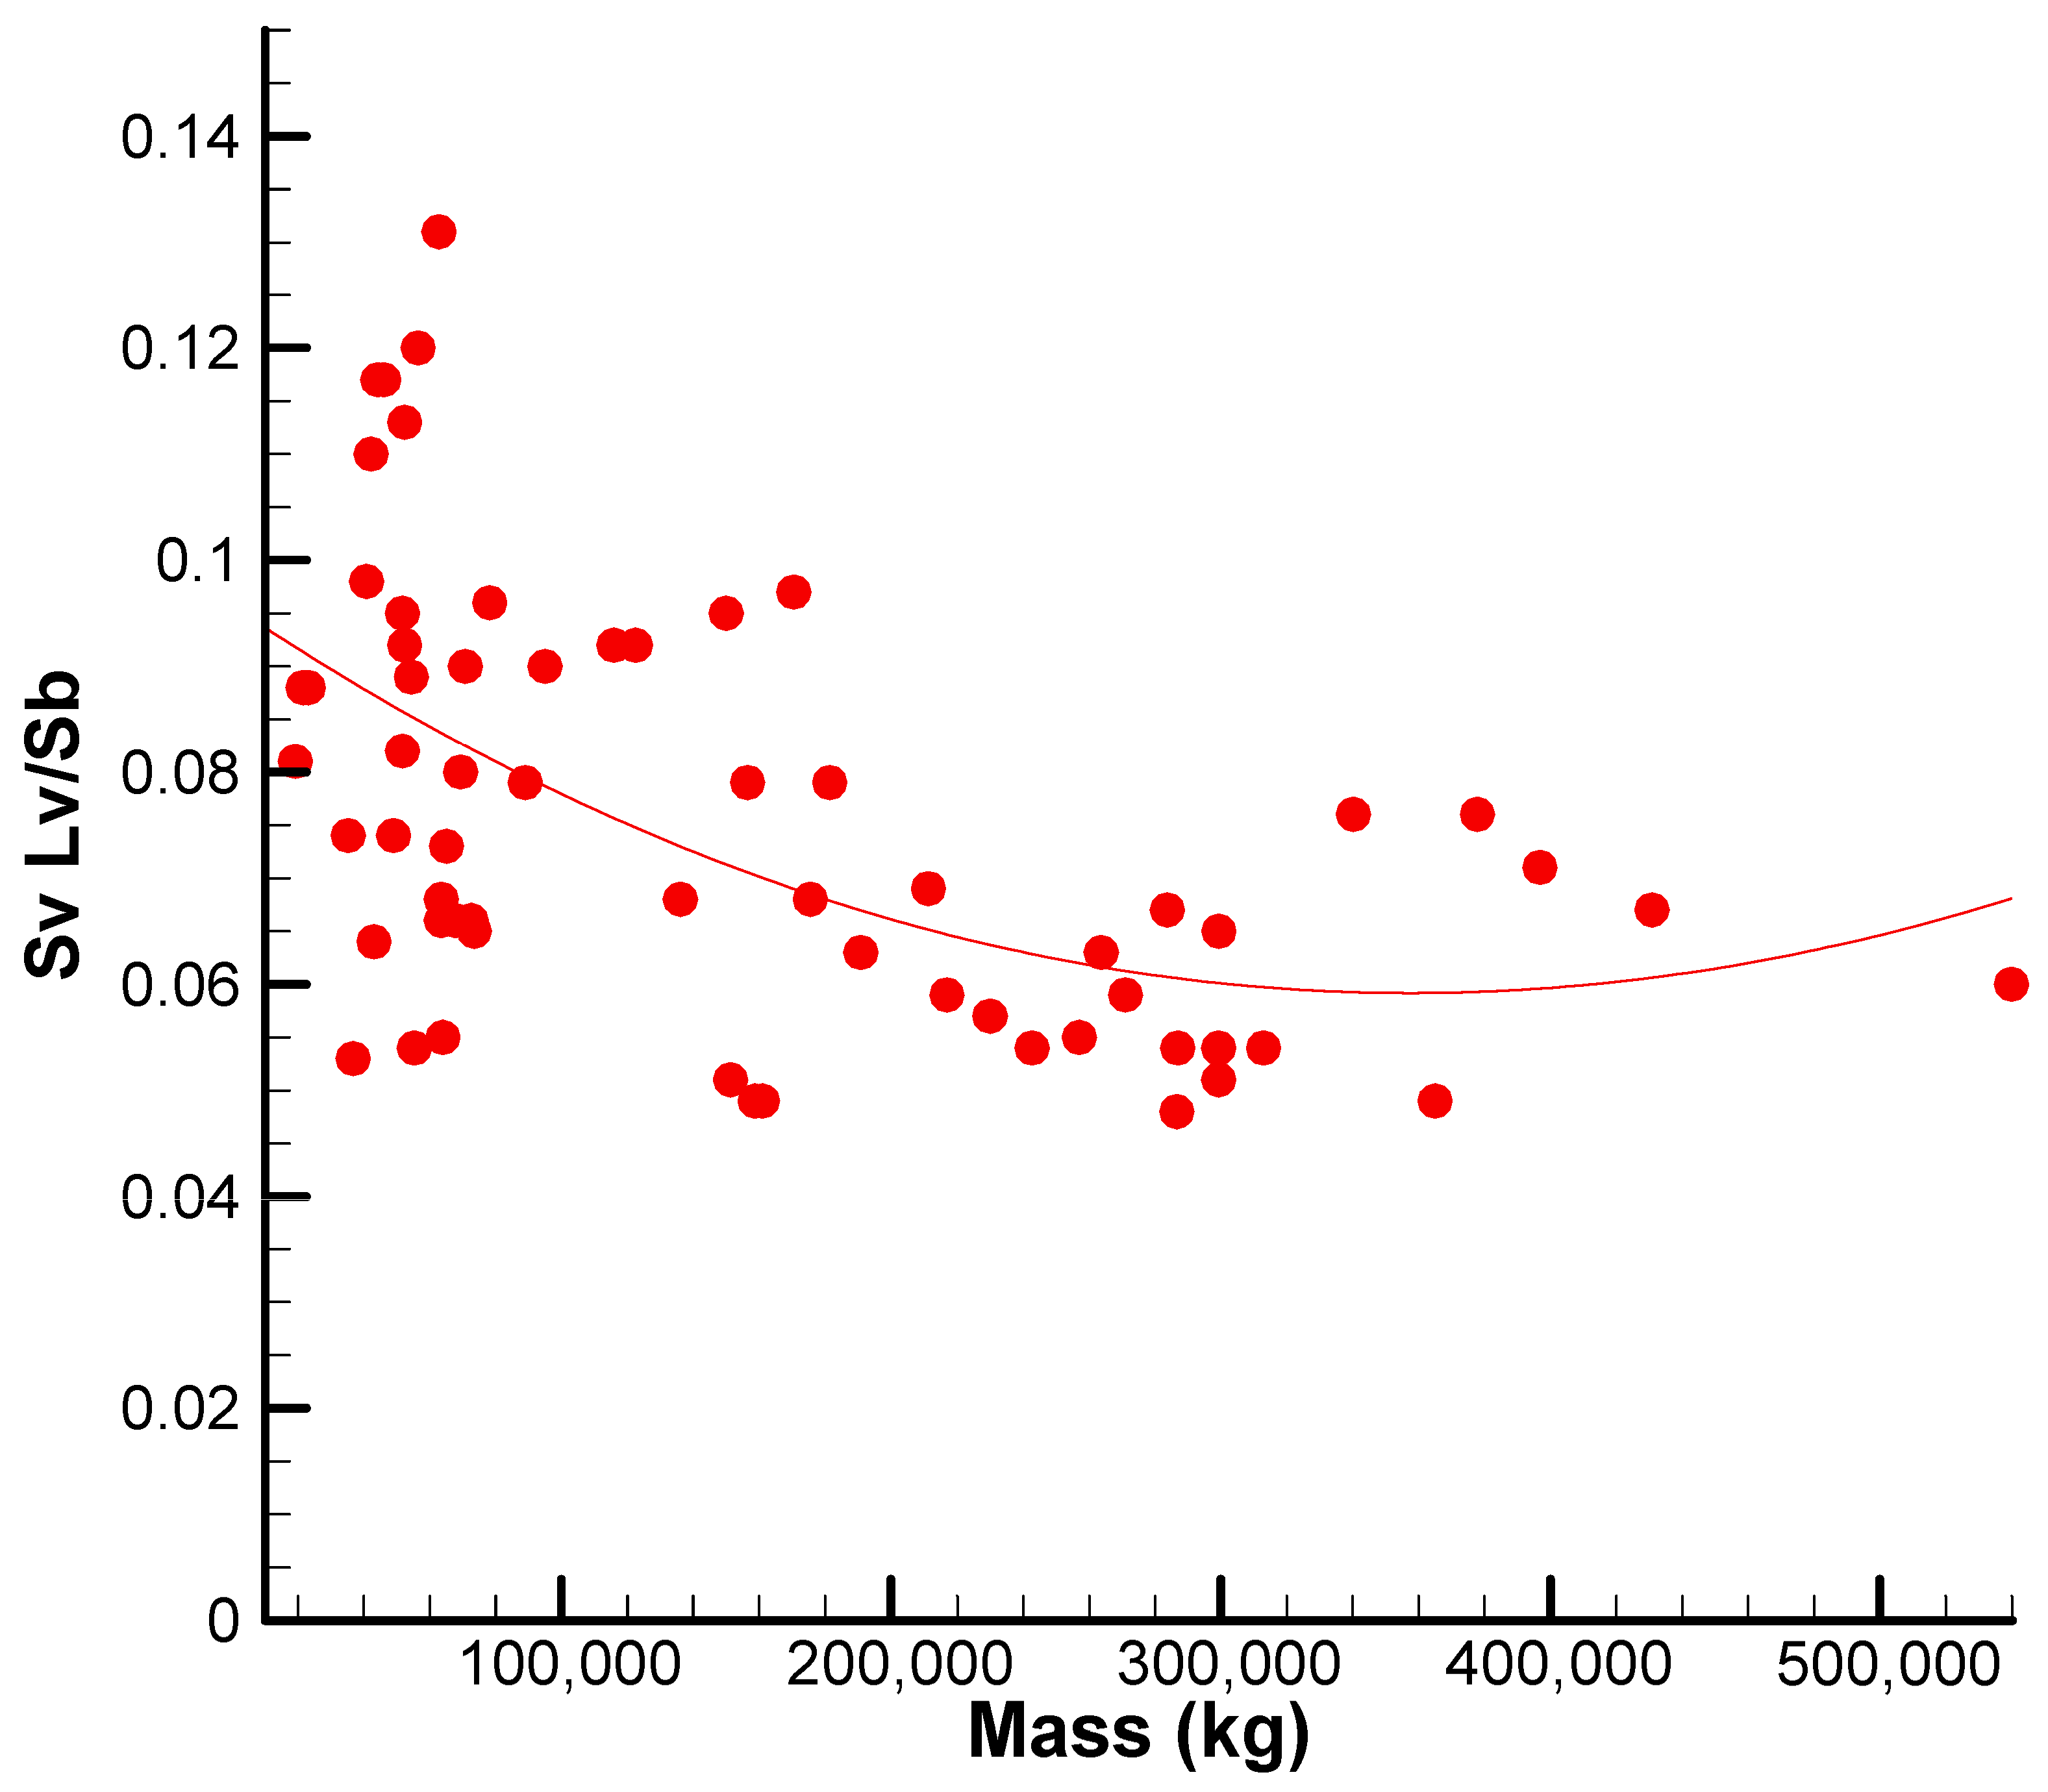
Figure 9 shows the variation of the vertical tail volume coefficient against maximum takeoff mass for a wide range of civil jet aircraft. The data reveal a clear inverse relationship, with a noticeable transition point at higher mass ranges. The statistical mean of the dataset is 0.074, with a standard deviation of 0.02. Most of the airplanes fall in a range of volume coefficient from approximately 0.05 to 0.1. At low masses (mass < 200,000 kg), the coefficient is highly variable. This scatter shows that smaller aircraft can carry more conservative vertical tail sizing to ensure adequate yaw stability for a broad range of operating conditions, particularly in the absence of sophisticated flight control systems. As takeoff mass increases, the coefficient drops off and shows improved convergence. This convergence is most likely the result of more effective vertical tail sizing, made possible by the availability of improved aerodynamic modeling, the feasibility of more complex control systems, and trade-offs between added stability and structural weight penalties for larger tail surfaces.
3. Experimental Equipment
The wind tunnel experiments were conducted in the Aerodynamics Laboratory of the University of Tehran. The experiments included balance calibration, velocity measurements, and aerodynamic force measurement of the vertical tail of the airplane, i.e., side force and drag. The wind tunnel is an open-loop, continuous-flow type. The test section is a closed rectangular section with dimensions of 1.0 m × 0.7 m and a length of 1.8 m. It is made of Plexiglas to allow visual observation of the model during testing. The total length of the wind tunnel is 12.645 m, and the contraction ratio is 9:1.
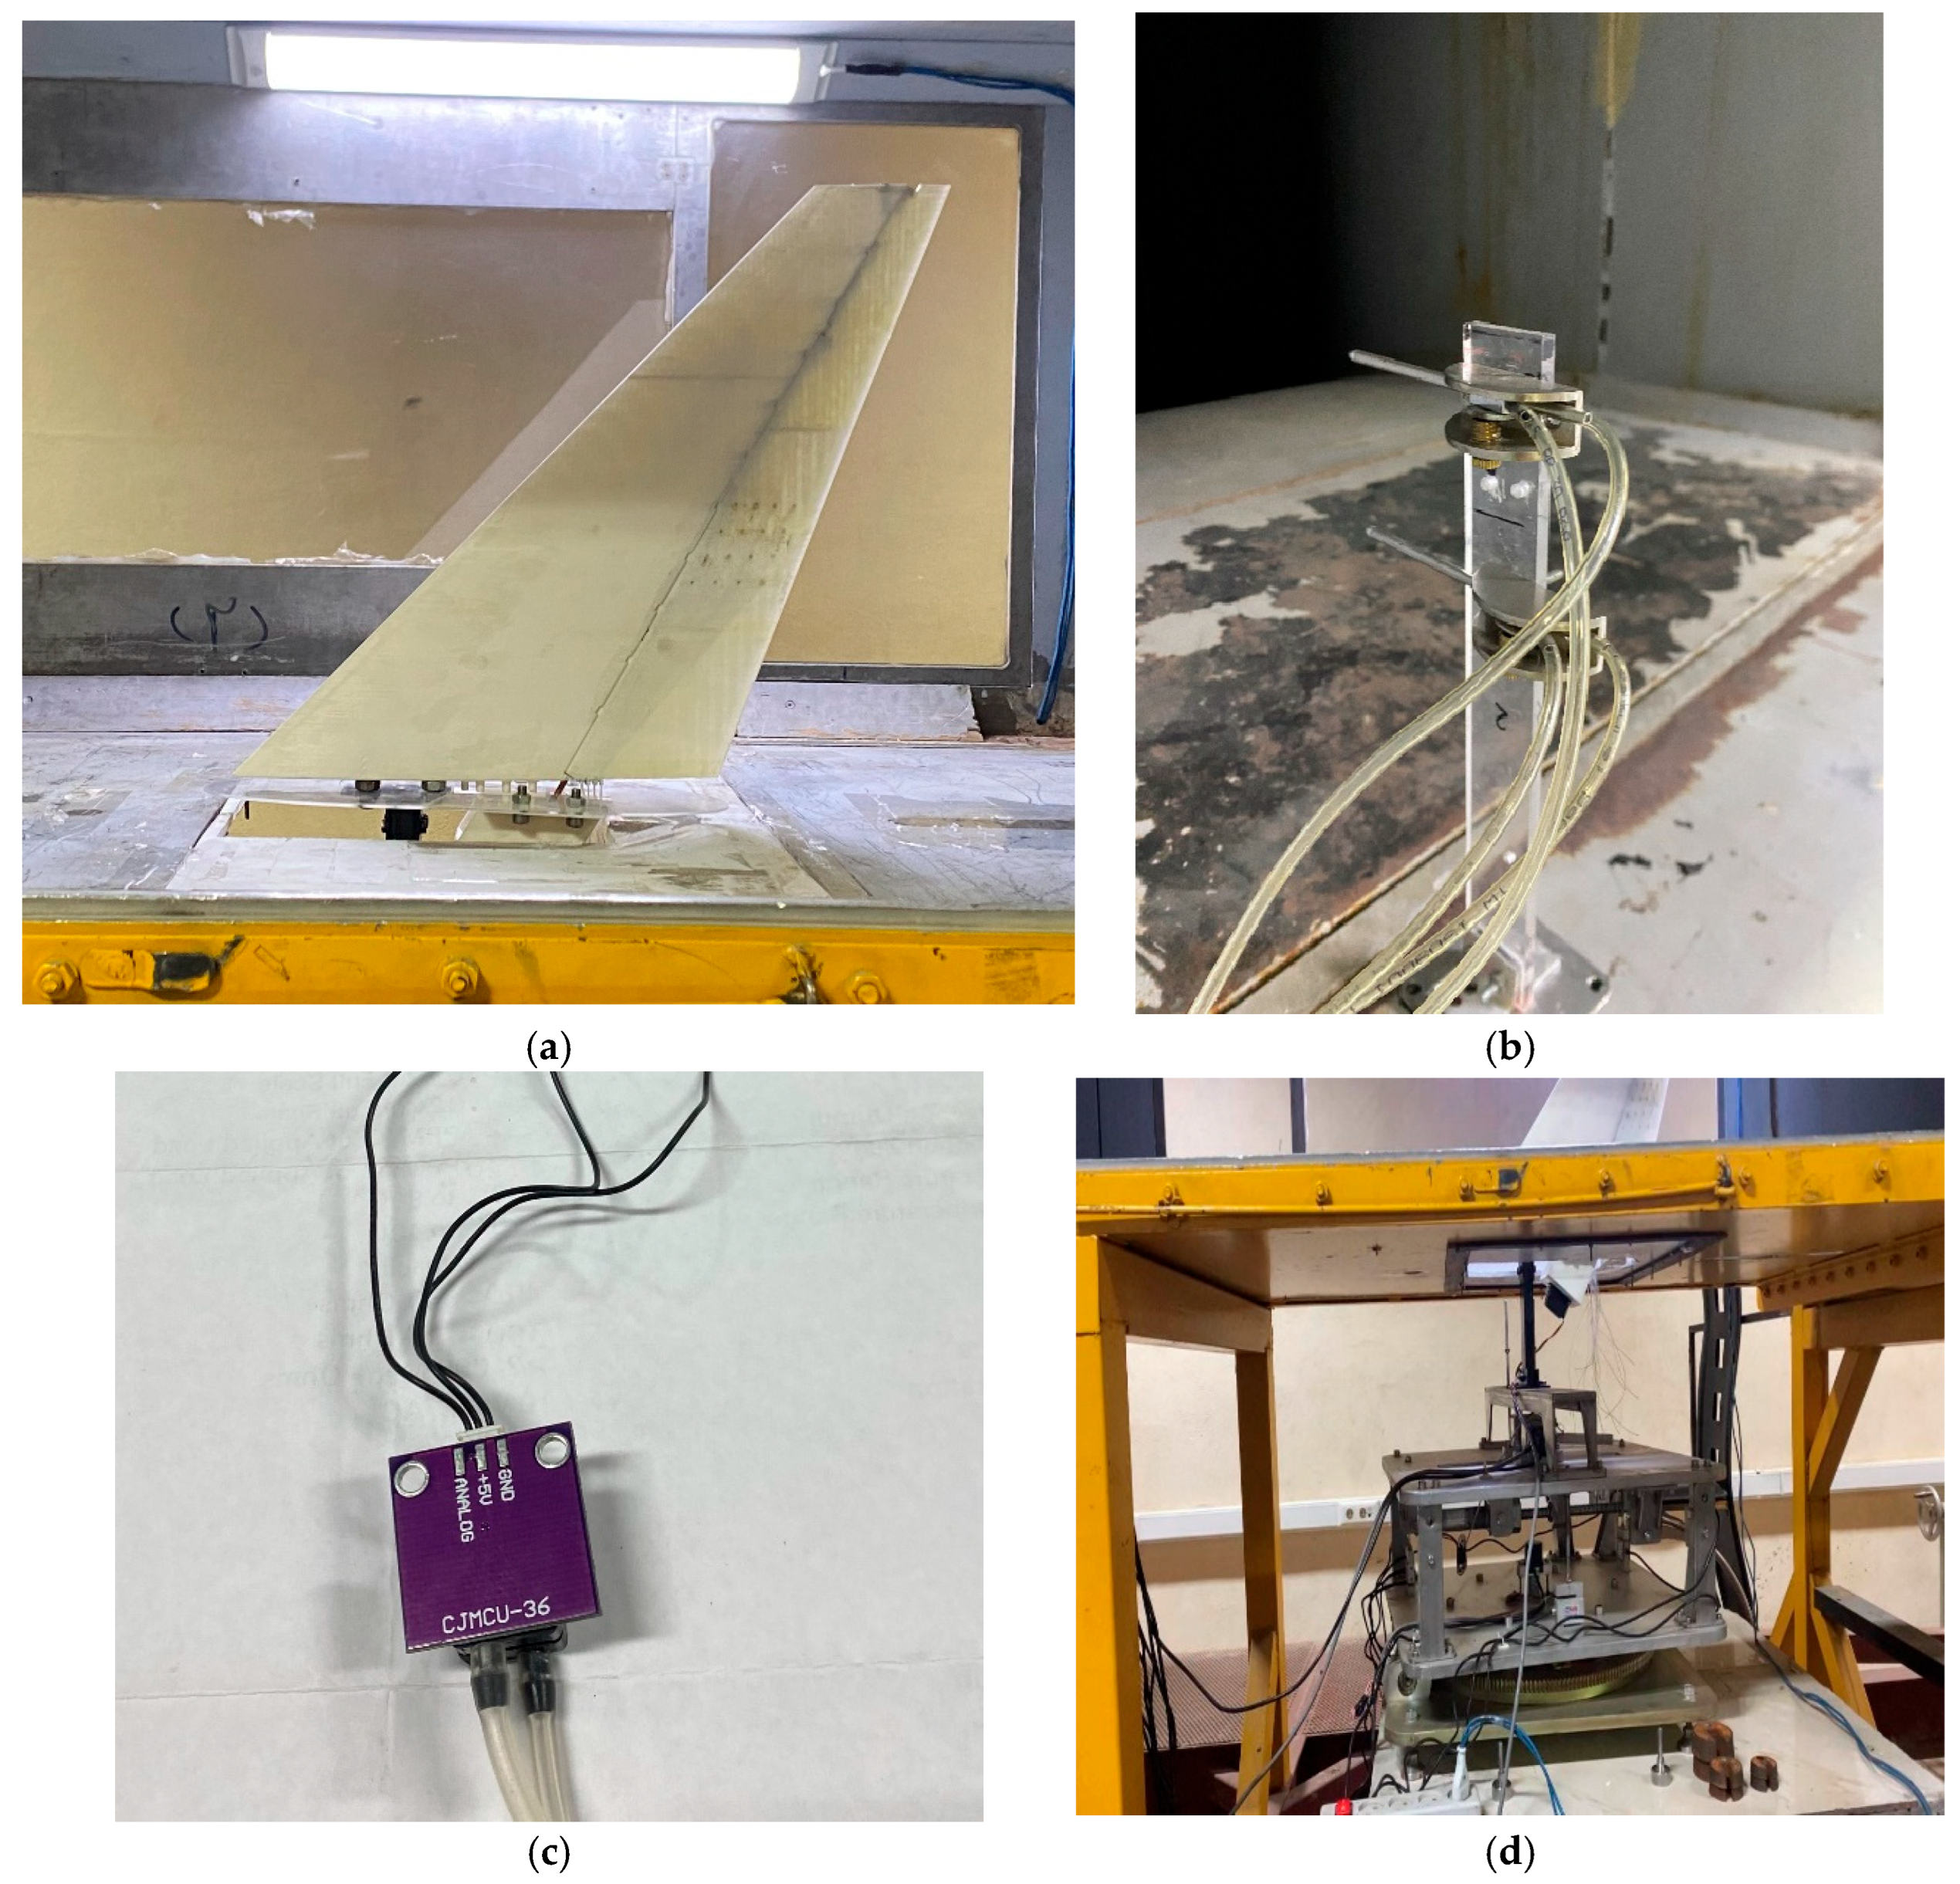
Figure 10a shows the vertical tail model installed in the test section. The model consists of two main parts: the fixed vertical fin and the rudder. A 3806LDP encoder model with an accuracy of 0.1° is used to adjust the rudder angle, which is hinged to the fixed fin. The wind tunnel fan is powered by a 15-kW motor, and the maximum airspeed achievable in the test section is 50 m/s. To measure the airflow velocity at the entrance of the test section, a Pitot-static tube with an accuracy of 0.1 m/s was used.
Figure 10b displays the Pitot-static tube in conjunction with an electronic pressure transducer (
Figure 10c). The pressure transducer used is the MPXV7002DP model. To measure the aerodynamic side force and drag acting on the vertical tail, a force balance system was employed.
Figure 10d shows the three-component force balance along with the attached model. The force measurement accuracy of the balance is equivalent to 0.03 N, with a measurement range of up to 60 kg-force for side force and 30 kg-force for drag force. The blockage ratio of the model in the wind tunnel, even under worst-case conditions, remains below 2%. To reduce wall interference effects, the model blockage ratio in the wind tunnel should not exceed 10%, and ideally should remain below 5%. Correction methods for blockage effects have been presented in reference [
49]; however, at the blockage ratio of less than 2% used in the present experiment, these effects are considered negligible. Furthermore, in the measurement of aerodynamic forces using a force balance, to prevent adverse effects arising from the interaction of the vertical tail’s tip vortices with the tunnel walls, the model height-to-tunnel height ratio should be kept below 0.8. In this study, this ratio was maintained below 0.65. Based on the flow calibration results, the turbulence intensity in the test section is 0.25%, and the flow velocity non-uniformity is less than 0.2%.
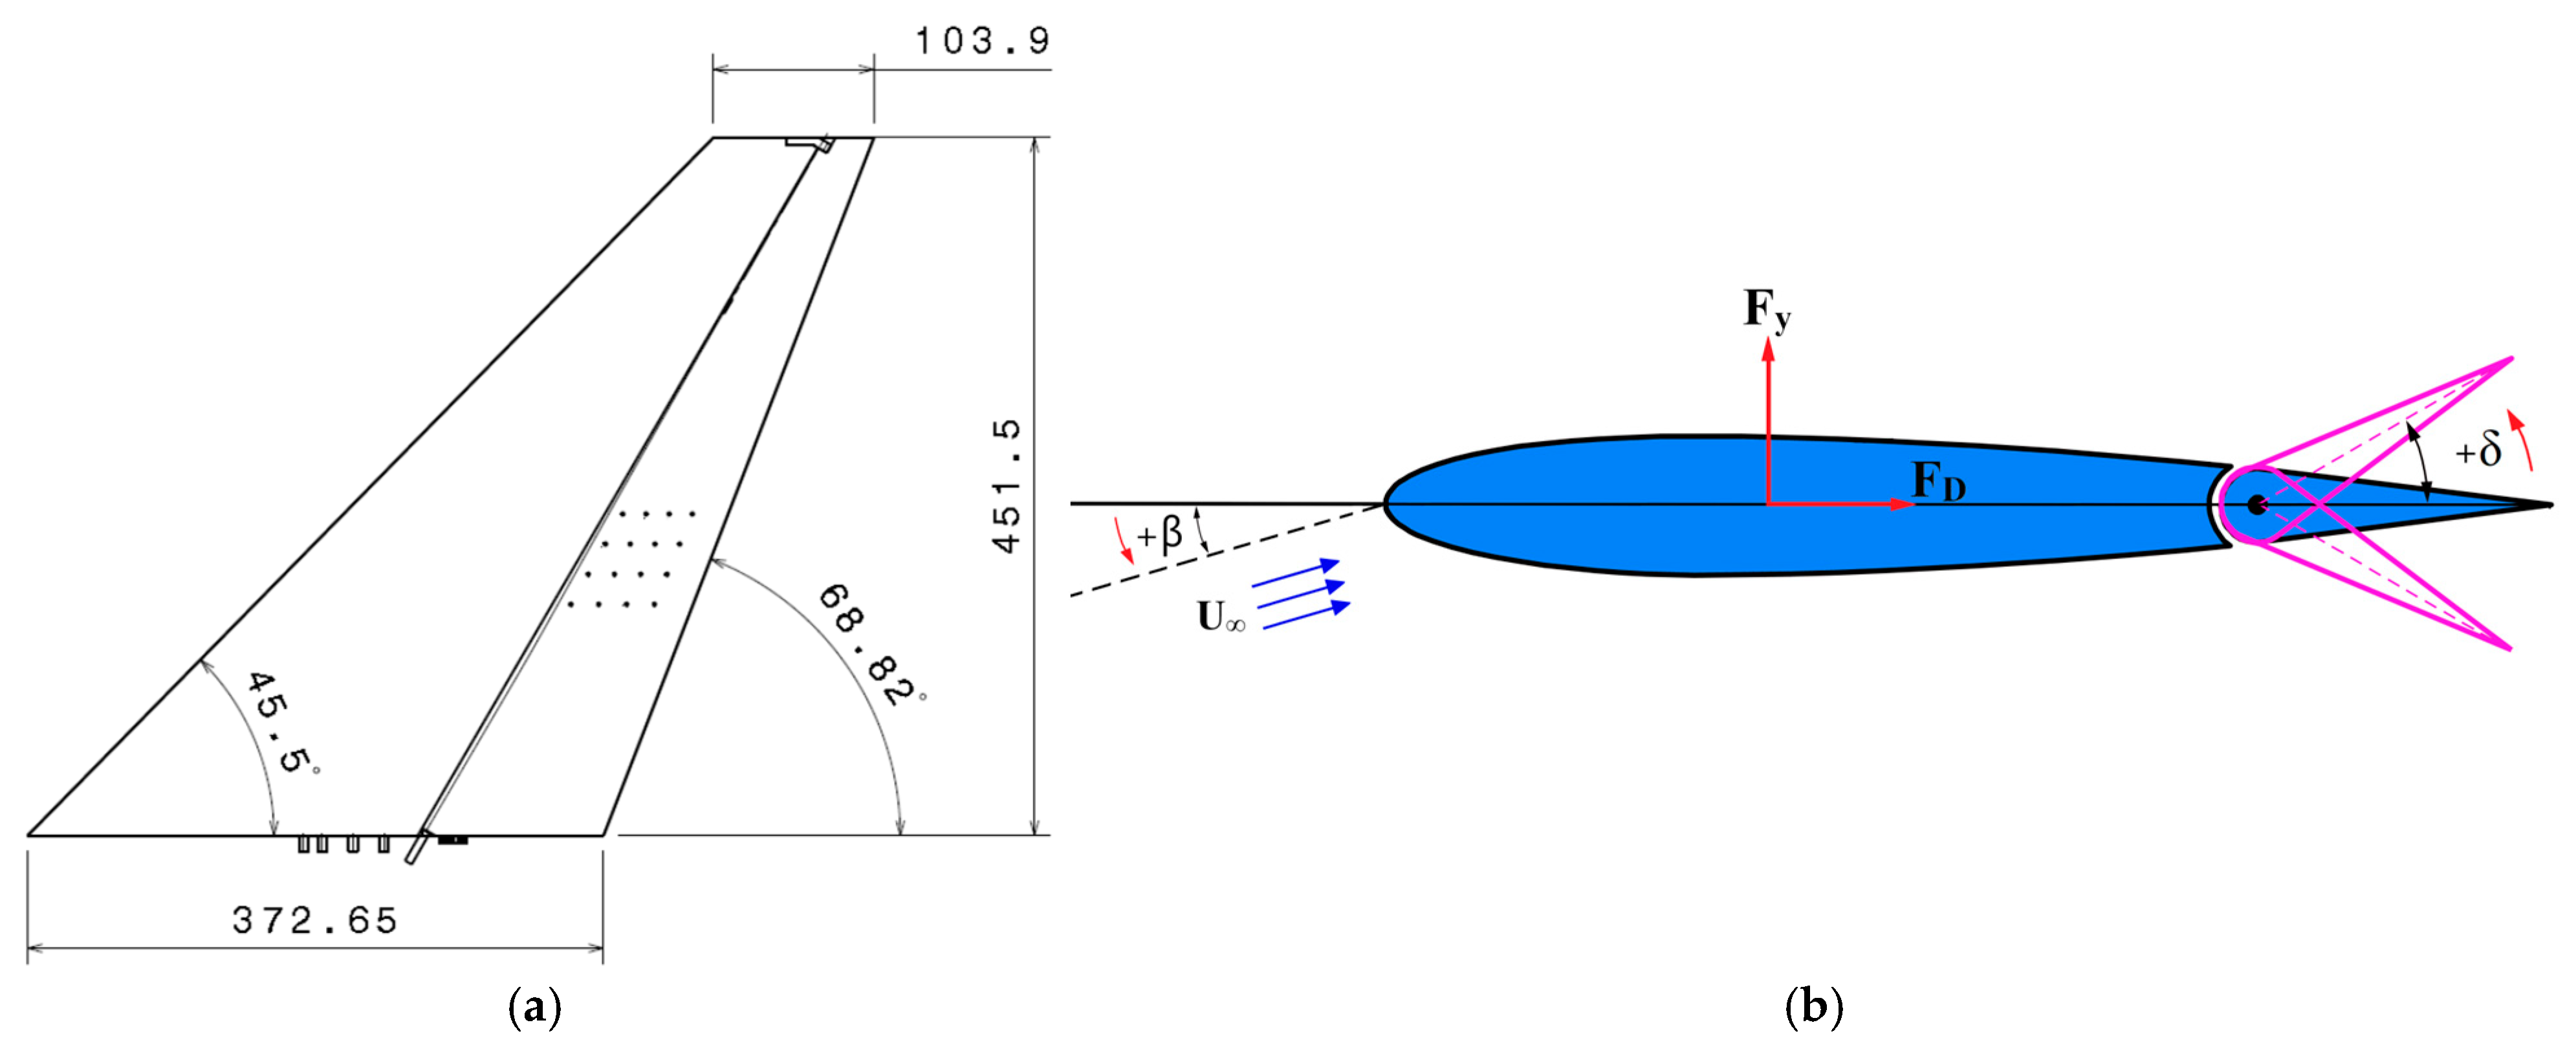
The vertical tail model tested is a 1:22 scale model of the Boeing 777-200 vertical tail. The cross-section of the tail follows a NACA 64A011 airfoil with a relative thickness of 13.42%. Although more recent supercritical or advanced airfoil profiles exist, the NACA 6-series airfoils remain widely used in transport aircraft tails due to their well-documented aerodynamic characteristics, smooth stall behavior, and favorable balance between lift, drag, and pitching-moment properties at low to moderate Mach numbers. Furthermore, using the same airfoil as the reference aircraft enables direct comparison between experimental results and real-world aerodynamic performance. The geometric characteristics of the model, including dimensions and angles, are shown in
Figure 11. The rudder hinge line is located at 70% of the chord length along the airfoil at all spanwise positions from root to tip. The vertical tail model, as shown in
Figure 10a, was fabricated using a 3D printer. The experiments were conducted at flow velocities of 20 m/s and 30 m/s, corresponding to Reynolds numbers of 5 × 10
5 and 7.5 × 10
5, respectively. The Reynolds number was calculated using the relation
where
is the freestream velocity, L is the characteristic length, taken here as the root chord length of the vertical tail (0.37265 m), and is the kinematic viscosity of air under the experimental ambient conditions, assumed to be approximately 1.5 × 10
−5 m
2/s.
4. Results and Discussion
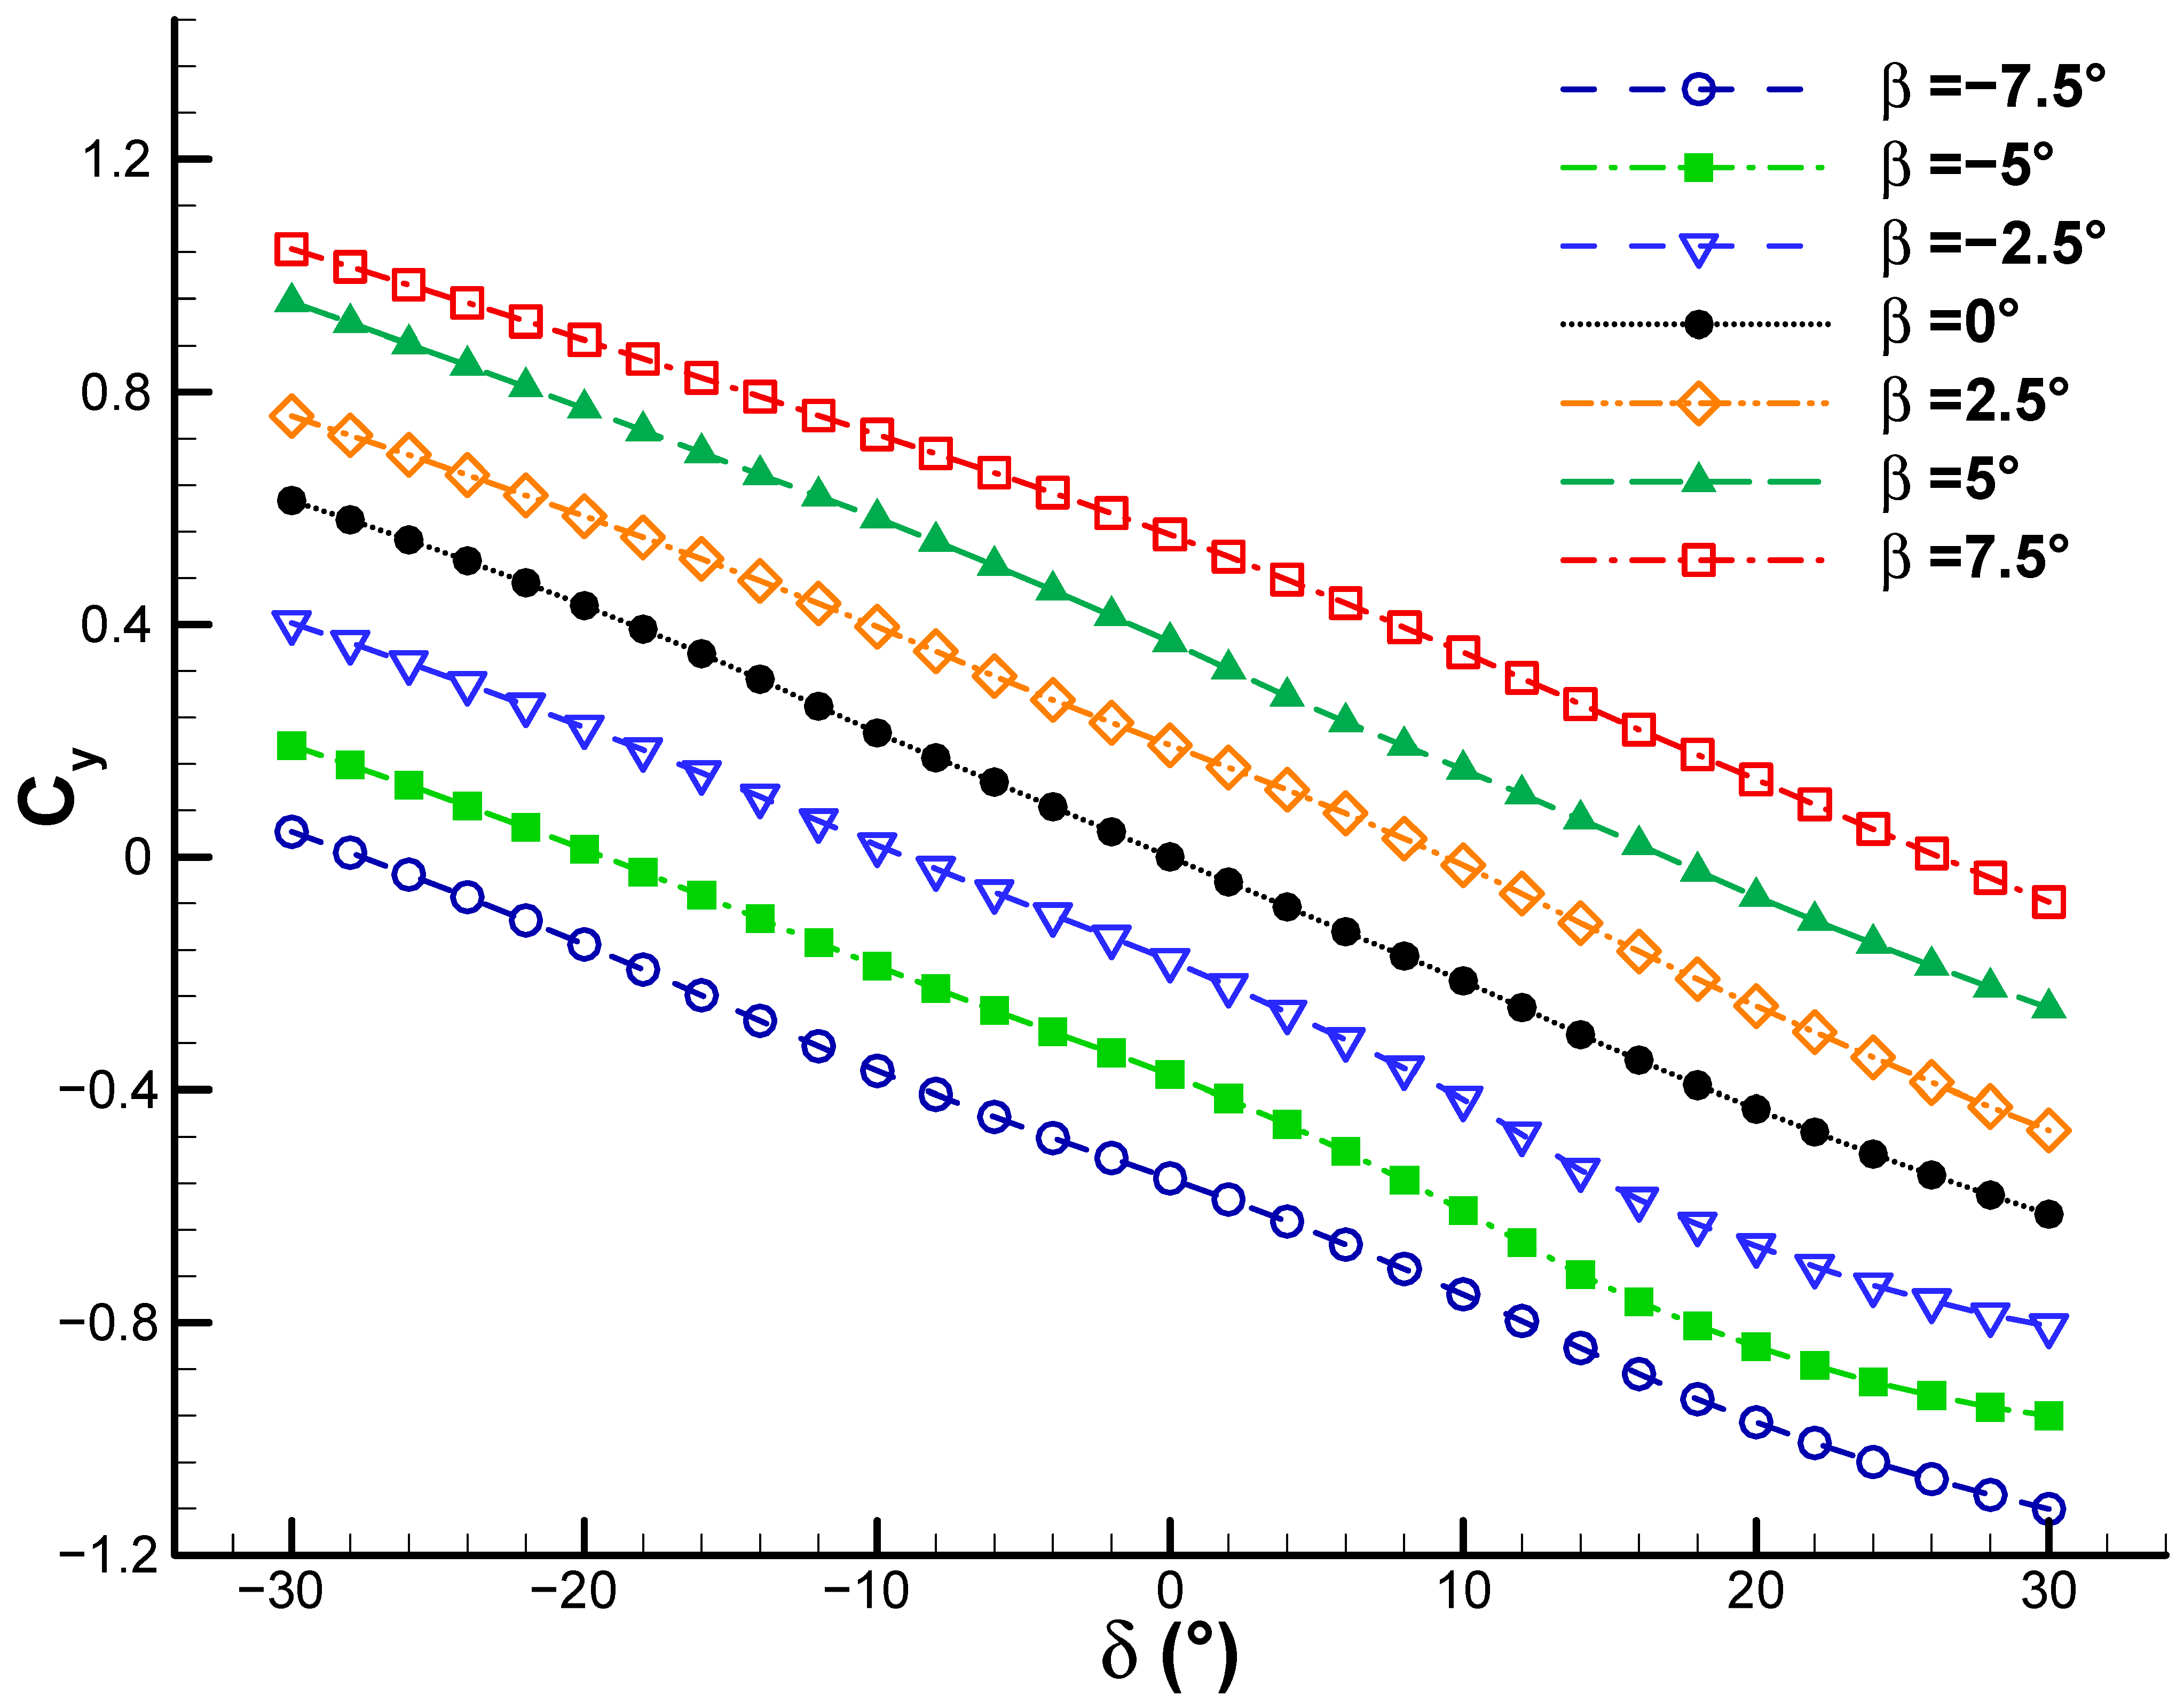
Figure 12 shows how the side force coefficient changes with rudder deflection angle at different sideslip angles, with a freestream velocity of U∞ = 20 m/s. The side force coefficient of the vertical tail is analogous to the lift coefficient of an aircraft wing. As shown in
Figure 11, it is defined by
where
Fy is the side force generated by the vertical tail, U∞ is the freestream velocity,
ρ is the air density, and
A is the reference area of the vertical tail. Specifically,
A refers to the projected area of the vertical stabilizer in the plane illustrated in
Figure 11a. Also, the drag coefficient is defined by
where
FD is the drag force applied to the vertical tail. These variations are presented over a rudder deflection range from −30° to +30°, and they exhibit an approximately linear behavior for all sideslip angles from −7.5° to +7.5°. The slope of these nearly linear curves remains almost constant across the sideslip angles and is generally negative. In other words, increasing δ in the positive direction consistently produces a side force in the negative direction, reflecting stable rudder effectiveness in generating an opposing side force. The approximately parallel shift of the curves with changes in sideslip angle β suggests that the effect of sideslip is primarily an additive bias to
Cy, and that the vertical tail exhibits a positive directional stability derivative (∂
Cy/∂β > 0); this means that increasing β (crosswind from right to left) increases
Cy almost uniformly across all δ values, with no strong coupling between β and δ (as indicated by the near-parallelism of the curves). At this freestream velocity, the magnitude of the side force coefficient varies within the range of approximately −1.1 to +1.1. These curves demonstrate the required rudder deflection angle to achieve a specific side force coefficient at a given sideslip angle.
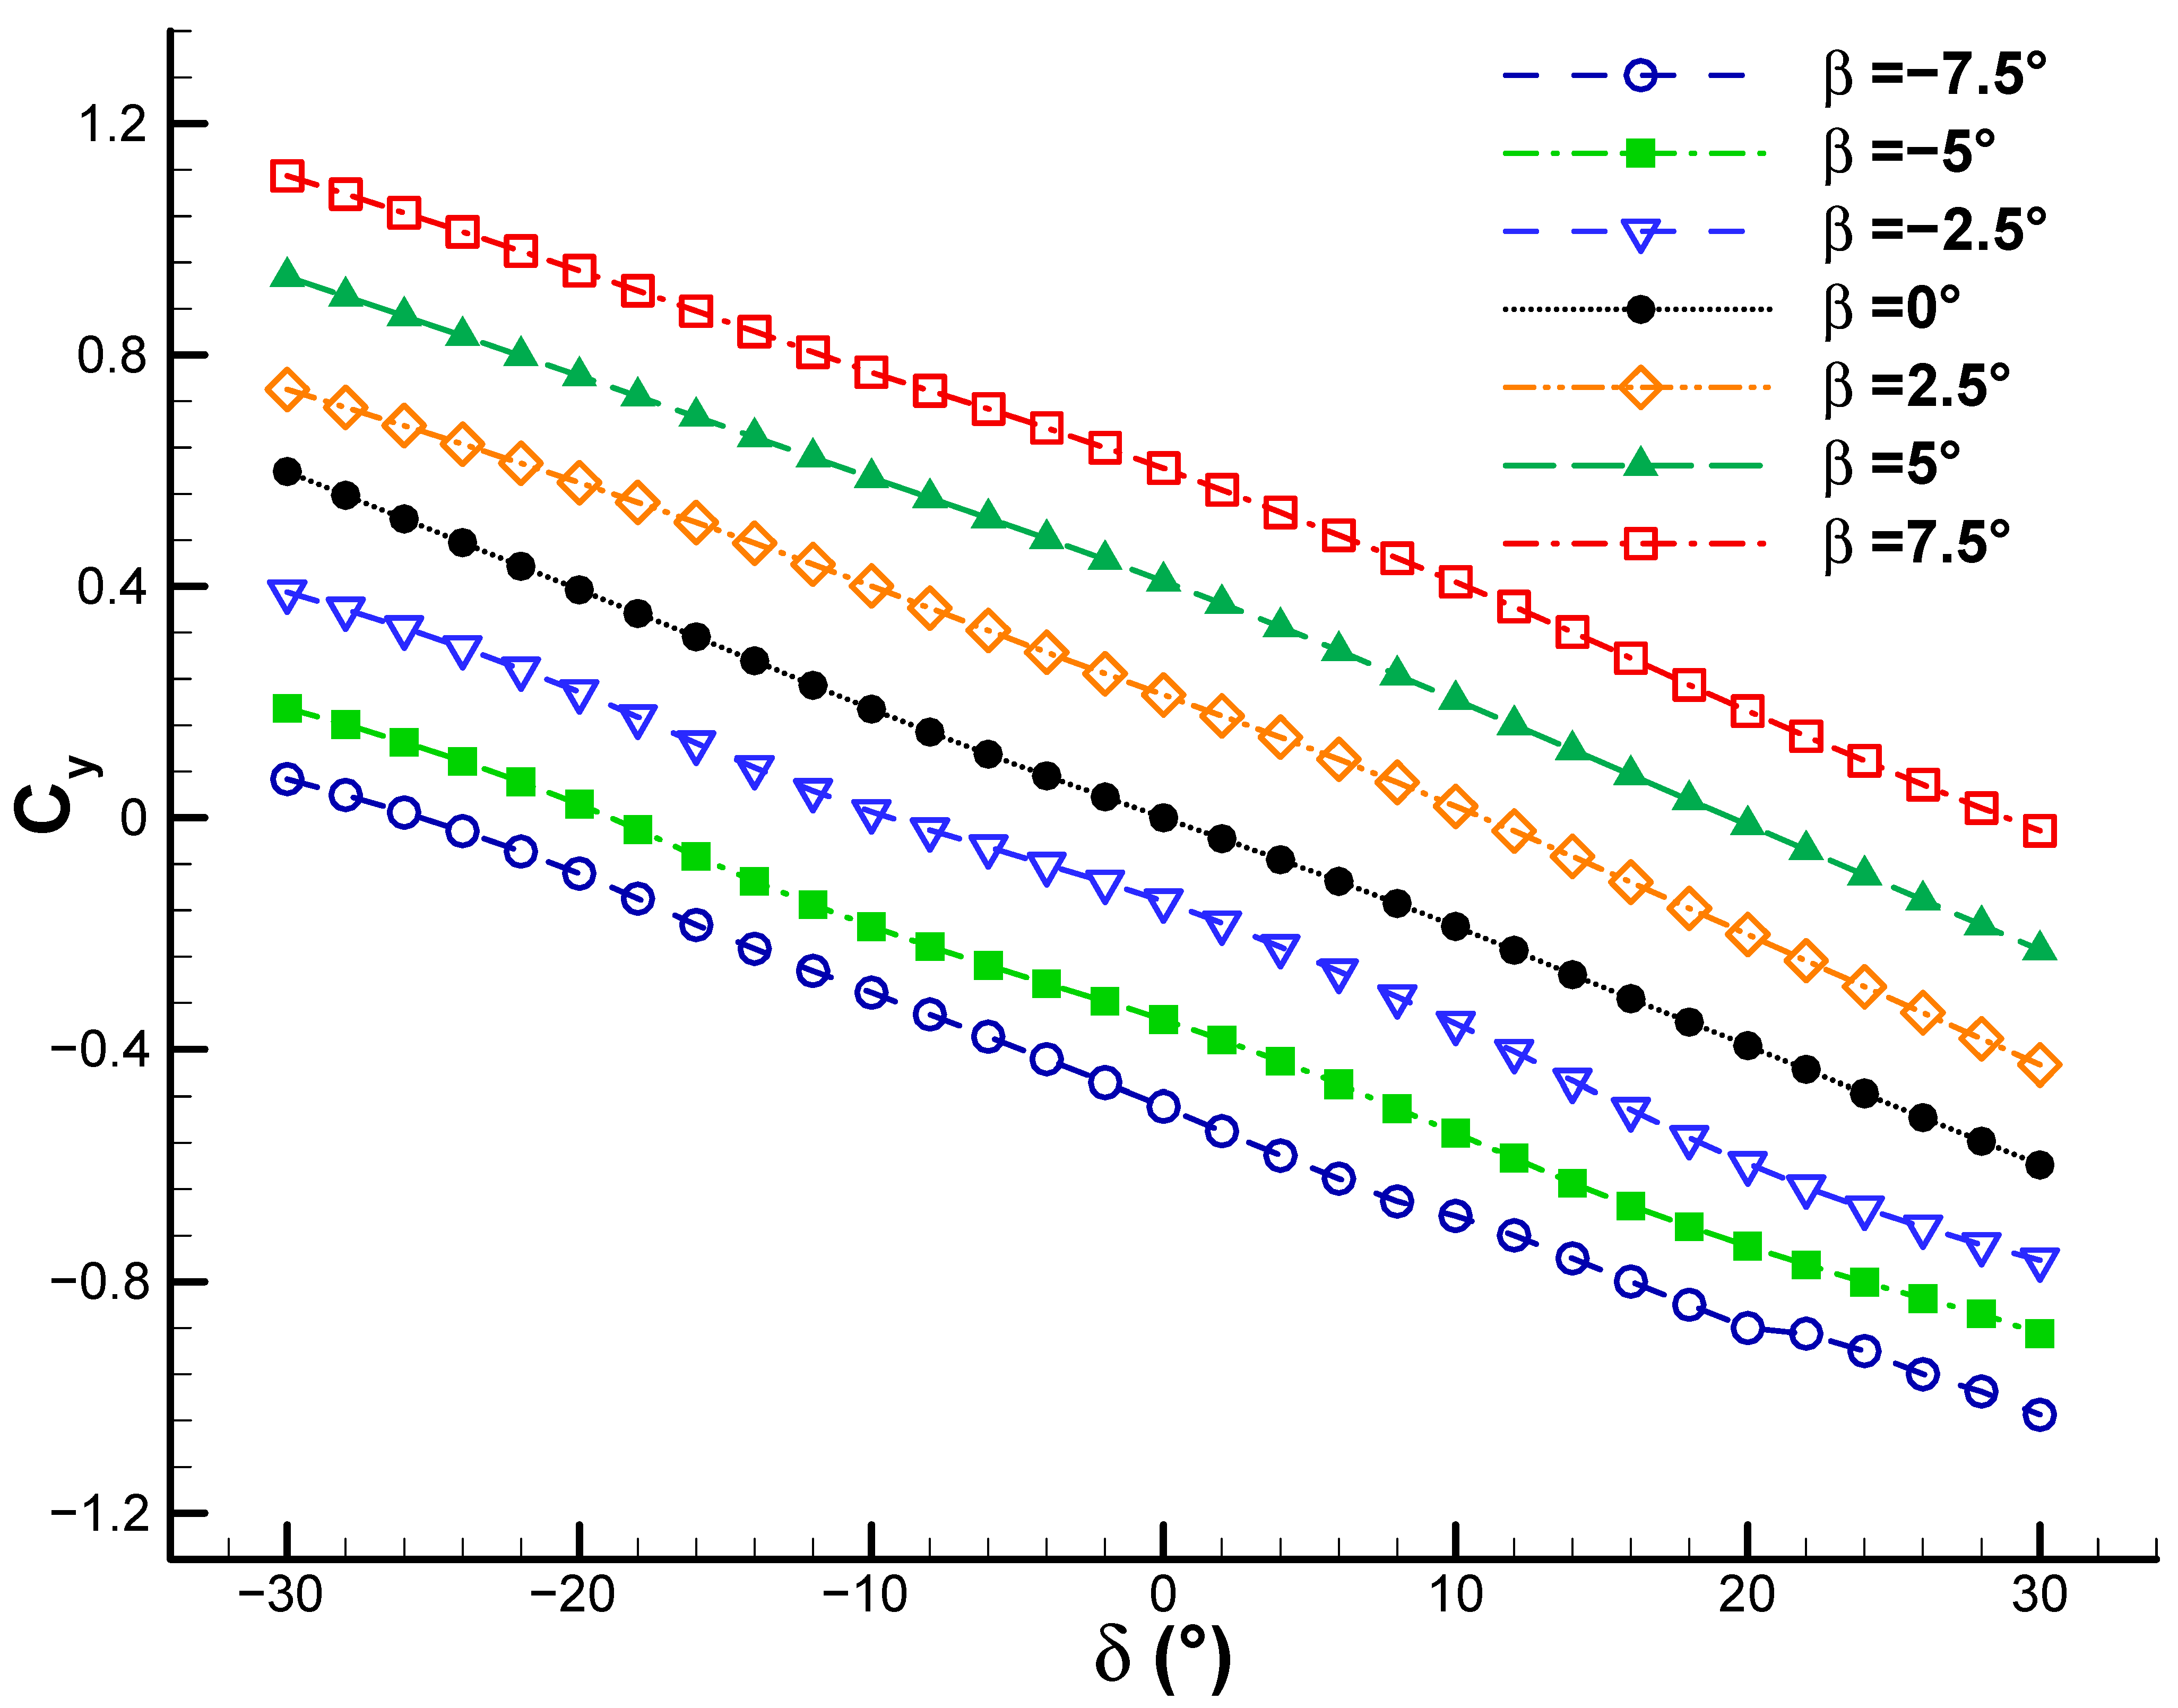
Figure 13 shows how the side force coefficient varies with rudder deflection angle at different sideslip angles, with a freestream velocity of U∞ = 30 m/s. The response remains identical to that of
Figure 12, with very small deviations from the ideal linear fit. Increasing the freestream velocity from 20 to 30 m/s results in a slight increase in the magnitude of the side force.
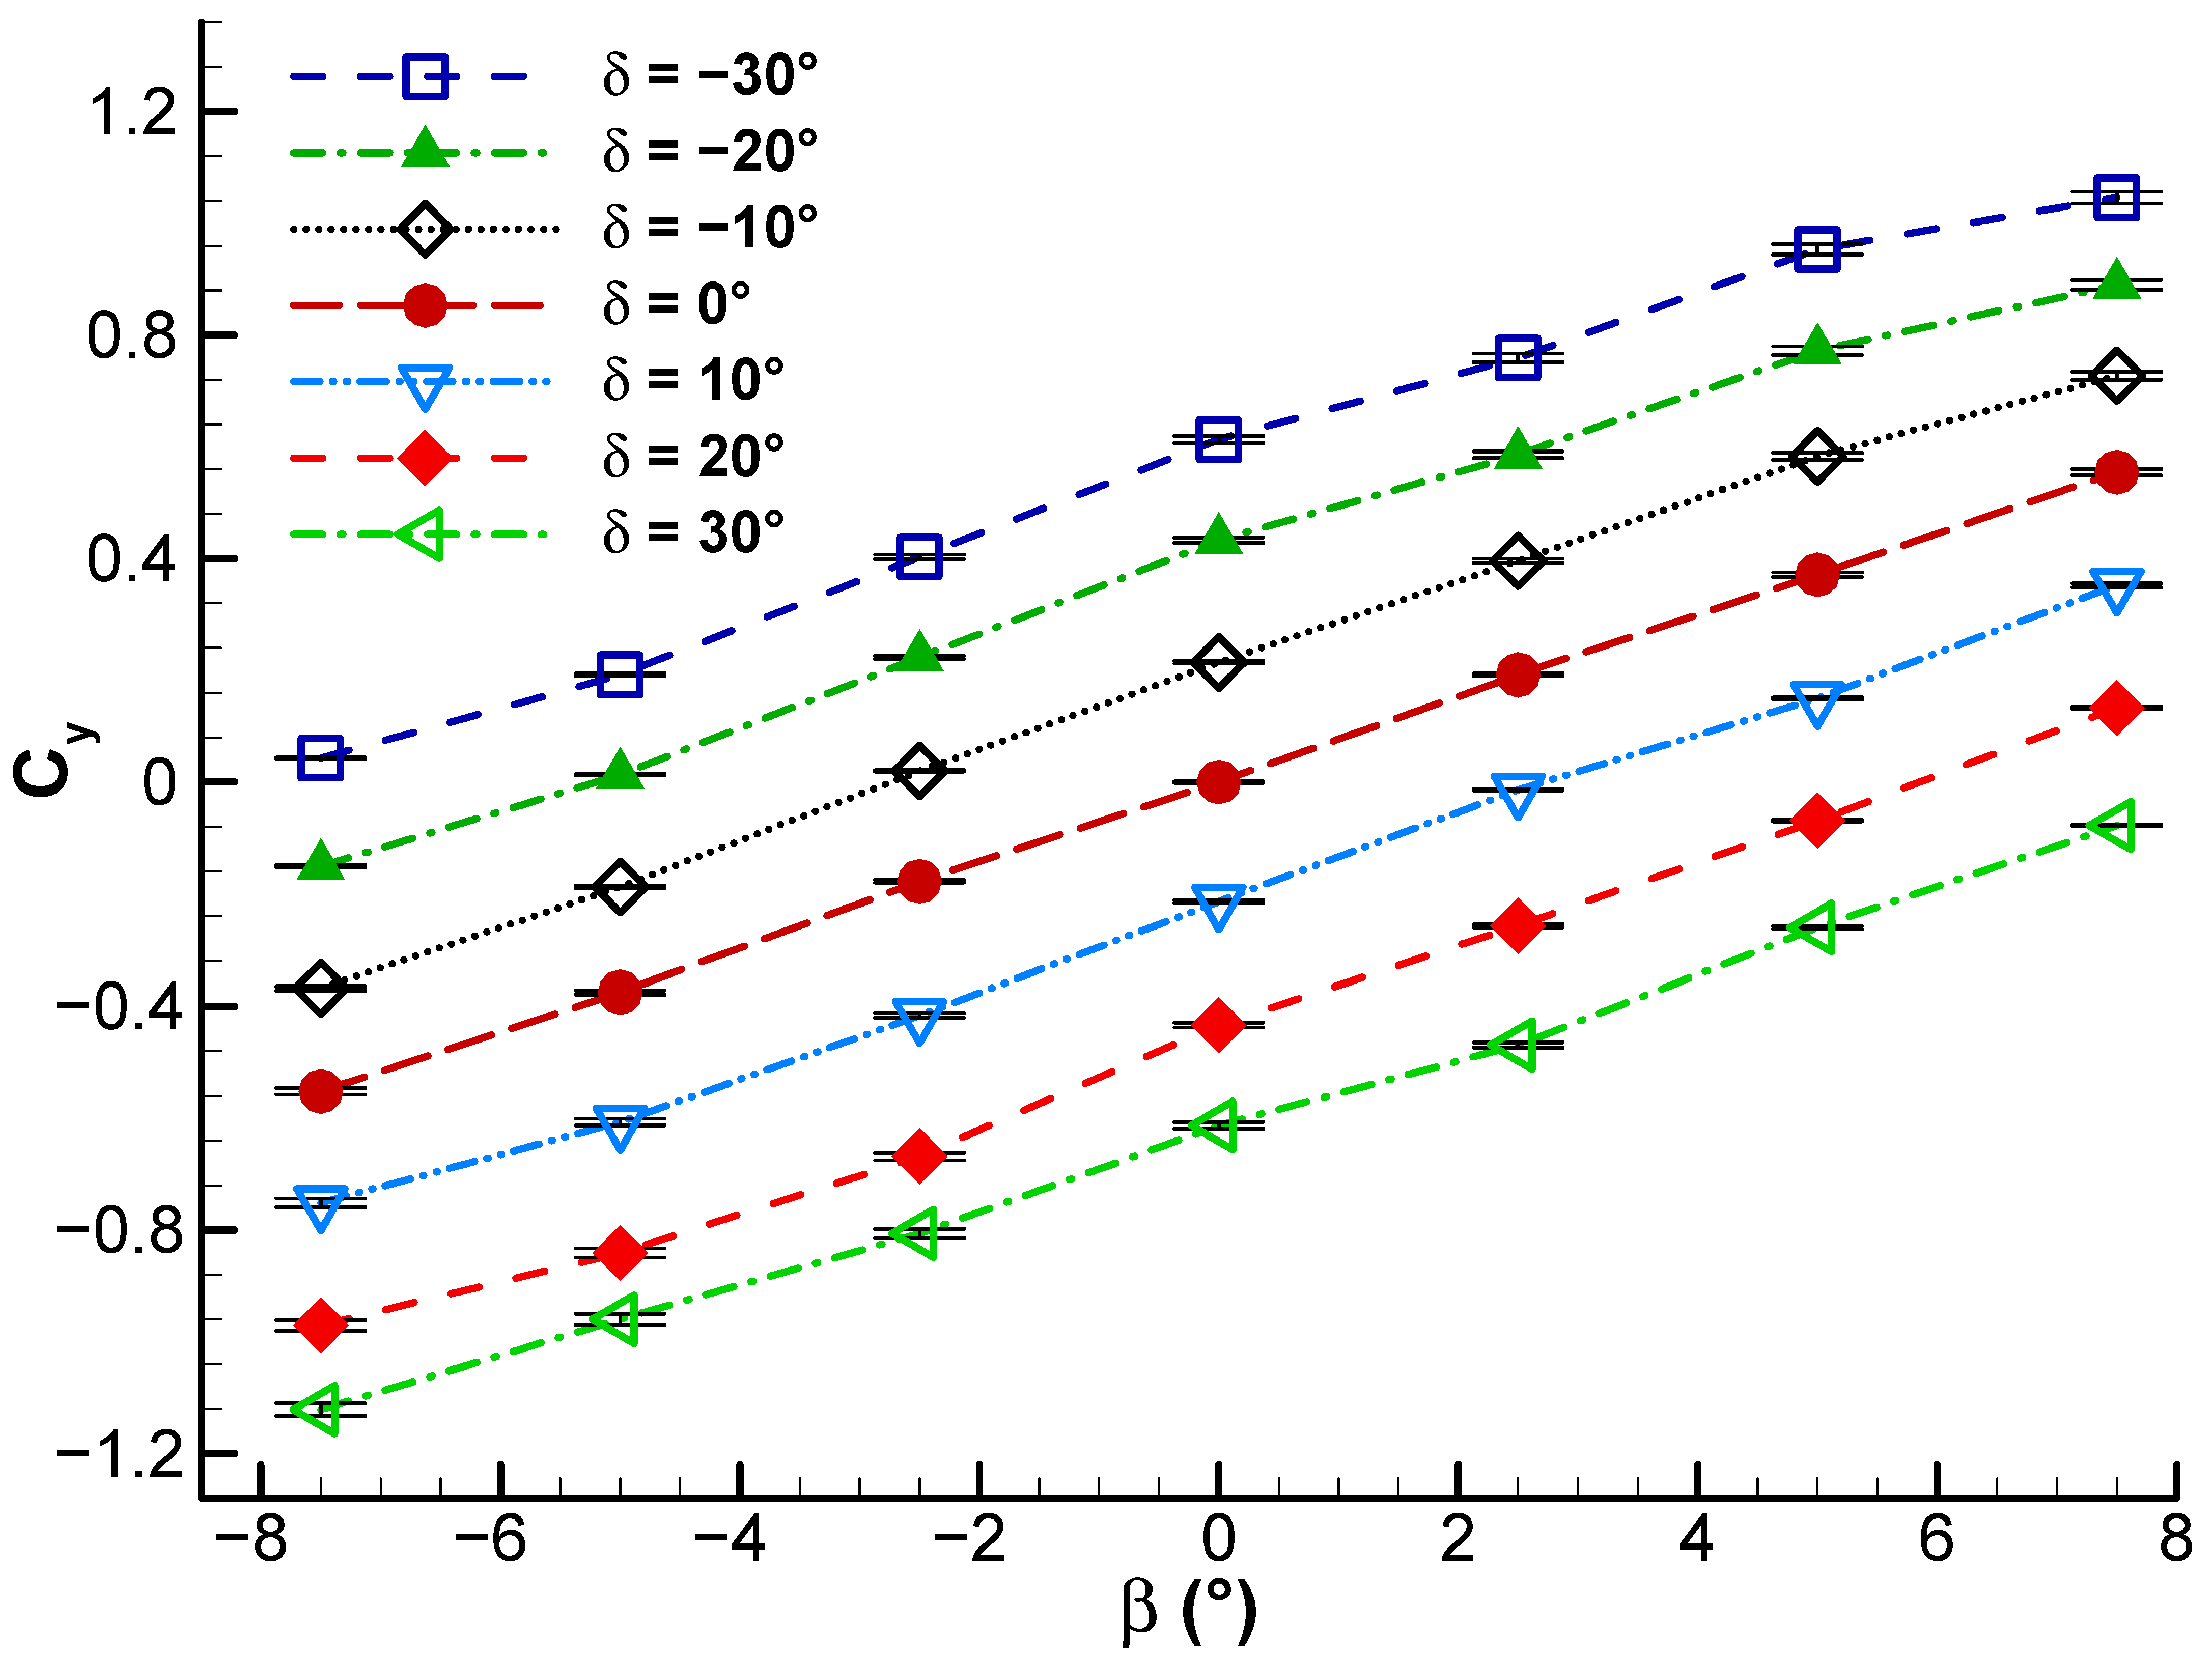
Figure 14 illustrates side force coefficient versus sideslip angle at freestream velocity of 20 m/s. Linear regression of experimental data at every fixed given rudder deflection angle plots indicate that the side force varies approximately linearly with change in sideslip angle. The positive slope of the fitted lines indicates that greater sideslip angle results in greater side force, particularly when the rudder deflection angle is negative. The parallel shift of the curves with δ indicates that rudder deflection generates a baseline side force that essentially moves the equilibrium point, with the vertical tail’s sensitivity to sideslip being nearly constant. Negative rudder deflections yield bigger positive side forces, while positive deflections generate more negative ones, as might be expected for the direction of force due to rudder input. This behavior is in accord with expectations that rudder deflection controls primarily the bias in side force rather than its rate of change with sideslip, a mode characteristic of a symmetric vertical tail in subsonic flow.
In
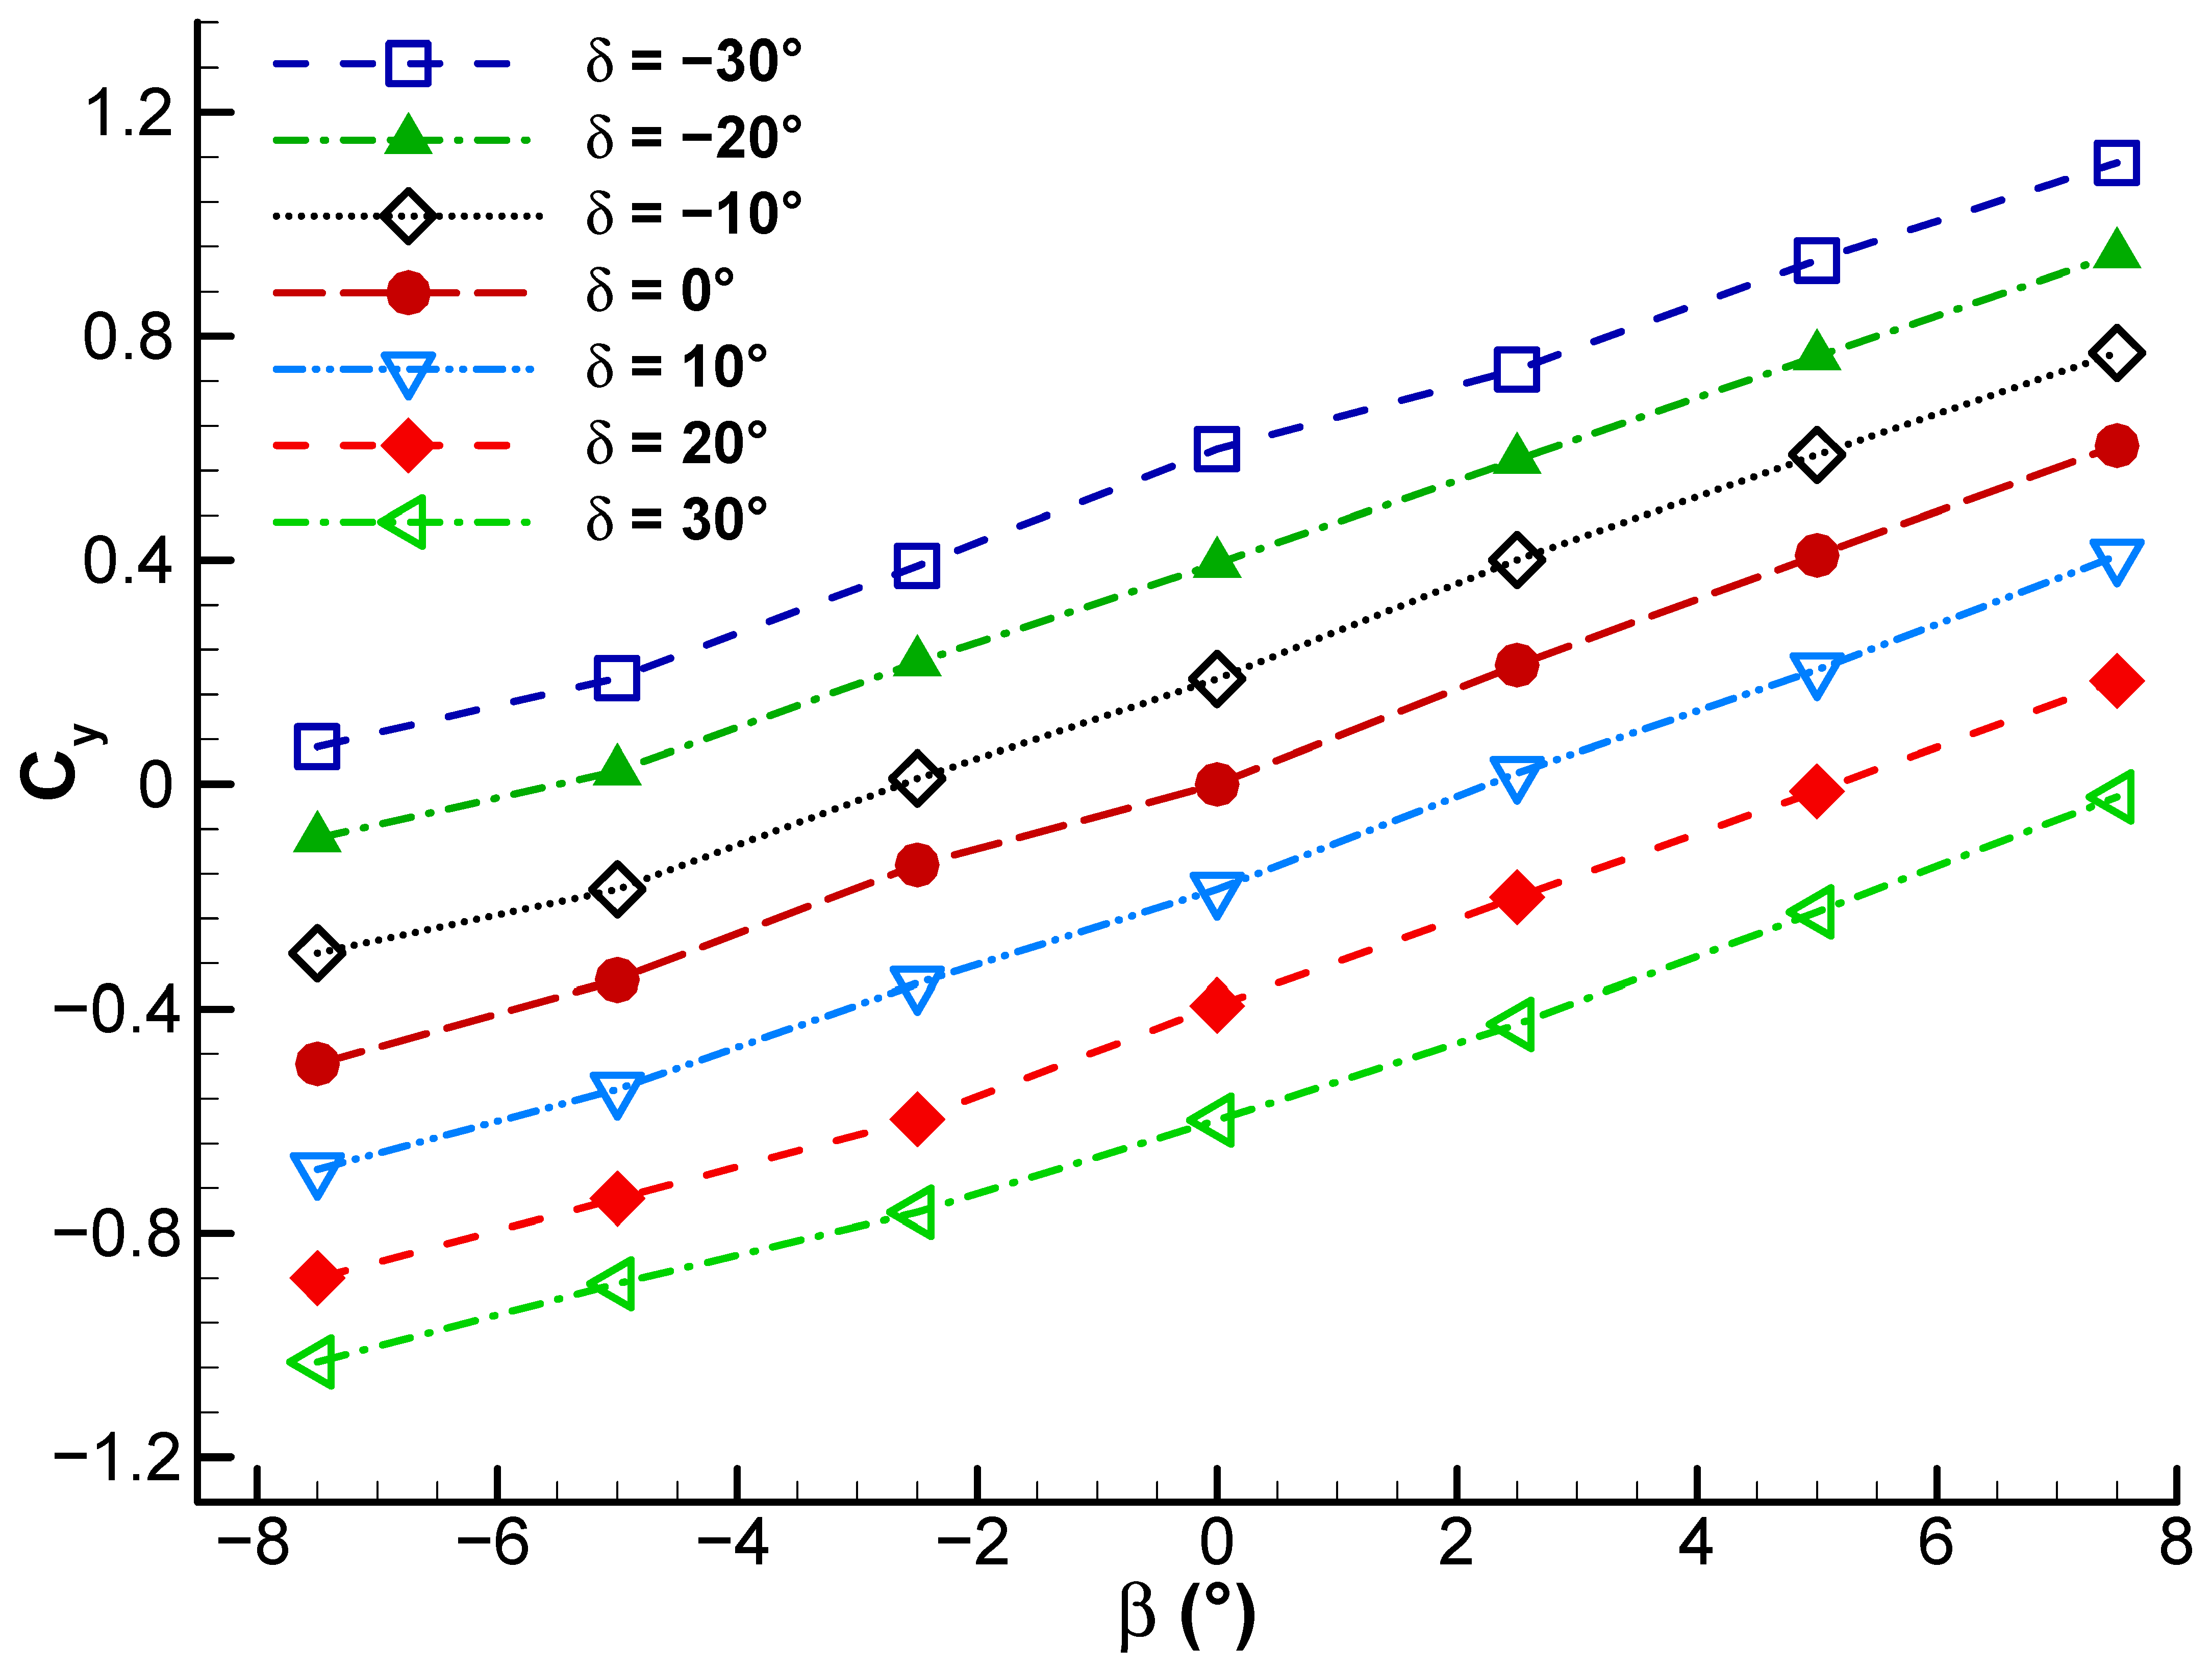
Figure 15, side force coefficient is plotted against sideslip angle at a freestream velocity of 30 m/s. The same trend as in
Figure 14 is observed. This figure can be utilized to determine the rudder deflection angle necessary to produce a desired side force at a given sideslip condition.
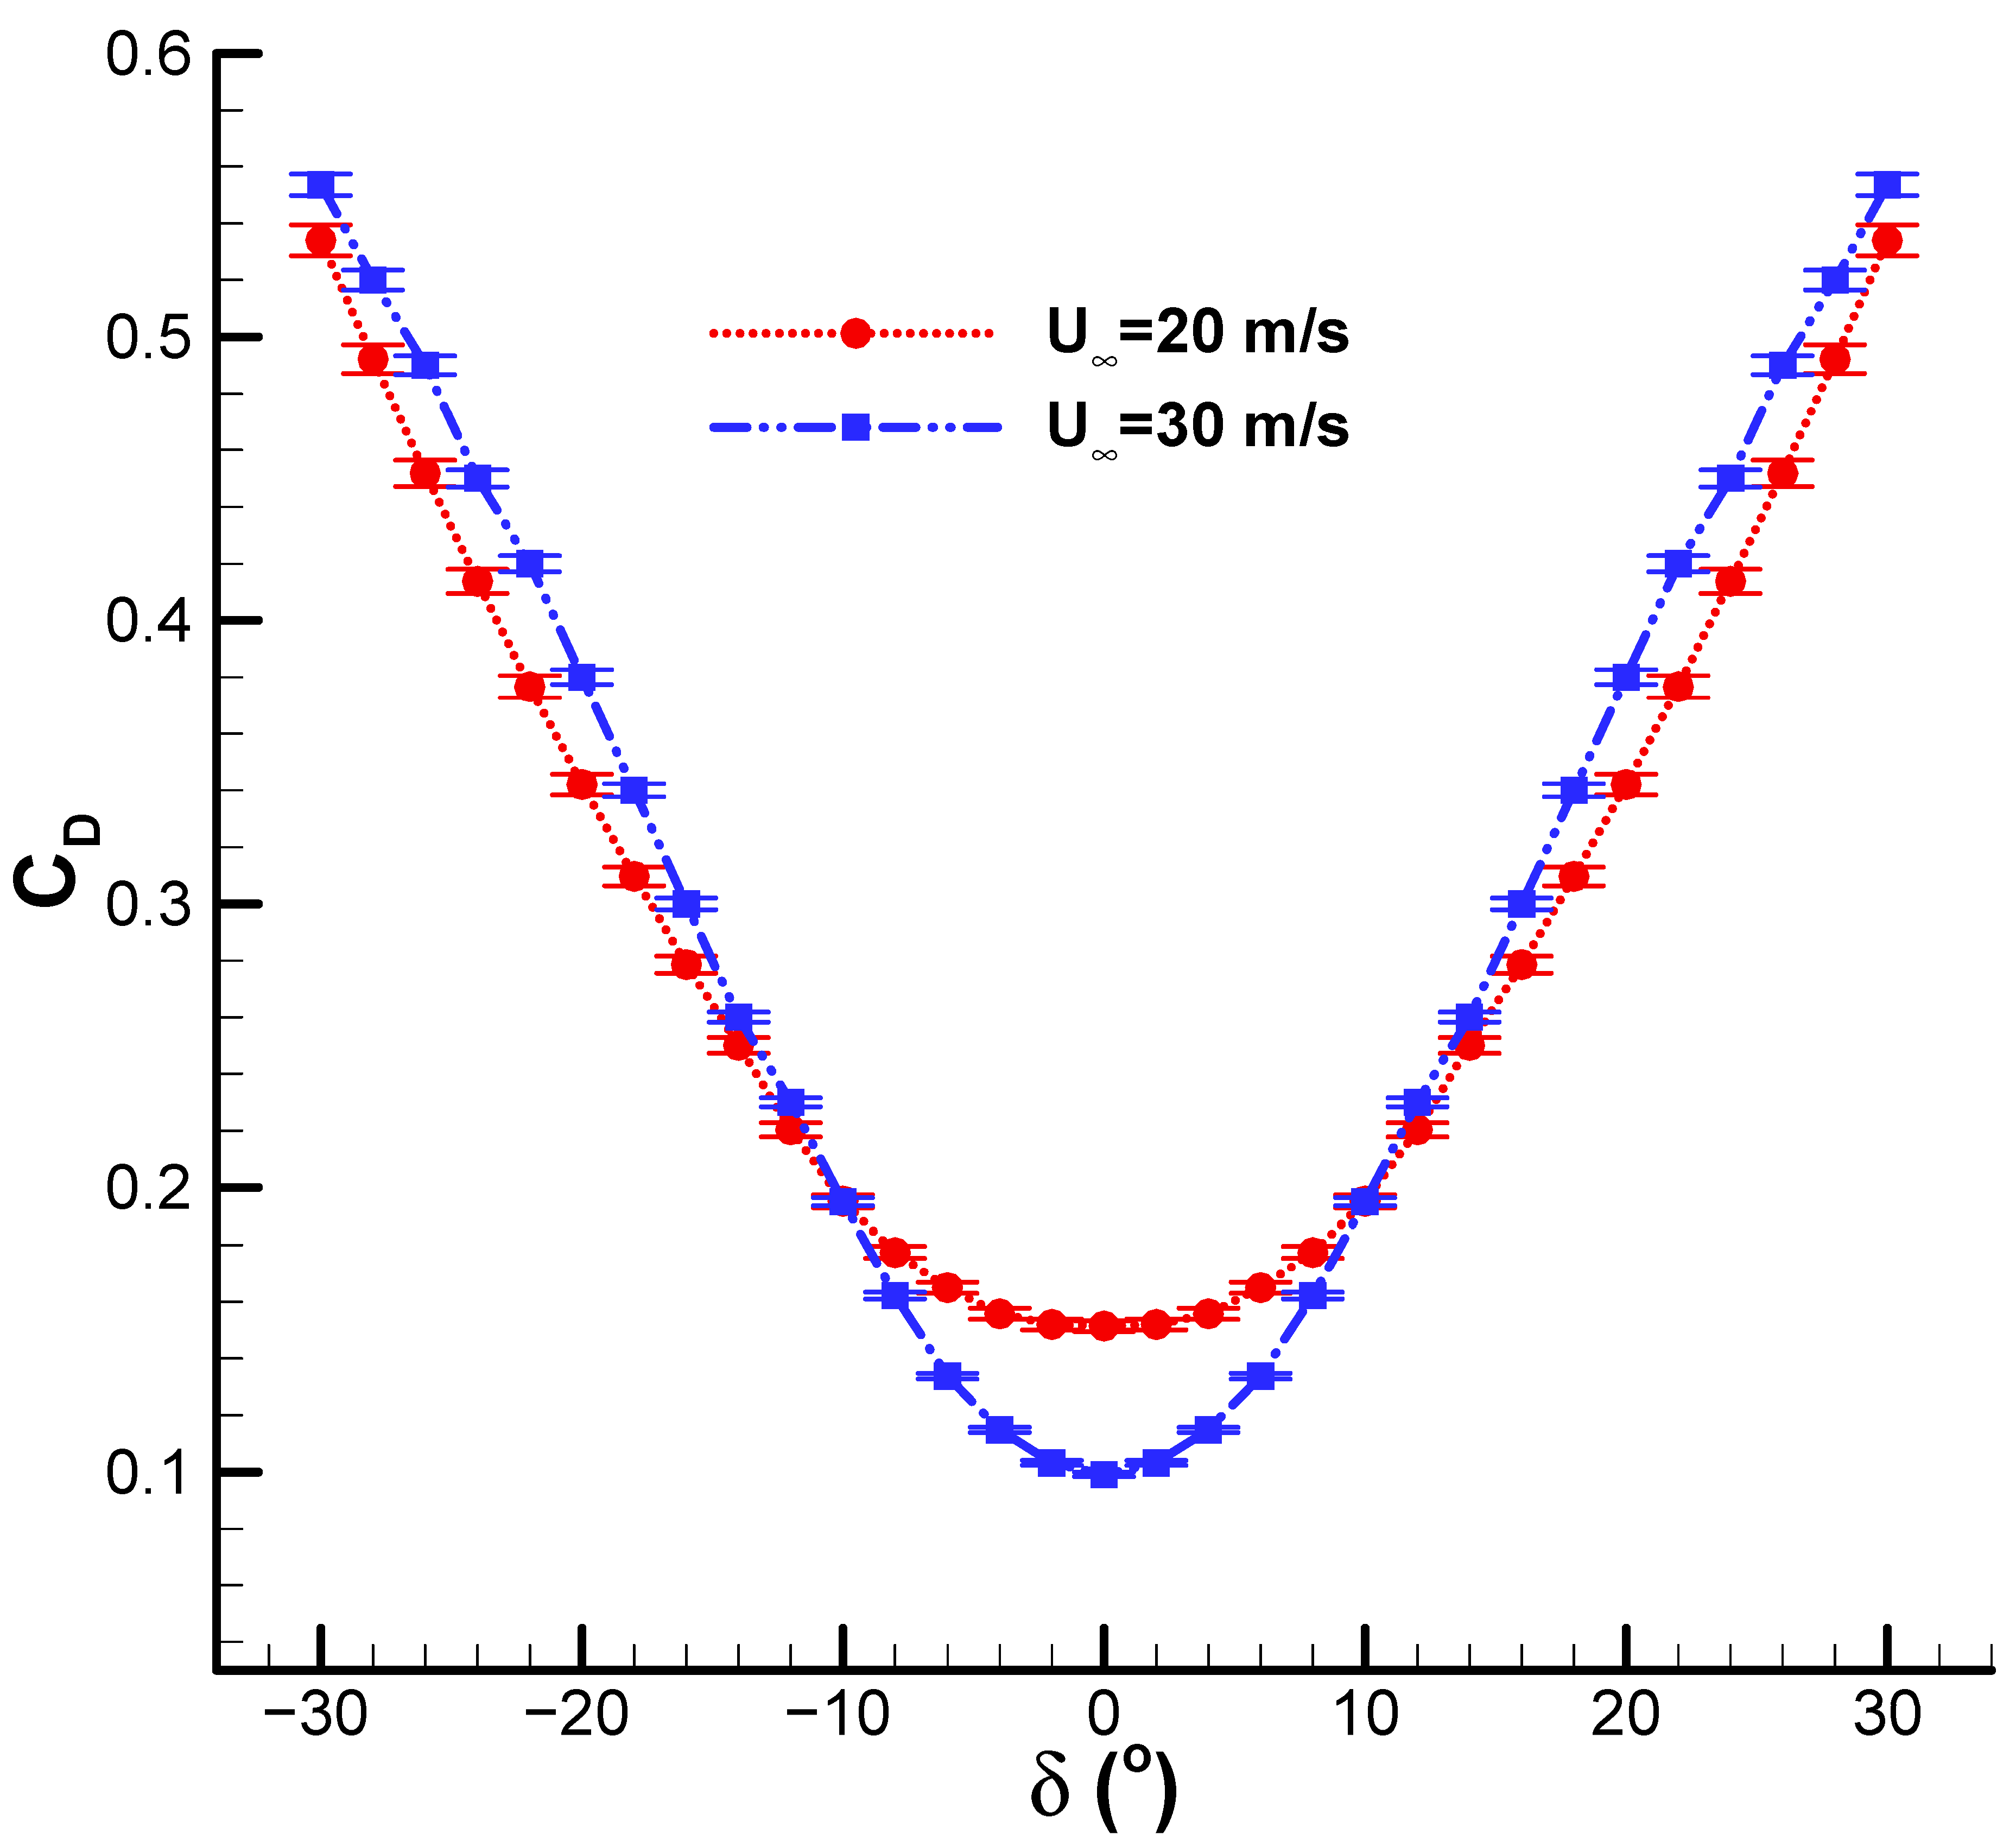
Figure 16 presents drag coefficient variations with rudder deflection angle at two freestream speeds, without sideslip. There is relatively little increase in drag coefficient up to rudder deflections of around 8°. Beyond this point, drag rises sharply with increasing deflection angle. The results indicate that the drag coefficient of the vertical tail under zero sideslip conditions reaches its minimum near zero rudder deflection angle (δ = 0) and increases almost symmetrically and steadily with the absolute value of rudder deflection. This trend is attributed to the rise in induced drag and the increased effective frontal area exposed to the flow as the rudder deflection magnitude grows. A comparison between the two freestream velocities shows that, although the overall trend of variation is identical, at 30 m/s the CD values are slightly lower than at 20 m/s close to the minimum of the curve. This may be due to Reynolds number effects and boundary layer behavior, which can result in a relative reduction in drag. The symmetry of the curves shows the balanced aerodynamic response of the vertical tail to positive and negative deflections, with no discernible asymmetric effects of flow within the test range.
At higher deflection angles, the flow over the rudder can separate, leading to increased drag. This separation occurs because the boundary layer cannot adhere to the surface, causing a turbulent wake and increased pressure drag. Flow separation is a critical factor that significantly affects the aerodynamic performance, leading to a nonlinear increase in drag as the deflection angle increases [
23]. The deflection of the rudder alters the pressure distribution around the vertical tail, which can lead to the formation of vortices. These vortices increase the drag coefficient nonlinearly as they create additional turbulent flow regions [
26,
50,
51]. The interaction between the rudder and the vertical tailplane can create complex flow patterns, including vortex shedding, which further contributes to the nonlinear behavior of the drag coefficient [
26,
51]. As the deflection angle increases, the boundary layer flow can transition from laminar to turbulent, which increases the drag coefficient nonlinearly. Also, high rudder deflection increases induced drag primarily through flow separation and aerodynamic interference. All of these can cause nonlinear behavior of the drag coefficient. The sharp rise in drag beyond a rudder deflection angle of approximately 8° (
Figure 16) is primarily attributed to the rapid increase in both induced and form drag due to flow separation and vortex formation along the rudder surface. At small deflections, the flow remains largely attached, and the incremental drag increase is minimal; however, as the deflection grows, the effective frontal area and flow curvature increase, promoting separation and enhancing pressure drag. Flow visualization around the vertical tail in some experimental studies such as [
29,
35,
52] confirms these nonlinear behaviors.
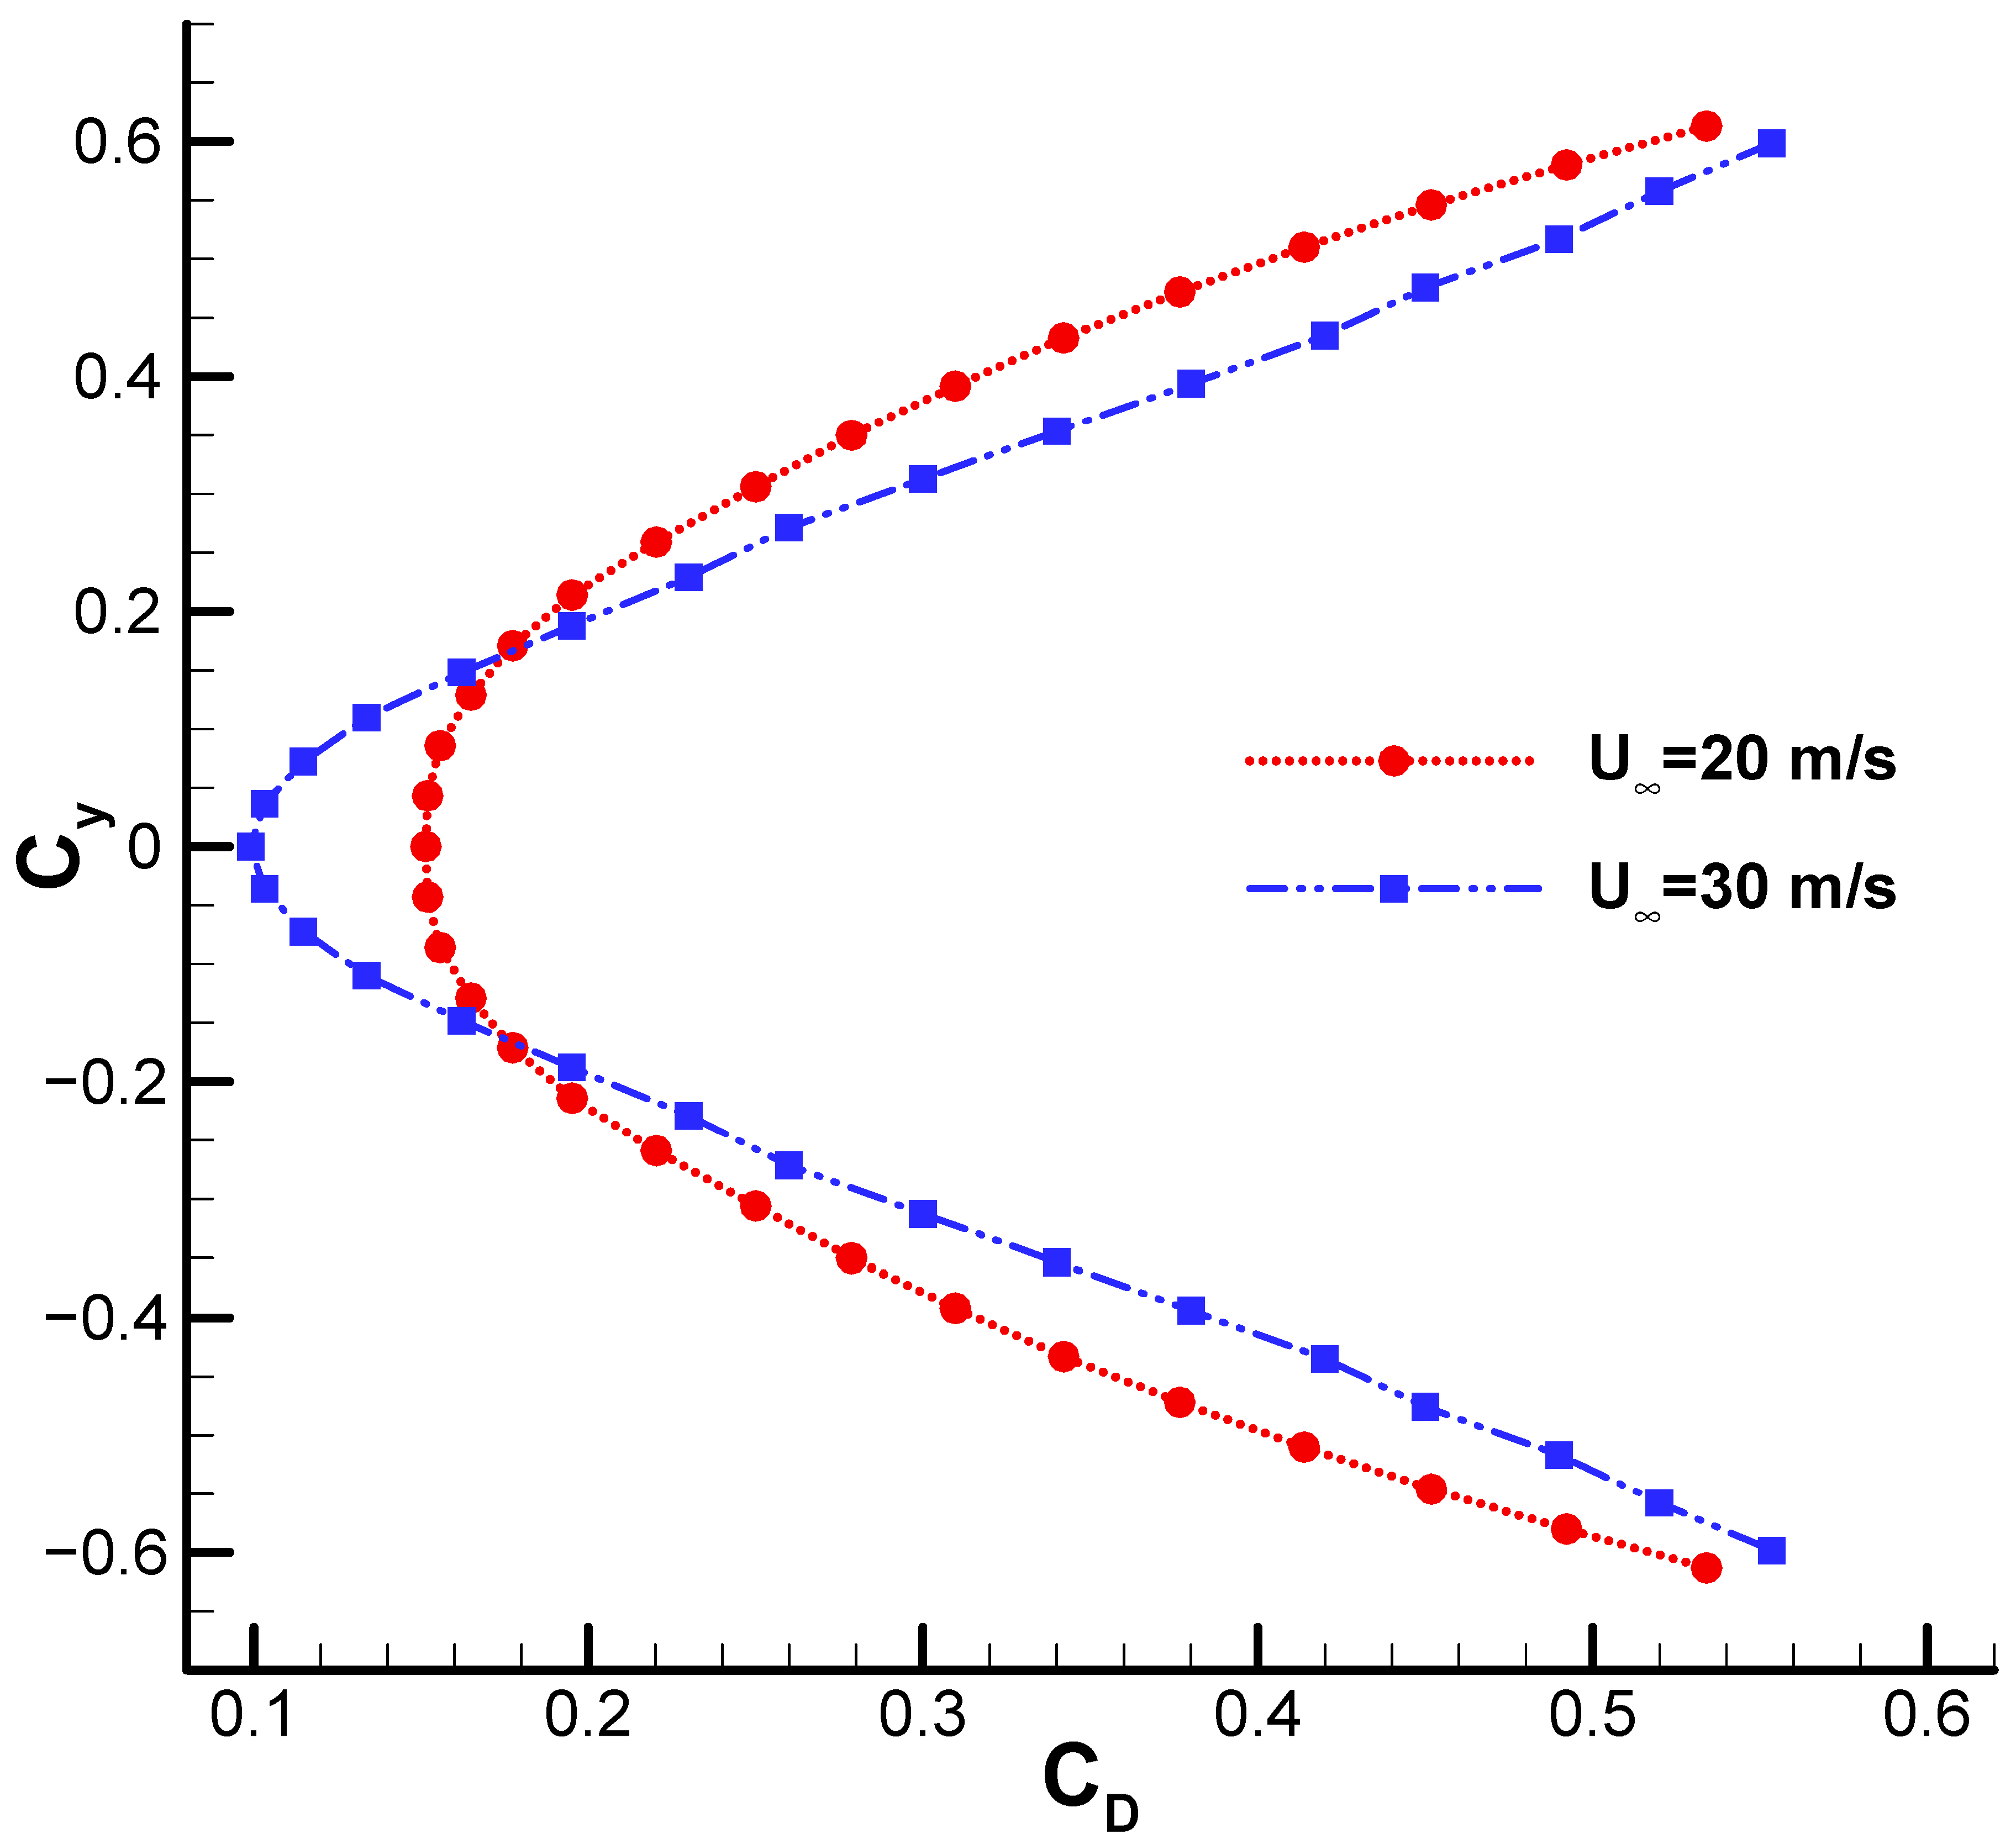
Figure 17 shows the drag polar of the vertical tail under zero sideslip conditions. A comparison of the curves at the two different freestream velocities reveals similar behavior; however, at a freestream velocity of 20 m/s, the side force coefficient is slightly higher at large rudder deflections than it is at 30 m/s. At small rudder deflection angles (i.e., low side force conditions), drag decreases slightly with increasing freestream velocity.
Finally,
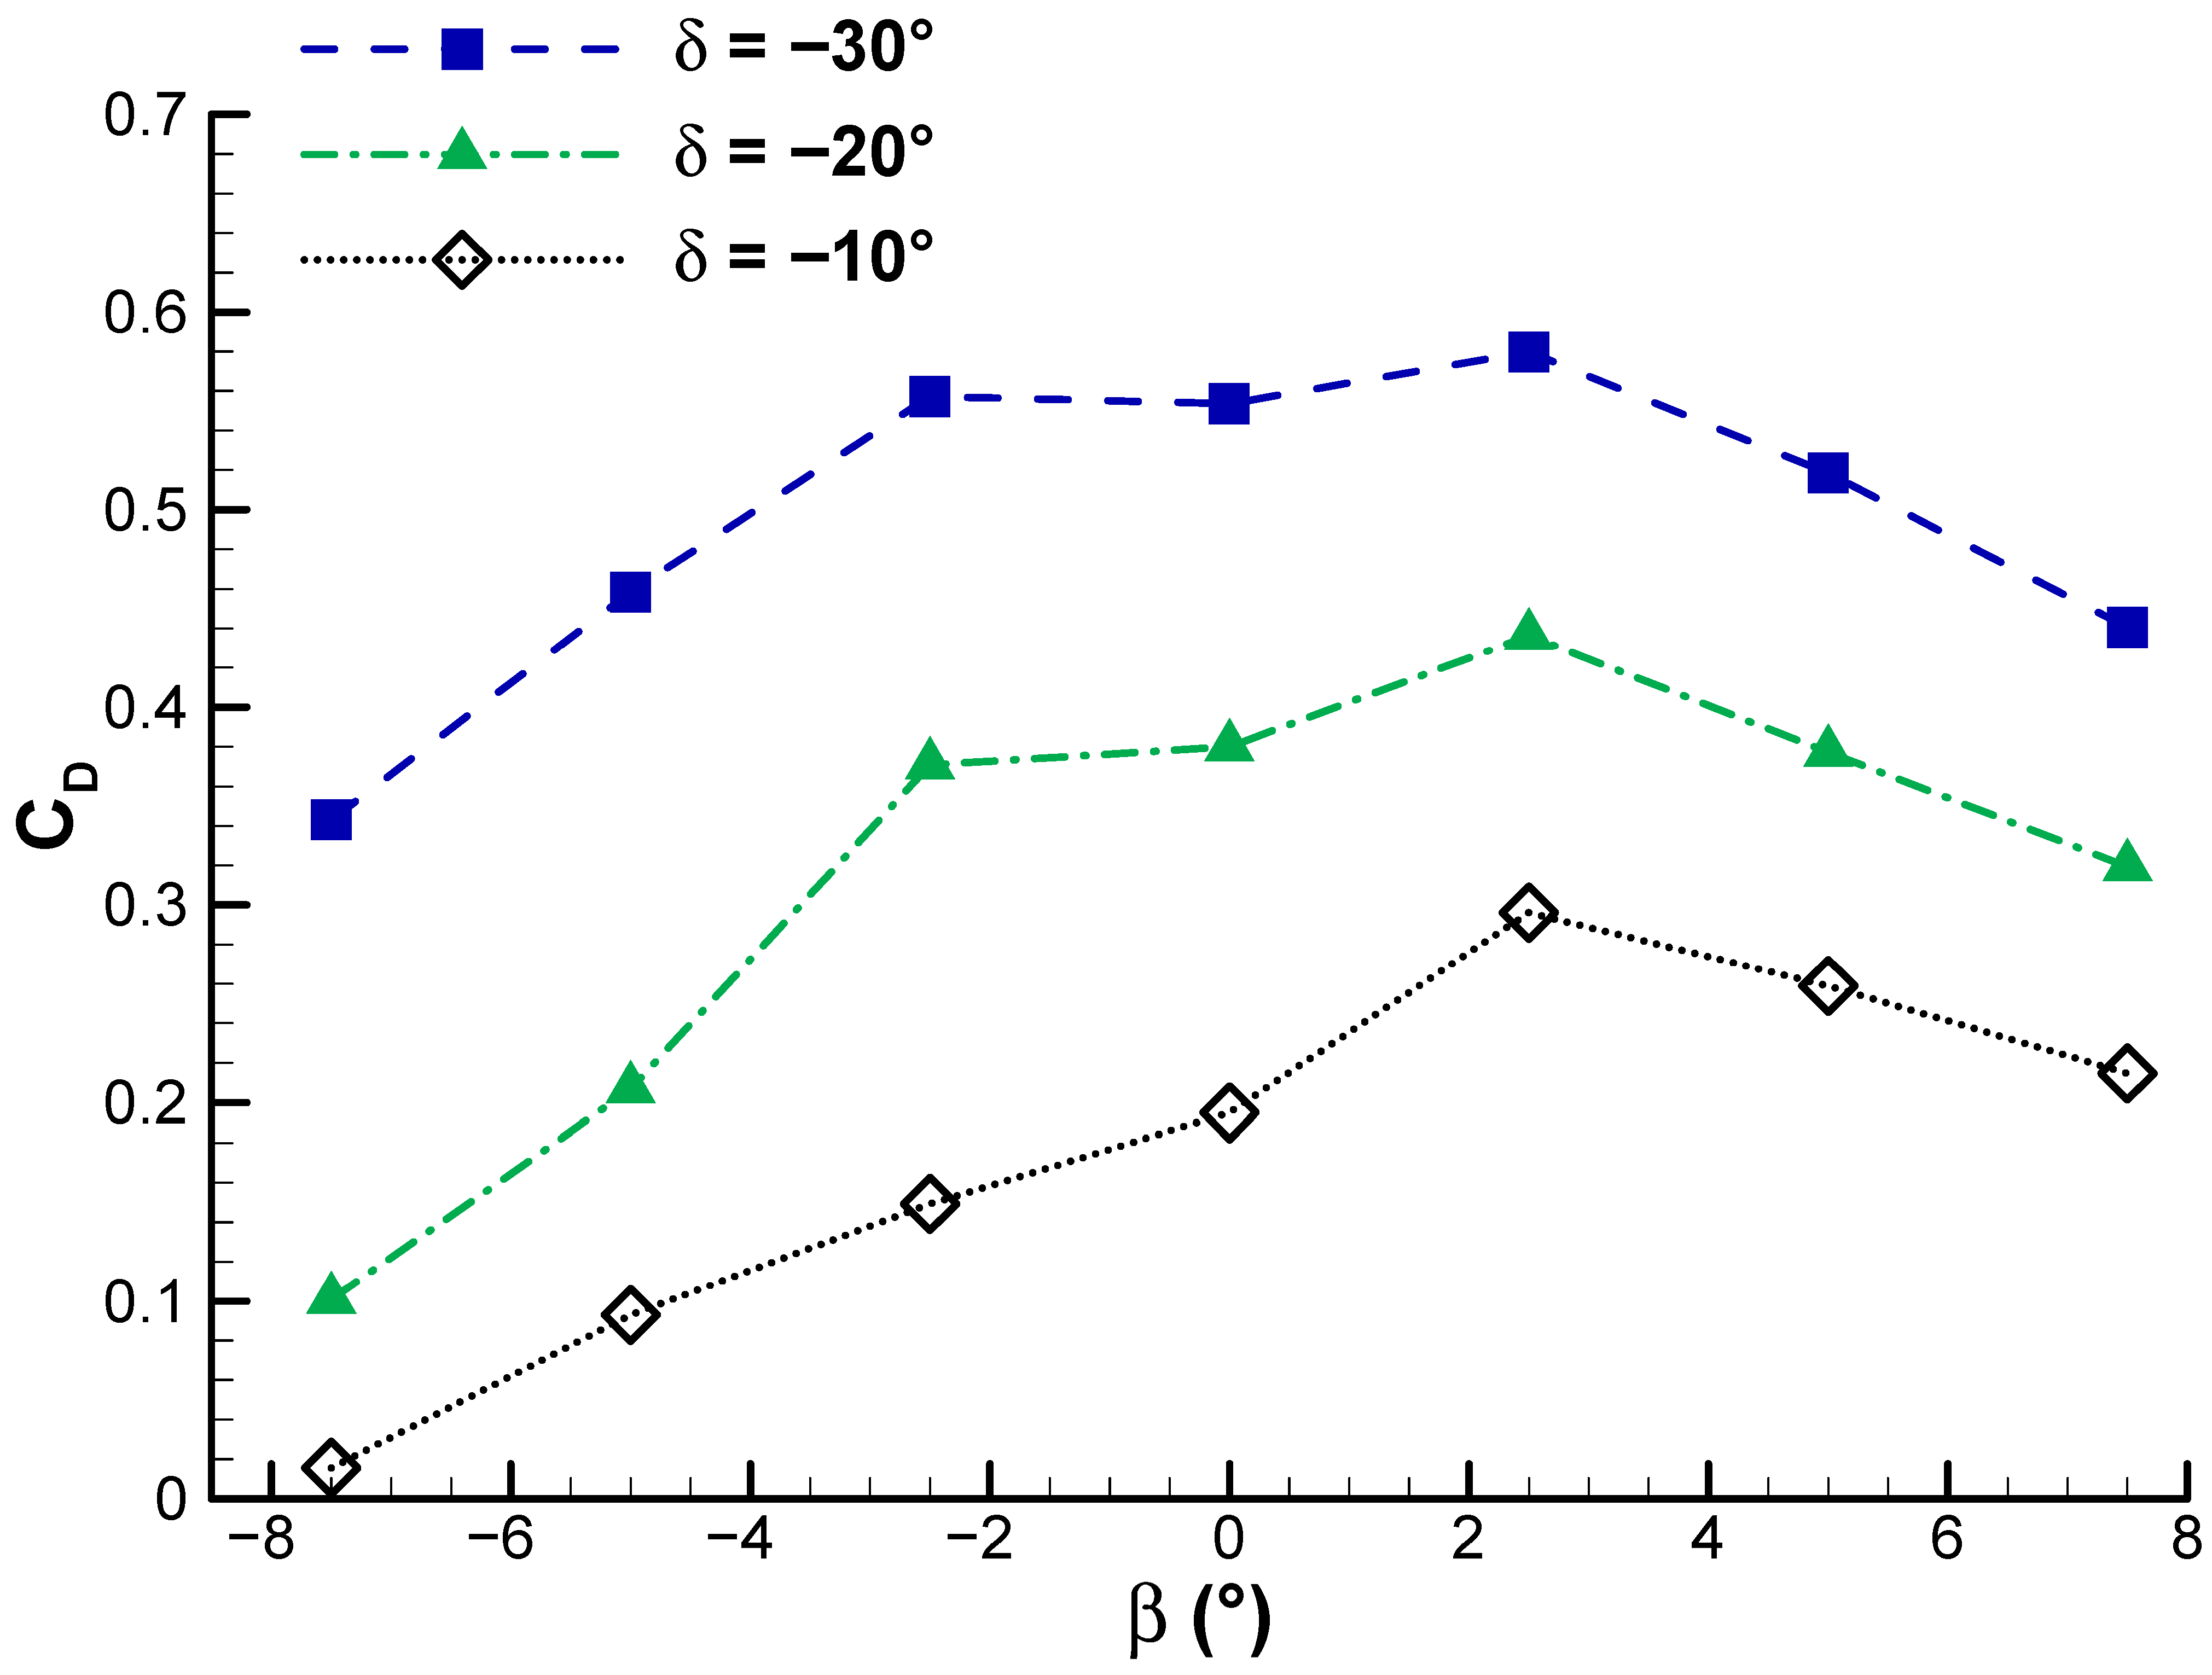
Figure 18 shows the sensitivity of drag coefficient to sideslip angle. Drag coefficient is reasonably sensitive to sideslip angle and changes nonlinearly with a declining trend as sideslip increases within the measuring range. The maximum drag coefficient occurs at about a 2.5° sideslip angle. Moreover, the dependency of peak locations on δ shows that the coupling between the lateral flow deflection caused by β and the rudder flow deflection alters the flow field around the vertical tail, producing a nonlinear contribution to overall drag. The nonlinearities observed in
Figure 18, particularly the peak in drag at around a 2.5° sideslip angle, are indicative of complex flow interactions between the sideslip-induced lateral flow and the rudder-induced turning of the boundary layer. Flow visualization in experimental studies [
29,
35,
52] supports these observations, demonstrating that vortex formation, flow separation, and induced drag effects collectively account for the nonlinear trends in the drag coefficient. This feature is attributable to the synergistic actions of induced and viscous aerodynamic effects at subsonic flow conditions.
5. Conclusions
In this study, the aerodynamic coefficients of the vertical tail of a small-scale model of a Boeing 777-200 plane were examined in a low-speed subsonic wind tunnel under various conditions. Understanding the side force and drag behavior of the vertical stabilizer under different conditions helps engineers predict and avoid potential issues such as aerodynamic instability, control reversal, and excessive drag. The aim of this study is to serve as a benchmark for future experimental and numerical investigations focused on maximizing the aerodynamic performance of vertical tails through the implementation of emerging flow control technologies.
A statistical comparison of vertical tail geometry for 65 civil jet aircraft reveals several key trends and design principles governing modern vertical tail configurations. The nonlinear correlations between geometric parameters, such as surface area, height, aspect ratio, taper ratio, tail arm length, volume coefficient, and maximum takeoff mass highlight the complexity of vertical tail design as a multi-objective optimization problem. Most significantly, vertical tail area and height show strong positive trends with aircraft mass, as the increasing requirements for directional stability and yaw control authority are addressed with larger tail sizes. The inverse correlation between the vertical tail volume coefficient and aircraft mass further underscores the influence of advanced flight control systems and refined aerodynamic modeling in enabling more efficient tail designs for heavier aircraft.
Experiments were performed to investigate the effects of sideslip angle, rudder deflection angle, and freestream velocity on side force and drag coefficients. The results indicate that, in the absence of sideslip, the side force coefficient varies from 0 to approximately 0.65 with different rudder deflection angles. When sideslip is present, the range of side force variation expands significantly, from about −1.1 to +1.1. The side force shows an approximately linear response to rudder deflection in the range of −30° to +30°, while the drag coefficient exhibits a highly nonlinear relationship with both rudder deflection and sideslip angle. Within the studied Reynolds number range of 5 × 10⁵ to 7.5 × 10⁵, changes in freestream velocity had little impact on the behavior or magnitude of side force coefficient. However, drag coefficients at lower rudder deflection angles were more sensitive to variations in freestream velocity.
Overall, the findings demonstrate that both sideslip angle and rudder deflection significantly influence the aerodynamic performance of the vertical tail. The largest uncertainty in the lateral force coefficient was ±0.011, while that in the drag coefficient was ±0.0055. In summary, this research provides reliable experimental data and geometric correlations that can serve as a reference for future experimental and numerical investigations aimed at improving the aerodynamic performance of aircraft vertical tails.
