Abstract
Mesenchymal stem cells are widely cultivated in stirred tank bioreactors. Due to their adhesion properties, they are attached to small spheres called microcarriers. To understand the hydromechanical stresses encountered by the cells, it is essential to characterize the flow using the PIV technique. However, the usual solid–liquid system used in cell cultures has poor optical properties. Thus, shifting to one with better optical properties, while respecting the physical characteristics, is mandatory to achieve a relevant representation. PMMA microparticles suspended with 61 wt% ammonium thiocyanate solution NH4SCN were found to be a robust candidate. The refractive index (RI) of both sides is of the order of 1.491 with a density ratio of 0.96, and particle size averaged around 168 μm. Using the RIM-PIV (refractive index matched particle image velocimetry) technique for a 0.7 L volume stirred tank equipped with an HTPG down-pumping axial impeller and operating at full homogeneous speed rpm, mean and turbulence quantities of the liquid phase were measured as a function of PMMA particle volume fractions , which ranged from 0.5 to 3 v%. This corresponds to a particle number density of particles/mm3, which is considered original and challenging for the PIV technique. At 3 v%, the addition of particles dampened the turbulent kinetic energy (TKE) of the liquid phase locally by 20% near the impeller. This impact became trivial (<10%) at the local-average level. The structure and direction of the recirculation loop also shifted.
1. Introduction
Over the past few years, mesenchymal stem cells (MSCs) have become promising in the fields of regenerative medicine, tissue engineering, and therapeutics, targeting a wide range of intractable diseases [1]. In vitro expansion processes are essential to meet the demand [2]. The biological nature of MSCs is anchorage-dependent, as they inherently rely on surface attachment for optimal function. A stirred tank bioreactor is one promising process for cell expansion, using small spheres called microcarriers as a support [3,4,5]. It is thus important to suspend the microcarriers to ensure enough mixing, maximize the adherence surface, and limit the cell aggregation. However, mechanical stirring will generate hydromechanical stresses in the medium that can lead to cell damage [6,7]. The density of the microcarriers is close to that of the liquid medium () to guarantee complete suspension at low agitation rates. Nonetheless, damage to cells can still be an issue in the form of interactions with turbulent eddies, shear stresses, and collisions [8].
To optimize the production process, developing and validating hydrodynamic models are crucial. Many authors have attempted to characterize bioreactors in terms of design and geometry [9,10,11], operating conditions [12,13,14], and microcarrier impact and critical suspension [15,16,17,18], both experimentally and numerically. Although few experimental studies have been conducted to characterize the interactions between the continuous liquid phase and particles such as microcarriers, with a small diameter (in the 150–300 μm range) and a density close to the liquid phase, there is still insufficient knowledge to propose robust design and extrapolation models. As such, there is a strong need to collect extensive experimental data to characterize this particular solid–liquid system, and Particle Image Velocimetry (PIV) appears to be an ideal tool for this goal.
PIV, commonly used for characterizing single-phase flows, is a non-intrusive, laserbased optical imaging technique for the evaluation of mean and fluctuating velocities. Solid–liquid systems present a complex domain for PIV due to the opacity of the multiphase flow as a result of the solid phase presence. In the case of MSC culture, commercial microcarriers, such as dextran-based Cytodex-1 or polystyrene Star-Plus, are typically used at volume fractions of = 2–3 v% [19] and exhibit poor optical properties. When PIV is applied directly to suspensions of commercial microcarriers, the latter cause significant perturbations and scatter the laser sheet, resulting in blurred raw images that are challenging to analyze reliably.
To account for the optical issues, a refractive index matching (RIM) technique between the dispersed and continuous phases could be a powerful tool, minimizing distortions to the laser sheet. An earlier attempt to use the RIM-PIV method was made by Northrup et al. [20] to measure the velocity vectors of the flow of heterogeneous porous media in a fluidized bed using PMMA particles of = 9.4 mm. Another interesting study by Hopkins et al. [21] characterized the flow in a complex geometry: a model of the human nasal cavity made of clear silicone. Additionally, Morgan et al. [22] described the behavior of liquid–liquid flow in a horizontal circular tube by matching Exxsol D80 oil and a glycerol solution. A more recent application of RIM-PIV by Bluestein and Bohl [23] investigated particle-laden flow in a T-shaped geometry by matching hydrogel particles in water.
On the other hand, few authors have examined the solid–liquid flow characteristics in stirred tanks using PIV, particularly the impact of the solid phase on the liquid phase. To our knowledge, the first study was reported by Virdung and Rasmuson [24], where they used glass beads 1 mm in diameter that matched the refractive index of a benzyl alcohol/ethanol mixture up to 1.5 v% loading, suspended by means of a pitched-blade impeller with a corresponding Reynolds number of Re = 7500. They noticed an increase in the r.m.s. velocities with the increase in particle concentration. Unadkat et al. [25] also used glass spheres with a size of 1 mm, which were, however, suspended in water without matching the refractive index, reaching a dilute volumetric fraction of 0.5 v%. The two phases were then separated using a phase discrimination technique. The application of a fully turbulent regime of Re = 30,800 resulted in the suppression of the turbulence levels in the continuous phase for particle concentrations above 0.2 v%, as indicated by the turbulent kinetic energy TKE and the dissipation rate ; the suppression level remained stable up to 0.5 v%. Gabriele et al. [26] used RIM-PIV for a small, high-throughput-scale tank with a 45 mm diameter. PMMA spheres of a relatively large 1.5 mm size were suspended in p-cymene solution up to 5 v%, at a speed below the critical suspension speed of at Re = 9300. The TKE levels in the impeller region were dampened by 40% and the dissipation rate by 30–50% of the liquid flow. Note that the estimation of the dissipation rate by the two mentioned authors was based on the Smagorinsky subgrid-scale (SGS) method [27]. The work by Montante et al. [28] covered the dilute suspension of 0.2 v% glass particles, which were 115 and 774 μm in diameter, without RIM for the liquid phase at Re = 88,000, corresponding to a fully turbulent system. They found that the smaller particles moderately reduced turbulent fluctuations while enhancing the levels of the larger ones. Another recent paper featuring RIM-PIV by Li et al. [29] discussed the effect of 7 mm diameter silica glass spheres of 8 v% concentration on the continuous phase represented by phenyl silicone oil at Re = 10,000. Within the partially suspended state, the presence of particles attenuated the peak levels of TKE by around 41%.
Laser Doppler Anemometry (LDA) is yet another laser-imaging technique for capturing the flow, which is also widely used in research. Studies that addressed particle-laden flow inside stirred tanks and used this technique side-by-side with the RIM method include those by Nouri and Whitelaw [30], Kohnen and Bohnet [31], Micheletti and Yianneskis [32], and Virdung and Rasmuson [33]. Phase Doppler Anemometry (PDA) was used by Guiraud et al. [34] for the investigation of dilute solid–liquid suspension in stirred tanks. Nouri and Whitelaw [30] used a mixture of tetralin and turpentine oil to match the refractive index of Diakon particles up to 2.5 v% concentration with sizes ranging from 590 to 730 μm. The experiments were applied to different geometric setups and Re numbers using a large tank volume (≈20 L). Overall, they found that the particles led the bulk fluid in down-flow motion and lagged it in up-flow regions compared with single-phase flow. The particle turbulence levels were lower by 15% in the impeller stream and 10% in the wall jet than those of the single-phase flow. Note that the fluid velocities in the presence of particles could not be measured due to the appearance of gas inclusions (bubbles or voids) inside the particles. A similar approach was followed later by Micheletti and Yianneskis [32], using the RIM method to suspend styrene/divinylbenzene particles of 186 μm size into a tertiary organic mixture at volumetric concentrations up to 2 v%, at Re = 20,000. Suppression of the radial component of both the mean and the r.m.s. liquid velocities in the impeller plane was observed, the latter by around 50% compared to single-phase values. This attenuation in turbulence levels was noticed at low concentrations of 0.2 v% and did not drop further after 1 v%.
So far, limited attention has been paid to the density-matching criterion between the carrier and the particle states (), the range of particle sizes (100–300 μm), and the impact of a relatively moderate Reynolds number on the flow. Most of the studies mentioned were carried out at large density differences (), except for the work of Micheletti and Yianneskis [32], which was conducted at a high Reynolds number. Few studies considered particle sizes in the μm range (microparticles), whereas the agitation was provided by either a Rushton turbine or a pitched-blade turbine impeller. Furthermore, it is important to note that among the authors cited, those who reported the Stokes number found it to be greater than unity () under the relevant operating conditions.
The literature on the effect of particle addition on fluid turbulence at low Stokes numbers () is even more limited. A very recent study by Sommer et al. [35] which covered a range of density ratios, particle diameters, and solid volume fractions, revealed that polyethylene particles of 150–180 μm in size up to 0.1 v% concentration and = 0.91 dampened the fluid turbulent fluctuations for Stokes numbers as low as = 0.019. Ferrante and Elghobashi [36] previously showed, using DNS data for a particle-laden suspension, that the trajectories of microparticles of St≪1 and a size of 63 μm at = 0.1 v% with = 0.001 were almost aligned with those of fluid points, allowing vortical structures to be retained for a longer time and increasing the turbulent kinetic energy and viscous dissipation rate compared to single-phase turbulence.
Table 1 below summarizes the main experimental research carried out in stirred tanks with solid–liquid flows, along with the technique used to measure the flow and the characteristics of the experimental setup. In addition, it further highlights the scarcity of experiments dedicated to revealing the effect of the addition of particles on the behavior of the liquid phase.

Table 1.
Side-by-side comparison of solid—liquid multiphase flow studies in stirred tanks. Particle number density n is not reported for the mentioned works and is estimated based on the given data.
The main goal of this work is to characterize the influence of the presence of microparticles on the liquid phase flow under conditions as close as possible to those encountered in MSC culture. As the optical properties of commercial microcarriers are not ideal, the first step is to establish a substitute RIM solid–liquid system (PMMA particles suspended in ammonium thiocyanate NH4SCN solution). The challenge lies in meeting the original model properties, including matched densities of both phases, microparticle size range, low viscosity of the liquid phase, and intermediate Reynolds and low Stokes () numbers for a valid representation of the original system. The PIV technique is then used to evaluate the influence of particle addition at various volume fractions ( v%) on the hydrodynamics of the liquid phase alone. The volume fractions reached not only represent the relevant condition in which the MSCs are cultured, but also correspond to a particle number density particle/mm3, which creates a dense field of particle—fluid interfaces, making conventional PIV subject to multiple scattering and laser sheet distortion. RIM is therefore essential to preserve tracers and recover reliable velocity fields at such concentrations.
2. Materials and Methods
2.1. Solid–Liquid System Properties
Previous studies characterized microcarrier suspensions, both experimentally and numerically, using Cytodex-1 ( = 170 μm and = 1020 kg/m3) suspended in a phosphatebuffered saline (PBS) solution of 1 v% concentration ( = 1000 kg/m3) to control the microcarrier diameter [14,16]. Because this liquid phase is a dilute saline solution, it is hereafter referred to as “water” for simplicity. Unlike many commercial plastic microcarriers, Cytodex-1 microcarriers are partially translucent, and PIV measurements were attempted with this solid–liquid system. However, the refractive indices of the solid and liquid phases were not perfectly matched, limiting measurements to very low solid volume fractions (<0.5 v%), which are far from the actual ones used in cell cultures.
In this work, the system is composed of PMMA particles (Cospheric) of = 168 μm and = 1185 kg/m3 and ammonium thiocyanate NH4SCN solution of 61 wt% (weight percent) corresponding to = 1139.2 ± 0.1 kg/m3 and = 1.94 ± 0.01 mPa·s. Table 2 compares the properties with those of Cytodex-1/Water. The solid–liquid system is refractive index matched for RI = 1.491 ± 0.005 at T ≈ 22–23 °C, measured using an Abbé refractometer, with no signs of water absorption [37]. Since direct measurement of the RI of the solid particles was not possible, it was assessed via a microscope in the presence of NH4SCN solution and by referring to the literature [38,39]. The difference between Cytodex-1/water and PMMA/NH4SCN systems can be noticed in the microscope images (see Figure 1) with magnification. PMMA microparticles match the light background when immersed in 61 wt% NH4SCN solution, whereas the opaque Cytodex-1 particles exhibit black contours/circumferences. It is important to note that the PMMA/NH4SCN system is used solely in this work as an optical substitute and is not intended for MSC culture.
Table 2.
Properties of alternative and original systems: PMMA/NH4SCN and Cytodex-1/Water.
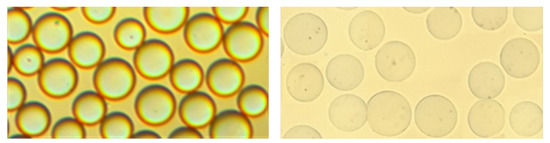
Figure 1.
LEFT: Cytodex-1 in water, RIGHT: PMMA inside 61 wt% NH4SCN.
2.2. Stirred Tank and PIV Setup
The tank (see Figure 2) used for the experiments is made of borosilicate glass with a hemispherical bottom shape and is equipped with a three-bladed axial down-pumping HTPGD impeller (Pierre Guerin). For geometrical concerns, it was operated with C/T = D/T = 0.5, where C is the off-bottom clearance, D is the impeller diameter, and T is the tank diameter, with T = 0.12 m. The working volume is V = 0.7 L, corresponding to a liquid height of H = 0.082 m (H/T = 0.68). The tank is unbaffled but equipped with four dip tubes housing the necessary sensors (temperature, pH, etc.), which play the same role as baffles and prevent the swirling phenomenon. This configuration differs from previous studies conducted by our team, but was chosen to replicate as closely as possible recent studies on MSC cultures [40].
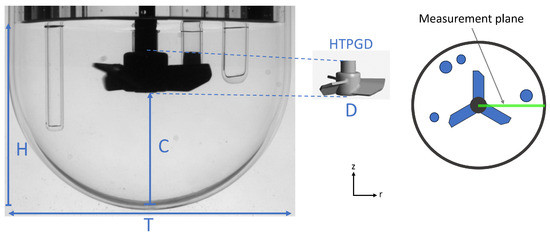
Figure 2.
(left): Geometrical configuration of the stirred tank used. (right): Top view of the measurement plane.
Moreover, the stirred tank is held in an aquarium filled with paraffin oil (RI ; Fauth) to match the RI of the tank wall and thus limit the diffraction in the laser sheet due to the curvature of the wall. It is also worth noting that the temperature is controlled by means of an air conditioner inside the operating room.
Using the configuration described above, the experiments were carried out using ensemble-averaged PIV to characterize the flow in terms of mean and fluctuating velocities (see Figure 3). The idea is to evaluate the effect of particle loading on the liquid phase up to the desired 3 v%, which is ideal in MSC culturing. This corresponds to an average total number of particles of 8.5 million. To put this into perspective, that would give 12 particles in a 1 mm3 volume (particle number density), which is impractical to utilize with PIV without RIM. To investigate the effect of particle addition, the rotation speed was fixed at a constant N = 150 rpm (Re ), which was sufficient to maintain a homogeneous suspension of the particles and to avoid air-bubble entrapment from the surface.
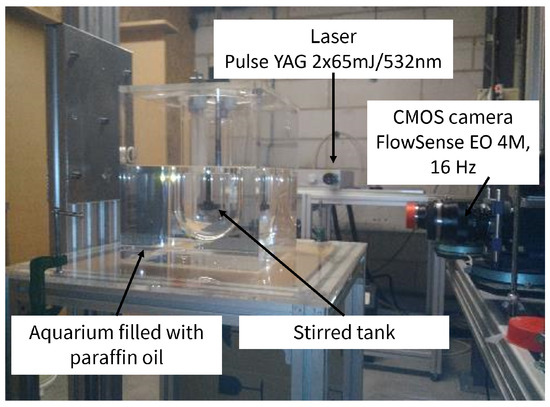
Figure 3.
PIV setup.
The PMMA/NH4SCN multiphase flow was seeded with 20 μL Rhodamine-coated PMMA fluorescent tracers (Initial concentration = 0.25 g/mL, Dantec Dynamics), with an emission wavelength of 584 nm, size distribution of 1–20 μm, and density of = 1190 kg/m3. These tracers are neutrally buoyant in the 61 wt% NH4SCN solution and their density closely matches that of the PMMA particles, as they are PMMA-based. The addition of seeding particles to the medium was thoroughly controlled to avoid any shift in the RI of the suspension, which could diminish its transparency [41].
The required PIV illumination was provided by a Nd:YAG double-pulse laser of 532 nm wavelength operating at 50 mJ. Image pairs were captured by a single CMOS camera (FlowSense EO 4 M), with a maximum acquisition frequency of 16 Hz and a resolution of pixels. It was mounted with a 570 nm high-pass filter lens to remove any unwanted emissions and reflections. The spatial resolution determined from the calibration was 1.1625 mm. The acquisition setup enabled the synchronization between the camera and the laser with a time interval between pulses of =1000–1200 μs. The latter was chosen to ensure that the maximum displacement of tracer particles between pulses was one quarter of the length of the interrogation area [42], according to Equation (1).
where is the image magnification and is the tangential velocity at the blade tip ( = ). To ensure statistical convergence of the mean velocities and turbulence statistics, and to sample multiple impeller-blade passages, 1000 image pairs were acquired per measurement at an acquisition rate of 15.8 Hz.
2.3. Flow Properties
Kolmogorov’s 1941 theory states that at the Kolmogorov scales, energy dissipates as heat due to the fluid’s dynamic viscosity. Resolving the dissipation rate therefore requires an applicable spatial resolution down to these smallest length scales. Within the achieved PIV calibration, only turbulent structures above the measurement resolution could be observed. Therefore, one way to estimate the energy dissipation is to evaluate the mean energy dissipation in the domain based on the power number equation :
where V is the fluid volume and 0.67 is the corresponding impeller power number [43]. This estimation is a key for evaluating several scales of the domain. One such scale is the Taylor microscale , which is not straightforward to obtain and typically requires derivations of the correlation functions of the flow [44]. It was then estimated as:
This scale provides not only information on the transition from large energy-containing eddies to small dissipative eddies, but also a benchmark for the PIV resolution required to accurately capture an adequately broad turbulence spectrum.
Following an approach used by Simon et al. [45], the turbulent kinetic energy k was used a posteriori to estimate the averaged Taylor microscale, . This yielded 3.3 mm (), about three times larger than the spatial resolution used (), which can thus be considered acceptable.
A brief remark on the average Kolmogorov length scale evaluated in Equation (4) reaffirms that the PIV spatial resolution is not accurate enough to capture the local dissipation rate at the lowest length scales. The estimated μm (), corresponding to , would capture only approximately 50–60% of the true dissipation rate, whereas a ratio of is typically needed to achieve 90% accuracy in the energy dissipation measurement [46,47].
The average Kolmogorov time scale is another dissipation rate scale-dependent, obtained from dimensionless analysis:
The ratio between the particle settling velocity and the Kolmogorov time scale, well known as the Stokes number , characterizes the behavior of particles evolving within the carrier flow [48,49]. For , particles follow the streamlines and are easily suspended, while for , particles do not have time to adjust to sudden changes in the flow and may separate from the carrier flow. A value of = 0.078 was estimated in the present study and is further discussed in the results and discussions section. Note that particle-settling experiments were followed as in [16], to determine the particle relaxation time :
2.4. PIV Treatment and Post-Processing
The raw images recorded were processed in Dantec Dynamics software v7.3, first by a mask to hide the impeller, the dip tubes, and the external background. A low-pass filter was then applied to the images to eliminate part of the noise due to the presence of PMMA particles. The image pretreatment method used was based on generating a background by computing the minimum power mean grayscale values from the series of images (also known as the generalized mean) and then subsequently subtracting this background from each image.
The vector map of instantaneous velocities was obtained by applying an adaptive correlation scheme (Adaptive PIV) with a final window size of 32 × 32 pixels and a 50% overlap, corresponding to a final spatial resolution of 1.1625 mm. Finally, an N validation step was included for the elimination of spurious velocity vectors resulting from the vector map treatment. The N method simply computes the mean and r.m.s. () values from the vector-map series and subsequently rejects all vectors lying more than 3 · from the mean (N = 3), so that the highly deviated ones are disposed. The addition of particles up to 3 v% did not increase the fraction of invalid vectors, the number of which remained rather stable and very low. On average, one rejected vector was found in every three images through all our measurements, corresponding to a validation of more than 99%, indicating a good vector map quality. For more information on vector validation and PIV reliability, the readers are invited to check the work by Scharnowski and Kähler [50]. The obtained results were then post-processed in MATLAB (R2023b) for further analysis.
Using the time-averaged and instantaneous flow fields, and u respectively, and by means of the Reynolds decomposition , the fluctuating velocity terms were evaluated. However, it is well known that close to the impeller, the fluctuations contain periodic and turbulent modes. The former is an organized motion generated by the impeller-blade rotation (impeller passage), in contrast to the principle of chaotic and irregular turbulent motions. Thus, synchronization of the data acquisition with the blade position can be used to separate periodic and turbulent fluctuations in what is often called an angle-resolved approach. This method is widely used in PIV systems, especially in the cases where the energy dissipation rate is estimated [51,52]. Nevertheless, in the event that such a tool is inaccessible, it was shown that close to the impeller, there is a strong transfer of kinetic energy between periodic kinetic energy within the trailing vortices and turbulence, which then dissipates it at viscous scales. It was also shown that the dissipation rates of the mean and periodic kinetic energy were negligible compared to the dissipation rate of turbulent kinetic energy [53]. Hence, the classical Reynolds decomposition between the mean and fluctuating velocity components was considered sufficient. From the mean quantities, the time-averaged magnitude M of the flow was thus determined:
where and are the mean velocities in the radial and axial directions, denoted by subscripts r and z respectively. The determination of turbulent kinetic energy theoretically requires resolving all of the fluctuating velocities. Since the measurements were in a 2D coordinate system, the third unknown component was estimated assuming pseudoisotropy, and the turbulent kinetic energy TKE was computed using Equation (8) [54,55].
The velocities and turbulent kinetic energy data were scaled by and , respectively. The non-dimensional variables are:
3. Results and Discussions
3.1. PIV Treatment Assessment
Despite the use of a RIM solid–liquid system, the presence of PMMA particles influences the PIV raw images as shown in Figure 4, where raw images taken without (a) and with particles at a concentration of 3 v% (b) are presented. The brightness of the background increases due to additional noise in the images as particle concentration increases. The use of RIM-PIV becomes highly demanding when the number of particle–fluid interfaces increases significantly: each interface introduces a slight refractive-index mismatch that can accumulate and cause image deformation [41]. In addition, at a given solid concentration, the interface number or surface area becomes more crucial when dealing with particles with μm sizes compared to much larger particles. Of course, the decreasing quality of raw images is not as marked compared to that observed when using the original solid–liquid system (Cytodex-1/Water). Figure 5a,b compares the maximum volume fraction reached by Cytodex-1/water = 0.5 v% with that of PMMA/NH4SCN, respectively. It is evident that the presence of Cytodex-1 significantly deteriorates image quality, underscoring the need to find an alternative system, even at a concentration as low as = 0.5 v%. The high noise generated by scattering of the laser sheet makes tracer tracking impossible, unlike in the PMMA system, in which the tracking of the seeding particles is preserved. The brightness increase in images due to the PMMA particle addition can be addressed with the image treatment used to eliminate noise (minimum power mean filter), as seen in Figure 4c,d where PIV images after applying the noise filter are presented without particles and with 3 v% particles, respectively. The use of the filter without particles does not significantly influence the quality of the original raw images, as expected. On the other hand, applying this filter to images with PMMA particles significantly enhances the contrast between the seeding particles and the background. Nevertheless, a drop in the seeding particle number is noticed, especially under the impeller region, as a corollary of the diffraction of the laser sheet passing through the medium. However, this drop is not significant enough to alter the PIV detection algorithm, and the number of particles detected is still sufficient to ensure robust results.
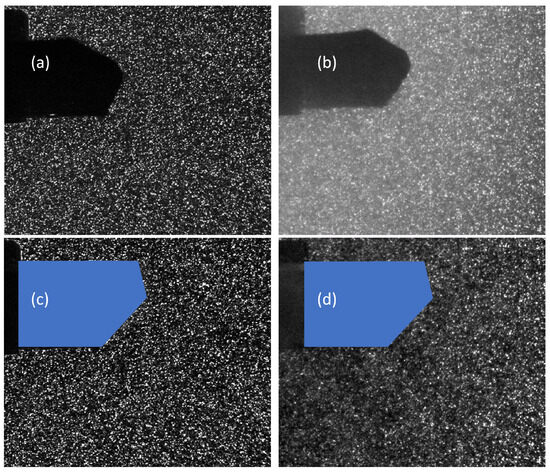
Figure 4.
PIV raw images (a): 61 wt% NH4SCN solution only (b): = 3 v% PMMA/NH4SCN (c): 61 wt% NH4SCN solution only—with filter (d): = 3 v% PMMA/NH4SCN—with filter.
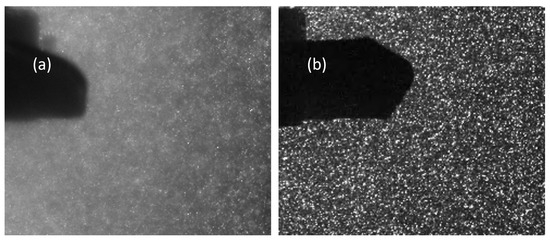
Figure 5.
PIV raw images at = 0.5 v% for (a) Cytodex-1/water (b): PMMA/NH4SCN.
3.2. Flow Analysis
To achieve rigorous results analysis and consistency, the experiments were repeated three times for each solid concentration. Each time, the particles were recovered and the solution was disposed for a newly prepared one. The standard deviation between locally measured quantities (velocity and TKE) in successive experiments was used to evaluate the experimental error. Note that this experimental error, determined from replicates, is not limited to an assessment of the repeatability of the PIV technique (for a given experiment). It is in fact an experimental error that takes into account all potential sources of error: liquid solution composition, solid concentration, laser alignment, camera focus, loss of seeding particles, to name but a few.
On average, the experimental error is around 0.025–0.027 ND ≈ 0.008–0.009 for velocity magnitude and 0.006–0.008 ≈ 6.1–8.1 × for turbulent kinetic energy of = 0 v% and 3 v% respectively. Figure 6a,b shows the differences in local experimental error between the single-liquid phase and the solid concentration of = 3 v% for mean velocity magnitude, while Figure 6c,d shows those for TKE, respectively. For both quantities (velocity and TKE), one may observe a slight expansion (around ) of error regions in the contour plot for the = 3 v% system. These regions are mainly below the impeller where off-plane tangential velocities are dominant and above the impeller at the end of the recirculation loop. The expansion observed near the impeller blade tip is more likely due to laser light reflection.
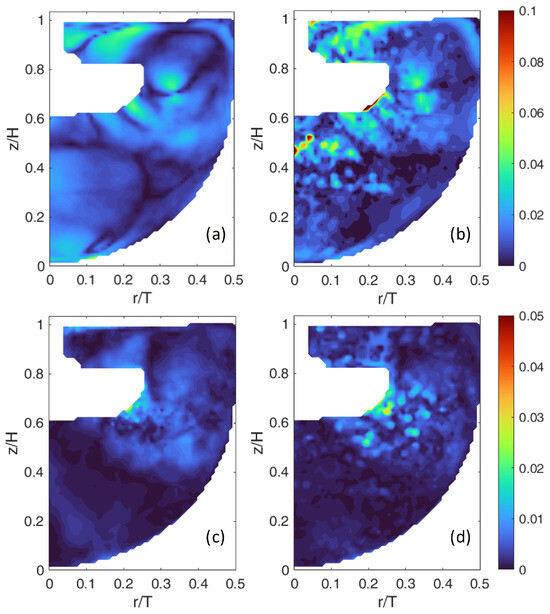
Figure 6.
Experimental error contours (-). First row: error on non-dimensional velocity (a) single-phase and (b) PMMA = 3 v%. Second row: error on non-dimensional TKE (c) single-phase and (d) PMMA = 3 v%.
To firmly investigate the effect of the addition of PMMA microparticles on the fluid flow turbulence, PIV results are presented and analyzed in two manners. First, 2D velocity magnitude and turbulent kinetic energy profiles are plotted along two axial (vertical) and one horizontal lines. On all plots, the center of the tank floor, just below the agitator axis, is the origin of the axes. The axial and radial profiles are located at:
- r/T = 0.226, which cuts through the impeller tip to cover the beginning of the discharge flow and the ending phase of the recirculation loop;
- r/T = 0.452, near the wall, which covers the other half of the loop;
- z/H = 0.780, above the impeller, which covers the top of the recirculation loop.
For the sake of clarity, the profiles are presented only for the two extreme cases: single-phase flow (without PMMA particles) and two-phase flow (with PMMA particles) at = 3 v%.
The second way is to use the locally averaged quantities, allowing comparison of velocity magnitude and TKE in two areas of interest of 1 × 1 cm2. One area is located in the impeller-blade region and the second near the wall, denoted as box1 and box2, respectively. The selection was based not only on areas with low uncertainty but, more importantly, on regions where any differences were reported in profile plots between single-phase and = 3 v% in order to inspect their extent.
The locations of the profiles and the averaging areas are depicted in Figure 7. Local standard deviations computed from three replicates are shown as error bars on the profiles and on the plots of local averages.
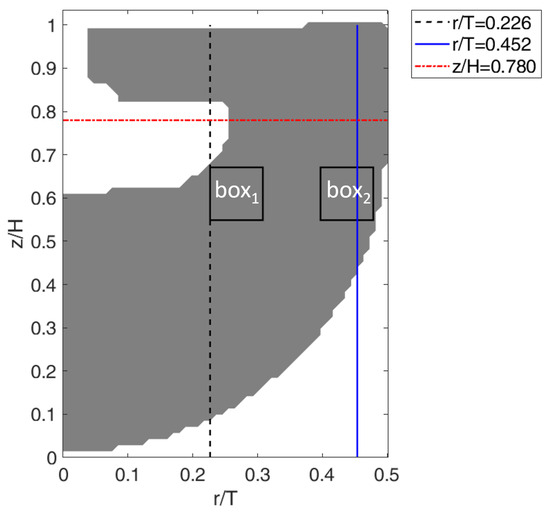
Figure 7.
Visualization scheme showing the areas of analysis.
3.2.1. Mean Velocity Magnitude
The non-dimensional mean velocity magnitude from Equation (9) is represented in Figure 8 alongside the corresponding mean velocity vectors for the single-phase flow (a) and two-phase flow at = 3 v% (b). It shows the classical structure associated with a down-pumping axial impeller, featuring the recirculation of the liquid phase. The recirculation loop extends almost to the free surface, ensuring sufficiently homogeneous mixing while avoiding air-bubble capture. Under the impeller, there is a region of almost stagnant flow, whereas a slow flow is recognized at the bottom-right as a result of the imposed impeller mode and the asymmetric placement of the dip tubes in the tank. The maximum velocity magnitude in the impeller discharge is around .
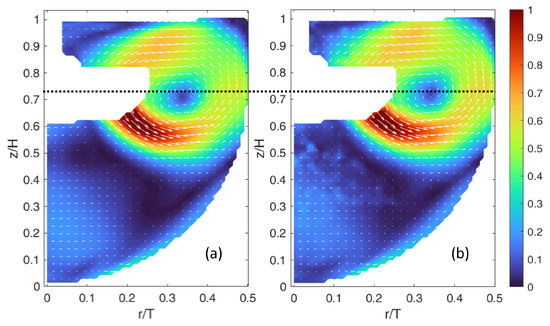
Figure 8.
Non-dimensional (by ) time-averaged flow magnitude: (a) single-phase = 0 v% (b) = 3 v% PMMA. The corresponding mean velocity vectors are added to each contour plot. The horizontal dashed line is added as a reference to compare the position of the center of the recirculation loop between both cases.
When comparing the two mean velocity contour maps, without (Figure 8a and with PMMA particles at = 3 v% (Figure 8b, only slight differences are detected at the end of the recirculation loop, on top of the impeller, and at the beginning of the ascending movement near the wall, but they are nearly imperceptible in the contour plot. Additionally, a slight shift in the position of the center/vortex of the recirculation loop is observed between both cases: the center shifts modestly upward from z/H = 0.7 (single-phase) to z/H = 0.725 ( = 3 v%) at r/T = 0.35.
Figure 9a–c shows the non-dimensional mean velocity magnitude along the z-axis at the locations r/T = 0.226 and r/T = 0.452 and along the r-axis at z/H = 0.78, respectively. Recall that in these profiles, non-dimensional velocity values larger than one are observed because the scaling factor is rather than .
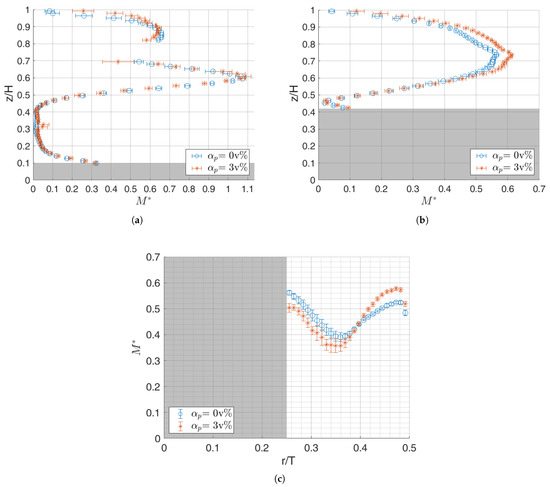
Figure 9.
Non-dimensional (by ) time-averaged flow magnitude profile plot: (a) vertical at r/T = 0.226. (b) vertical at r/T = 0.452. (c) horizontal at z/H = 0.780.
In the vicinity of the blade, at r/T = 0.226 (Figure 9a), the two velocity profiles without particles and with 3 v% particles overlap almost perfectly, except near the surface for z/H > 0.9 where the experimental errors are high.
Near the wall, at r/T = 0.452 (Figure 9b), a higher velocity in the presence of PMMA particles is observed between z/H = 0.6 and 0.9, corresponding to the upward part of the recirculation loop. The maximum difference between the mean velocity without particles and with 3 v% particles reaches 10%, which exceeds the experimental error in this area (<0.02 ). This trend is most pronounced near the wall for 3 v%.
Looking at the radial profile (Figure 9c), higher velocities are partially perceptible in the presence of particles for r/T > 0.4. On the other hand, in the descending part of the loop (r/T < 0.4), lower velocities are observed in the presence of PMMA particles. It is clear that the experimental errors are also slightly higher in this zone ().
Alternatively, this overlapping pattern suggests a shift in momentum that could be due to a change in the direction of the axial flow in that region rather than a local dominance, confirming that the presence of particles does not affect the flow magnitude itself, but somehow modifies the structure. A possible explanation for this shift could be attributed to slight alterations in the effective viscosity of the suspension (at = 3 v%). At such concentrations, the presence of particles in the jet stream may divert the liquid flow direction upward and toward the wall. Hence, this can lead to the modest relocation of the recirculation centerline observed in Figure 8. The same behavior is reported by Unadkat et al. [25] in axial flow with the addition of particles, where the center of the loop shifted, resulting in a 50% increase near the tank wall, for volume fractions above 0.2 v%. The authors explained that this increase is due to the change in direction of the axial flow from downwards to upwards in the wall jet.
To further investigate the influence of the presence of particles and their concentration on local averages, the non-dimensional mean velocity magnitude averaged over the two areas of interest depicted in Figure 7 is plotted as a function of the PMMA particle volume fraction (see Figure 10). The first area of interest (box1) is located in the impeller discharge near the tip, and the second (box2) is located near the wall at the beginning of the upward part of the recirculation loop. In both zones, the averaged magnitude of the mean flow is rather constant as a function of particle volume fraction, except in box2 near the wall where a sudden increase in velocity magnitude (around 7.5%) is observed between 2.5 and 3 v%. This is likely an artifact due to a shift in the centreline of the recirculation loop rather than a true increase in wall-jet velocity.
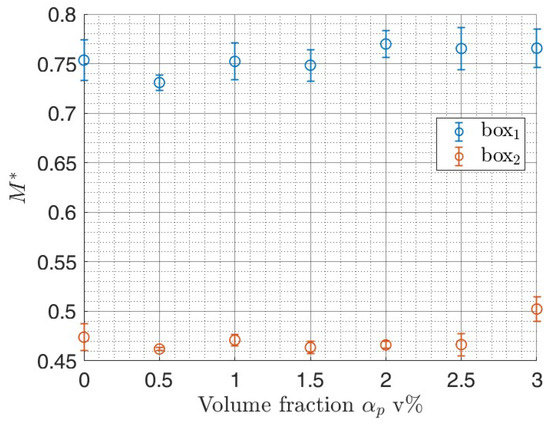
Figure 10.
Non-dimensional (by ) flow velocity magnitude in the zones of interest for different volume fractions .
Aside from the change in structure, the influence of the addition of particles on the mean flow appears to be overall negligible in magnitude. This is in agreement with the Stokes number ( = 0.078 ≪ 1), which indicates that the particles closely follow the liquid flow. In addition, near-density matching between the phases also contributes to this outcome.
Other authors have reported negligible variations of the mean liquid flow field due to the presence of solids in stirred tank reactors. Montante et al. [28] used glass particles with different sizes (115–774 μm) up to fractions = 0.2 v% and density ratio = 0.4 ≪ 1; Gabriele et al. [26] used PMMA spheres of relatively large 1.5 mm size suspended in p-cymene solution up to 5 v% and = 0.4 ≪ 1; Guiraud et al. [34] examined glass spheres of 253 μm size at concentrations of = 0.5 v% suspended in a medium of = 0.45 ≪ 1. These studies did not find alterations in either the radial or axial components of the carrier-phase flow, despite the high density mismatches. Interestingly, the overall fluid flow field as well as the circulating patterns were altered by a dampening effect of 30% as noted by Li et al. [29] at = 5 v% with 7 mm particles and = 0.45 ≪ 1. In other flow geometries, the addition of particles can impact the mean carrier flow values in different ways, as demonstrated by Fornari et al. [56] in a turbulent particle-laden channel flow with finite-size particles, who found that at concentrations of 5 v% and near density-matched phases, the mean fluid velocity slightly lower near the wall and slightly higher at the center of the channel compared with single-phase flow.
3.2.2. Turbulent Kinetic Energy
The turbulent kinetic energy from Equation (9) is represented in Figure 11 for the single-phase flow (a) and two-phase flow at = 3 v% (b). As expected, the TKE values are the highest in the flow discharge area and gradually diminish toward the wall side. The upper part of the recirculation, above the impeller, contains lower fluctuations.
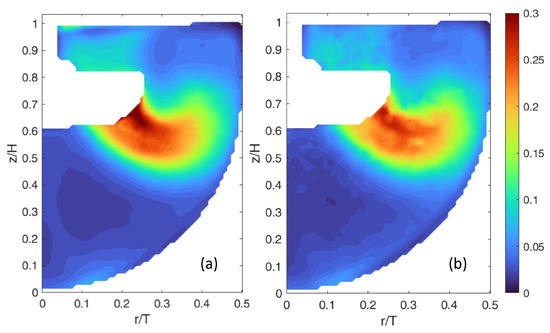
Figure 11.
Non-dimensional (by ) time-averaged TKE : (a) single-phase = 0 v% (b) = 3 v% PMMA.
Figure 11 shows a decrease in TKE in the impeller discharge from single-phase (a) to PMMA at = 3 v% (b), with a maximum of and reached, respectively. One can argue that the experimental errors are also the highest in this region (see Figure 6b). Nonetheless, the corresponding variations are around and , which are far inferior compared to the TKE values of single-phase and = 3 v%, respectively. In the rest of the tank, the values of TKE are rather similar with and without particles at 3 v%.
The non-dimensional TKE profiles are presented in Figure 12a–c at r/T = 0.226, r/T = 0.452 (axial profiles), and z/H = 0.78 (radial profile), respectively. At r/T = 0.226 (Figure 12a), the turbulence level for single-phase flow and = 3 v% follows closely except in the impeller discharge (0.6 < z/H < 0.7), where a decrease in TKE is noted when the particles are present, as seen in the contour plot as well. The drop in TKE reaches 20% at the peak. This is recognizable relative to the experimental errors at that location, particularly for 2.5 v% and 3 v%. Despite this dampening effect, it is limited locally to 0.6 < z/H < 0.7.
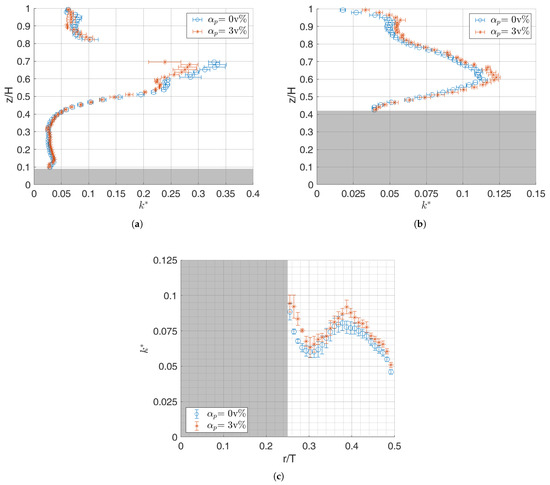
Figure 12.
Non-dimensional (by ) time-averaged TKE profile plot: (a) vertical at r/T = 0.226. (b) vertical at r/T = 0.452. (c) horizontal at z/H = 0.780.
At r/T = 0.452 near the wall (Figure 12b), TKE values with = 3 v% are slightly higher than the single-phase values, with a maximum difference of 10% observed at the peak corresponding to z/H = 0.6. Similarly, higher values of TKE are observed in the presence of particles on the horizontal profile (Figure 12c) up to 10% as well. The differences are within the observed experimental deviations of TKE up to and therefore can be considered trivial. Additionally, it merits attention that across all the TKE profiles, these differences are limited to small local regions and neither phase dominates.
To examine the extent of the change in TKE produced by the particles on the liquid phase in the very specific regions observed, the locally averaged TKE values computed in the two areas of interest are plotted in Figure 13 as a function of the particle volume fraction. In the impeller discharge area (box1), TKE levels slightly increase by 5% for = 0.5 v%, then from 0.5 to 2.5 v% vary around the TKE value of the single-phase flow, and finally a small drop of around 7% is observed for = 3 v%. Near the wall (box2), TKE values are rather constant between 0 and 1 v% and appear to slightly increase from 1.5 up to 3 v%. Yet, in both areas, the differences in TKE values as a function of the volume fraction fall within the experimental uncertainties computed for the same areas. For that reason, the influence of the particles on the locally averaged liquid phase turbulence is trivial. The differences seen on the profile plots are reduced after spatial averaging over the region where a potential effect was suspected. The slight decrease and increase in TKE for box1 and box2 at 3 v%, respectively, is rather inconsequential compared to those observed in some sections of the profile plots (<10%).
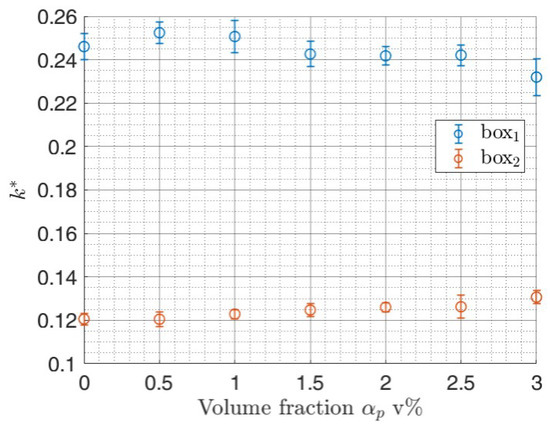
Figure 13.
Non-dimensional (by ) TKE in the zones of interest for different volume fractions .
As already pointed out, the literature on the influence of the presence of particles on the flow in stirred tank reactors is scarce. Virdung and Rasmuson [24,33] found an increase of 45% in r.m.s. velocities even in the impeller jet zone with particle sizes ten times larger than those of the PMMA used in this work. Micheletti and Yianneskis [32] reported a significant decrease in turbulence (r.m.s.) levels of 50% at just = 0.2 v% with the same particle size as the PMMA used here, but at much higher Reynolds numbers (Re = 20,000). However, it did not drop any further for concentrations above 1 v%, indicating that interparticle interactions no longer governed turbulence suppression.
In previous studies, some attempts were dedicated to model the modification in turbulence. Gore and Crowe [57] postulated the attenuation of turbulence if the ratio of particle diameter to integral length scale dp/L < 0.1, with augmentation occurring for the opposite sense. In this work, the average integral length scale was estimated based on mm (), and thus the value obtained dp/L = 0.023 would anticipate turbulence attenuation. Since the model deals with a global (domain-averaged) integral length scale, the impact is not necessarily evident. Previous authors noted the contradiction between this suggestion and their experimental findings [25,32], knowing that Unadkat et al. [25] estimated the integral length scales by integrating the autocorrelation functions, and these scales did not change with particle addition (0.5 v%). Certainly, the model does not account for other influential parameters of the domain, e.g., Stokes and Reynolds numbers, particle-to-fluid density ratio, and solid concentration [58,59].
In the present study, the system operates at relatively moderate Re and low St numbers, with very close liquid and solid densities and very small particles, which corresponds to a system where solids are often considered to have minimal impact on the liquid flow field. However, previous studies showed that even at St ≪ 1, particle addition could modify turbulent structures. Sommer et al. [35] demonstrated that in the impeller region, turbulent fluctuations were damped for = 0.025 v%, whereas for = 0.075 v% they were enhanced compared to single-phase. This effect was held for both glass and polyethylene particles of = 0.4 and 0.91, respectively, with a diameter range of 63–450 μm and range of . A larger impact for the heavier glass particles was also reported. Further, particle diameter imposed different effects on the turbulent fluctuations. For 400 μm, PE particles suppressed the turbulence whereas the glass particles enhanced the turbulence. In general, independently of particle diameter and material, turbulence was reduced for all cases except for the glass particles of 400 μm.
Also at the local level, specifically in the impeller region, a previous work by Delafosse et al. [60] on axial mixing in a stirred tank showed that TKE dissipation rate estimations could vary from 15 to 50 times the mean dissipation rate computed from the mean power input. In that study, special attention was paid to the acquired spatial resolution. This ultimately induced lower local Kolmogorov scales (100–135 μm) in the impeller zone which are smaller than the microcarrier size ( 200 μm). Thus, the cells attached to microcarriers passing through this region might be damaged. Moreover, Maillot et al. [18] demonstrated that MSC growth is greatly impacted by particle addition and that certain quality attributes were progressively degraded when taking into account the physical characteristics of the domain. Authors who investigated similar cases of particle-laden flow in stirred tanks reported either attenuation or augmentation in turbulence. More attention is required for the type of solid–liquid system used in stirred tanks—which can operate across a wide range of geometries and parameters—to acquire more data before a decisive conclusion can be drawn [61].
4. Conclusions
The aim of this work was to characterize, using Particle Image Velocimetry (PIV), the influence of adding microcarriers (i.e., microparticles) to the continuous phase (liquid phase) in the specific application of stem cell expansion on microcarriers suspended in stirred tank bioreactors. PIV for multiphase flow is often challenging. Typically, microcarriers possess poor optical properties (opaque) and are quite small in size ( = 150–300 μm), thus it is not possible to acquire PIV measurements at solid volume fractions usually used in MSC cultures ( = 2–3 v%). To overcome this limitation, a solid–liquid, refractive index matching (RIM) system was specifically selected for the PIV setup. It consists of PMMA microparticles suspended in a 61 wt% ammonium thiocyanate solution (NH4SCN). This RIM solid–liquid system closely mimics the properties of the original microcarrier-culture medium system in terms of particle diameter, density difference, and even liquid viscosity.
The experimental investigation shows that the presence of microparticles has no impact on the mean velocity magnitude values of the continuous phase. This applies globally and locally, in the impeller discharge and near the wall areas. However, the impact appears as an ambiguous shift in the structure and direction of the recirculation loop at 3 v% concentrations.
Likewise, the examination of turbulent kinetic energy of the liquid phase reveals trivial impact due to microparticle addition. In fact, the analysis near the impeller and wall zones shows no evident influence as the differences between single-phase and 3 v% particles concentration are <10% on the locally averaged level, of the same order as the experimental uncertainties. Except for a limited location near the impeller where the TKE is dampened by 20% at r/T = 0.226.
As pointed out, the mechanism of turbulence modulation is highly complex. It depends on dimensionless parameters such as the Stokes St and Reynolds Re numbers, particle-to-fluid density ratio, solid concentration, and particle-to-turbulence length scales ratio. Tanaka and Eaton [58] mapped out 30 experimental databases from the open literature with different values of Re and St to propose a new model. The present work is an effort to provide necessary insights to account for turbulence modulation in a very direct application to MSC culture. More studies are also needed on matched-density systems between the continuous and suspended phases with low Stokes number (St ≪ 1). Besides, measurements of the solid phase hydrodynamics are also required to further understand the solid–liquid interactions, which will be the next step in our investigations. Such experimental measurements, both on the liquid and solid phase, are essential to help develop reliable CFD modeling approaches for two-phase flow with such specific characteristics (small particle diameter, close density match, low Reynolds number, etc.) as encountered in stem cell (or more generally animal cell) cultures.
Author Contributions
Conceptualization, M.M., A.D. and D.T.; methodology, M.M. and A.D.; software, M.M., A.D. and S.C.; validation, M.M., A.D. and D.T.; formal analysis, M.M., A.D., S.C. and D.T.; investigation, M.M., A.D. and S.C.; resources, A.D. and S.C.; data curation, M.M. and A.D.; writing—original draft preparation, M.M.; writing—review and editing, A.D. and D.T.; visualization, M.M. and S.C.; supervision, D.T.; project administration, D.T.; funding acquisition, D.T. All authors have read and agreed to the published version of the manuscript.
Funding
The authors are grateful to the Fonds De La Recherche Scientifique—FNRS for their financial support. “OptiReac4MSC”, Ref: 40003532.
Institutional Review Board Statement
Not applicable.
Informed Consent Statement
Not applicable.
Data Availability Statement
The raw data supporting the conclusions of this article will be made available by the authors on request.
Conflicts of Interest
The authors declare no conflicts of interest.
Correction Statement
This article has been republished with a minor correction to resolve spelling and grammatical errors. This change does not affect the scientific content of the article.
Abbreviations
The following Nomenclature, abbreviations, and Greek letters are used in this manuscript:
| LDA | Laser Doppler anemometry |
| MSC | Mesenchymal stem cell |
| PIV | Particle image velocimetry |
| RI | Refractive index |
| RIM | Refractive index matching |
| rms | Root mean square |
| TKE | Turbulent kinetic energy |
| Particle volume fraction, – | |
| Energy dissipation rate, m2/s3 | |
| Dynamic viscosity, Pa.s | |
| Kinematic viscosity, m2/s | |
| Density, kg/m3 | |
| Taylor length scale, m | |
| Kolmogorov length scale, m | |
| Time scale, s | |
| C | Impeller clearance, m |
| D | Impeller diameter, m |
| Particle diameter, m | |
| H | Liquid height, m |
| k | Turbulent kinetic energy, m2/s2 |
| Non-dimensional turbulent kinetic energy, – | |
| L | Integral length scale, m |
| M | Mean velocity magnitude, m/s |
| Non-dimensional mean velocity magnitude, – | |
| N | Impeller speed, rpm |
| T | Tank diameter, m |
| P | Power input, W |
| Power number, – | |
| r | Radial coordinate, m |
| Mean velocity, m/s | |
| Fluctuating velocity, m/s | |
| V | Fluid volume, m3 |
| z | Axial coordinate, m |
| Reynolds number, – | |
| Stokes number, – |
References
- Rodríguez-Fuentes, D.E.; Fernández-Garza, L.E.; Samia-Meza, J.A.; Barrera-Barrera, S.A.; Caplan, A.I.; Barrera-Saldaña, H.A. Mesenchymal stem cells current clinical applications: A systematic review. Arch. Med. Res. 2021, 52, 93–101. [Google Scholar] [CrossRef] [PubMed]
- Beyer Nardi, N.; da Silva Meirelles, L. Mesenchymal Stem Cells: Isolation, In Vitro Expansion and Characterization. In Stem Cells; Wobus, A.M., Boheler, K.R., Eds.; Handbook of Experimental Pharmacology; Springer: Berlin/Heidelberg, Germany, 2006; pp. 249–282. [Google Scholar] [CrossRef]
- Frauenschuh, S.; Reichmann, E.; Ibold, Y.; Goetz, P.M.; Sittinger, M.; Ringe, J. A Microcarrier-Based Cultivation System for Expansion of Primary Mesenchymal Stem Cells. Biotechnol. Prog. 2007, 23, 187–193. [Google Scholar] [CrossRef]
- Schop, D.; Janssen, F.W.; Borgart, E.; de Bruijn, J.D.; van Dijkhuizen-Radersma, R. Expansion of mesenchymal stem cells using a microcarrier-based cultivation system: Growth and metabolism. J. Tissue Eng. Regen. Med. 2008, 2, 126–135. [Google Scholar] [CrossRef] [PubMed]
- Rafiq, Q.A.; Brosnan, K.M.; Coopman, K.; Nienow, A.W.; Hewitt, C.J. Culture of human mesenchymal stem cells on microcarriers in a 5 L stirred-tank bioreactor. Biotechnol. Lett. 2013, 35, 1233–1245. [Google Scholar] [CrossRef]
- Croughan, M.S.; Hamel, J.F.P.; Wang, D.I.C. Effects of microcarrier concentration in animal cell culture. Biotechnol. Bioeng. 1988, 32, 975–982. Available online: https://onlinelibrary.wiley.com/doi/pdf/10.1002/bit.260320805 (accessed on 13 October 2025). [CrossRef]
- Maul, T.M.; Chew, D.W.; Nieponice, A.; Vorp, D.A. Mechanical stimuli differentially control stem cell behavior: Morphology, proliferation, and differentiation. Biomech. Model. Mechanobiol. 2011, 10, 939–953. [Google Scholar] [CrossRef]
- Nienow, A.W. Reactor engineering in large scale animal cell culture. Cytotechnology 2006, 50, 9–33. [Google Scholar] [CrossRef]
- Godara, P.; McFarland, C.; Nordon, R. Design of bioreactors for mesenchymal stem cell tissue engineering. J. Chem. Technol. Biotechnol. 2008, 83, 408–420. [Google Scholar] [CrossRef]
- Jossen, V.; Pörtner, R.; Kaiser, S.C.; Kraume, M.; Eibl, D.; Eibl, R. Mass Production of Mesenchymal Stem Cells—Impact of Bioreactor Design and Flow Conditions on Proliferation and Differentiation. In Cells and Biomaterials in Regenerative Medicine; IntechOpen: London, UK, 2014. [Google Scholar] [CrossRef]
- Hutmacher, D.W.; Singh, H. Computational fluid dynamics for improved bioreactor design and 3D culture. Trends Biotechnol. 2008, 26, 166–172. [Google Scholar] [CrossRef]
- Rafiq, Q.A.; Coopman, K.; Nienow, A.W.; Hewitt, C.J. Systematic microcarrier screening and agitated culture conditions improves human mesenchymal stem cell yield in bioreactors. Biotechnol. J. 2016, 11, 473–486. [Google Scholar] [CrossRef] [PubMed]
- Collignon, M.L.; Delafosse, A.; Calvo, S.; Martin, C.; Marc, A.; Toye, D.; Olmos, E. Large-Eddy Simulations of microcarrier exposure to potentially damaging eddies inside mini-bioreactors. Biochem. Eng. J. 2016, 108, 30–43. [Google Scholar] [CrossRef]
- Loubière, C.; Delafosse, A.; Guedon, E.; Chevalot, I.; Toye, D.; Olmos, E. Dimensional analysis and CFD simulations of microcarrier ‘just-suspended’ state in mesenchymal stromal cells bioreactors. Chem. Eng. Sci. 2019, 203, 464–474. [Google Scholar] [CrossRef]
- Olmos, E.; Loubiere, K.; Martin, C.; Delaplace, G.; Marc, A. Critical agitation for microcarrier suspension in orbital shaken bioreactors: Experimental study and dimensional analysis. Chem. Eng. Sci. 2015, 122, 545–554. [Google Scholar] [CrossRef]
- Delafosse, A.; Loubière, C.; Calvo, S.; Toye, D.; Olmos, E. Solid-liquid suspension of microcarriers in stirred tank bioreactor – Experimental and numerical analysis. Chem. Eng. Sci. 2018, 180, 52–63. [Google Scholar] [CrossRef]
- Loubière, C.; Sion, C.; De Isla, N.; Reppel, L.; Guedon, E.; Chevalot, I.; Olmos, E. Impact of the type of microcarrier and agitation modes on the expansion performances of mesenchymal stem cells derived from umbilical cord. Biotechnol. Prog. 2019, 35, e2887. [Google Scholar] [CrossRef] [PubMed]
- Maillot, C.; De Isla, N.; Loubiere, C.; Toye, D.; Olmos, E. Impact of microcarrier concentration on mesenchymal stem cell growth and death: Experiments and modeling. Biotechnol. Bioeng. 2022, 119, 3537–3548. [Google Scholar] [CrossRef]
- Hewitt, C.J.; Lee, K.; Nienow, A.W.; Thomas, R.J.; Smith, M.; Thomas, C.R. Expansion of human mesenchymal stem cells on microcarriers. Biotechnol. Lett. 2011, 33, 2325–2335. [Google Scholar] [CrossRef]
- Northrup, M.A.; Kulp, T.J.; Angel, S.M. Fluorescent particle image velocimetry: Application to flow measurement in refractive index-matched porous media. Appl. Opt. 1991, 30, 3034–3040. [Google Scholar] [CrossRef] [PubMed]
- Hopkins, L.; Kelly, J.; Wexler, A.; Prasad, A. Particle image velocimetry measurements in complex geometries. Exp. Fluids 2000, 29, 91–95. [Google Scholar] [CrossRef]
- Morgan, R.G.; Markides, C.N.; Zadrazil, I.; Hewitt, G.F. Characteristics of horizontal liquid–liquid flows in a circular pipe using simultaneous high-speed laser-induced fluorescence and particle velocimetry. Int. J. Multiph. Flow 2013, 49, 99–118. [Google Scholar] [CrossRef]
- Bluestein, A.M.; Bohl, D. Development and validation of a PIV processing routine for two-phase index-matched flows. J. Vis. 2020, 23, 951–970. [Google Scholar] [CrossRef]
- Virdung, T.; Rasmuson, A. Solid–Liquid Flow at Dilute Concentrations in an Axially Stirred Vessel Investigated Using Particle Image Velocimetry. Chem. Eng. Commun. 2008, 195, 18–34. [Google Scholar] [CrossRef]
- Unadkat, H.; Rielly, C.D.; Hargrave, G.K.; Nagy, Z.K. Application of fluorescent PIV and digital image analysis to measure turbulence properties of solid–liquid stirred suspensions. Chem. Eng. Res. Des. 2009, 87, 573–586. [Google Scholar] [CrossRef]
- Gabriele, A.; Tsoligkas, A.N.; Kings, I.N.; Simmons, M.J.H. Use of PIV to measure turbulence modulation in a high throughput stirred vessel with the addition of high Stokes number particles for both up- and down-pumping configurations. Chem. Eng. Sci. 2011, 66, 5862–5874. [Google Scholar] [CrossRef]
- Smagorinsky, J. General circulation experiments with the primitive equations: I. The basic experiment. Mon. Weather. Rev. 1963, 91, 99–164. [Google Scholar] [CrossRef]
- Montante, G.; Paglianti, A.; Magelli, F. Analysis of dilute solid–liquid suspensions in turbulent stirred tanks. Chem. Eng. Res. Des. 2012, 90, 1448–1456. [Google Scholar] [CrossRef]
- Li, G.; Gao, Z.; Li, Z.; Wang, J.; Derksen, J. Particle-resolved PIV experiments of solid-liquid mixing in a turbulent stirred tank. AIChE J. 2018, 64, 389–402. [Google Scholar] [CrossRef]
- Nouri, J.; Whitelaw, J. Particle velocity characteristics of dilute to moderately dense suspension flows in stirred reactors. Int. J. Multiph. Flow 1992, 18, 21–33. [Google Scholar] [CrossRef]
- Kohnen, C.; Bohnet, M. Measurement and simulation of fluid flow in agitated solid/liquid suspensions. Chem. Eng. Technol. Ind. Chem. Plant Equip. Process Eng. Biotechnol. 2001, 24, 639–643. [Google Scholar] [CrossRef]
- Micheletti, M.; Yianneskis, M. Study of Fluid Velocity Characteristics in Stirred Solid—Liquid Suspensions With a Refractive Index Matching Technique. Proc. Inst. Mech. Eng. Part -J. Process Mech. Eng. 2004, 218, 191–204. [Google Scholar] [CrossRef]
- Virdung, T.; Rasmuson, A. Measurements of continuous phase velocities in solid–liquid flow at elevated concentrations in a stirred vessel using LDV. Chem. Eng. Res. Des. 2007, 85, 193–200. [Google Scholar] [CrossRef]
- Guiraud, P.; Costes, J.; Bertrand, J. Local measurements of fluid and particle velocities in a stirred suspension. Chem. Eng. J. 1997, 68, 75–86. [Google Scholar] [CrossRef]
- Sommer, A.E.; Rox, H.; Shi, P.; Eckert, K.; Rzehak, R. Solid-liquid flow in stirred tanks:“CFD-grade” experimental investigation. Chem. Eng. Sci. 2021, 245, 116743. [Google Scholar] [CrossRef]
- Ferrante, A.; Elghobashi, S. On the physical mechanisms of two-way coupling in particle-laden isotropic turbulence. Phys. Fluids 2003, 15, 315–329. [Google Scholar] [CrossRef]
- Borrero-Echeverry, D.; Morrison, B.C.A. Aqueous ammonium thiocyanate solutions as refractive index-matching fluids with low density and viscosity. Exp. Fluids 2016, 57, 123. [Google Scholar] [CrossRef]
- Budwig, R. Refractive index matching methods for liquid flow investigations. Exp. Fluids 1994, 17, 350–355. [Google Scholar] [CrossRef]
- Wright, S.F.; Zadrazil, I.; Markides, C.N. A review of solid–fluid selection options for optical-based measurements in single-phase liquid, two-phase liquid–liquid and multiphase solid–liquid flows. Exp. Fluids 2017, 58, 108. [Google Scholar] [CrossRef]
- Sion, C.; Ghannoum, D.; Ebel, B.; Gallo, F.; de Isla, N.; Guedon, E.; Chevalot, I.; Olmos, E. A new perfusion mode of culture for WJ-MSCs expansion in a stirred and online monitored bioreactor. Biotechnol. Bioeng. 2021, 118, 4453–4464. [Google Scholar] [CrossRef]
- Wiederseiner, S.; Andreini, N.; Epely-Chauvin, G.; Ancey, C. Refractive-index and density matching in concentrated particle suspensions: A review. Exp. Fluids 2011, 50, 1183–1206. [Google Scholar] [CrossRef]
- Adrian, R.J. Image shifting technique to resolve directional ambiguity in double-pulsed velocimetry. Appl. Opt. 1986, 25, 3855–3858. [Google Scholar] [CrossRef]
- Chéron, J.; Loubière, C.; Delaunay, S.; Guezennec, A.G.; Olmos, E. CFD numerical simulation of particle suspension and hydromechanical stress in various designs of multi-stage bioleaching reactors. Hydrometallurgy 2020, 197, 105490. [Google Scholar] [CrossRef]
- Pope, S.B. Turbulent flows. Meas. Sci. Technol. 2001, 12, 2020–2021. [Google Scholar] [CrossRef]
- Simon, E.; Augier, F.; Morchain, J.; Pierson, J.L.; Liné, A. Investigation of the local apparent viscosity in a stirred tank with a shear-thinning fluid through particle image velocimetry. Chem. Eng. Res. Des. 2024, 206, 378–385. [Google Scholar] [CrossRef]
- Saarenrinne, P.; Piirto, M.; Eloranta, H. Experiences of turbulence measurement with PIV. Meas. Sci. Technol. 2001, 12, 1904. [Google Scholar] [CrossRef]
- Baldi, S.; Yianneskis, M. On the quantification of energy dissipation in the impeller stream of a stirred vessel from fluctuating velocity gradient measurements. Chem. Eng. Sci. 2004, 59, 2659–2671. [Google Scholar] [CrossRef]
- Elghobashi, S. On predicting particle-laden turbulent flows. Appl. Sci. Res. 1994, 52, 309–329. [Google Scholar] [CrossRef]
- Owen, P. Turbulent flow and particle deposition in the trachea. In Ciba Foundation Symposium-Circulatory and Respiratory Mass Transport; Wiley Online Library: Hoboken, NJ, USA, 1969; pp. 236–255. [Google Scholar]
- Scharnowski, S.; Kähler, C.J. Particle image velocimetry-classical operating rules from today’s perspective. Opt. Lasers Eng. 2020, 135, 106185. [Google Scholar] [CrossRef]
- Gabriele, A.; Nienow, A.; Simmons, M. Use of angle resolved PIV to estimate local specific energy dissipation rates for up-and down-pumping pitched blade agitators in a stirred tank. Chem. Eng. Sci. 2009, 64, 126–143. [Google Scholar] [CrossRef]
- Liu, N.; Wang, W.; Han, J.; Zhang, M.; Angeli, P.; Wu, C.; Gong, J. A PIV investigation of the effect of disperse phase fraction on the turbulence characteristics of liquid–liquid mixing in a stirred tank. Chem. Eng. Sci. 2016, 152, 528–546. [Google Scholar] [CrossRef]
- Escudié, R.; Liné, A. Experimental analysis of hydrodynamics in a radially agitated tank. AIChE J. 2003, 49, 585–603. [Google Scholar] [CrossRef]
- Khan, F.R.; Rielly, C.D.; Brown, D.A.R. Angle-resolved stereo-PIV measurements close to a down-pumping pitched-blade turbine. Chem. Eng. Sci. 2006, 61, 2799–2806. [Google Scholar] [CrossRef]
- Chung, K.H.K.; Barigou, M.; Simmons, M.J.H. Reconstruction of 3-D Flow Field Inside Miniature Stirred Vessels Using a 2-D PIV Technique. Chem. Eng. Res. Des. 2007, 85, 560–567. [Google Scholar] [CrossRef]
- Fornari, W.; Formenti, A.; Picano, F.; Brandt, L. The effect of particle density in turbulent channel flow laden with finite size particles in semi-dilute conditions. Phys. Fluids. 2016, 28, 033301. [Google Scholar] [CrossRef]
- Gore, R.; Crowe, C. Effect of particle size on modulating turbulent intensity. Int. J. Multiph. Flow 1989, 15, 279–285. [Google Scholar] [CrossRef]
- Tanaka, T.; Eaton, J.K. Classification of Turbulence Modification by Dispersed Spheres Using a Novel Dimensionless Number. Phys. Rev. Lett. 2008, 101, 114502. [Google Scholar] [CrossRef] [PubMed]
- Tsuji, J.D.; Schwarzkopf, M.; Sommerfeld, Y.; Crowe, C.T. Multiphase Flows with Droplets and Particles, 2nd ed.; CRC Press: Boca Raton, FL, USA, 2011. [Google Scholar] [CrossRef]
- Delafosse, A.; Collignon, M.L.; Crine, M.; Toye, D. Estimation of the turbulent kinetic energy dissipation rate from 2D-PIV measurements in a vessel stirred by an axial Mixel TTP impeller. Chem. Eng. Sci. 2011, 66, 1728–1737. [Google Scholar] [CrossRef]
- Gai, G.; Hadjadj, A.; Kudriakov, S.; Thomine, O. Particles-induced turbulence: A critical review of physical concepts, numerical modelings and experimental investigations. Theor. Appl. Mech. Lett. 2020, 10, 241–248. [Google Scholar] [CrossRef]


Disclaimer/Publisher’s Note: The statements, opinions and data contained in all publications are solely those of the individual author(s) and contributor(s) and not of MDPI and/or the editor(s). MDPI and/or the editor(s) disclaim responsibility for any injury to people or property resulting from any ideas, methods, instructions or products referred to in the content. |
© 2025 by the authors. Licensee MDPI, Basel, Switzerland. This article is an open access article distributed under the terms and conditions of the Creative Commons Attribution (CC BY) license (https://creativecommons.org/licenses/by/4.0/).