Abstract
Cardiovascular diseases are a group of disorders that affect the heart and blood vessels, representing a leading cause of death worldwide. With the help of computational fluid dynamics, it is possible to study the hemodynamics of the pulmonary arteries in detail and simulate various physiological conditions, thus offering numerous advantages over invasive analyses in the phases of diagnosis and surgical planning. Specifically, the aim of this study is the fluid dynamic analysis of the pulmonary artery, comparing the characteristics of the blood flow in a healthy subject with that of a patient affected by pulmonary arterial hypertension. We performed CFD simulations with the OpenFOAM C++ library using a purposely developed solver that features the Windkessel model as a pressure boundary condition. This methodology, scarcely applied in the past for this problem, allows for a proficient analysis and the detailed quantification of the most important fluid-dynamic parameters (flow velocity, pressure distribution, and wall shear stress (WSS)) with improved accuracy and resolution when compared with classical simulation and diagnostic techniques. We verified the validity of the adopted methodology in reproducing the blood flow by relying on experimental data. A detailed comparative analysis highlights the differences between healthy and pathological cases in hemodynamic terms. The outcomes of this work contribute to enlarging the knowledge of the blood flow characteristics in the human pulmonary artery, revealing substantial differences between the two clinical scenarios investigated and highlighting how arterial hypertension drastically changes the blood flow. The analysis of the data confirmed the importance of CFD as a supportive tool in understanding, diagnosing, and monitoring the pathophysiological mechanisms underlying cardiovascular diseases, proving to be a powerful means for personalizing surgical treatments.
1. Introduction
Pulmonary circulation is one of the two primary circuits of the cardiovascular system and is responsible for the gas exchange between the blood and air in the lungs. Specifically, it is the pathway through which blood leaves the right ventricle and reaches the two lungs via the pulmonary artery [1]. Thus, the pulmonary artery enables the human body to have oxygenated blood circulating and any alteration in the structure or function of this artery can severely compromise pulmonary blood circulation and the normal functioning of the organism. Diseases of the pulmonary artery constitute a heterogeneous group of disorders characterized by structural or functional alterations of the pulmonary artery and its branches [2]. These include pulmonary arterial hypertension and chronic pulmonary embolism. Studying how the flow changes in the presence of such conditions can help doctors detect their presence.
Pulmonary artery diseases are treated with various surgical techniques and procedures, known as open surgeries, which involve significant risks both during and after the operation. To address these issues, so-called endovascular techniques can be exploited [3]. These are conducted transcutaneously within the arteries and without resorting to surgical incisions, and must be planned based on the clinical data of the patient. However, not all of the required parameters can be easily obtained, for example, using bioimages acquired with contrast-enhanced magnetic resonance [4]. Indeed, the pulmonary arterial pressure, cardiac output, and local velocity can be measured only with invasive methods such as cardiac catheterization. In this context, CFD is an important support tool for physicians to develop a medical strategy as it is possible to evaluate pressure and velocity fields and other parameters, including wall shear stress, in detail [5,6,7,8,9,10,11,12]. With the help of CFD, it is possible to meticulously study the hemodynamics of the pulmonary arteries and simulate various physiological conditions, allowing for the identification of the most suitable surgical approach for the patient’s needs and personalized therapy. However, the quality of the results achievable with CFD analyses is strongly affected by the boundary conditions and by the availability of accurate patient clinical data, such as blood flow rate waveforms, local pressures, and velocities [13].
More specifically, the outflow sections present challenges in determining the appropriate boundary conditions. The most straightforward approach is to treat the outlet sections with a constant pressure value, usually equal to zero [14,15,16,17]. However, this method is not accurate, as it does not fully replicate the fluid impedance of the downstream vasculature. Another modelling approach prescribes outflow conditions as fractions of the inflow blood flow rate [18]. As personalised PC-MRI measurements are usually not available, the lumped parameter Windkessel model became customary. It allows for a dynamic description of the blood flow downstream of the computational domain and it can be coupled explicitly or embedded into CFD codes [17,19,20].
In this study, we simulated blood flow within two different pulmonary arteries belonging to a healthy subject and to a patient with pulmonary arterial hypertension, aiming to deepen the knowledge of the physiology of this process and the modifications caused by hypertension onset. We exploited the OpenFOAM C++ library, within which we developed the solver pimpleWKFoam, which features a three-element Windkessel model for the pressure boundary condition. Thanks to the advanced CFD methodology adopted, we were able to provide a detailed quantification of the main fluid dynamic parameters that describe the blood flow in the pulmonary artery, which is not obtainable with common diagnostic techniques and is hardly available in past literature works.
We ensured the reliability of the simulations by performing grid convergence and sensitivity analysis. Validation was performed using statistical data derived from contrast-enhanced magnetic resonance imaging and Doppler ultrasound.
This comparative work, further demonstrating the validity of the methodology proposed, highlights significant differences between the two clinical scenarios investigated. The blood flow in the pathological artery is significantly slower when compared with the sane one, the pressure distribution is higher, and the wall shear stress (WSS) is more uniform both in space and time. The analysis of the obtained data confirmed the importance of CFD as a supportive tool in understanding, diagnosing, and monitoring the pathophysiological mechanisms underlying pulmonary hypertension as well as other cardiovascular diseases.
2. Mathematical and Numerical Method
We investigated two pulmonary arteries: the first one is a healthy artery and belongs to a 21-year-old male subject. The second model belongs to a 16-year-old boy with pulmonary arterial hypertension. Pulmonary arterial hypertension is a rare, progressive disease characterized by increased arterial blood pressure values (greater than 25 mmHg at rest and greater than 30 mmHg during exertion). It is marked by excessive vasoconstriction, which leads to an increase in right ventricular afterload. Structural alterations in the blood vessels also contribute to increased resistance to blood flow pumped by the heart, causing progressive strain on the right ventricle, which can ultimately lead to heart failure and is potentially fatal.
2.1. Geometries of Pulmonary Artery and Generation of the Computational Domain
The required data were obtained from the public library Vascular Model Repository [21]. Gadolinium-enhanced magnetic resonance angiography (MRA) scans of the pulmonary arteries were performed by Tang et al. [22] to create the 3D patient-specific geometrical models that we used for the CFD simulations. After obtaining informed consent, the contrast agent gadopentetate dimeglumine (Magnevist) was administered at 2 mL/s via intravenous access, and images were acquired using a 3D fast gradient echo sequence. Additional breath-held, ECG-gated phase contrast cine images with through-plane velocity encoding were taken to assess blood flow in the main (MPA), left (LPA), and right (RPA) pulmonary arteries. Two-dimensional segmentation of pulmonary arteries were performed using a level set method in proximal vessels and hand-drawn segmentation for distal vessels. These were lofted into 3D solid models and combined. The model was discretized using an isotropic finite element mesh. Specific software corrected for gradient non-linearities. Models included approximately 100 outlet boundaries. The smallest vessels modeled had diameters of 1.5 mm [22]. Figure 1 shows the cases investigated.
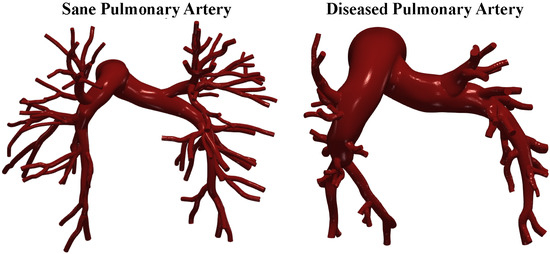
Figure 1.
Sane and diseased pulmonary artery geometries.
We discretised the geometries using OpenFOAM’s utility snappyHexMesh. We adopted three grid sizes to assess grid convergence and uncertainty. In detail, the fine grid features elements with a 0.35 mm average dimension, an intermediate grid of 0.7 mm, and a coarse grid of 1.2 mm. For the finer grid, the boundary layer cells are 0.15 mm high. A posteriori check, using the average wall shear stress, showed that was lower than 1 evrywhere. The total number of cells in the finest grid is ≈5 M cells. Figure 2 shows a particular of the fine grid generated for the sane pulmonary artery.
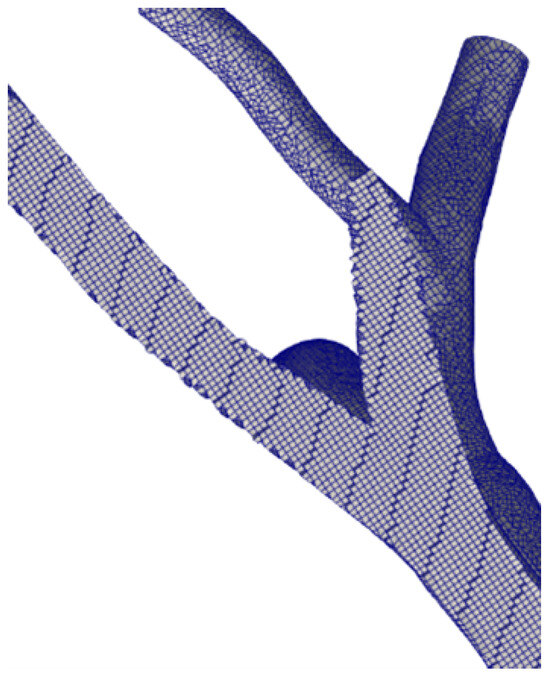
Figure 2.
Computational grid. Fine level.
2.2. Model Setup
The fluid-dynamics problem under consideration is described by the continuity equation and the Navier–Stokes equations for incompressible flows [23].
We discretized the equations using a centered scheme, and the time integration was performed using the Euler method. We solved the pressure–velocity coupling using the in-house developed solver pimpleWKFoam [24] that exploits the PIMPLE algorithm [25,26,27]. A variable time step was chosen, limiting the Courant number to 0.8.
Typically, blood exhibits non-Newtonian behaviour because, at low shear rates, it is a shear-thinning fluid. However, when the shear rate increases above , blood behaves as a Newtonian fluid [28]. Several studies in the literature have adopted the assumption of Newtonian behaviour for blood in the pulmonary artery, so we assumed blood to be an incompressible Newtonian fluid with a constant kinematic viscosity of and a density of [29].
For turbulence modelling, we adopted a Spalart–Allmaras DES (Detached Eddy Simulation) model [30]. This hybrid model switches between a pure LES approach in the core turbulent region, where large unsteady turbulence scales can be resolved by grid size, and a RANS Spalart–Allmaras model near solid walls, where the typical length scale of the turbulent eddies is significantly smaller than the grid dimensions.
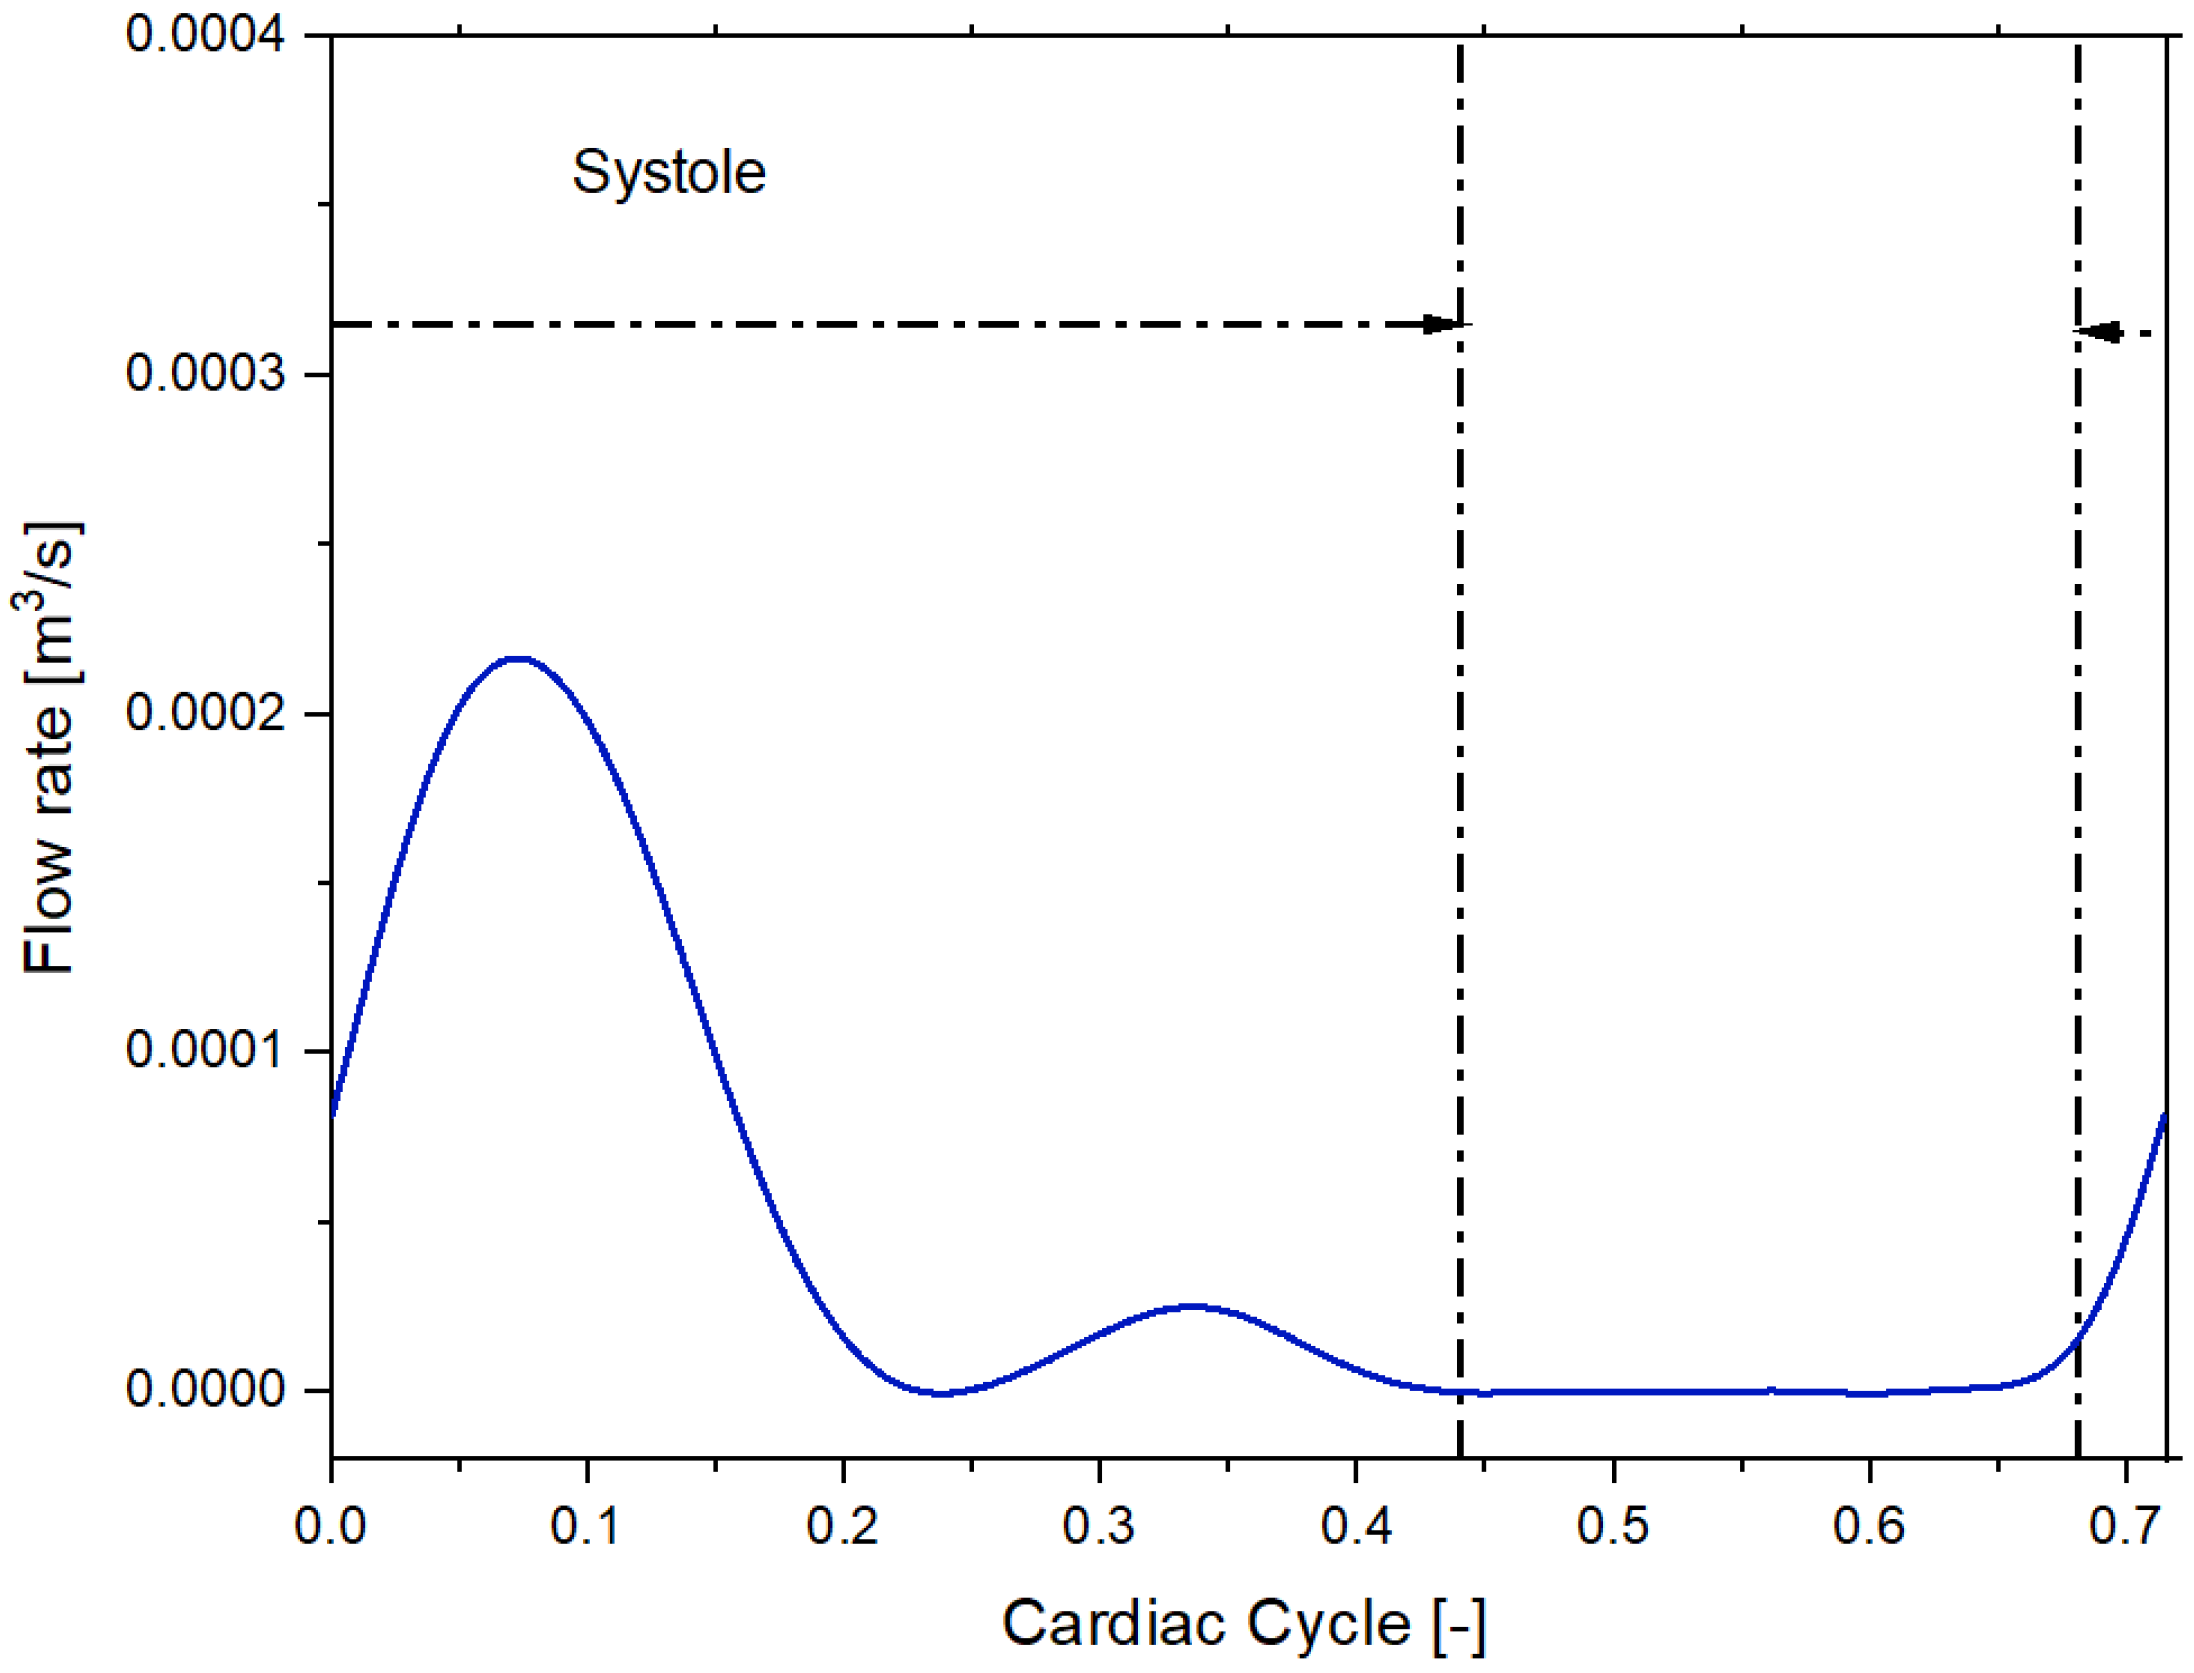
We imposed a Dirichlet boundary condition as the inflow boundary condition specifying a time-varying flow rate [21]. Figure 3 and Figure 4 shows the volumetric flow rate values as a function of time regarding the sane subject and diseased patient obtained from the public library Vascular Model Repository.
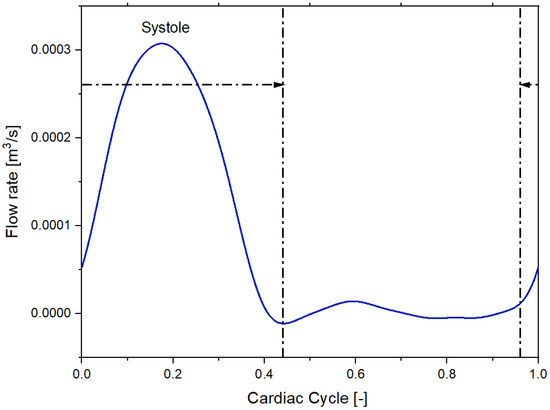
Figure 3.
Inflow pulsatile waveform for the healthy patient.
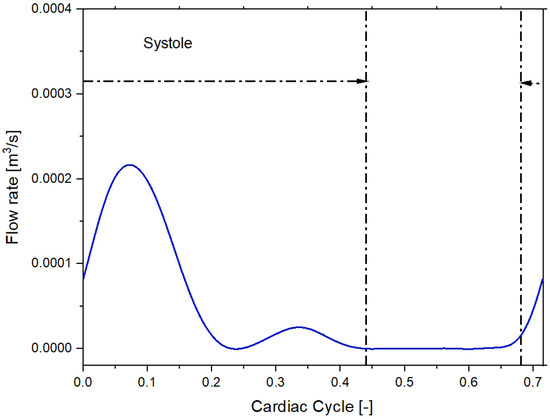
Figure 4.
Inflow pulsatile waveform for the patient with pulmonary arterial hypertension.
To calculate the in vivo, time-resolved volumetric flow, the cine phase contrast images (PC-MRI) taken perpendicularly to the MPA, LPA, and RPA were used by Tang et al. [22]. The vessel lumen was segmented from intensity magnitude images using a level set method. Through-plane velocity values at each pixel were integrated over the bounded area to compute the total volumetric flow rate. The periodic flow waveform at the MPA was mapped onto the inlet face using an axisymmetric analytic velocity profile derived from Womersley’s pulsatile flow theory, and the average volumetric flow calculated from the PC-MRI for the LPA and RPA was used to determine the flow split to each side [22].
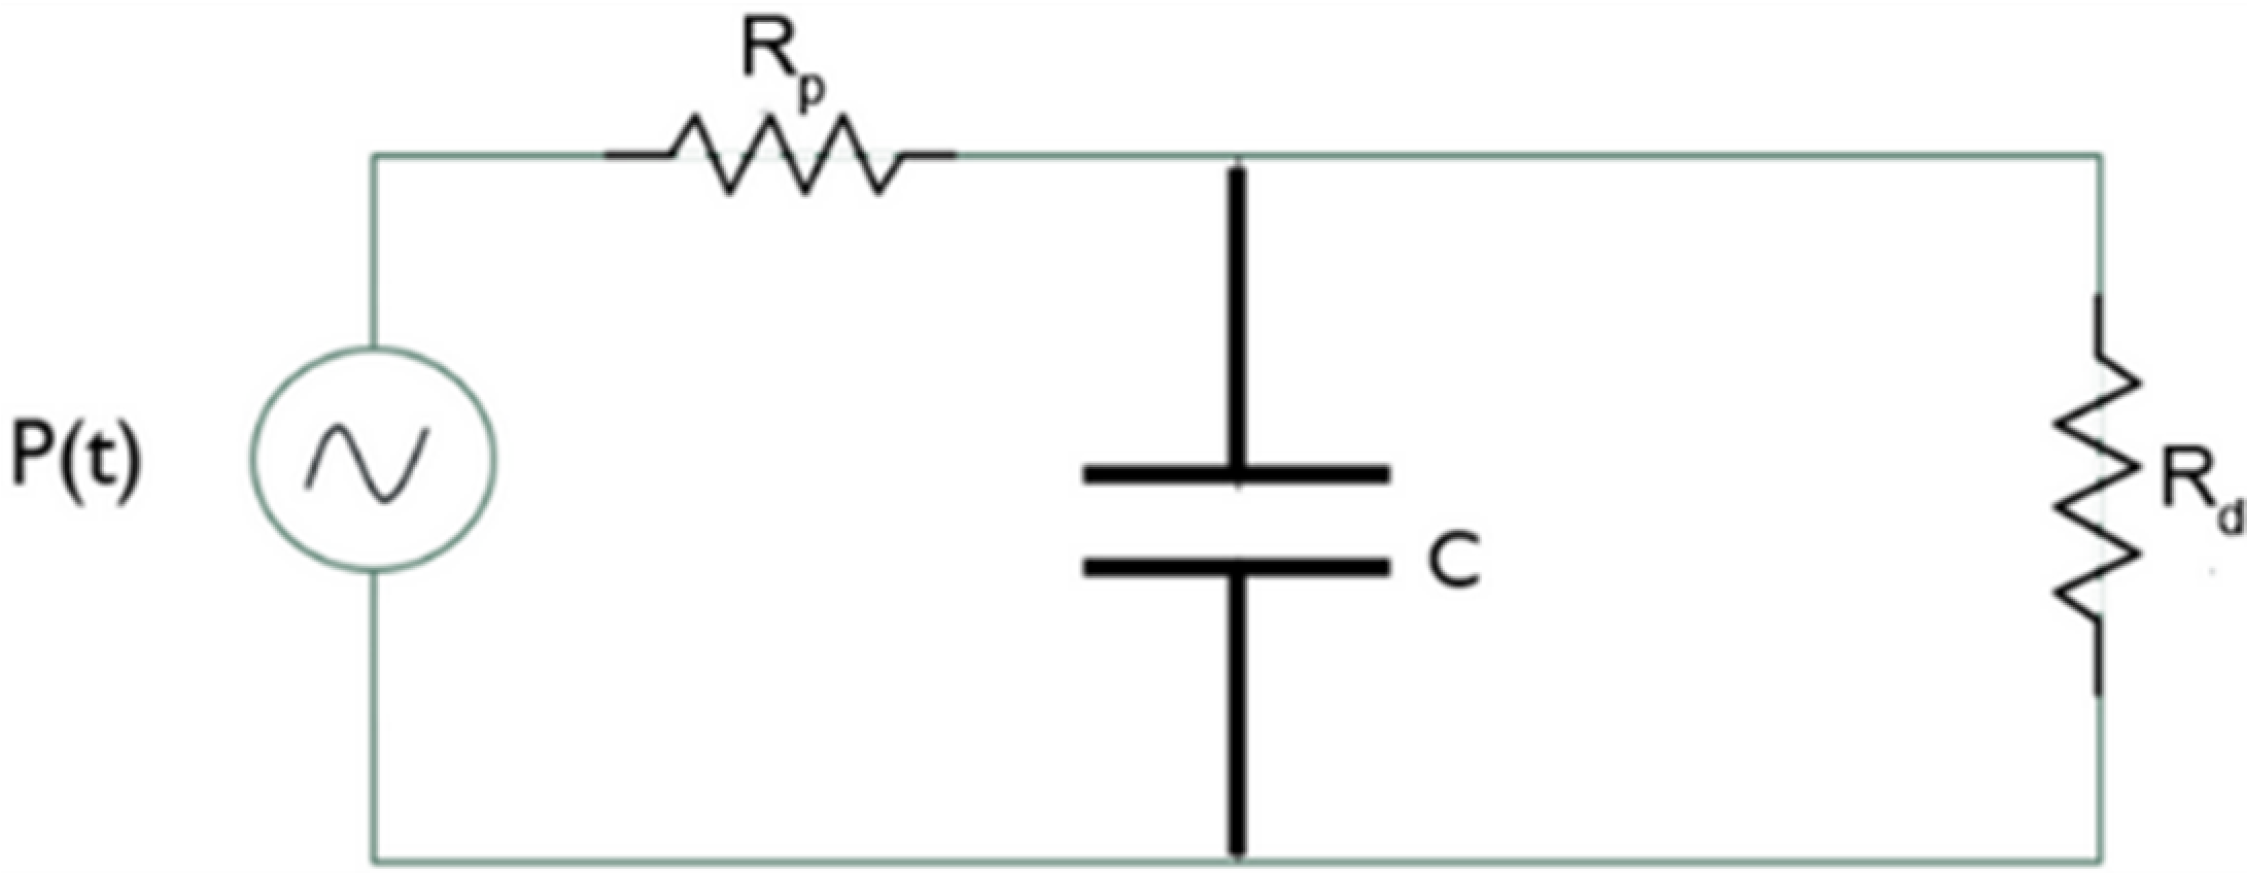
We used the three-element Windkessel model for the outflow sections to compute the local pressure. Each outflow section is associated with a passive network that describes the downstream vasculature behavior from the initial branches of the pulmonary artery. Leveraging an electrical analogy, the three-element Windkessel model is depicted in Figure 5.

Figure 5.
Three-element Windkessel model.
The pressure generator represents the pressure at the generic outflow section, the two resistors represent the proximal resistance encountered by the blood immediately after exiting the pulmonary artery, and the distal resistance opposed by the peripheral vasculature. The capacitor represents arterial compliance. Indeed, the walls of large arteries contain elastic fibers that allow them to change their shape. During systole, blood pressure increases and the arteries fill and store energy, while during diastole, they release energy as the pressure decreases.
The dynamics of this circuit can be mathematically expressed by the following Equation (3):
Defining , C, and , the pressure can be recursively calculated. We computed the value of proximal resistance that results in ≈97% of the total resistance opposing blood flow while the distal resistance is ≈2.9%, in agreement with other scientific studies [31,32,33].
The resistive and capacitive parameters adopted for both the healthy and diseased cases are shown in Table 1.

Table 1.
Resistive and capacitive parameters for the three-element Windkessel model in the healthy and diseased cases.
These values are consistent with those proposed by Lungu et al. [31], showing a variability of 5% depending on the degree of pulmonary arterial hypertension and individual patient characteristics.
We considered the pulmonary artery walls as rigid and the velocity on these surfaces is null. We simulated 10 cardiac cycles, each lasting approximately 1 s. This time is sufficient to consider the initial transient as dissipated.
3. Results
3.1. Convergence-Grid Sensibility Study and Preliminary Discussion
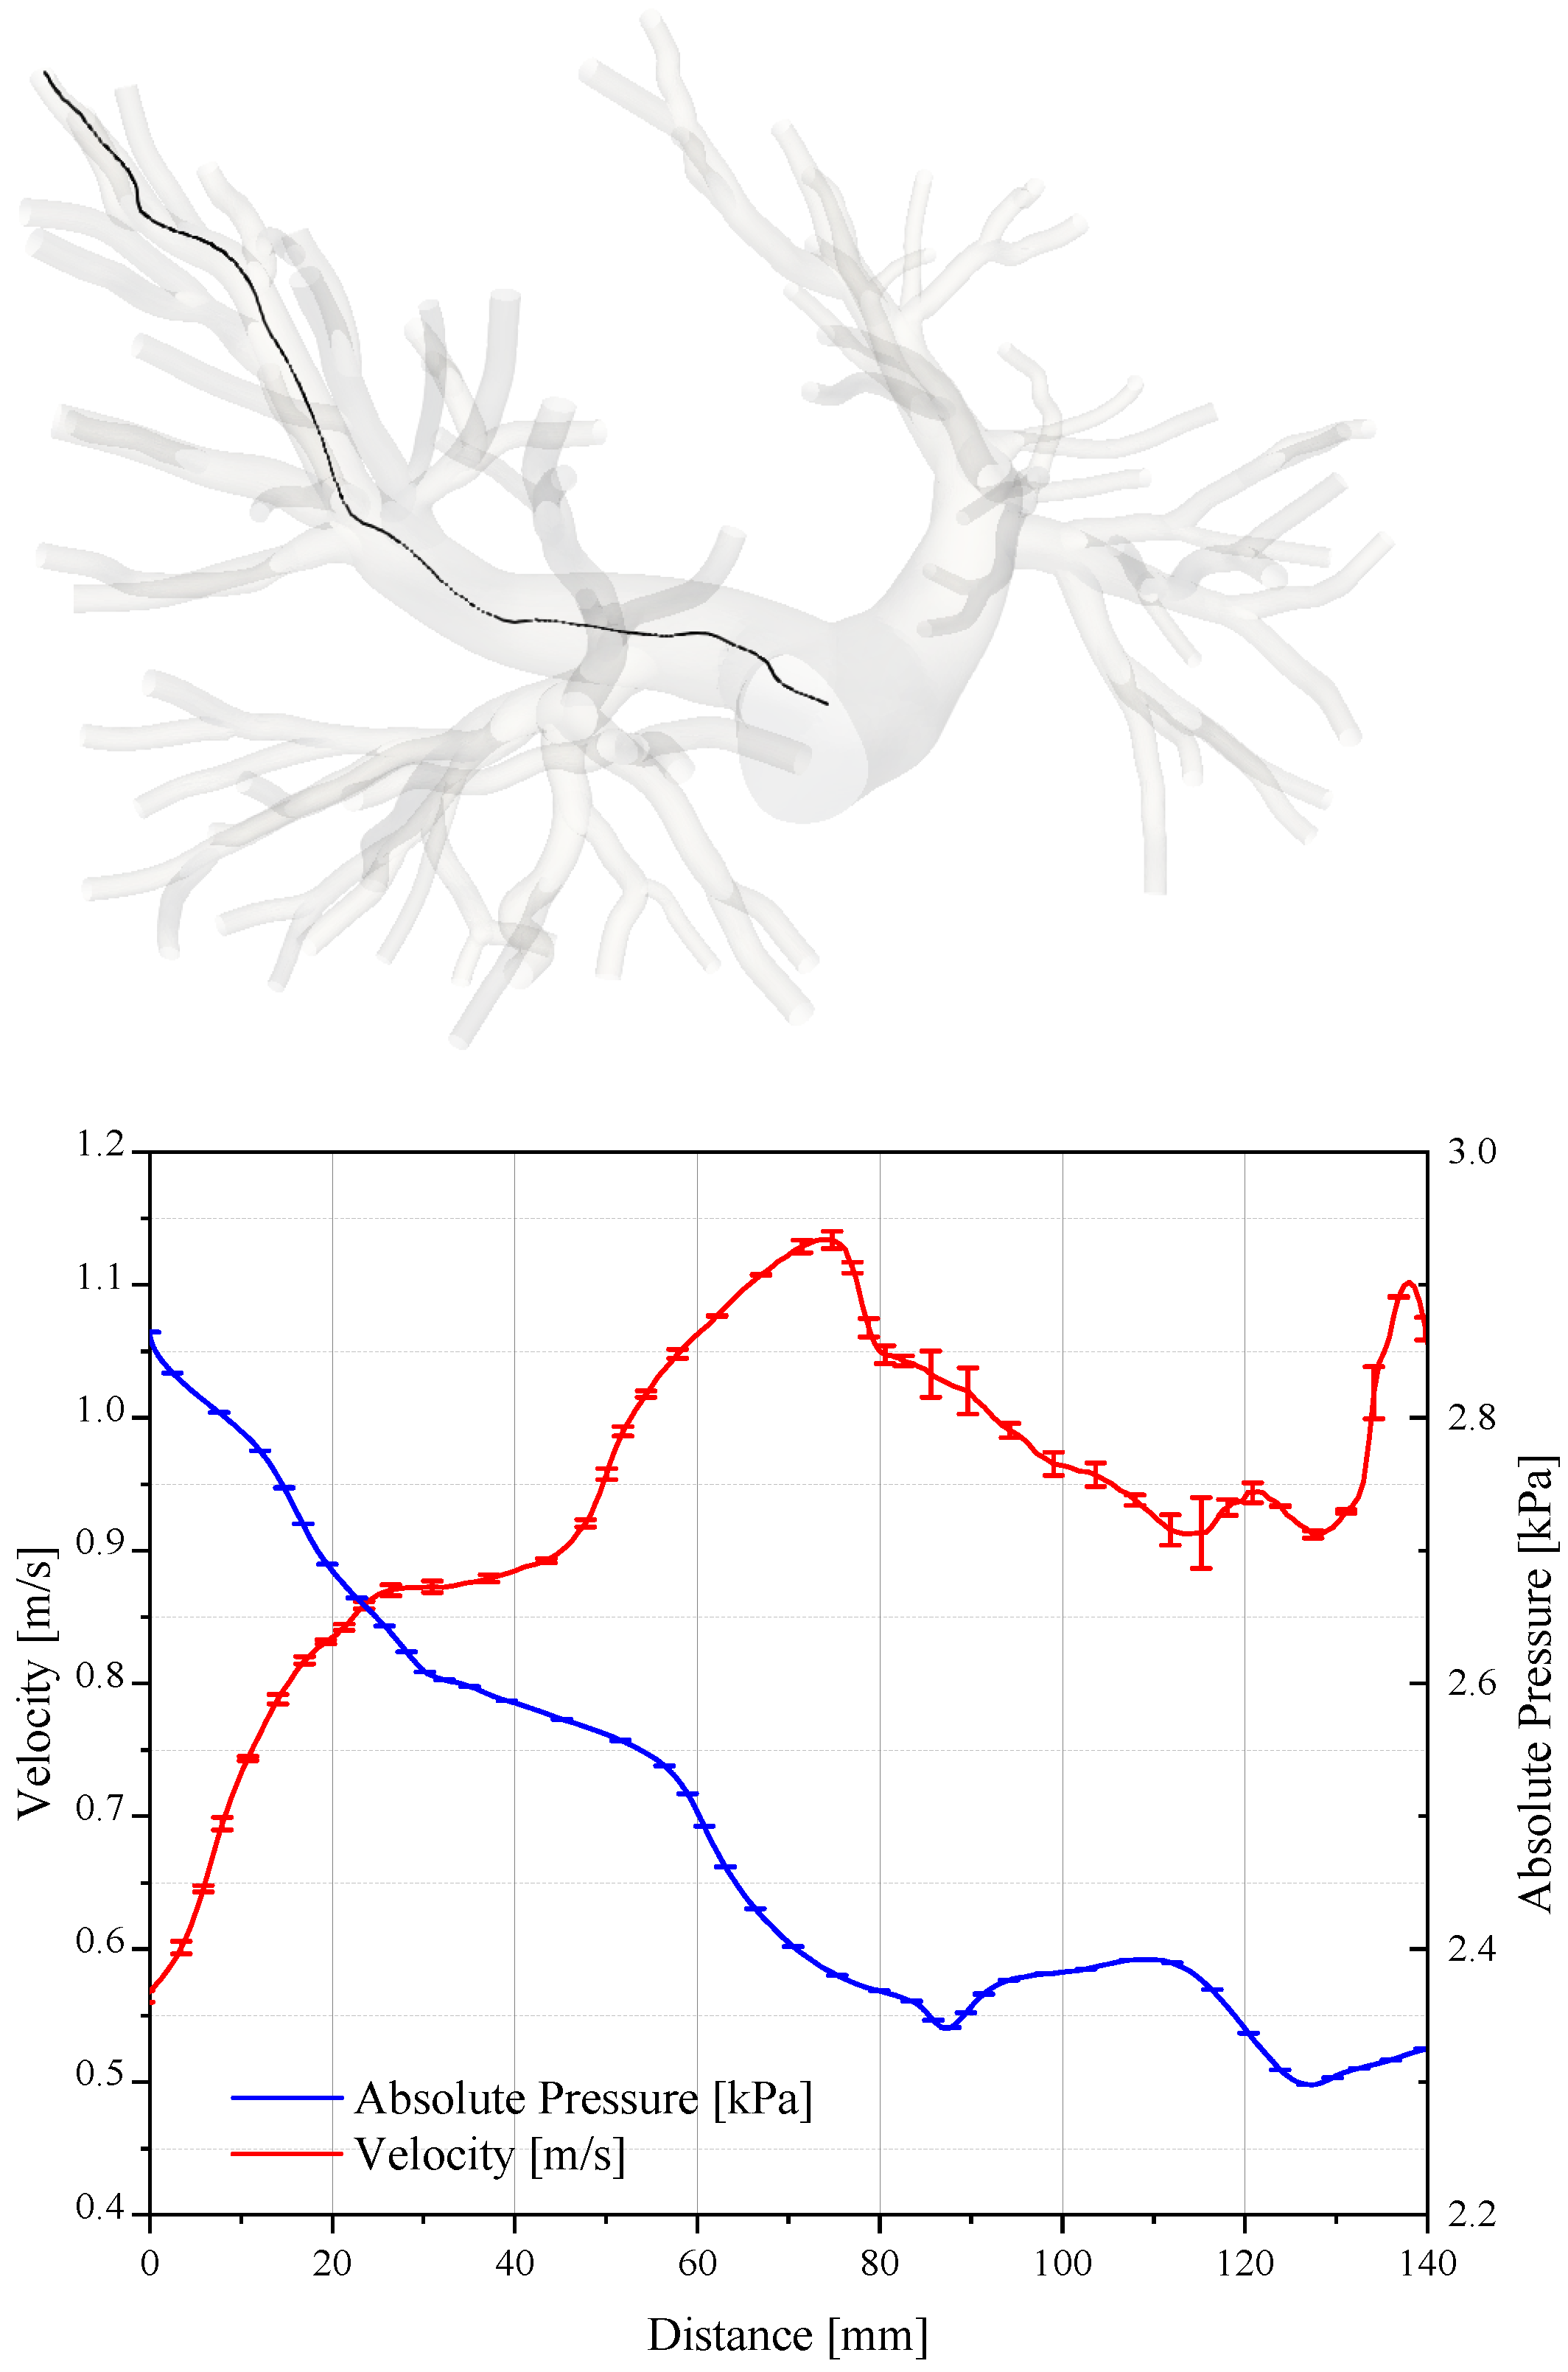
The assessment of the accuracy and convergence of CFD simulations is required to ensure reliable results. Figure 6 reports the pressure and velocity values sampled along the path line travelling from a bifurcation of the pulmonary trunk to one outlet of the domain.
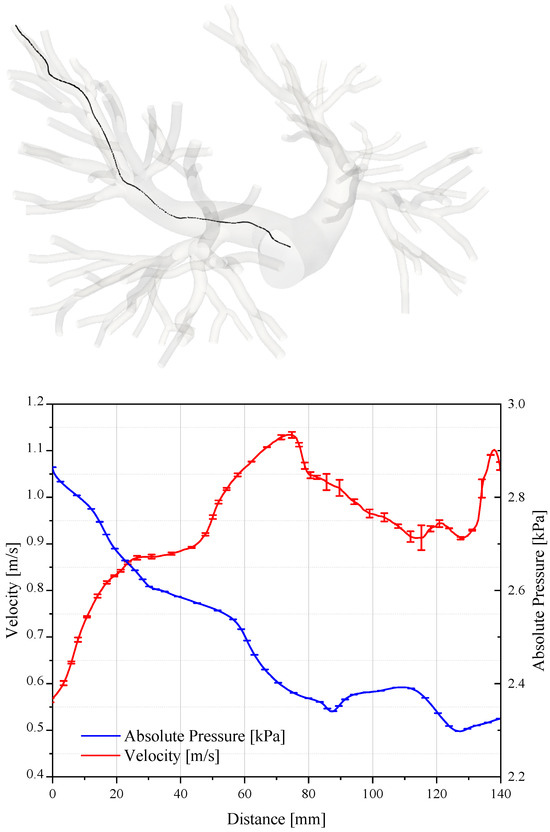
Figure 6.
Pressure and velocity sampled on a path that connects the pulmonary trunk to the termination of the artery. The plot is relative to the systolic peak.
As expected, the velocity increases in the ramification of the pulmonary artery where the section is smaller. On the contrary, the pressure diminishes by about 500 Pa. We evaluated the uncertainty of the numerical results in accordance with the criterion illustrated by Roache in [34,35,36], where the assessment procedures adopted by the AIAA, ITTC, and IEEE are described and discussed in detail. Table 2 reports the grid convergence index and the order of convergence for the average value of pressure and velocity fields sampled along the path line.
Table 2.
Grid convergence index and the order of convergence for the pressure and velocity fields.
The grid convergence index (GCI) is defined as:
where SF is the safety factor; and are the solutions obtained with the fine and the intermediate grid levels, respectively; r is the grid dimensions ratio; and is the order of the convergence observed.
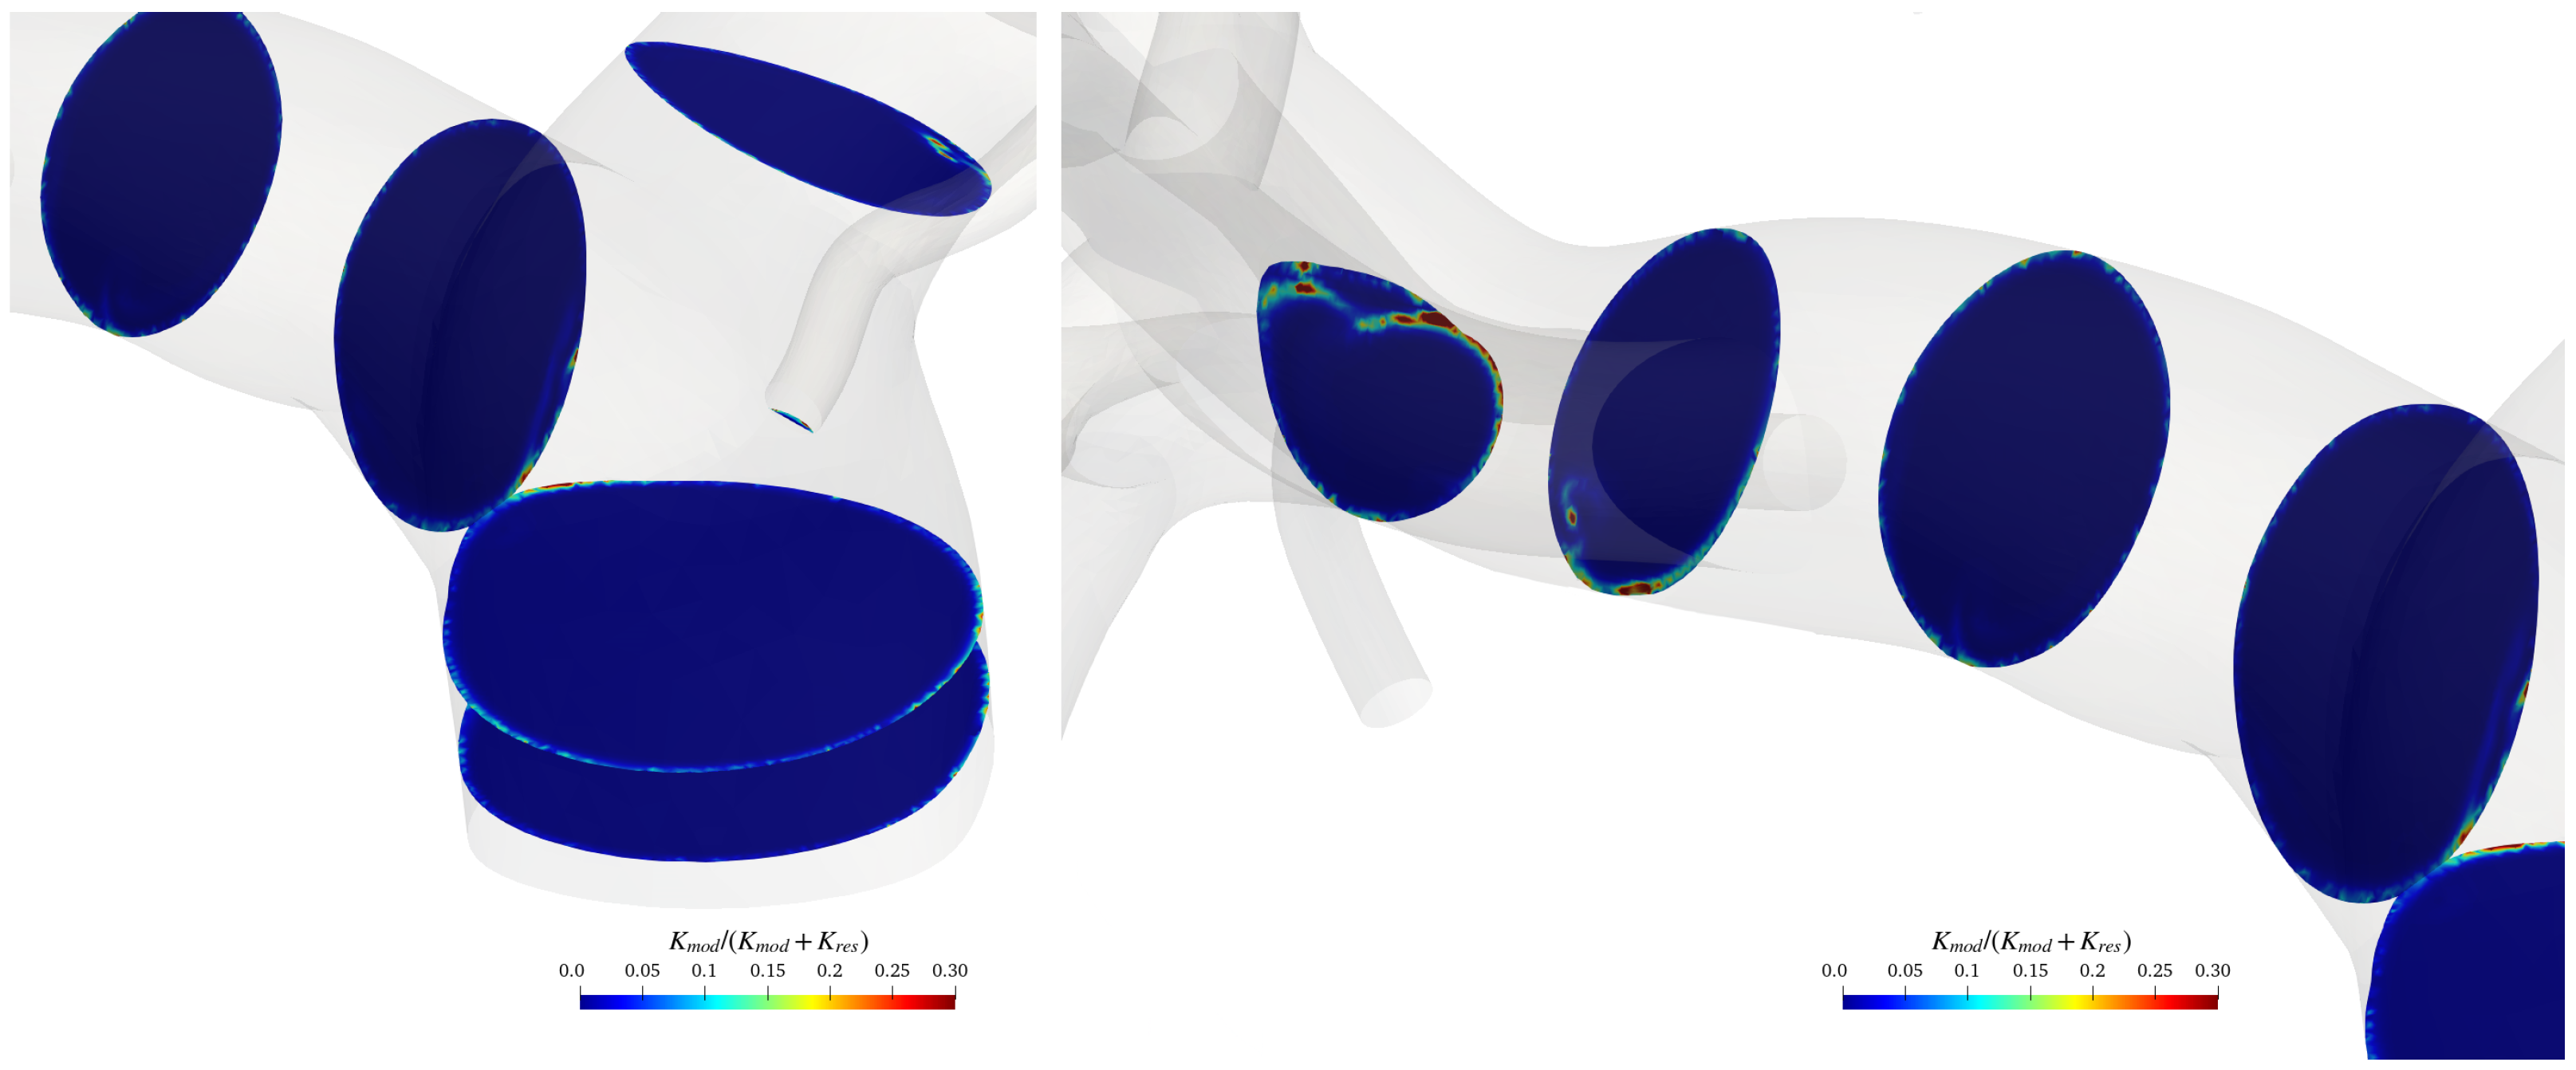
To verify the adequacy of the adopted grid far from the artery’s walls, where the turbulence model reduces to a large-eddy simulation, the modelled kinetic energy was evaluated and compared with the total energy. To do that, we followed Di Mascio et al. [37]. Figure 7 shows the ratio between the modelled kinetic energy and the total kinetic energy on various cross-sections of the pulmonary artery for a specific temporal instant (during the systolic phase).
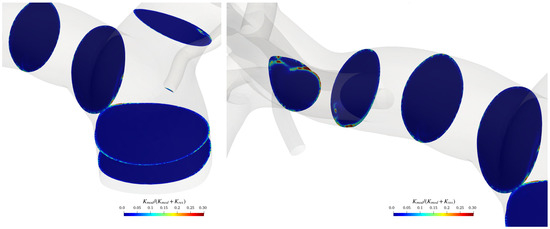
Figure 7.
sections in the pulmonary trunk area and on the terminal part of the artery.
The modelled kinetic energy in the bulk flow is relatively small compared to the resolved one; the ratio between the modelled and total kinetic energy is almost everywhere smaller than the value of 0.3, and thus, the grid can be considered adequate for LES resolution, according to the Pope criterion [38] (with only a few spots where the latter exceeds 0.3). Of course, the ratio rises over 0.3 in the boundary layer on the pulmonary arteries walls, where we run a Reynolds-averaged Navier–Stokes equation simulation.
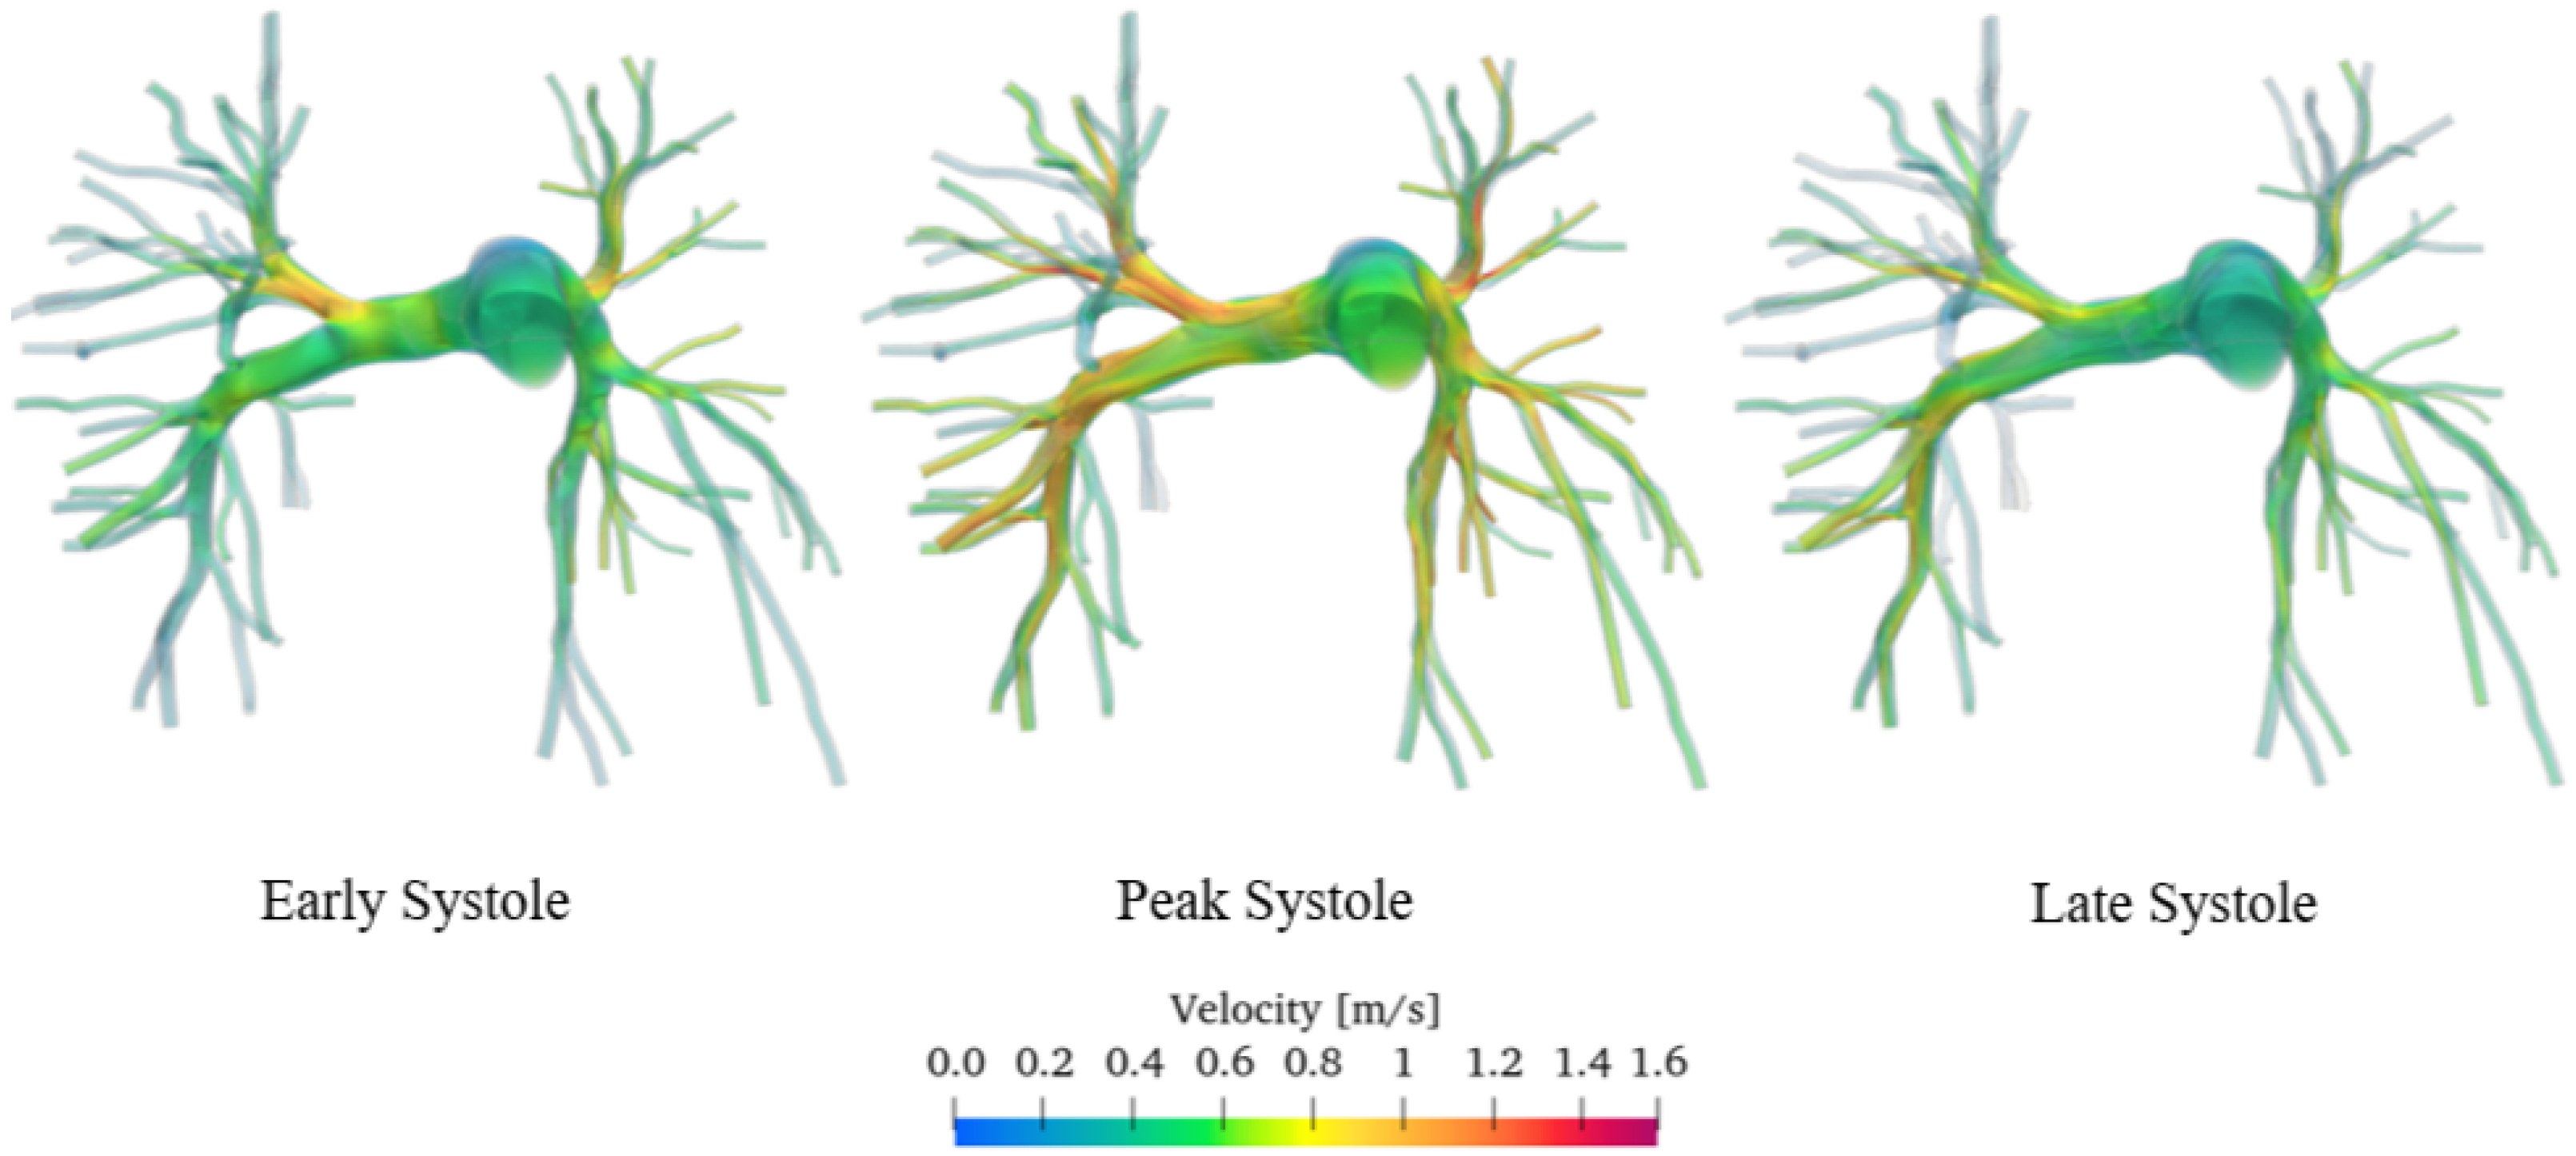
Figure 8 shows a 3D volumetric representation of the velocity field captured during early (i.e., when the first pressure peak occurs in the left ventricle, pushing blood through the aorta and into the pulmonary arteries), peak, and late systole (i.e., in the moments preceding the start of diastole, when the ventricles continue contracting to expel the remaining blood into the blood vessels).
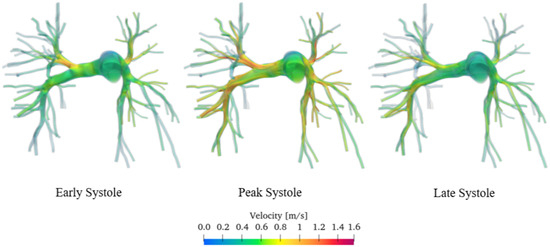
Figure 8.
Velocity flow field of the sane pulmonary artery. Volume render.
Unfortunately, flow measurements regarding this specific patient are not available. Consequently, to validate our approach, we rely on experimental data from literature acquired with phase-contrast magnetic resonance imaging or Doppler ultrasound. The velocities are of the order of magnitude of approximately 0.4 m/s during early and late systole and 0.8 m/s during the peak systole, being in agreement with the data acquired through contrast-enhanced magnetic resonance imaging and published by various authors [39,40,41,42].
Figure 9 shows the pressure field, in particular the relative pressure computed with respect to the pulmonary trunk, which we considered as a reference section. Specifically, the relative pressure was calculated using the following Equation (5):
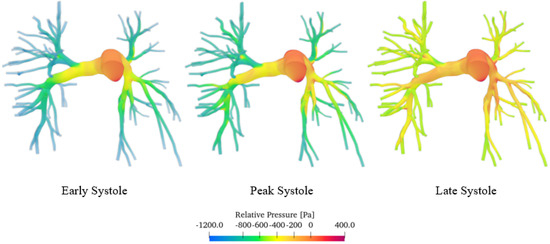
Figure 9.
Pressure field of the sane pulmonary artery volume render.
p and are defined as the local pressure and the pressure at the pulmonary trunk, respectively.
The simulations show that pressure, like velocity, tends to increase until reaching maximum values during peak systole. The pressure distribution is highest upstream of the constrictions. As blood moves from the larger central artery into the narrower branching vessels, it encounters increased vascular resistance, which leads to a decrease in pressure. The central artery, being wider, presents a lower resistance and thus maintains higher pressure levels. Conversely, in the smaller branches, the increase in resistance causes a reduction in pressure as the blood flows through [43]. As can be seen from the false-colour map, the pressure values vary in a range of about 1600 Pa (12 mmHg), which are consistent with those obtained through contrast-enhanced magnetic resonance imaging on 50 patients [44]. Similar values were also obtained by Laaban et al. [45].
3.2. Comparison Between Healthy and Diseased Pulmonary Arteries
Figure 10 shows the velocity streamlines during early, peak, and late systole for both the healthy and pathological cases.
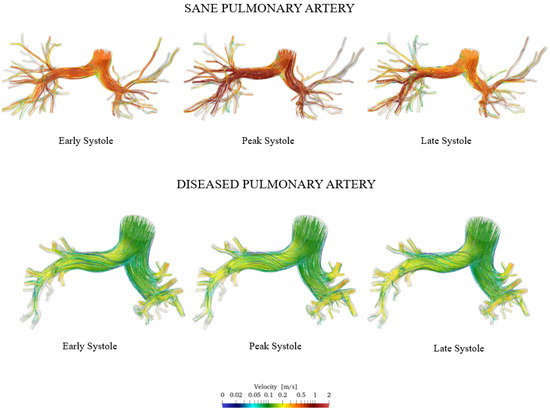
Figure 10.
Comparison of sane and diseased pulmonary artery: velocity streamlines.
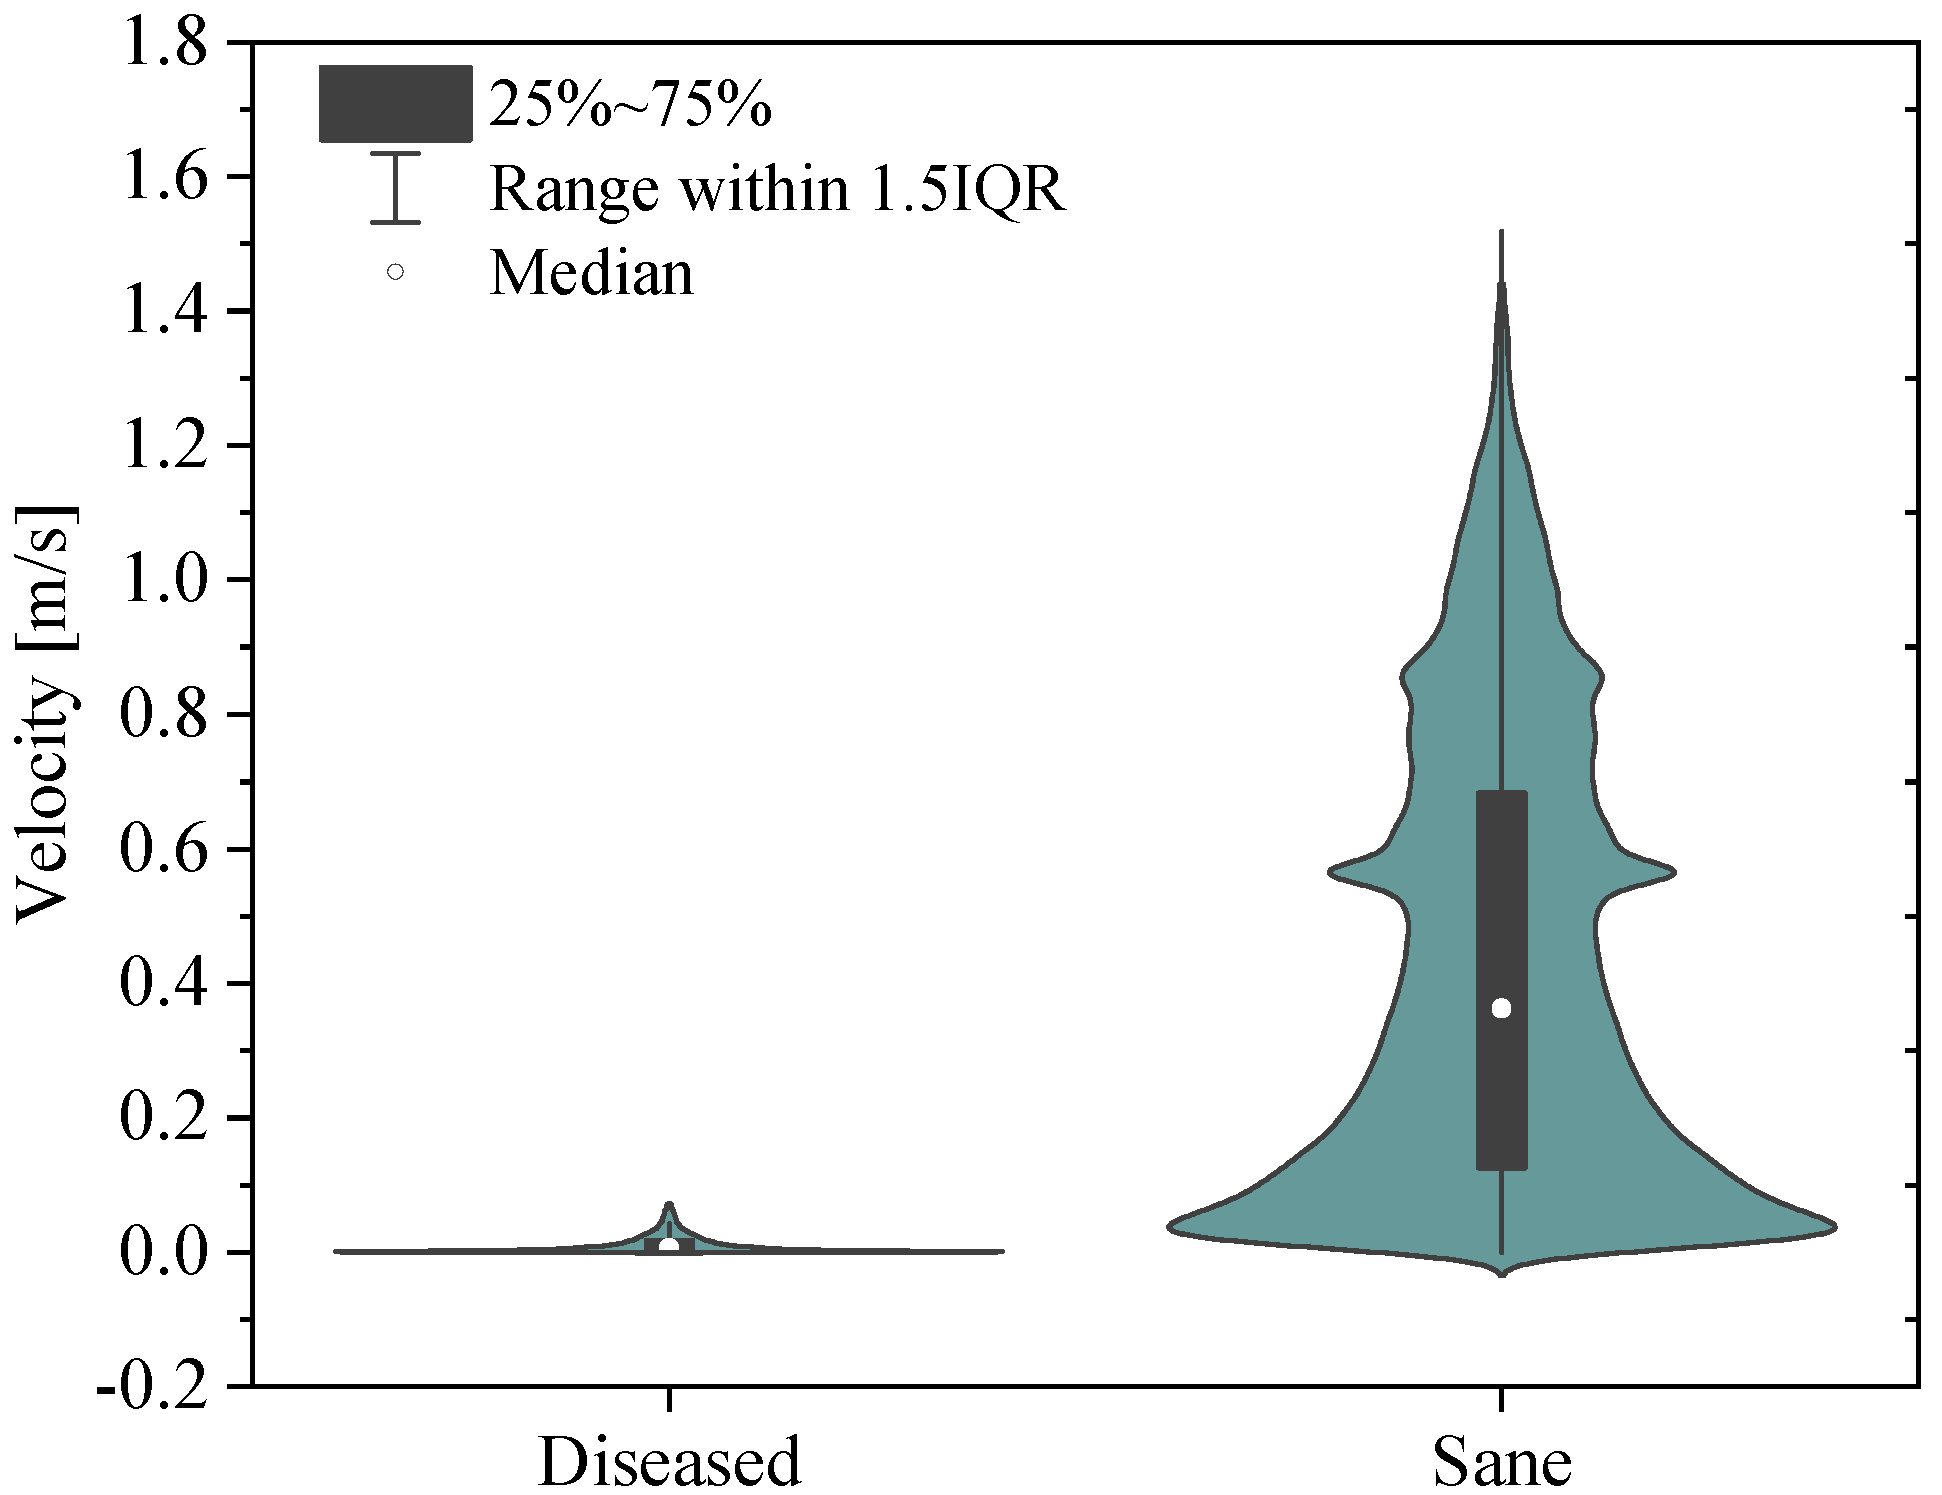
The simulation results show that velocity tends to increase until the systolic peak and then decreases, driven by the fact that the heart is entering its relaxation phase. It is noteworthy that even during peak systole, the velocity in the proximal pulmonary arteries of the patient with pulmonary hypertension is lower compared with that in healthy arteries. Specifically, it can be observed that the velocity field in the pathological artery is of a lower intensity and more uniform. This is confirmed by the violin plot of the velocity vector’s magnitude reported in Figure 11.
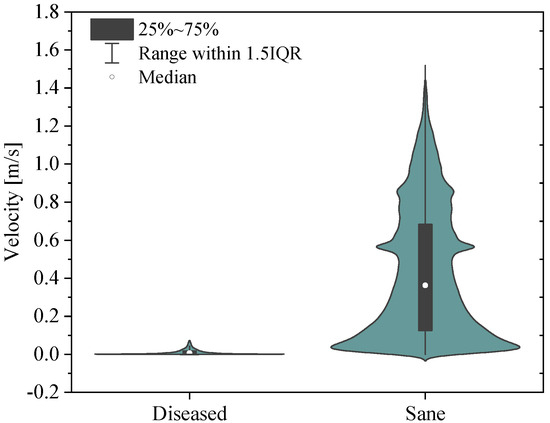
Figure 11.
Violin plots for the sane and diseased pulmonary arteries. Velocity vector’s magnitude.
It follows that the flow rate that perfuses the lungs is lower in patients with pulmonary arterial hypertension compared with healthy individuals. This, combined with the larger size of proximal arteries, leads to a more stagnant flow, increasing the risk of blood clot formation, heart failure, atherosclerosis, and endothelial dysfunction in the pathological pulmonary arteries [40].
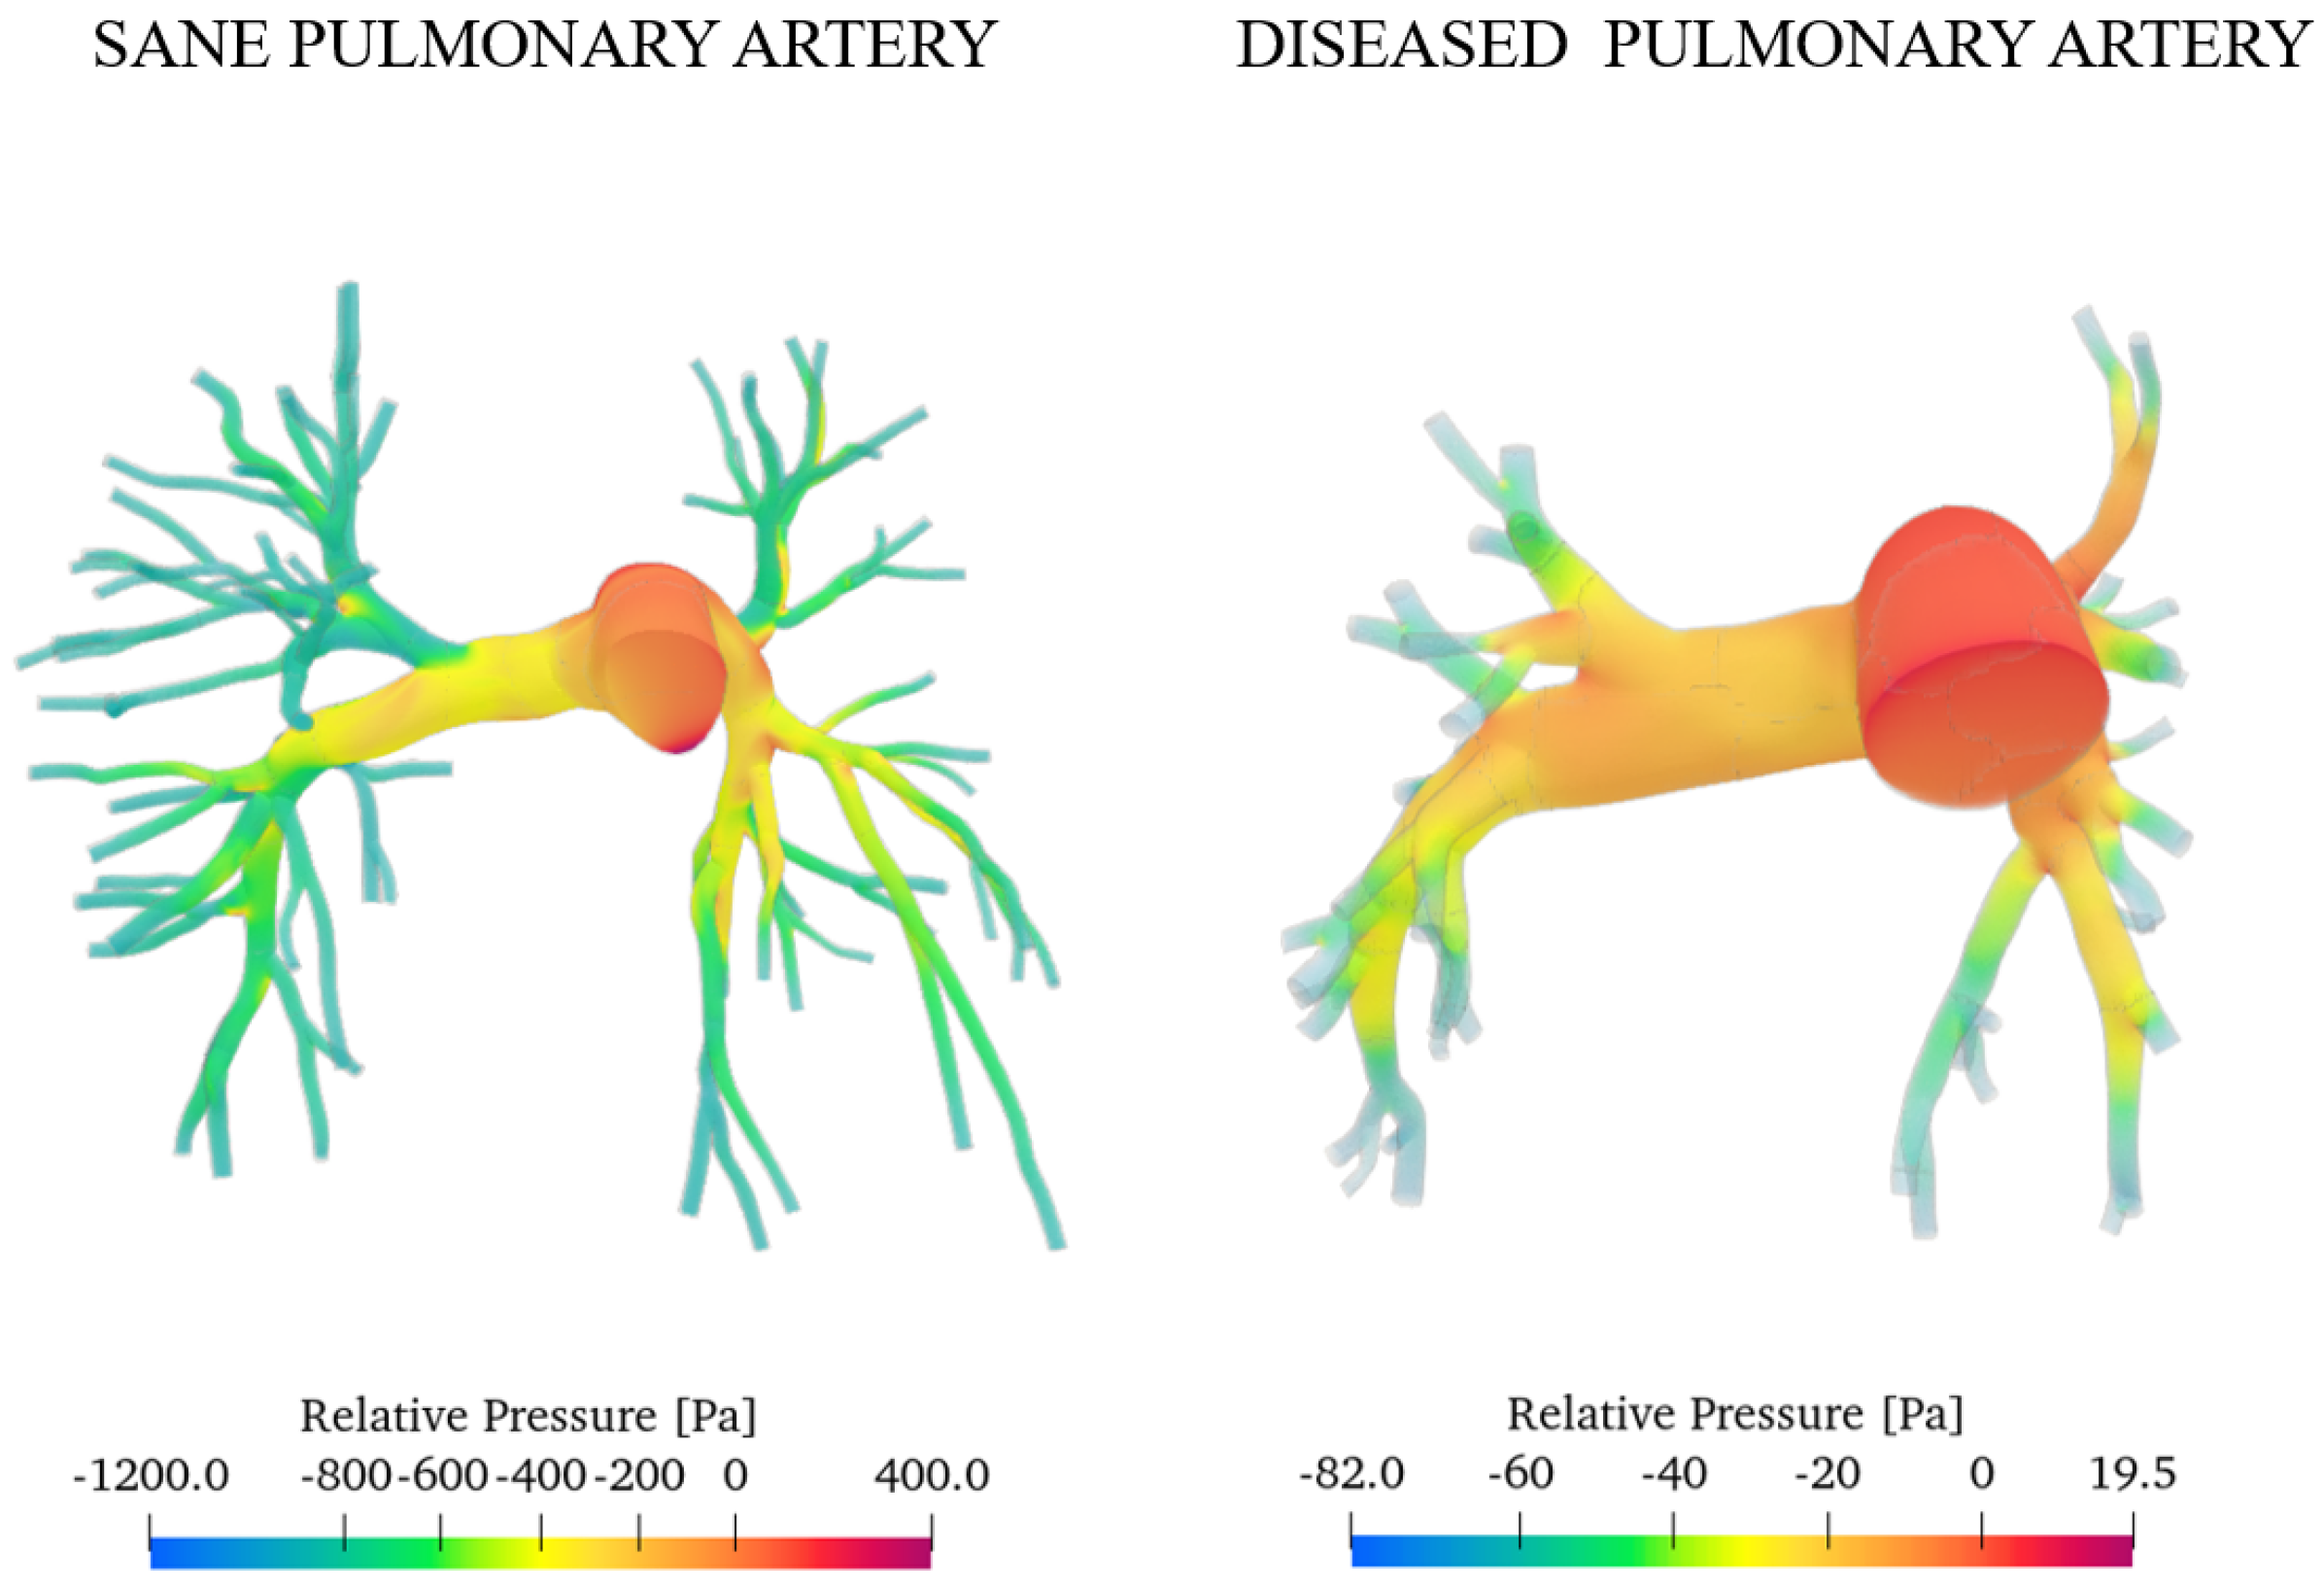
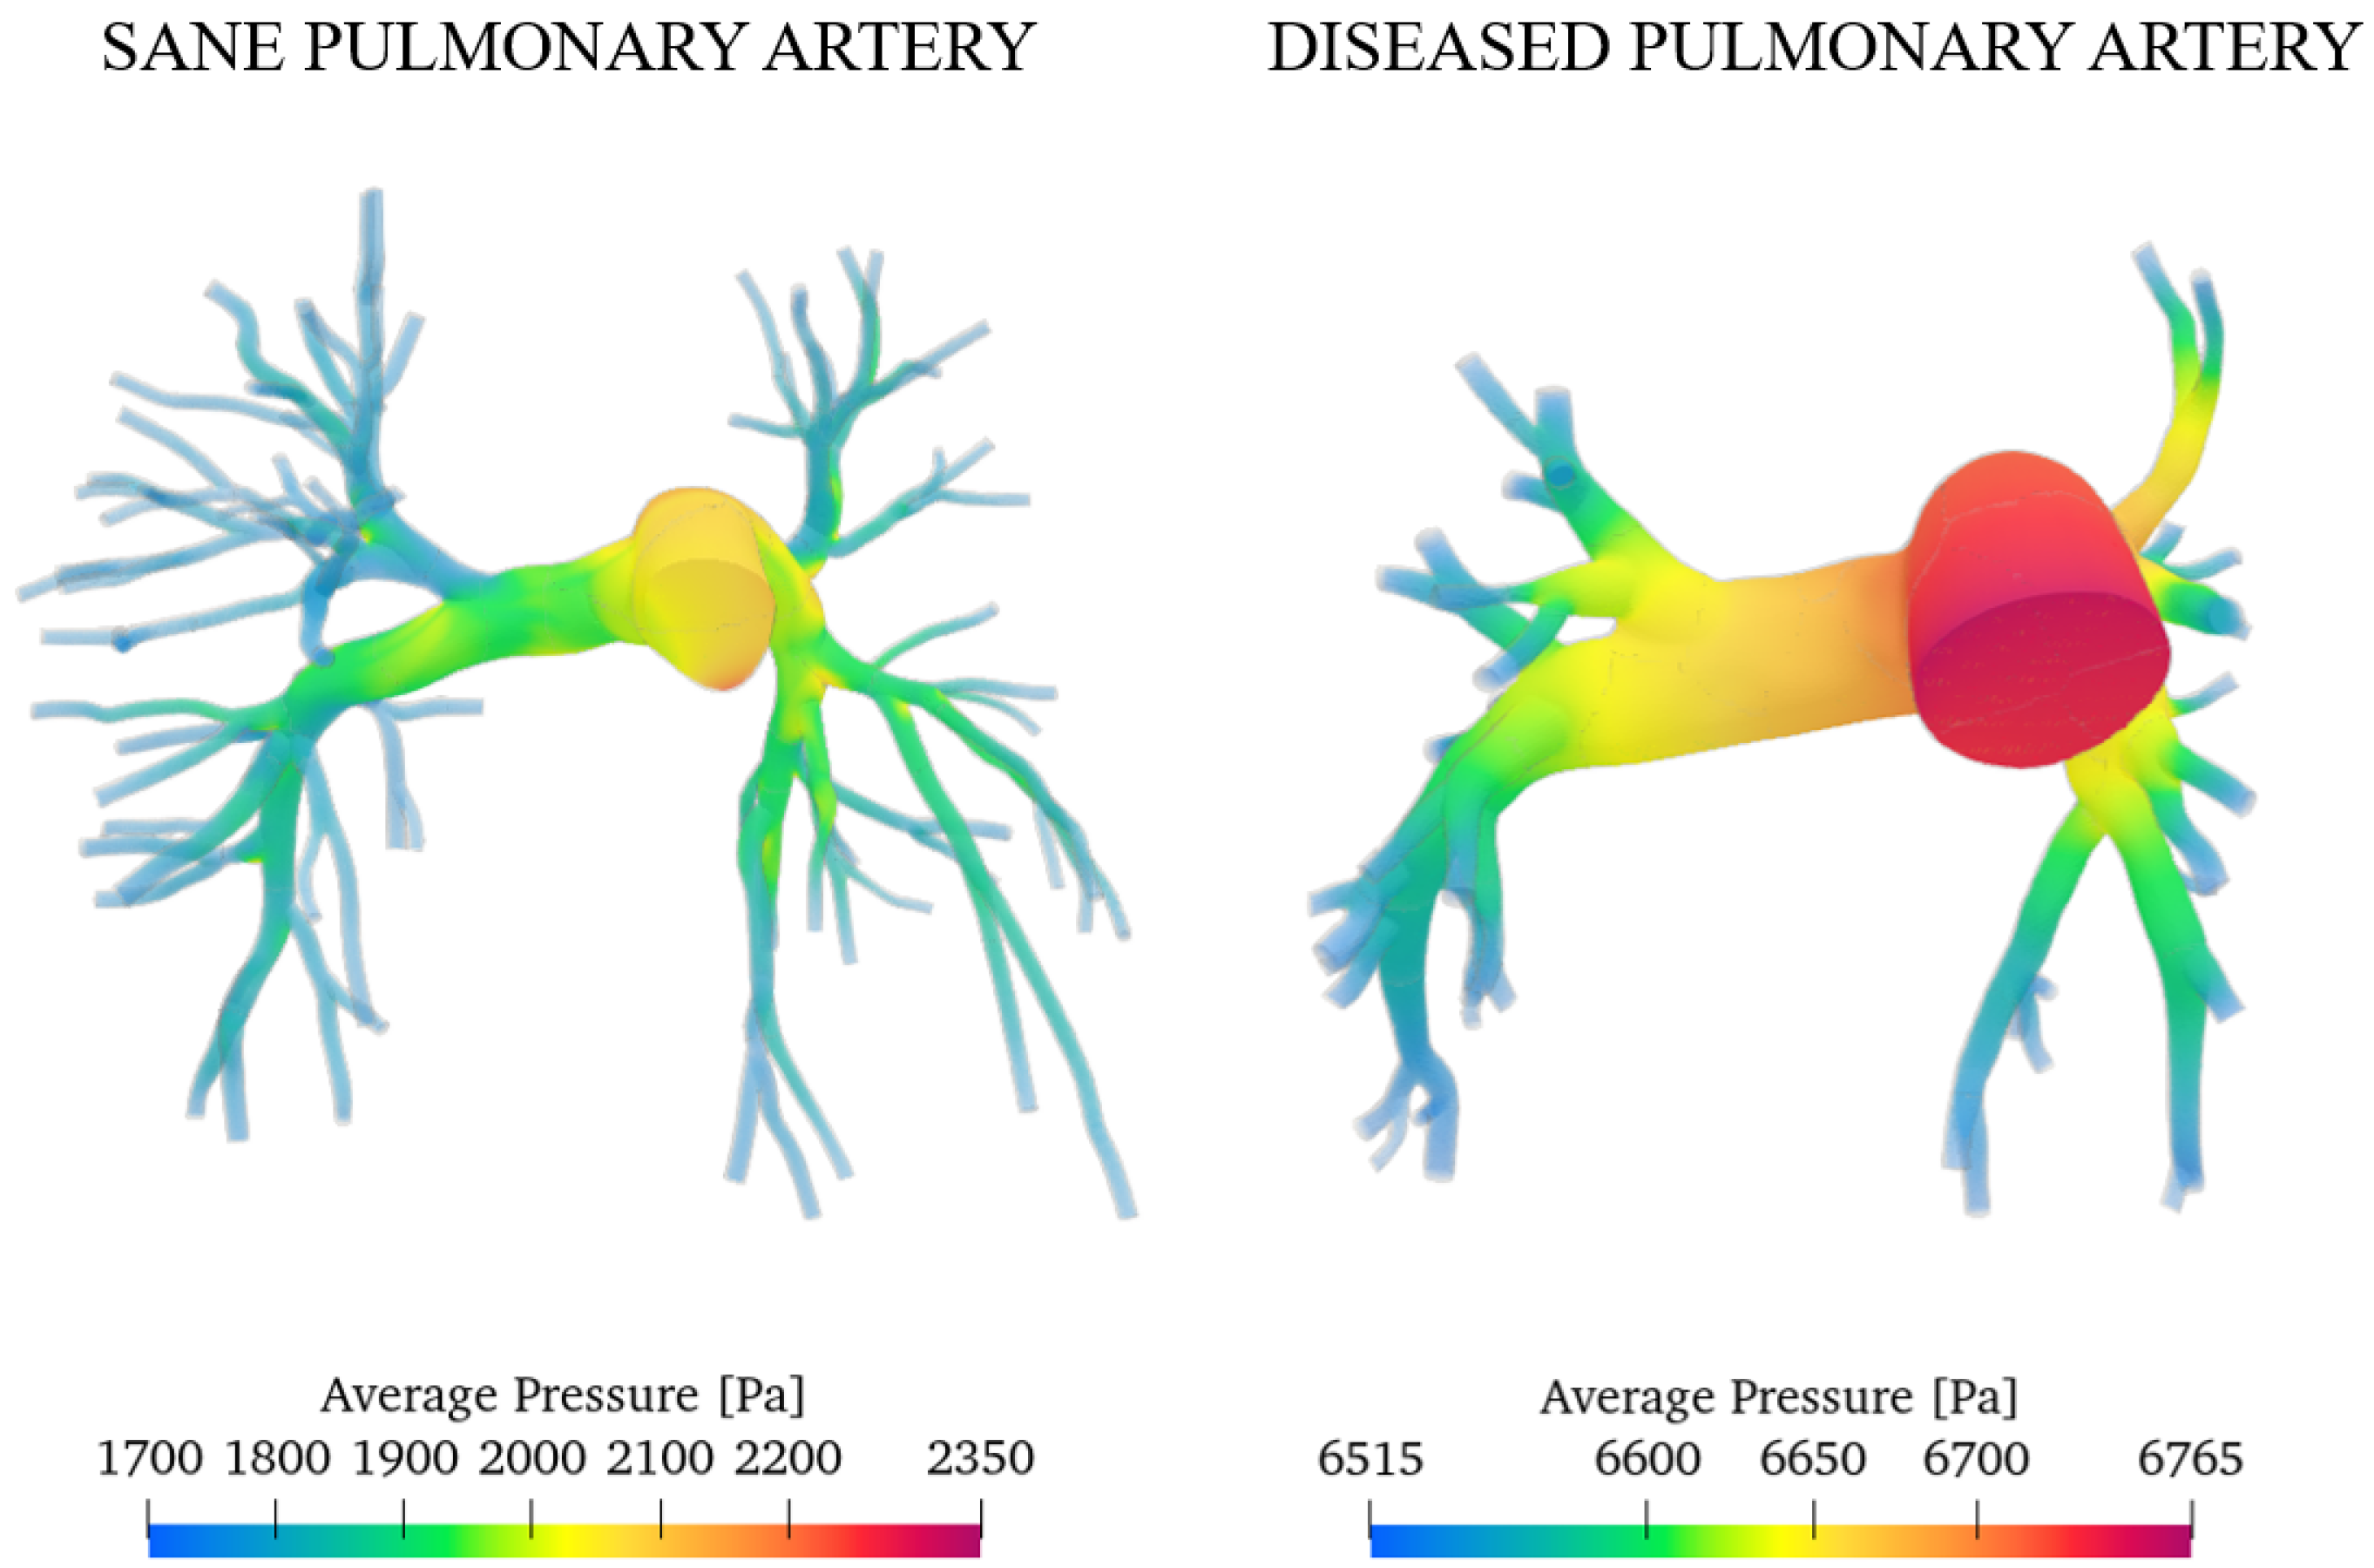
Figure 12 presents the pressure fields obtained for both the healthy and diseased cases at the systolic peak.
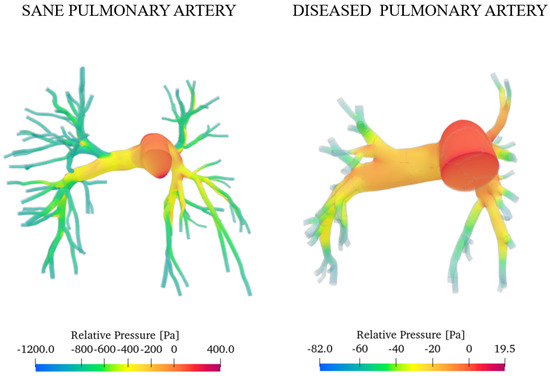
Figure 12.
Relative pressure with reference to the inlet section.
As expected, the diseased artery presents higher pressure values. This is a consequence of mechanisms such as vasoconstriction and vascular remodelling, which raise resistance to blood flow. We evaluated the degree of pulmonary hypertension (PAH) relying on the work of Pillalamarri et al., who outline three possible scenarios of pulmonary arterial hypertension (mild, moderate, and severe) depending on the value of the average absolute pressure on one heartbeat measured by right heart catheterisation [46]:
The pressure is computed as follows
where and are systolic and diastolic pressures, respectively.
Following the same procedure reported, we computed the average pressures for the sane and pathological cases. Figure 13 shows the results.
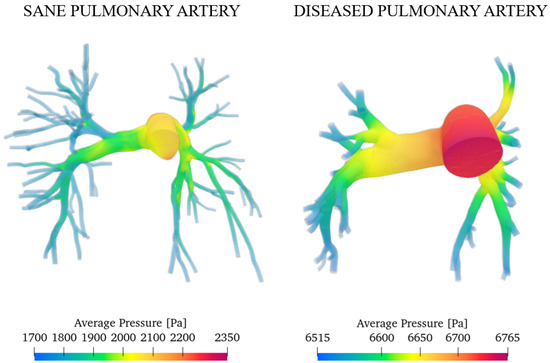
Figure 13.
Average pressure in a heartbeat for the sane and diseased patients.
Integrating the values over the domain, we obtained the overall average pressure in a heartbeat that is equal to 1865 Pa (14 mmHg) for the sane artery and 6665 Pa (50 mmHg) for the pathological case. This result agrees with the measurements of Tang et al. through the MRI, which obtained the same value [40]. We can conclude that the degree of arterial hypertension for the investigated subject is severe.
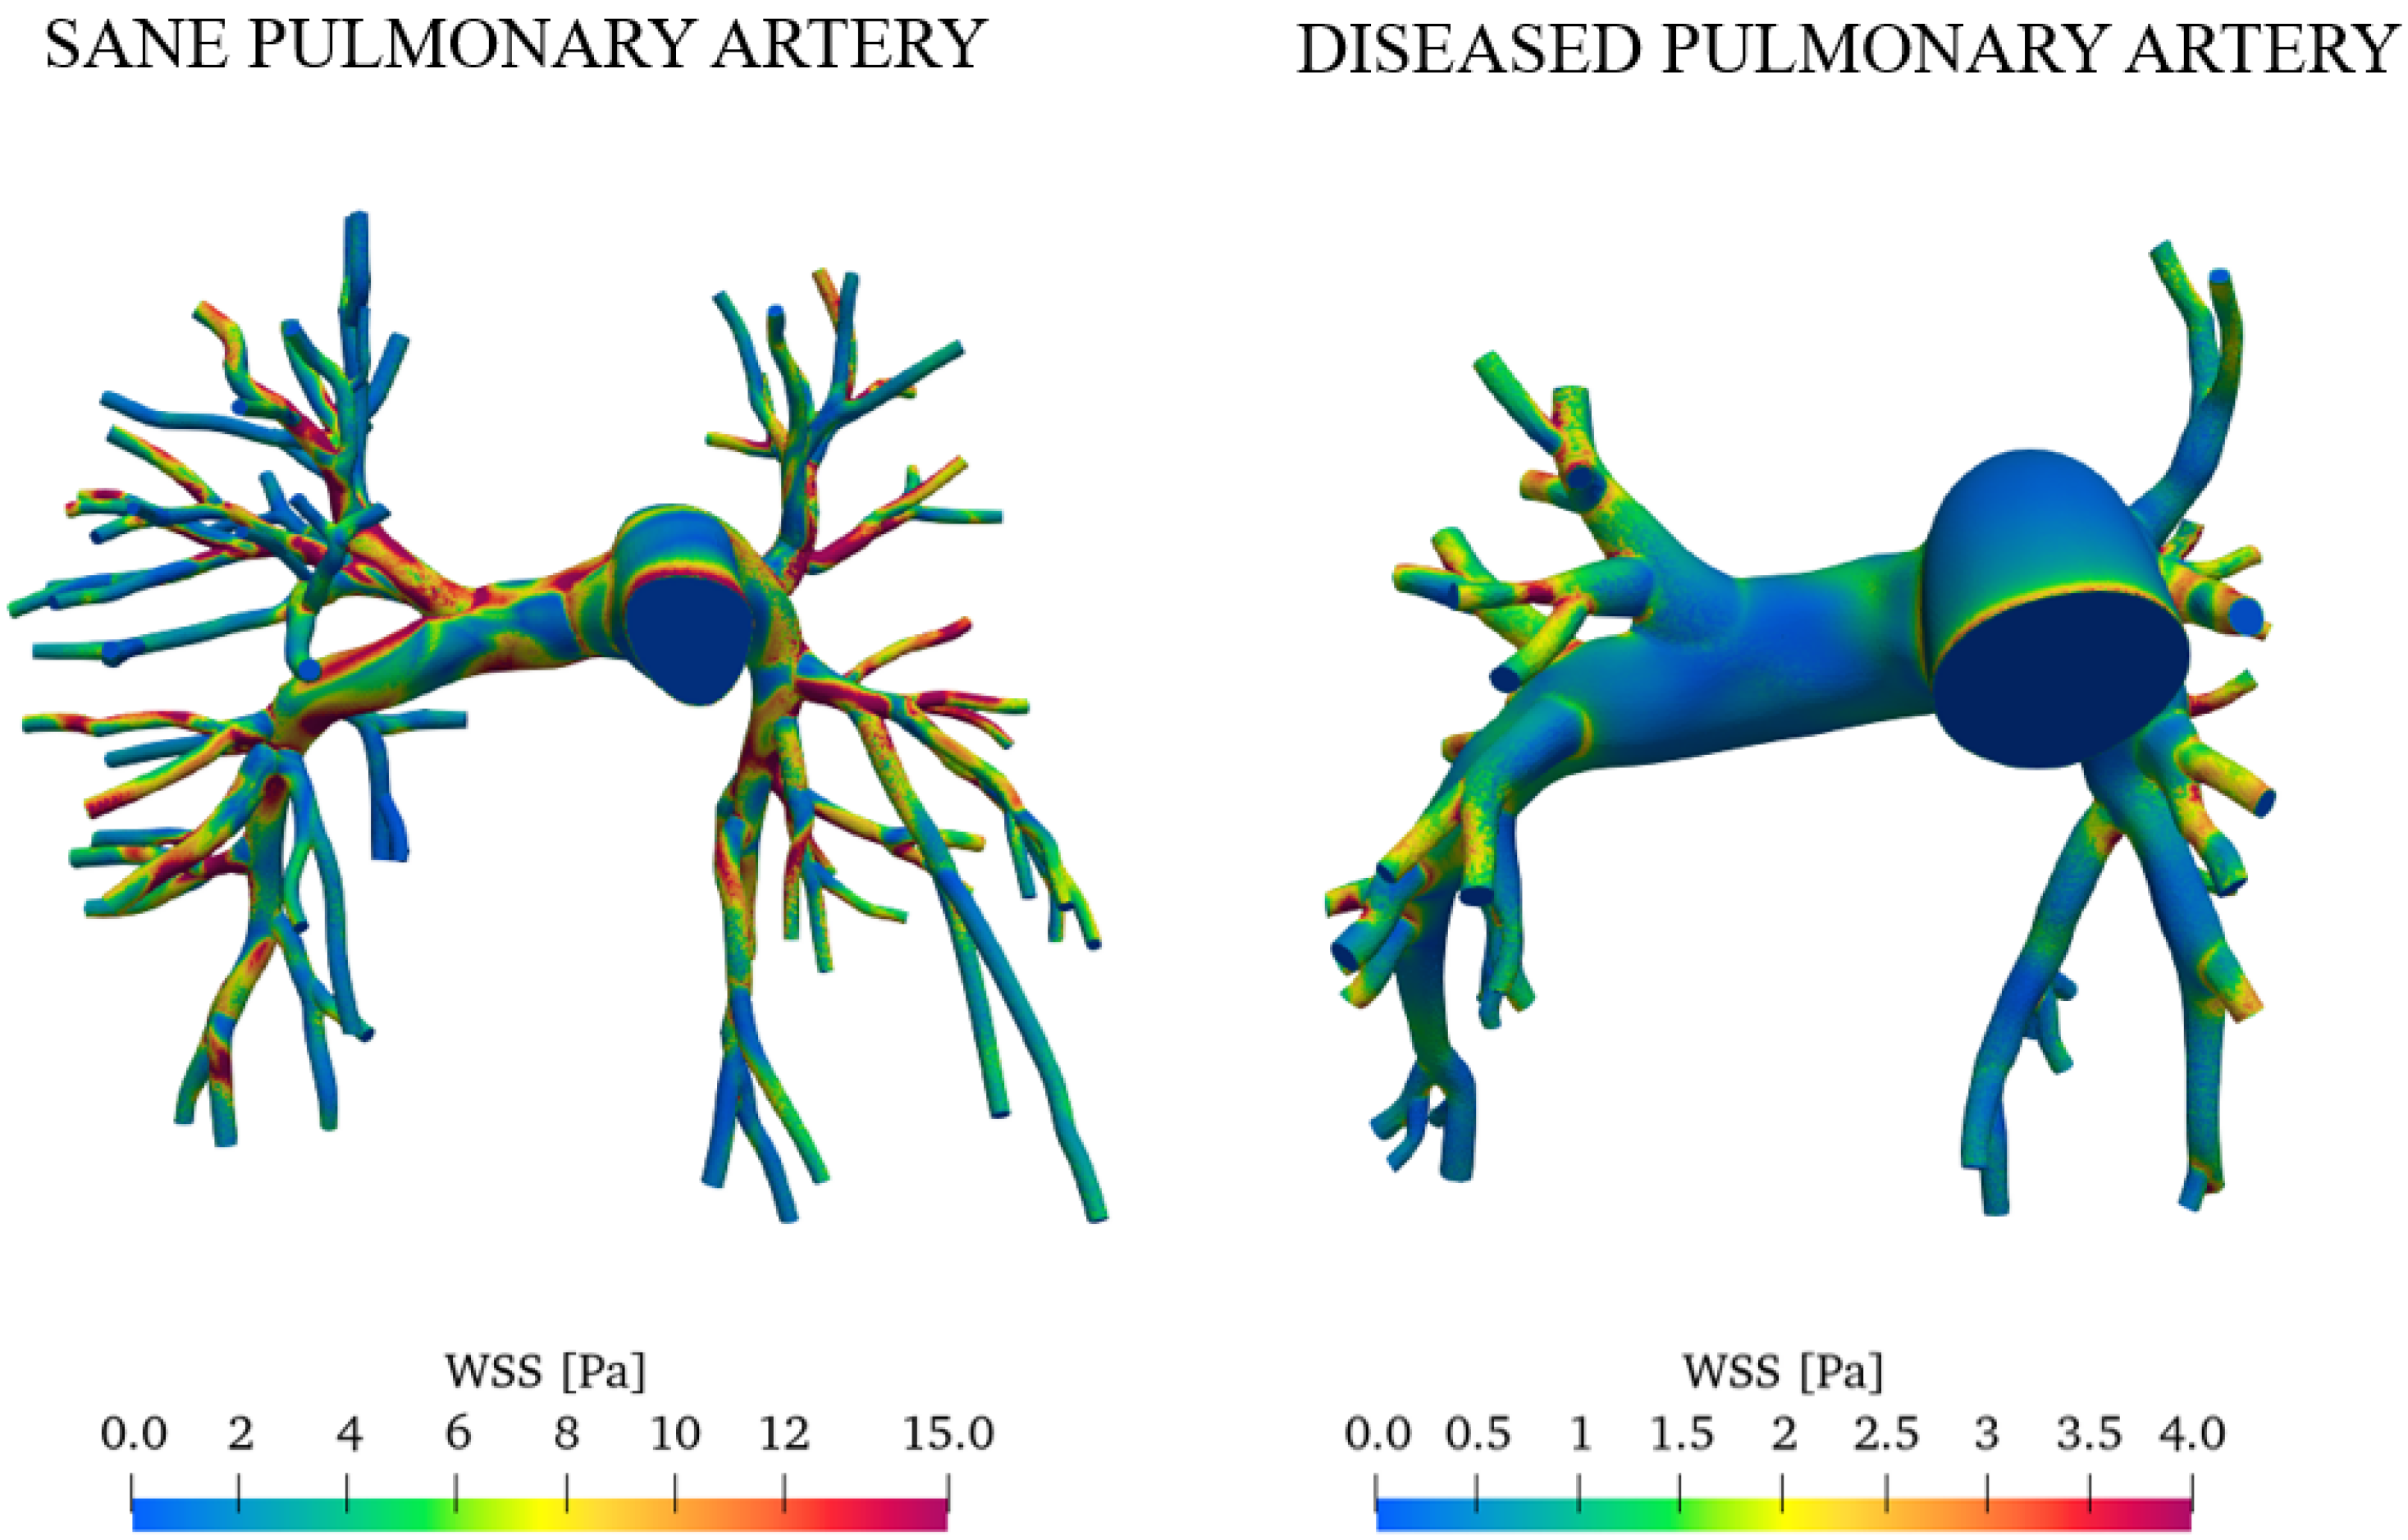
Figure 14 reports the wall shear stress (WSS) at the peak systole for both the sane and diseased pulmonary arteries.
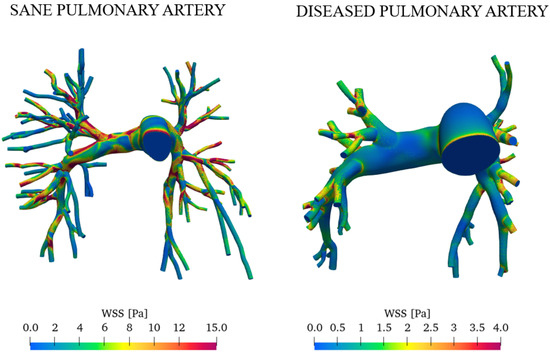
Figure 14.
Comparison of WSS in healthy and pathological subjects during peak systole.
The average wall shear stress values are significantly lower in the right and left pulmonary arteries in patients with pulmonary arterial hypertension [39,40]. WSS is higher in healthy pulmonary arteries primarily due to the blood flow velocity and optimal vascular diameter. In contrast, vascular remodeling, increased resistance, and turbulent flow contribute to reduced WSS in arteries affected by PAH.
4. Conclusions
We investigated the blood flow in the pulmonary artery using pimpleWKFoam, an ad hoc developed CFD solver featuring the three-element Windkessel pressure boundary condition for correct reproduction of the vasculature downstream of the integration domain. We considered 3D-real geometries and pulsatile waveforms reflecting real cardiac cycles of a sane subject and a patient affected by pulmonary hypertension, aiming to provide a detailed quantification of the flow parameters and compare the characteristics of the resulting blood flows.
We assessed the numerical uncertainty, convergence, and DES quality of the simulations performed. The results obtained were in reasonably good agreement with the experimental diagnostic data of the specific subjects, showing similar pressure and velocity values. In particular, the main findings are:
- The pressure is highest upstream in the central artery, which, being broader, maintains higher pressure levels. Conversely, in the smaller branches, the increase in resistance causes a reduction in pressure as the blood flows through.
- The presence of PAH increases the average pressure in the pulmonary artery of the investigated subjects from 14 mmHg (sane subject) to 50 mmHg (diseased subject). The pressure field becomes more uniform with a range of variation of approximately 100 Pa, while for a healthy subject it is ≈1600 Pa.
- In healthy individuals, we observed a more turbulent, swirling flow along the walls of the arteries. Flow velocity is averagely equal to 1 m/s; on the opposite, in the presence of hypertension, due to increased vascular resistance, velocity magnitude falls to values of approximately 0.1 m/s, and the flow becomes more uniform with a lower turbulence intensity.
- Pulmonary hypertension induces dramatic changes in the WSS of the pulmonary vasculature. Wall shear stresses are more homogeneous and four times lower in patients with PAH compared with healthy subjects. These outcomes have significant effects on pulmonary endothelial health and vasculature remodeling.
This work shed more light on the blood flow characteristics in the human pulmonary artery, revealing substantial differences between the two clinical scenarios analyzed.
Author Contributions
Conceptualization, F.D. and P.M.; methodology, F.D.; software, F.D.; validation, P.M.; formal analysis, P.M.; investigation, P.M.; resources, F.D.; writing—original draft preparation, P.M.; writing—review and editing, F.D.; supervision, F.D. All authors have read and agreed to the published version of the manuscript.
Funding
This research received no external funding.
Institutional Review Board Statement
Not applicable.
Informed Consent Statement
Not applicable.
Data Availability Statement
Data is contained within the article.
Acknowledgments
All the simulations were performed with the developed solver on the Galileo100 cluster of HPC CINECA facilities within the agreement between DIIIE—Università degli Studi dell’Aquila and CINECA.
Conflicts of Interest
The authors declare no conflicts of interest.
Abbreviations
The following abbreviations are used in this manuscript:
| CFD | Computational Fluid Dynamic |
| DES | Detached Eddy Simulation |
| MRI | Magnetic Resonance Imaging |
| MRA | Magnetic Resonance Angiography |
| PC-MRI | Phase Contrast Magnetic Resonance Imaging |
| PISO | Pressure Implicit with splitting of operator |
| LES | Large Eddy Simulation |
| RAS | Reynolds-Averaged Navier–Stokes |
| WK | Wind Kessel |
| MPA | Main Pulmonary Artery |
| RPA | Right Pulmonary Artery |
| LPA | Left Pulmonary Artery |
| WSS | Wall Shear Stress |
References
- Silverthorn, D.U. Human Physiology; Jones & Bartlett Publishers: Burlington, MA, USA, 2015. [Google Scholar]
- Garamendi, P.M.; Lucena, J.S.; Gómez-Bueno, M.; Segovia, J. Pulmonary Artery Pathology; Springer: Cham, Switzerland, 2015; pp. 31–52. [Google Scholar] [CrossRef]
- Tang, Q.H.; Chen, J.; Hu, C.F.; Zhang, X.L. Comparison Between Endovascular and Open Surgery for the Treatment of Peripheral Artery Diseases: A Meta-Analysis. Ann. Vasc. Surg. 2020, 62, 484–495. [Google Scholar] [CrossRef]
- Man, J.H.; Rodriguez, C.N.; Sharafuddin, M.J. The Use of Preoperative Imaging for Planning Endovascular and Hybrid Procedures. In Vascular Reconstructions: Anatomy, Exposures and Techniques; Springer: New York, NY, USA, 2021; pp. 433–442. [Google Scholar] [CrossRef]
- de Zélicourt, D.A.; Steele, B.N.; Yoganathan, A.P. Advances in Computational Simulations for Interventional Treatments and Surgical Planning. In Image-Based Computational Modeling of the Human Circulatory and Pulmonary Systems: Methods and Applications; Springer: Boston, MA, USA, 2010; pp. 343–373. [Google Scholar] [CrossRef]
- Dedè, L.; Menghini, F.; Quarteroni, A. Computational fluid dynamics of blood flow in an idealized left human heart. Int. J. Numer. Methods Biomed. Eng. 2021, 37, e3287. [Google Scholar] [CrossRef]
- Lee, B.K. Computational Fluid Dynamics in Cardiovascular Disease. Korean Circ. J. 2011, 41, 423–430. [Google Scholar] [CrossRef] [PubMed]
- Kheyfets, V.O.; O’Dell, W.; Smith, T.; Reilly, J.J.; Finol, E.A. Considerations for Numerical Modeling of the Pulmonary Circulation—A Review With a Focus on Pulmonary Hypertension. J. Biomech. Eng. 2013, 135, 061011. [Google Scholar] [CrossRef] [PubMed]
- Basri, E.I.; Riazuddin, V.N.; Azriff, A.; Zuber, M.; Ahmad, K.; Shahwir, S. Computational Fluid Dynamics Study in Biomedical Applications: A Review. Int. J. Fluids Heat Transf. 2016, 1, 2–14. [Google Scholar]
- Ana Fernández Tena, P.C.C. Use of Computational Fluid Dynamics in Respiratory Medicine. Arch. Bronconeumol. 2015, 51, 293–298. [Google Scholar] [CrossRef]
- DeCampli, W.M.; Argueta-Morales, I.R.; Divo, E.; Kassab, A.J. Computational fluid dynamics in congenital heart disease. Cardiol. Young 2012, 22, 800–808. [Google Scholar] [CrossRef]
- Löhner, R.; Cebral, J.; Soto, O.; Yim, P.; Burgess, J.E. Applications of patient-specific CFD in medicine and life sciences. Int. J. Numer. Methods Fluids 2003, 43, 637–650. [Google Scholar] [CrossRef]
- Xu, P.; Liu, X.; Zhang, H.; Ghista, D.; Zhang, D.; Shi, C.; Huang, W. Assessment of boundary conditions for CFD simulation in human carotid artery. Biomech. Model. Mechanobiol. 2018, 17, 1581–1597. [Google Scholar] [CrossRef] [PubMed]
- Pirola, S.; Cheng, Z.; Jarral, O.; O’Regan, D.; Pepper, J.; Athanasiou, T.; Xu, X. On the choice of outlet boundary conditions for patient-specific analysis of aortic flow using computational fluid dynamics. J. Biomech. 2017, 60, 15–21. [Google Scholar] [CrossRef]
- Madhavan, S.; Kemmerling, E.M.C. The effect of inlet and outlet boundary conditions in image-based CFD modeling of aortic flow. Biomed. Eng. Online 2018, 17, 66. [Google Scholar] [CrossRef]
- Hardman, D.; Semple, S.I.; Richards, J.M.; Hoskins, P.R. Comparison of patient-specific inlet boundary conditions in the numerical modelling of blood flow in abdominal aortic aneurysm disease. Int. J. Numer. Methods Biomed. Eng. 2013, 29, 165–178. [Google Scholar] [CrossRef]
- Antonuccio, M.N.; Mariotti, A.; Fanni, B.M.; Capellini, K.; Capelli, C.; Sauvage, E.; Celi, S. Effects of uncertainty of outlet boundary conditions in a patient-specific case of aortic coarctation. Ann. Biomed. Eng. 2021, 49, 3494–3507. [Google Scholar] [CrossRef] [PubMed]
- Boumpouli, M.; Danton, M.H.; Gourlay, T.; Kazakidi, A. Blood flow simulations in the pulmonary bifurcation in relation to adult patients with repaired tetralogy of Fallot. Med. Eng. Phys. 2020, 85, 123–138. [Google Scholar] [CrossRef] [PubMed]
- Catanho, M.; Sinha, M.; Vijayan, V. Model of Aortic Blood Flow Using the Windkessel Effect; University of California of San Diago: San Diago, CA, USA, 2012. [Google Scholar]
- Westerhof, N.; Lankhaar, J.W.; Westerhof, B.E. The arterial windkessel. Med. Biol. Eng. Comput. 2009, 47, 131–141. [Google Scholar] [CrossRef]
- Wilson, N.M.; Ortiz, A.K.; Johnson, A.B. The vascular model repository: A public resource of medical imaging data and blood flow simulation results. J. Med. Devices 2013, 7, 040923. [Google Scholar] [CrossRef] [PubMed]
- Tang, B.T.; Fonte, T.A.; Chan, F.P.; Tsao, P.S.; Feinstein, J.A.; Taylor, C.A. Three-Dimensional Hemodynamics in the Human Pulmonary Arteries Under Resting and Exercise Conditions. Ann. Biomed. Eng. 2011, 39, 347–358. [Google Scholar] [CrossRef] [PubMed]
- Zambrano, B.A.; McLean, N.; Zhao, X.; Tan, J.L.; Zhong, L.; Figueroa, C.A.; Lee, L.C.; Baek, S. Patient-Specific Computational Analysis of Hemodynamics and Wall Mechanics and Their Interactions in Pulmonary Arterial Hypertension. Front. Bioeng. Biotechnol. 2020, 8, 611149. [Google Scholar] [CrossRef] [PubMed]
- Duronio, F.; Mascio, A.D. Blood Flow Simulation of Aneurysmatic and Sane Thoracic Aorta Using OpenFOAM CFD Software. Fluids 2023, 8, 272. [Google Scholar] [CrossRef]
- Duronio, F.; Di Mascio, A.; De Vita, A.; Innocenzi, V.; Prisciandaro, M. Eulerian–Lagrangian modeling of phase transition for application to cavitation-driven chemical processes. Phys. Fluids 2023, 35, 053305. [Google Scholar] [CrossRef]
- Dutta, H. Mathematical Methods in Engineering and Applied Sciences; CRC Press: Boca Raton, FL, USA, 2020. [Google Scholar]
- De Vita, M.; Duronio, F.; De Vita, A.; De Berardinis, P. Adaptive Retrofit for Adaptive Reuse: Converting an Industrial Chimney into a Ventilation Duct to Improve Internal Comfort in a Historic Environment. Sustainability 2022, 14, 3360. [Google Scholar] [CrossRef]
- Lee Waite, P.; Fine, J. Applied Biofluid Mechanics; The McGraw-Hill Medical Companies, Inc.: New York, NY, USA, 2007. [Google Scholar]
- Conijn, M.; Krings, G.J. Computational Analysis of the Pulmonary Arteries in Congenital Heart Disease: A Review of the Methods and Results. Comput. Math. Methods Med. 2021, 2021, 2618625. [Google Scholar] [CrossRef] [PubMed]
- Spalart, P.R.; Deck, S.; Shur, M.L.; Squires, K.D.; Strelets, M.K.; Travin, A. A new version of detached-eddy simulation, resistant to ambiguous grid densities. Theor. Comput. Fluid Dyn. 2006, 20, 181–195. [Google Scholar] [CrossRef]
- Lungu, A.; Wild, J.; Capener, D.; Kiely, D.; Swift, A.; Hose, D. MRI model-based non-invasive differential diagnosis in pulmonary hypertension. J. Biomech. 2014, 47, 2941–2947. [Google Scholar] [CrossRef] [PubMed]
- Kozitza, C.J.; Colebank, M.J.; Gonzalez-Pereira, J.P.; Chesler, N.C.; Lamers, L.; Roldán-Alzate, A.; Witzenburg, C.M. Estimating pulmonary arterial remodeling via an animal-specific computational model of pulmonary artery stenosis. Biomech. Model. Mechanobiol. 2024, 23, 1469–1490. [Google Scholar] [CrossRef] [PubMed]
- Capuano, F.; Loke, Y.H.; Balaras, E. Blood Flow Dynamics at the Pulmonary Artery Bifurcation. Fluids 2019, 4, 190. [Google Scholar] [CrossRef]
- Roache, P.J. Quantification of uncertainty in computational fluid dynamics. Annu. Rev. Fluid Mech. 1997, 29, 123–160. [Google Scholar] [CrossRef]
- Duronio, F.; Di Mascio, A. Implementation and assessment of a low-dissipative OpenFOAM solver for compressible multi-species flows. Comput. Fluids 2024, 274, 106240. [Google Scholar] [CrossRef]
- Roache, P.J. Fundamentals of Computational Fluid Dynamics; Hermosa Publishers: Socorro, Mexico, 1998. [Google Scholar]
- Di Mascio, A.; Dubbioso, G.; Muscari, R. Vortex structures in the wake of a marine propeller operating close to a free surface. J. Fluid Mech. 2022, 949, A33. [Google Scholar] [CrossRef]
- Pope, S.B. Turbulent flows. Meas. Sci. Technol. 2001, 12, 2020–2021. [Google Scholar] [CrossRef]
- Odagiri, K.; Inui, N.; Hakamata, A.; Inoue, Y.; Suda, T.; Takehara, Y.; Sakahara, H.; Sugiyama, M.; Alley, M.T.; Wakayama, T.; et al. Non-invasive evaluation of pulmonary arterial blood flow and wall shear stress in pulmonary arterial hypertension with 3D phase contrast magnetic resonance imaging. Springerplus 2016, 5, 1071. [Google Scholar] [CrossRef] [PubMed]
- Tang, B.T.; Pickard, S.S.; Chan, F.P.; Tsao, P.S.; Taylor, C.A.; Feinstein, J.A. Wall Shear Stress is Decreased in the Pulmonary Arteries of Patients with Pulmonary Arterial Hypertension: An Image-Based, Computational Fluid Dynamics Study. Pulm. Circ. 2012, 2, 470–476. [Google Scholar] [CrossRef] [PubMed]
- Sanz, J.; Kuschnir, P.; Rius, T.; Salguero, R.; Sulica, R.; Einstein, A.J.; Dellegrottaglie, S.; Fuster, V.; Rajagopalan, S.; Poon, M. Pulmonary arterial hypertension: Noninvasive detection with phase-contrast MR imaging. Radiology 2007, 243, 70–79. [Google Scholar] [CrossRef]
- Morgan, V.L.; Roselli, R.J.; Lorenz, C.H. Normal three-dimensional pulmonary artery flow determined by phase contrast magnetic resonance imaging. Ann. Biomed. Eng. 1998, 26, 557–566. [Google Scholar] [CrossRef] [PubMed]
- Parent, R.A. Comparative Biology of the Normal Lung; Academic Press: Cambridge, MA, USA, 2015. [Google Scholar]
- Reiter, U.; Reiter, G.; Kovacs, G.; Stalder, A.F.; Gulsun, M.A.; Greiser, A.; Olschewski, H.; Fuchsjäger, M. Evaluation of elevated mean pulmonary arterial pressure based on magnetic resonance 4D velocity mapping: Comparison of visualization techniques. PLoS ONE 2013, 8, e82212. [Google Scholar] [CrossRef] [PubMed]
- Laaban, J.P.; Diebold, B.; Zelinski, R.; Lafay, M.; Raffoul, H.; Rochemaure, J. Noninvasive Estimation of Systolic Pulmonary Artery Pressure Using Doppler Echocardiography in Patients with Chronic Obstructive Pulmonary Disease. Chest 1989, 96, 1258–1262. [Google Scholar] [CrossRef] [PubMed]
- Pillalamarri, N.R.; Piskin, S.; Patnaik, S.S.; Murali, S.; Finol, E.A. Patient-Specific Computational Analysis of Hemodynamics in Adult Pulmonary Hypertension. Ann. Biomed. Eng. 2021, 49, 3465–3480. [Google Scholar] [CrossRef] [PubMed]


Disclaimer/Publisher’s Note: The statements, opinions and data contained in all publications are solely those of the individual author(s) and contributor(s) and not of MDPI and/or the editor(s). MDPI and/or the editor(s) disclaim responsibility for any injury to people or property resulting from any ideas, methods, instructions or products referred to in the content. |
© 2024 by the authors. Licensee MDPI, Basel, Switzerland. This article is an open access article distributed under the terms and conditions of the Creative Commons Attribution (CC BY) license (https://creativecommons.org/licenses/by/4.0/).