

Exploring Potential of Gellan Gum for Enhanced Oil Recovery


 ,
, 
Abstract
:
1. Introduction
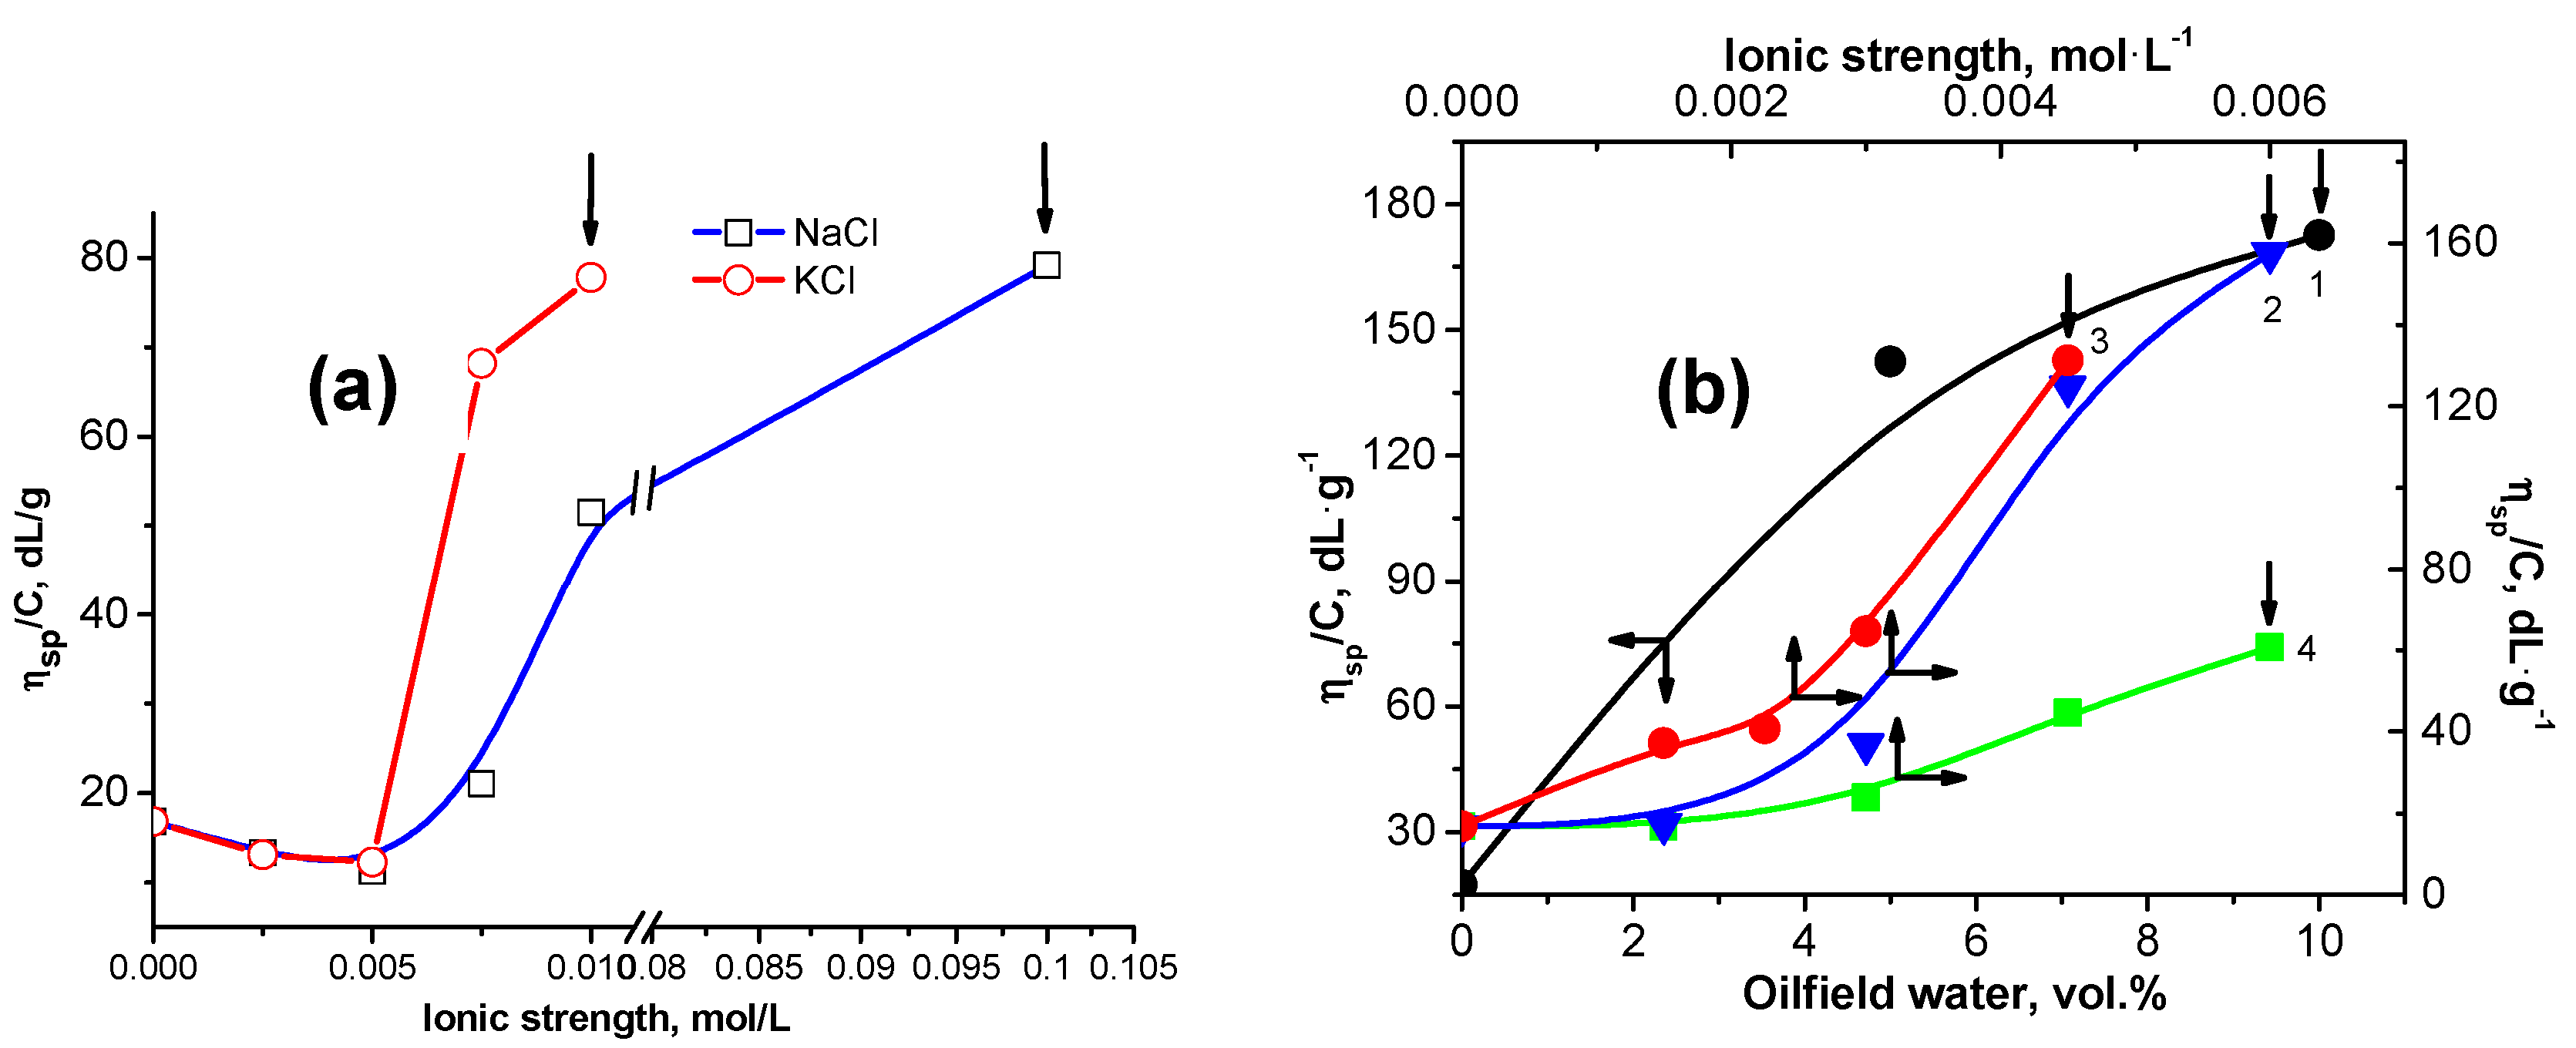
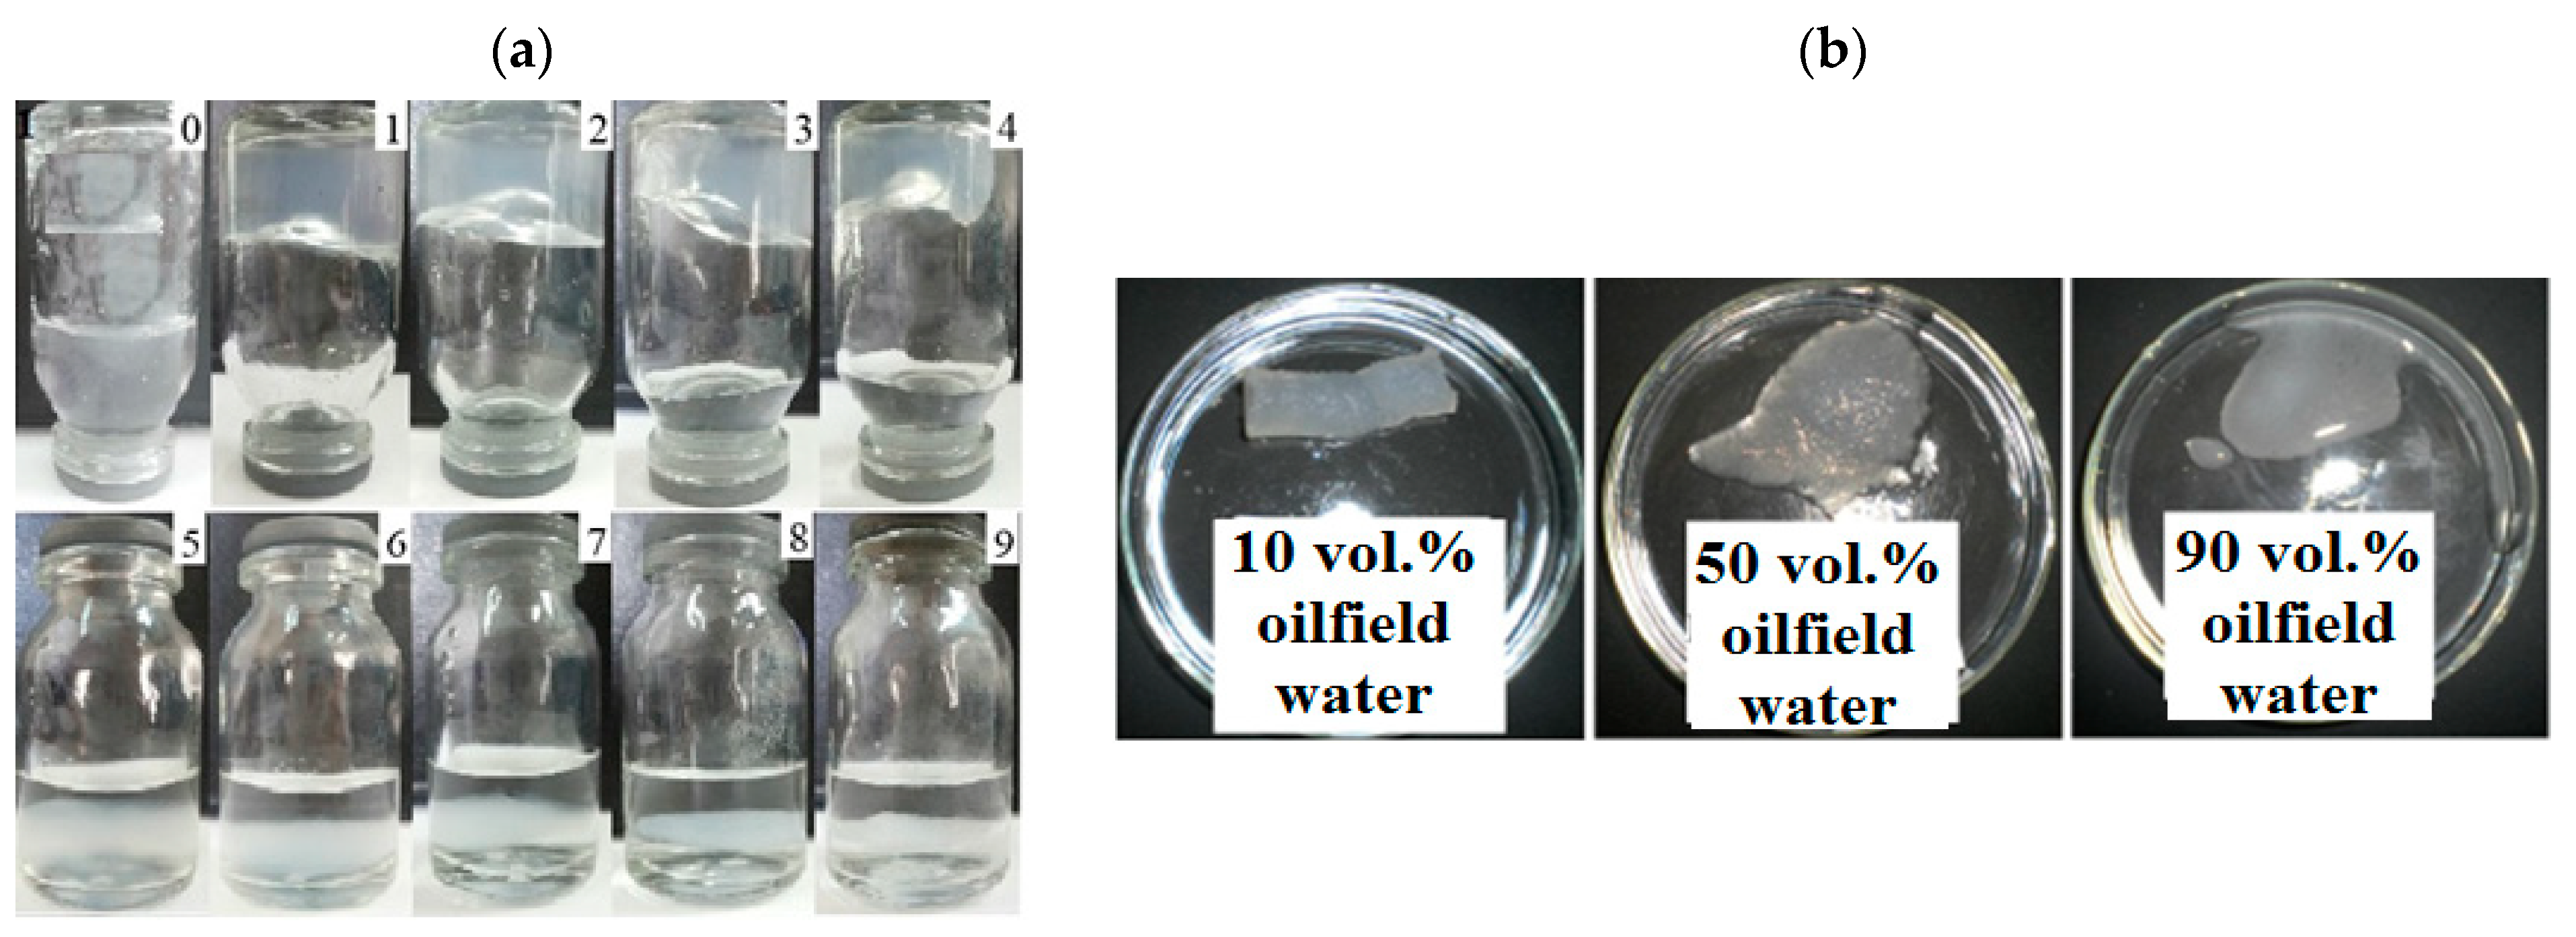
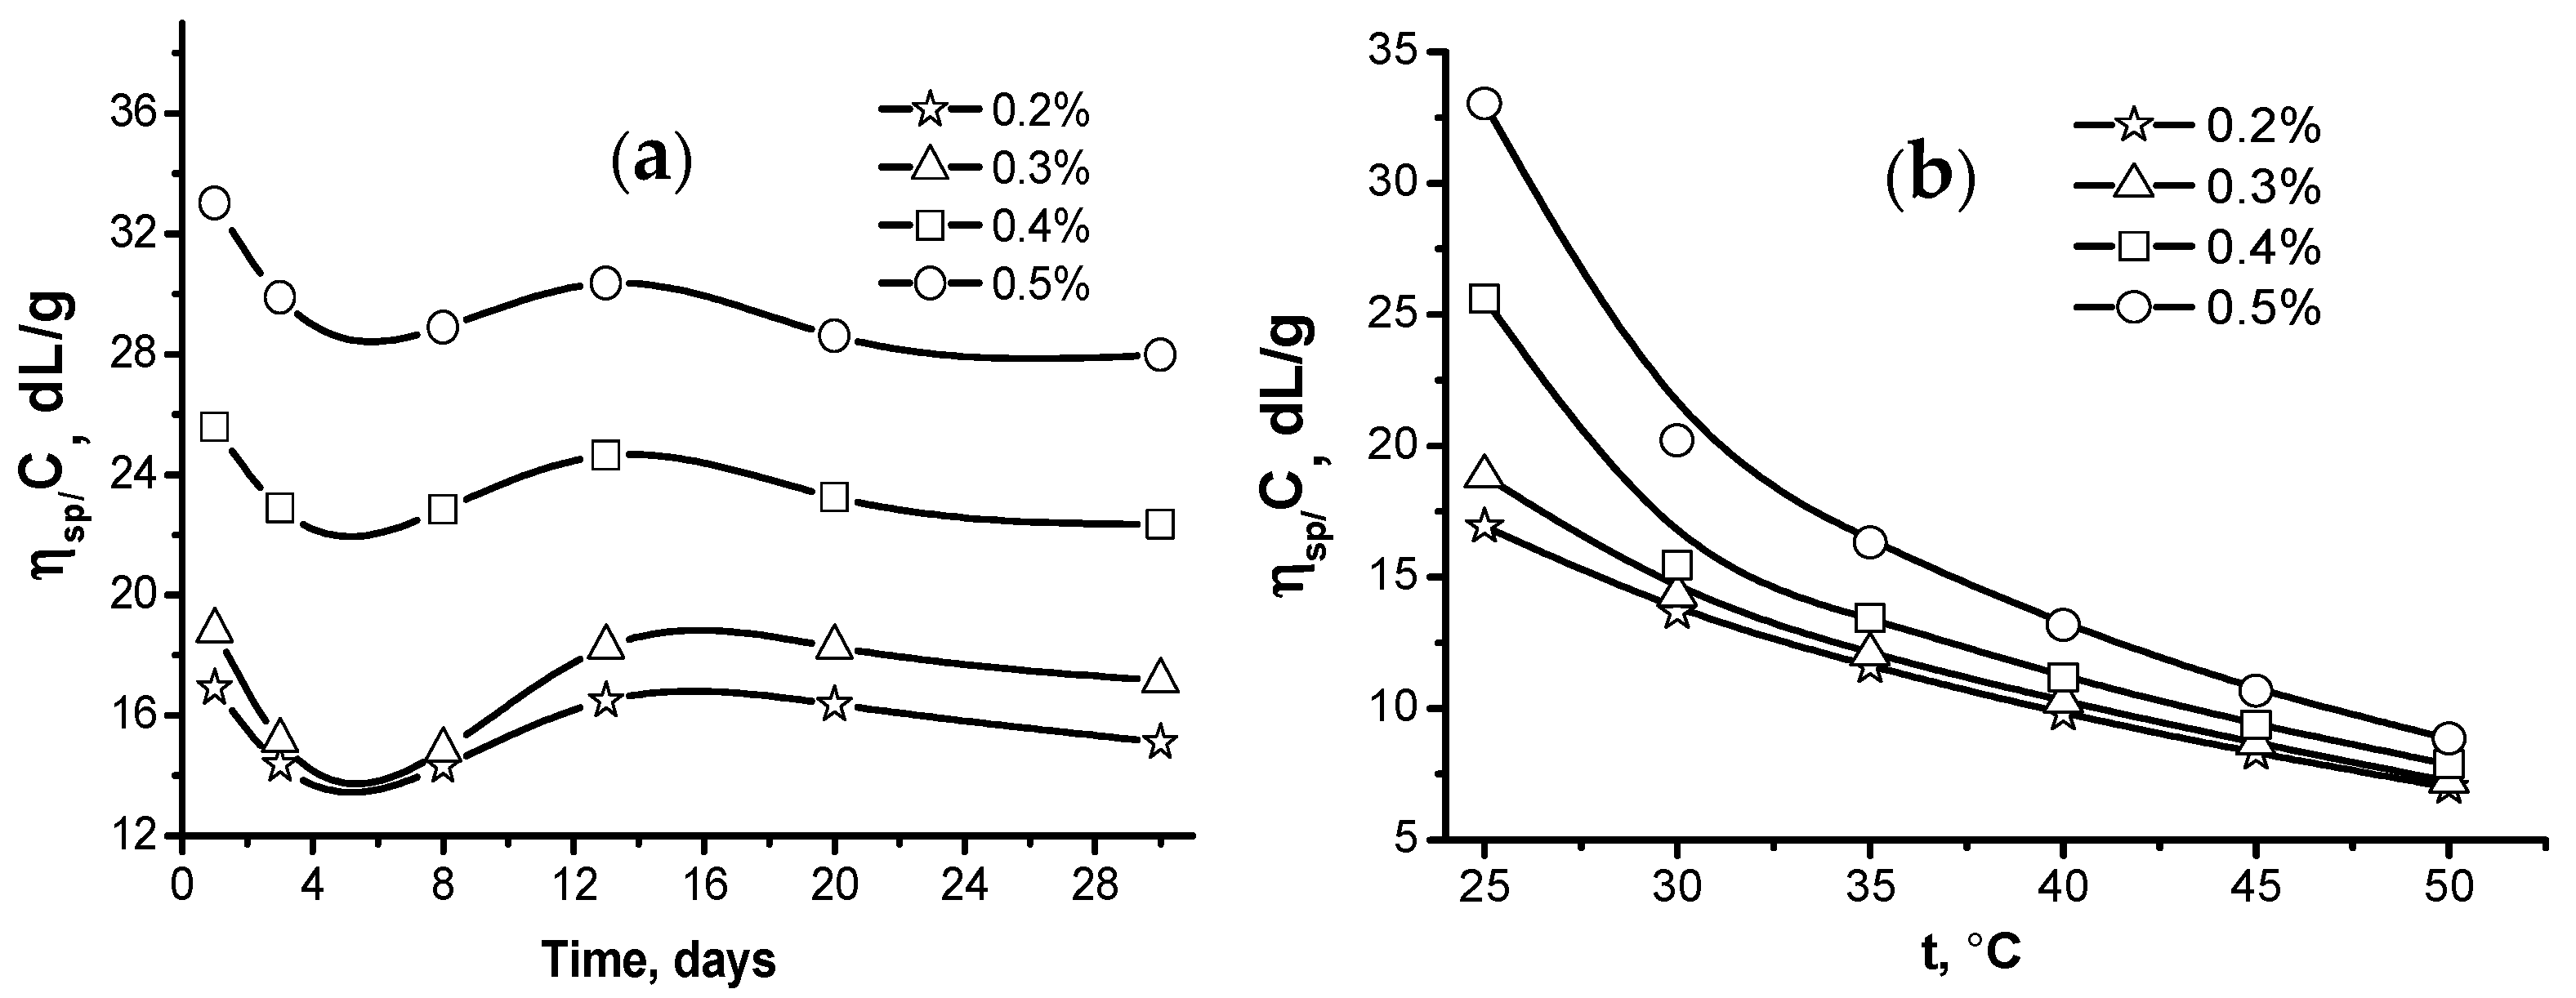
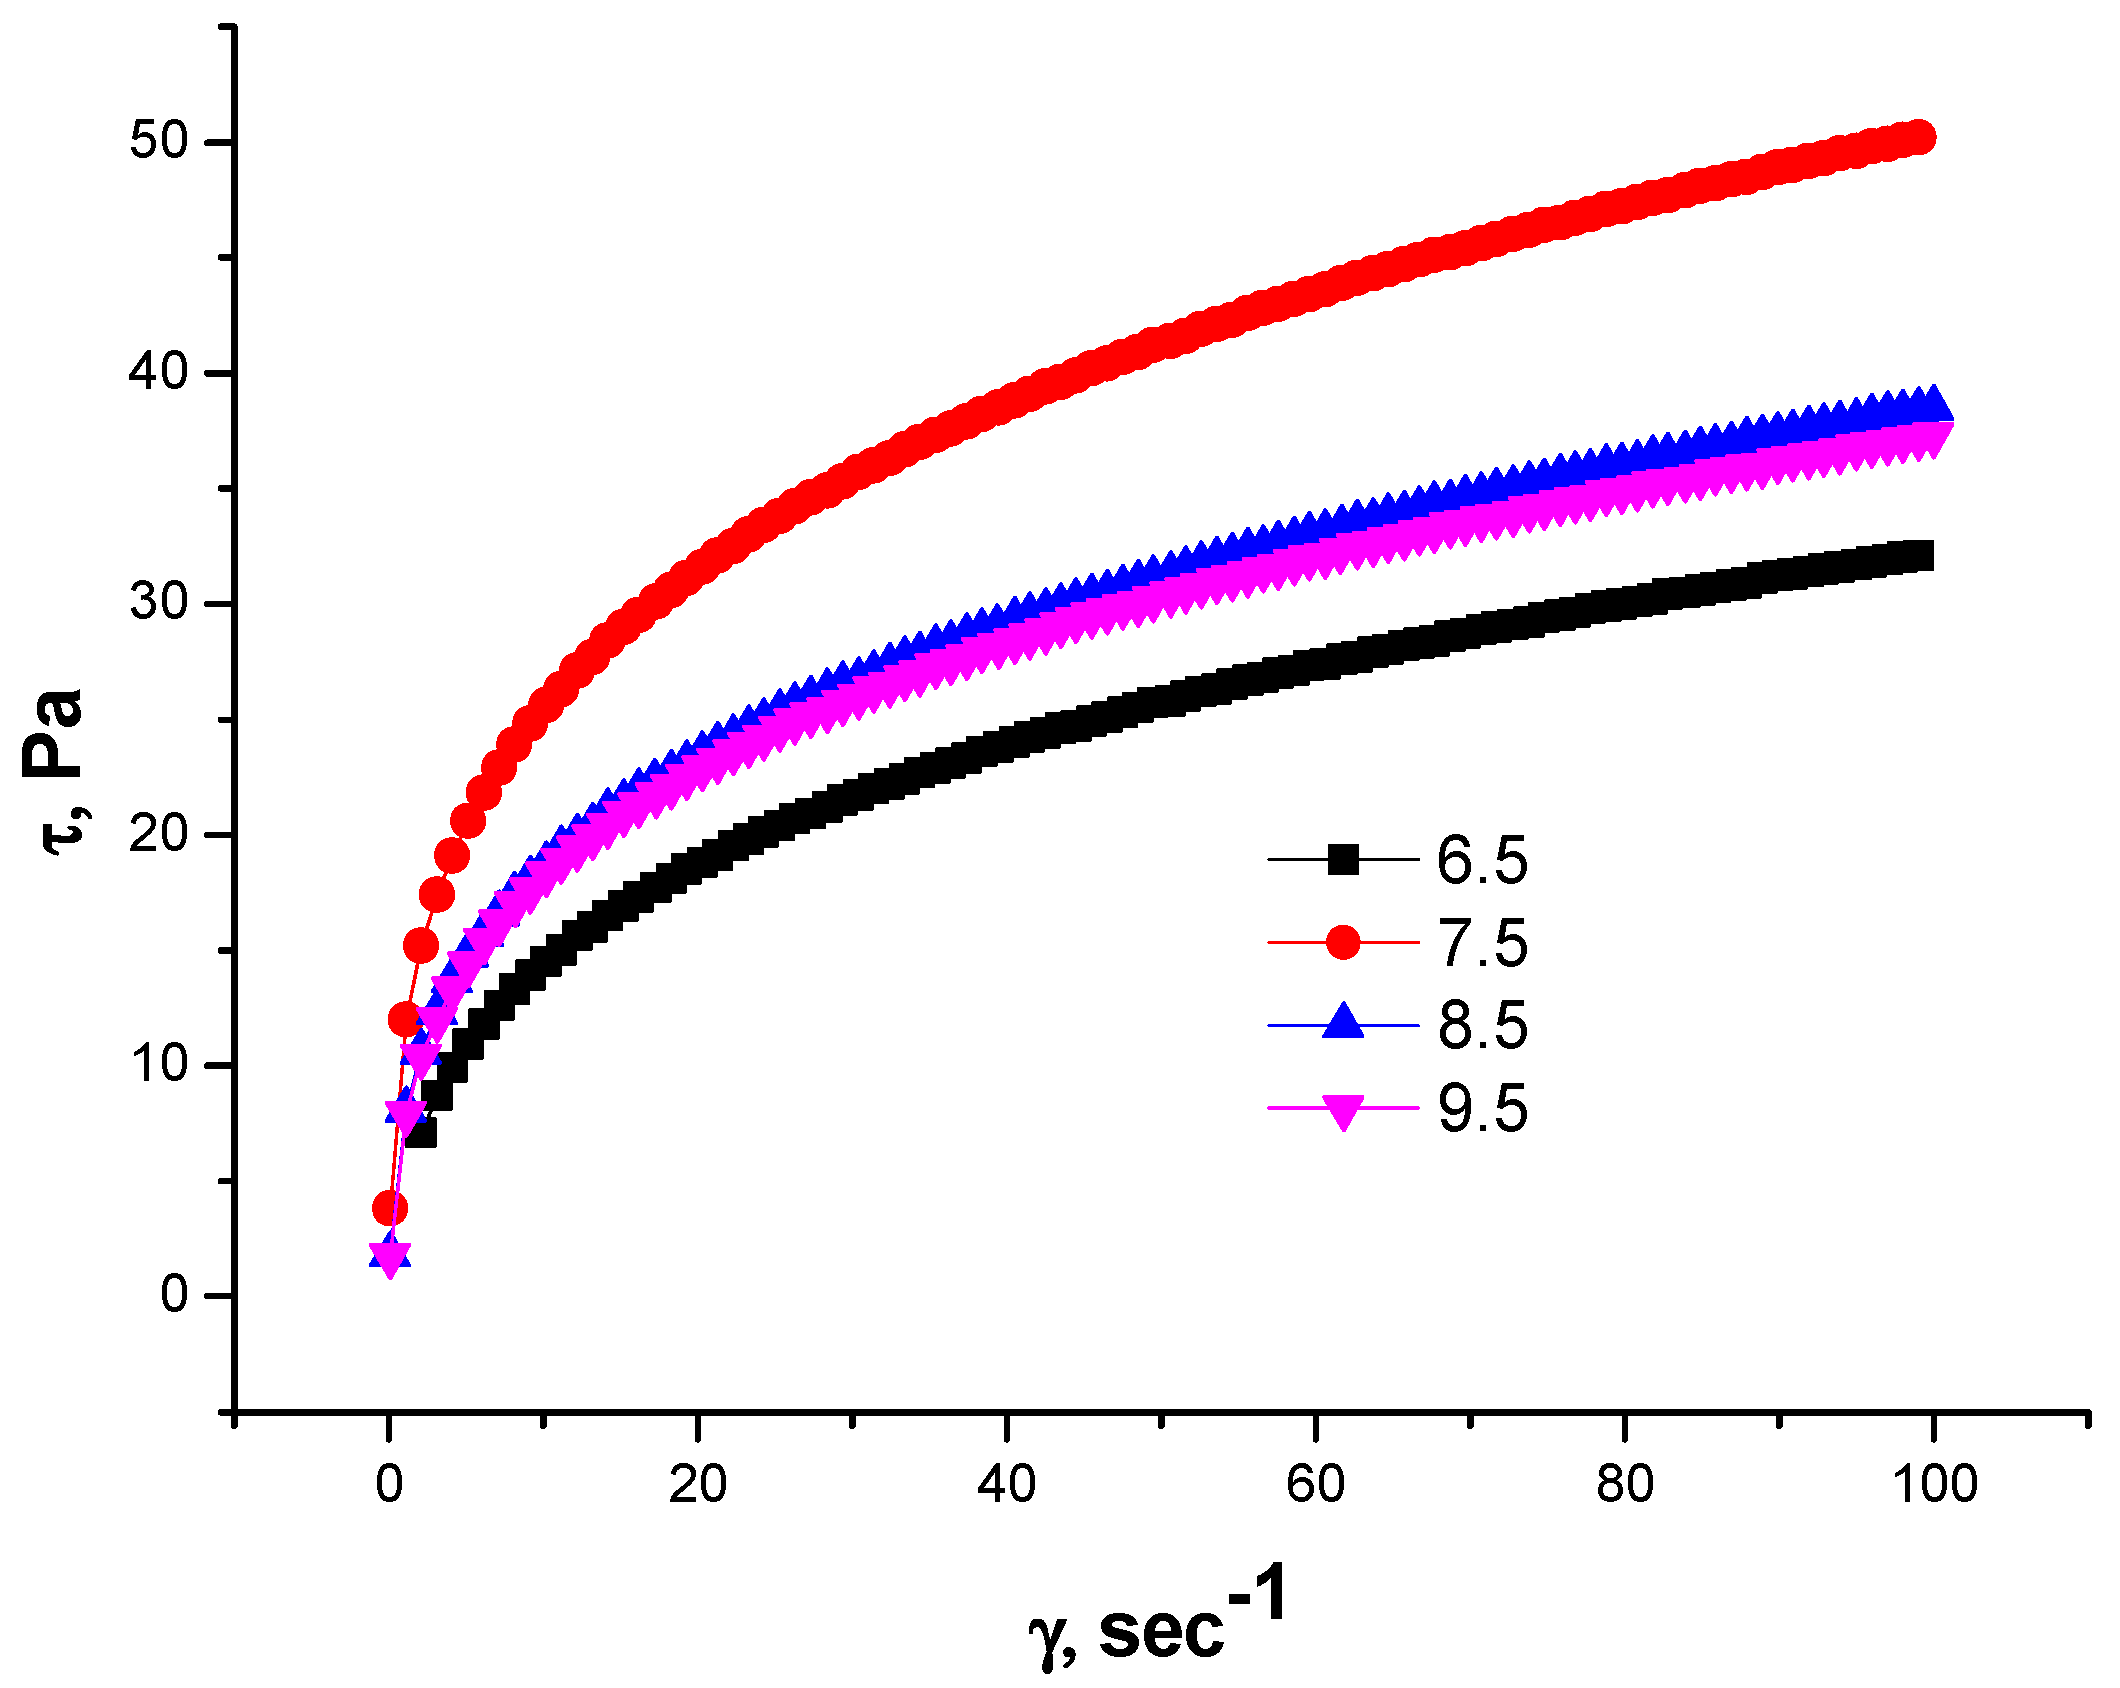
2. Conformational and Phase Behaviors of Gellan Gum in Aqueous-Salt Solutions and Oilfield Saline Water
3. Plugging Behavior of Gellan Gum in Laboratory Experiments
- 1-
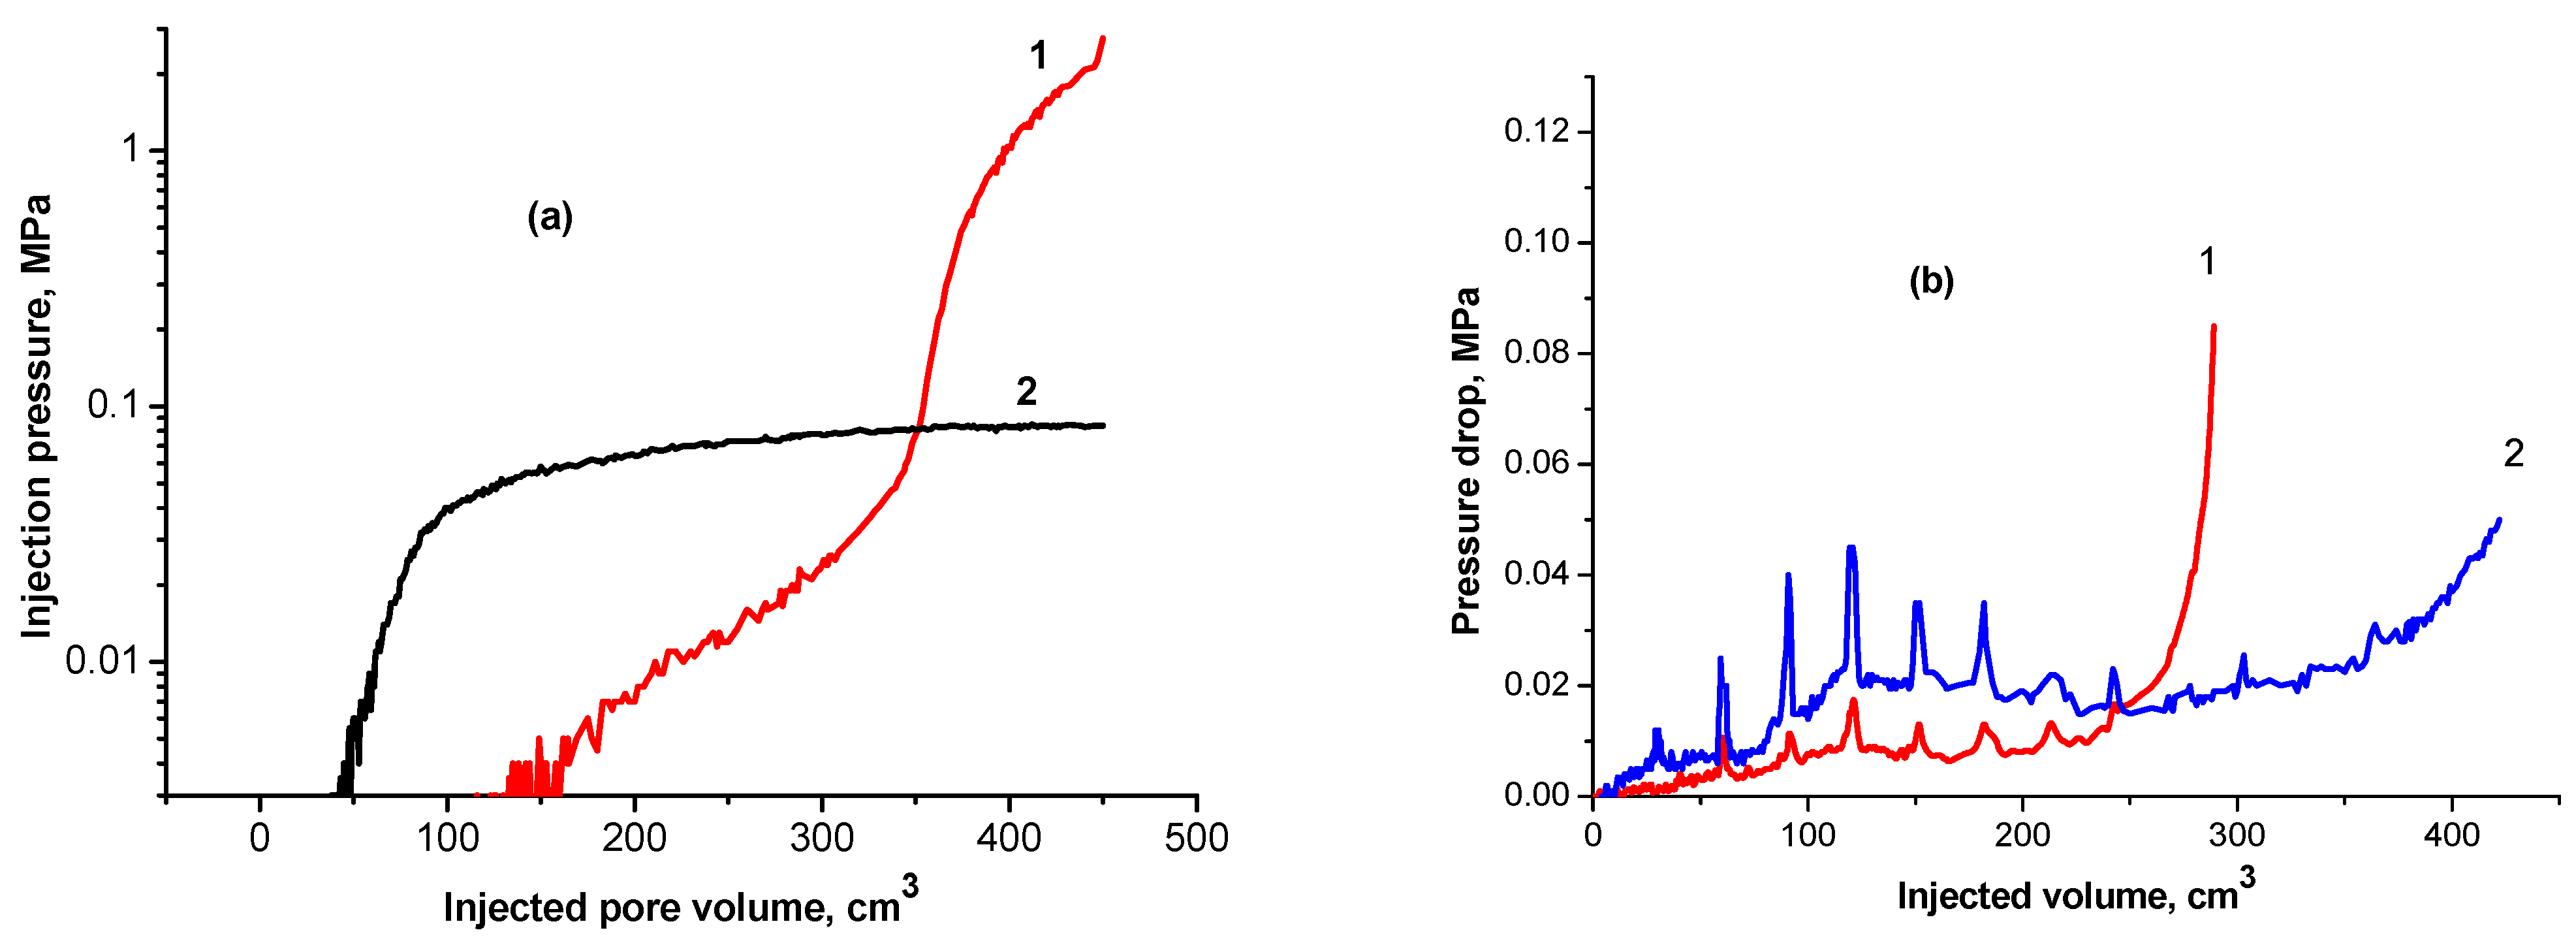
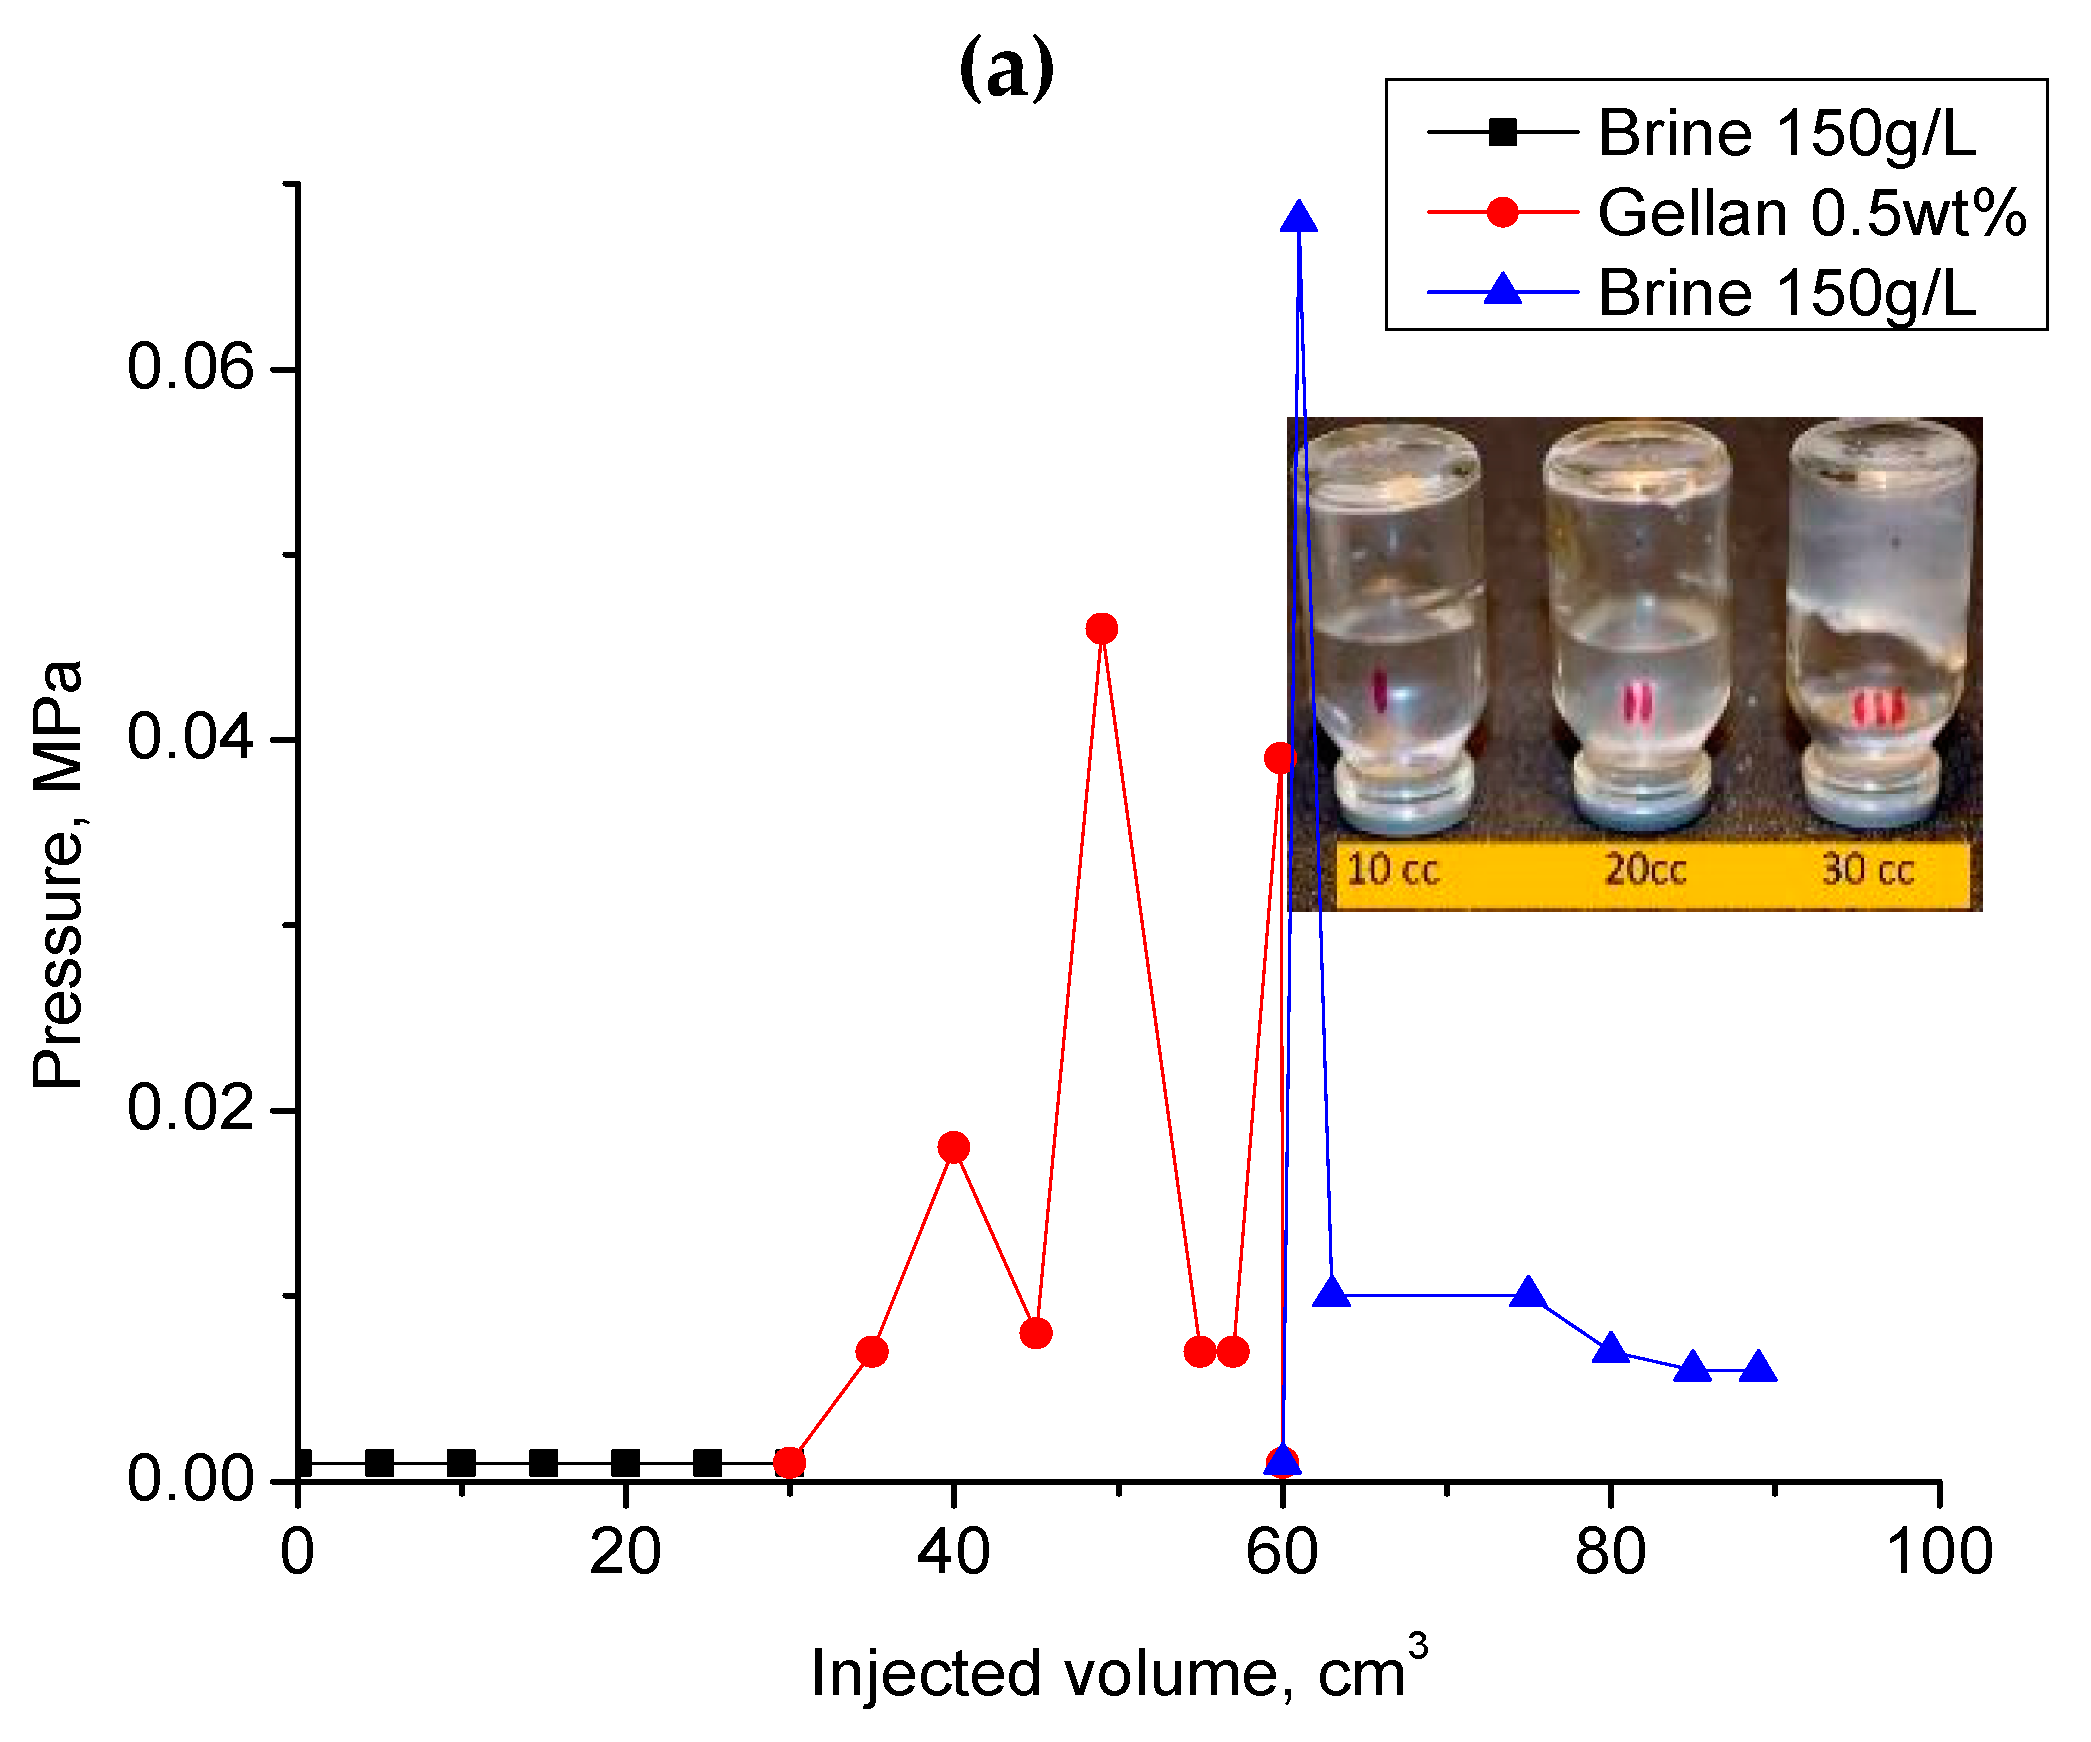
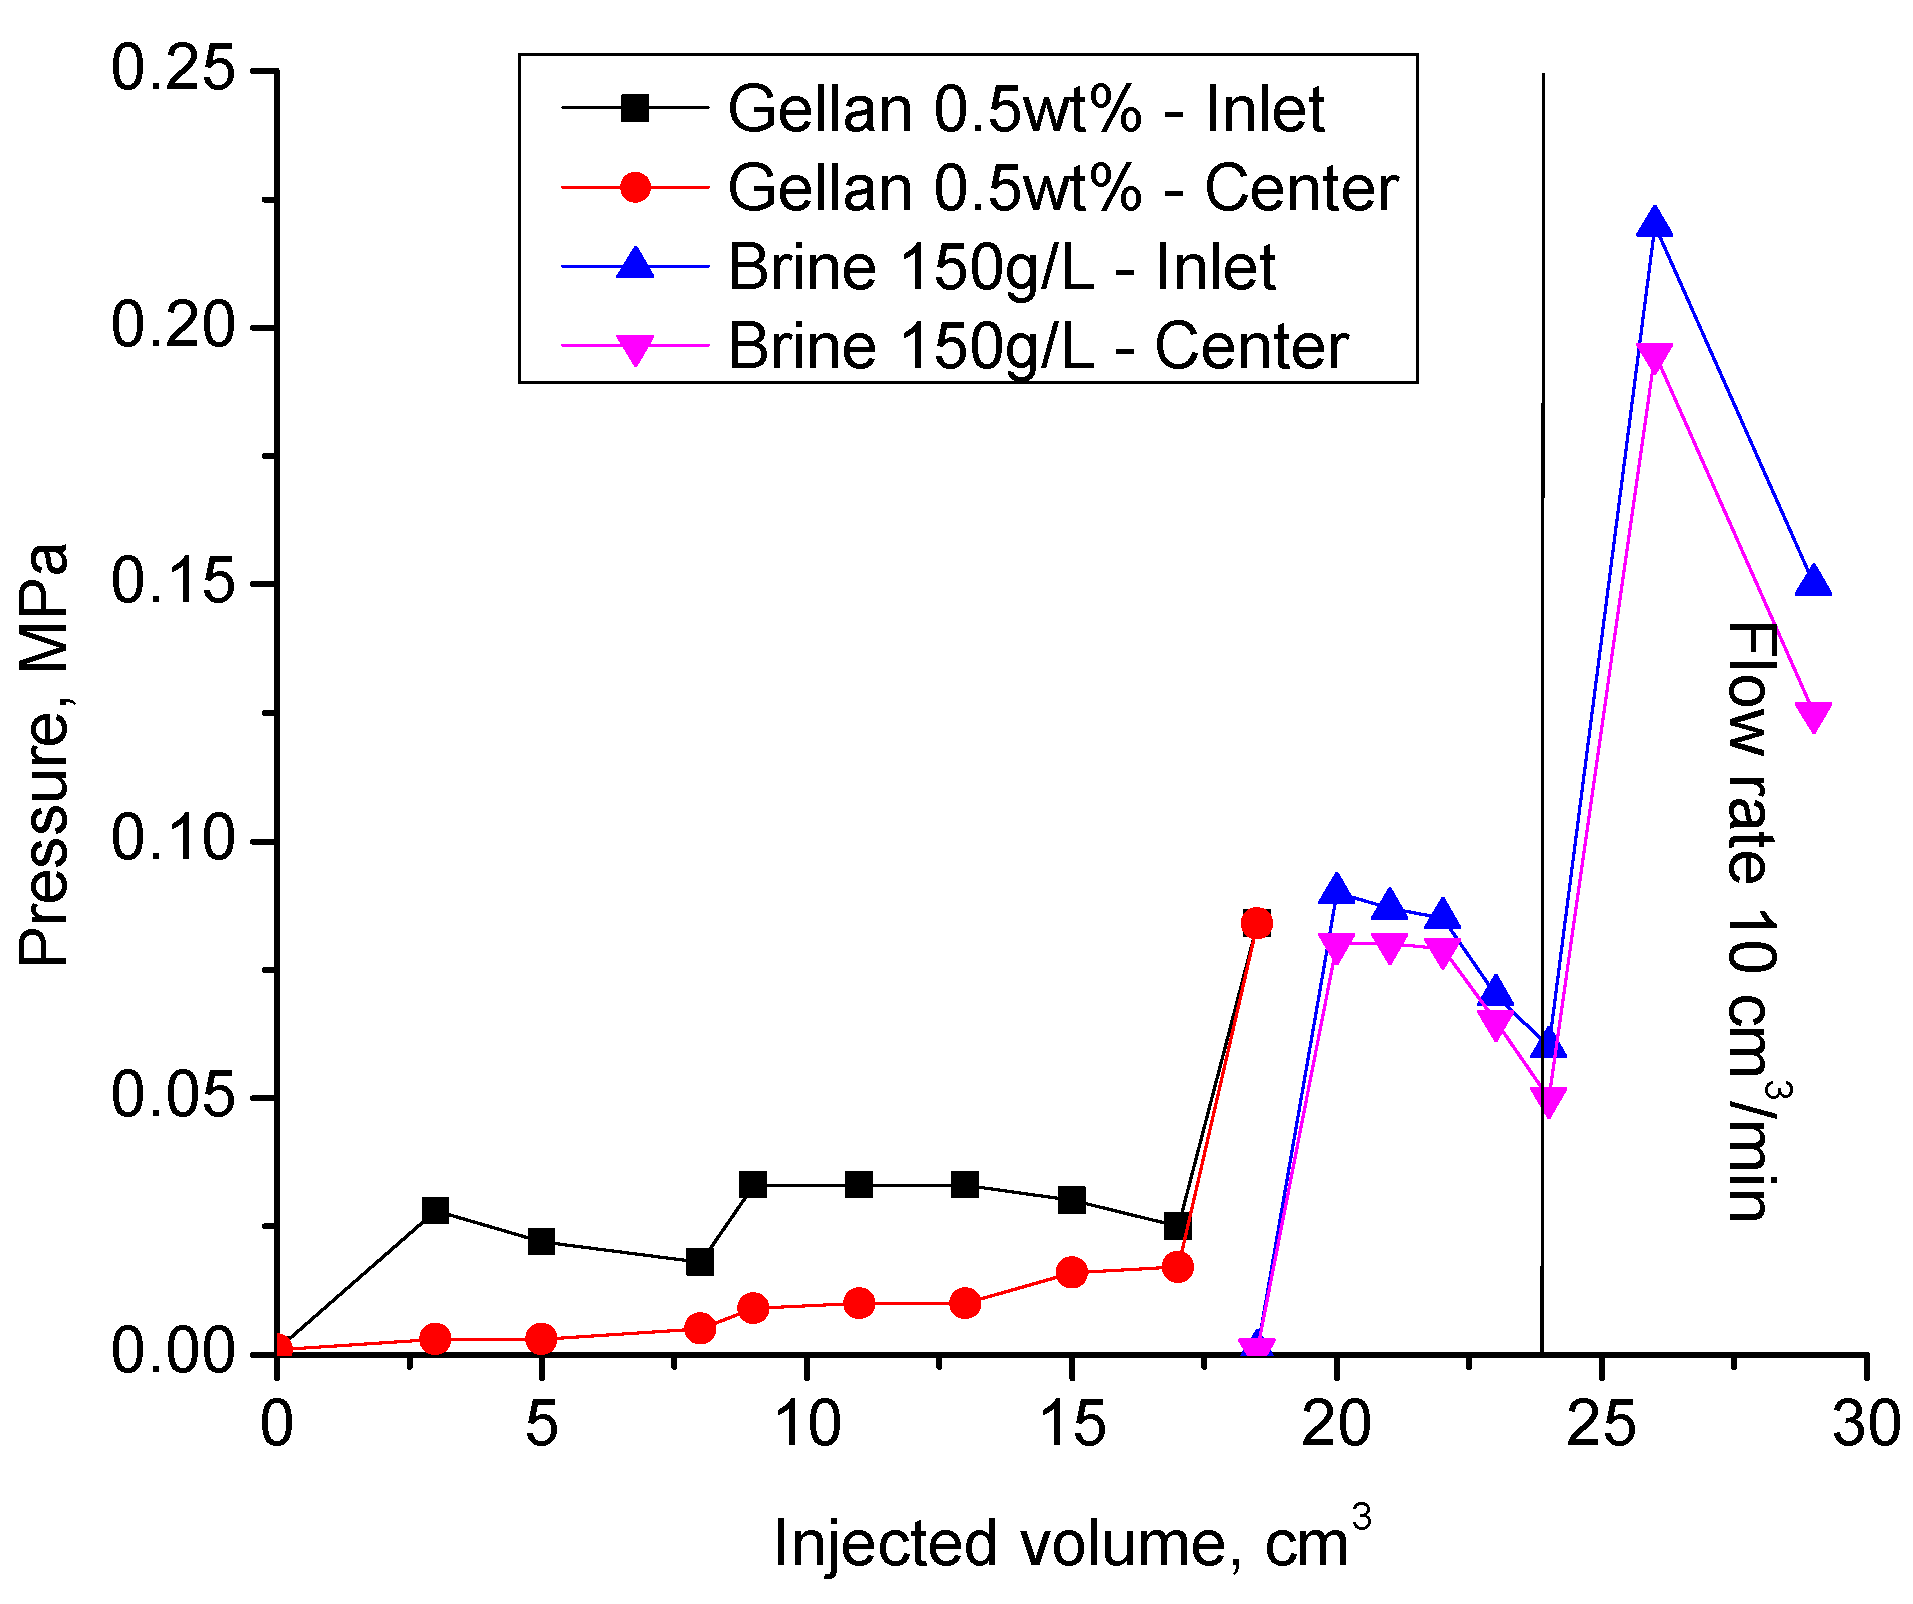
- Gradual plugging due to the entrapment of particulate gel particles found in the gellan gum solution [55].
- 2-
- Instant gel formation as a result of gellan gum solution in contact with cations found in the brine saturating the porous rock or injected as a post-flush following the gellan gum slug [56].
- 1-
- Polymer extrusion occurring from the fracture interfaces into the matrix in the process of injection;
- 2-
- Slumping of the low viscosity (compared to gel) polymer solution due to the gravity of the lower part of the fracture.
4. Treatment of Injection and Production Wells by Gellan Gum
4.1. Injection Well Treatment
4.2. Production Well Treatment
5. Challenges and Opportunities of Gellan Gum Application in Field Conditions
- 1-
- The crosslinking chemicals are not needed;
- 2-
- High gel strength in high brine salinity conditions;
- 3-
- A relatively low dissolution time (30 min) is required.
- 1-
- The reagent should be dissolved in fresh water (no more than 1 g/L);
- 2-
- High price (8–20 USD per 1 kg);
- 3-
- Cannot be used for polymer flooding due to the presence of microgel particles in the solution.
- 1-
- Low price (2.5–4 USD per 1 kg);
- 2-
- The high elasticity of gels allows for injection of large volumes at an acceptable pressure;
- 3-
- Can be used for polymer flooding.
- 1-
- The crosslinking chemicals are needed;
- 2-
- The gel is not stable upon contact with high-salinity water;
- 3-
- High polymer adsorption in carbonate rocks;
- 4-
- Relatively high dissolution time is required (2–3 h).
6. Economical Feasibility of Gellan Gum in EOR over Other Technologies
7. The Potential for Gellan Production in Kazakhstan
8. The Use of Gellan Gum in Food Industry, Biotechnology, and Medicine
9. Conclusions
Author Contributions
Funding
Institutional Review Board Statement
Informed Consent Statement
Data Availability Statement
Conflicts of Interest
References
- Pu, W.; Shen, C.; Wei, B.; Yang, Y.; Li, Y. A Comprehensive Review of Polysaccharide Biopolymers for Enhanced Oil Recovery (EOR) from Flask to Field. J. Ind. Eng. Chem. 2018, 61, 1–11. [Google Scholar] [CrossRef]
- Xia, S.; Zhang, L.; Davletshin, A.; Li, Z.; You, J.; Tan, S. Application of Polysaccharide Biopolymer in Petroleum Recovery. Polymers 2020, 12, 1860. [Google Scholar] [CrossRef] [PubMed]
- Avery, M.R.; Burkholder, L.A.; Gruenenfelder, M.A. Use of Crosslinked Xanthan Gels in Actual Profile Modification Field Projects. In Proceedings of the International Meeting on Petroleum Engineering, Beijing, China, 17–20 March 1986; Society of Petroleum Engineers: Richardson, TX, USA, 1986. [Google Scholar]
- Nagra, S.S.; Batycky, J.P.; Nieman, R.E.; Bodeux, J.B. Stability of Waterflood Diverting Agents at Elevated Temperatures in Reservoir Brines. In Proceedings of the SPE Annual Technical Conference and Exhibition, New Orleans, LA, USA, 5–8 October 1986; Society of Petroleum Engineers: Richardson, TX, USA, 1986. [Google Scholar]
- Audibert, A.; Noik, C.; Lecourtier, J. Behaviour of Polysaccharides under Harsh Conditions. J. Can. Pet. Technol. 1993, 32, PETSOC-93-07-05. [Google Scholar] [CrossRef]
- Ghannam, M.; Abu-Jdayil, B.; Esmail, N. Flow Behavior Comparison of Xanthan and Alcoflood Polymers Aqueous Solutions. Am. J. Oil Chem. Technol. 2013, 1, 1–11. [Google Scholar] [CrossRef]
- Mothé, C.G.; Correia, D.Z.; de França, F.P.; Riga, A.T. Thermal and Rheological Study of Polysaccharides for Enhanced Oil Recovery. J. Therm. Anal. Calorim. 2006, 85, 31–36. [Google Scholar] [CrossRef]
- Shibaev, A.V.; Muravlev, D.A.; Muravleva, A.K.; Matveev, V.V.; Chalykh, A.E.; Philippova, O.E. PH-Dependent Gelation of a Stiff Anionic Polysaccharide in the Presence of Metal Ions. Polymers 2020, 12, 868. [Google Scholar] [CrossRef] [PubMed]
- Li, Y.; Xu, L.; Gong, H.; Ding, B.; Dong, M.; Li, Y. A Microbial Exopolysaccharide Produced by Sphingomonas Species for Enhanced Heavy Oil Recovery at High Temperature and High Salinity. Energy Fuels 2017, 31, 3960–3969. [Google Scholar] [CrossRef]
- Seright, R.S.; Henrlcl, B.J. Xanthan Stability at Elevated Temperatures. SPE Reserv. Eng. 1990, 5, 52–60. [Google Scholar] [CrossRef]
- Elsaeed, S.M.; Zaki, E.G.; Omar, W.A.E.; Ashraf Soliman, A.; Attia, A.M. Guar Gum-Based Hydrogels as Potent Green Polymers for Enhanced Oil Recovery in High-Salinity Reservoirs. ACS Omega 2021, 6, 23421–23431. [Google Scholar] [CrossRef]
- Musa, T.A.; Ibrahim, A.F.; Nasr-El-Din, H.A.; Hassan, A.M. New insights into guar gum as environmentally friendly polymer for enhanced oil recovery in high-salinity and high-temperature sandstone reservoirs. J. Pet. Explor. Prod. Technol. 2021, 11, 1905–1913. [Google Scholar] [CrossRef]
- Kalpakci, B.; Jeans, Y.T.; Magri, N.F.; Padolewski, J.P. Thermal Stability of Scleroglucan at Realistic Reservoir Conditions. In Proceedings of the SPE/DOE Enhanced Oil Recovery Symposium, Tulsa, OK, USA, 22–25 April 1990. [Google Scholar]
- Xu, L.; Xu, G.; Yu, L.; Gong, H.; Dong, M.; Li, Y. The Displacement Efficiency and Rheology of Welan Gum for Enhanced Heavy Oil Recovery. Polym. Adv. Technol. 2014, 25, 1122–1129. [Google Scholar] [CrossRef]
- Combariza, M.Y.; Martínez-Ramírez, A.P.; Blanco-Tirado, C. Perspectives in Nanocellulose for Crude Oil Recovery: A Minireview. Energy Fuels 2021, 35, 15381–15397. [Google Scholar] [CrossRef]
- Kjøniksen, A.-L.; Beheshti, N.; Kotlar, H.K.; Zhu, K.; Nyström, B. Modified Polysaccharides for Use in Enhanced Oil Recovery Applications. Eur. Polym. J. 2008, 44, 959–967. [Google Scholar] [CrossRef]
- Cao, W.; Xie, K.; Wang, X.; Lu, X.; He, X.; Xu, G.; Li, X. Starch Graft Copolymer and Polymer Gel Applied in Bohai Oilfield for Water Plugging and Profile Control and Their Mechanisms. Geosyst. Eng. 2020, 23, 197–204. [Google Scholar] [CrossRef]
- Elshafie, A.; Joshi, S.J.; Al-Wahaibi, Y.M.; Al-Bahry, S.N.; Al-Bemani, A.S.; Al-Hashmi, A.; Al-Mandhari, M.S. Isolation and Characterization of Biopolymer Producing Omani Aureobasidium Pullulans Strains and Its Potential Applications in Microbial Enhanced Oil Recovery. In Proceedings of the SPE Oil and Gas India Conference and Exhibition, Mumbai, India, 4–6 April 2017. [Google Scholar]
- Lai, N.; Wen, Y.; Yang, Z.; Chen, J.; Zhao, X.; Wang, D.; He, W.; Chen, Y. Polymer flooding in high-temperature and high-salinity heterogeneous reservoir by using diutan gum. J. Pet. Sci. Eng. 2020, 188, 106902. [Google Scholar] [CrossRef]
- Ridout, M.J.; Garza, S.; Brownsey, G.J.; Morris, V.J. Mixed Iota-Kappa Carrageenan Gels. Int. J. Biol. Macromol. 1996, 18, 5–8. [Google Scholar] [CrossRef] [PubMed]
- Iglauer, S.; Wu, Y.; Shuler, P.; Tang, Y.; Goddard, W.A. Dilute Iota- and Kappa-Carrageenan Solutions with High Viscosities in High Salinity Brines. J. Pet. Sci. Eng. 2011, 75, 304–311. [Google Scholar] [CrossRef]
- Sharifpour, E.; Escrochi, M.; Riazi, M.; Ayatollahi, S. On the Importance of Gel Rigidity and Coverage in a Smart Water Shutoff Treatment in Gas Wells. J. Nat. Gas. Sci. Eng. 2016, 31, 808–818. [Google Scholar] [CrossRef]
- Gao, C.H. Unique Rheology of High Acyl Gellan Gum and Its Potential Applications in Enhancement of Petroleum Production. J. Pet. Explor. Prod. Technol. 2016, 6, 743–747. [Google Scholar] [CrossRef]
- Liang, K.; Han, P.; Chen, Q.; Su, X.; Feng, Y. Comparative Study on Enhancing Oil Recovery under High Temperature and High Salinity: Polysaccharides Versus Synthetic Polymer. ACS Omega 2019, 4, 10620–10628. [Google Scholar] [CrossRef]
- Xu, L.; Dong, M.; Gong, H.; Sun, M.; Li, Y. Effects of Inorganic Cations on the Rheology of Aqueous Welan, Xanthan, Gellan Solutions and Their Mixtures. Carbohydr. Polym. 2015, 121, 147–154. [Google Scholar] [CrossRef] [PubMed]
- Kamal, M.S.; Sultan, A.S.; Al-Mubaiyedh, U.A.; Hussein, I.A. Review on Polymer Flooding: Rheology, Adsorption, Stability, and Field Applications of Various Polymer Systems. Polym. Rev. 2015, 55, 491–530. [Google Scholar] [CrossRef]
- Han, D.-K.; Yang, C.-Z.; Zhang, Z.-Q.; Lou, Z.-H.; Chang, Y.-I. Recent development of enhanced oil recovery in China. J. Pet. Sci. Eng. 1999, 22, 181–188. [Google Scholar] [CrossRef]
- Akstinat, M.H. Polymers for enhanced oil recovery in reservoirs of extremely high salinities and high temperatures. In Proceedings of the SPE International Symposium on Oil field and Geothermal Chemistry, Stanford, CA, USA, 28−30 May 1980. [Google Scholar]
- Rivenq, R.C.; Donche, A.; Nolk, C. Improved scleroglucan for polymer flooding under harsh reservoir conditions. SPE Reserv. Eng. 1992, 7, 15–20. [Google Scholar] [CrossRef]
- Davison, P.; Mentzer, E. Polymer flooding in North Sea reservoirs. SPE J. 1982, 22, 353–362. [Google Scholar] [CrossRef]
- Levitt, D.; Pope, G.A. Selection and screening of polymers for enhanced oil recovery. In Proceedings of the SPE/DOE Improved Oil Recovery Symposium, Tulsa, OK, USA, 20–23 April 2008. [Google Scholar]
- Ryles, R.G. Chemical stability limits of water-soluble polymers used in oil recovery processes. SPE Reserv. Eng. 1988, 3, 23–34. [Google Scholar] [CrossRef]
- Morris, E.R.; Nishinari, K.; Rinaudo, M. Gelation of Gellan—A Review. Food Hydrocoll. 2012, 28, 373–411. [Google Scholar] [CrossRef]
- Grasdalen, H.; Smidsrød, O. Gelation of Gellan Gum. Carbohydr. Polym. 1987, 7, 371–393. [Google Scholar] [CrossRef]
- Dreveton, E.; Monot, F.; Lecourtier, J.; Ballerini, D.; Choplin, L. Influence of Fermentation Hydrodynamics on Gellan Gum Physico-Chemical Characteristics. J. Ferment. Bioeng. 1996, 82, 272–276. [Google Scholar] [CrossRef]
- Ogawa, E. Conformational Transition of Polysaccharide Sodium-Gellan Gum in Aqueous Solutions. Macromolecules 1996, 29, 5178–5182. [Google Scholar] [CrossRef]
- Ogawa, E.; Takahashi, R.; Yajima, H.; Nishinari, K. Effects of Molar Mass on the Coil to Helix Transition of Sodium-Type Gellan Gums in Aqueous Solutions. Food Hydrocoll. 2006, 20, 378–385. [Google Scholar] [CrossRef]
- Ogawa, E.; Matsuzawa, H.; Iwahashi, M. Conformational Transition of Gellan Gum of Sodium, Lithium, and Potassium Types in Aqueous Solutions. Food Hydrocoll. 2002, 16, 1–9. [Google Scholar] [CrossRef]
- Matsukawa, S.; Huang, Z.; Watanabe, T. Structural Change of Polymer Chains of Gellan Monitored by Circular Dichroism. In Physical Chemistry and Industrial Application of Gellan Gum; Springer: Berlin/Heidelberg, Germany, 1999; pp. 92–97. [Google Scholar]
- Miyoshi, E.; Nishinari, K. Rheological and Thermal Properties near the Sol-Gel Transition of Gellan Gum Aqueous Solutions. In Physical Chemistry and Industrial Application of Gellan Gum; Springer: Berlin/Heidelberg, Germany, 1999; pp. 68–82. [Google Scholar]
- Atkin, N.; Abeysekera, R.M.; Kronestedt-Robards, E.C.; Robards, A.W. Direct Visualization of Changes in Deacylated Na(+) Gellan Polymer Morphology during the Sol-Gel Transition. Biopolymers 2000, 54, 195–210. [Google Scholar] [CrossRef] [PubMed]
- Gunning, A.P.; Kirby, A.R.; Ridout, M.J.; Brownsey, G.J.; Morris, V.J. Investigation of Gellan Networks and Gels by Atomic Force Microscopy. Macromolecules 1996, 29, 6791–6796. [Google Scholar] [CrossRef]
- Nitta, Y.; Takahashi, R.; Nishinari, K. Viscoelasticity and Phase Separation of Aqueous Na-Type Gellan Solution. Biomacromolecules 2010, 11, 187–191. [Google Scholar] [CrossRef] [PubMed]
- Dai, L.; Liu, X.; Tong, Z. Critical Behavior at Sol–Gel Transition in Gellan Gum Aqueous Solutions with KCl and CaCl2 of Different Concentrations. Carbohydr. Polym. 2010, 81, 207–212. [Google Scholar] [CrossRef]
- Nurakhmetova, Z.; Gussenov, I.; Tatykhanova, G.; Kudaibergenov, S. Behavior of Gellan in Aqueous-Salt Solutions and Oilfield Saline Water. Chem. Bull. Kazakh Natl. Univ. 2015, 79, 34–40. [Google Scholar] [CrossRef]
- Kudaibergenov, S.E.; Tatykhanova, G.S.; Sigitov, V.B.; Nurakhmetova, Z.A.; Blagikh, E.V.; Gussenov, I.S.; Seilkhanov, T.M. Physico-Chemical and Rheological Properties of Gellan in Aqueous-Salt Solutions and Oilfield Saline Water. Macromol. Symp. 2016, 363, 20–35. [Google Scholar] [CrossRef]
- Gussenov, I.; Zhappasbayev, B.; Kudabergenov, S.; Akhmedzhanov, T.K. Permeability Reduction of Heterogeneous Oil Reservoirs by Brine-Triggered Gellan Gel. J. Nanosci. Nanotechnol. 2017, 17, 9198–9202. [Google Scholar] [CrossRef]
- Nurakhmetova, Z.; Gussenov, I.; Aseyev, V.; Sigitov, V.; Kudaibergenov, S. Application of Sol-Gel Transition of Gellan and Xanthan for Enhanced Oil Recovery and as Drilling Fluids. J. Chem. Technol. Metal. 2018, 53, 68–78. [Google Scholar]
- Miyoshi, E.; Takaya, T.; Williams, P.A.; Nishinari, K. Effects of Sodium Chloride and Calcium Chloride on the Interaction between Gellan Gum and Konjac Glucomannan. J. Agric. Food. Chem. 1996, 44, 2486–2495. [Google Scholar] [CrossRef]
- Kavanagh, G.M.; Ross-Murphy, S.B. Rheological Characterisation of Polymer Gels. Prog. Polym. Sci. 1998, 23, 533–562. [Google Scholar] [CrossRef]
- Tang, J. Compression Strength and Deformation of Gellan Gels Formed with Mono- and Divalent Cations. Carbohydr. Polym. 1996, 29, 11–16. [Google Scholar] [CrossRef]
- Kudaibergenov, S.; Nuraje, N.; Adilov, Z.; Abilkhairov, D.; Ibragimov, R.; Gusenov, I.; Sagindykov, A. Plugging Behavior of Gellan in Porous Saline Media. J. Appl. Polym. Sci. 2015, 132. [Google Scholar] [CrossRef]
- Imankulov, T.; Lebedev, D.; Aidarov, K.; Turar, O. Design of HPC System for Analysis the Gel-Polymer Flooding of Oil Fields. Contemp. Eng. Sci. 2014, 7, 1531–1545. [Google Scholar] [CrossRef]
- Gussenov, I.S.; Ibragimov, R.S.; Kudaibergenov, S.E.; Abilkhairov, D.T.; Kudaibergenov, D.N. Application of Polymer Gellan for Injectivity Profile Leveling. In Proceedings of the SPE Annual Caspian Technical Conference and Exhibition, Astana, Kazakhstan, 12–14 November 2014. [Google Scholar]
- Gussenov, I.; Kudaibergenov, S.E. Permeability Reduction by Gellan Gum Solutions. J. Pet. Sci. Eng. 2022, 208, 109546. [Google Scholar] [CrossRef]
- Gussenov, I.; Nuraje, N.; Kudaibergenov, S. Bulk Gels for Permeability Reduction in Fractured and Matrix Reservoirs. Energy Rep. 2019, 5, 733–746. [Google Scholar] [CrossRef]
- Ibragimov, R.; Gusenov, I.; Tatykhanova, G.; Adilov, Z.; Nuraje, N.; Kudaibergenov, S. Study of Gellan for Polymer Flooding. J. Dispers. Sci. Technol. 2013, 34, 1240–1247. [Google Scholar] [CrossRef]
- Kudaibergenov, S.E.; Gussenov, I.S.; Zhappasbayev, B.Z.; Shakhvorostov, A.V.; Abilkhairov, D.T. Gel-Polymer Treatment of Oil Reservoirs. High Efficiency and Duration of Action. Oil Gas Russ. 2015, 12, 76–81. (In Russian) [Google Scholar]
- Abilkhairov, D.T.; Zhappasbayev, B.Z.; Gussenov, I.S.; Shakhvorostov, A.V.; Kudaibergenov, S.E. Gel-Polymer Treatment of Exploitation Well for Water Shut-Off. Oil Gas 2017, 1, 47–58. [Google Scholar]
- Fazal, A.; Yousuf, A.; ur Rehman, A.; Dar, A.; Temuri, S.J.; Mahmood, A.; Sattar, A.; Akbar, N. Reinforced Temperature Activated Polymer Plug Completely Isolates Naturally Fractured Water Producing Sandstone in a High Temperature Environment. In Proceedings of the SPE/PAPG Pakistan Section Annual Technical Symposium and Exhibition, Islamabad, Pakistan, 18–20 November 2019. [Google Scholar]
- Seright, R.S. How Much Polymer Should Be Injected during a Polymer Flood? Review of Previous and Current Practices. SPE J. 2017, 2017, 1–37. [Google Scholar] [CrossRef]
- Seright, R.S. An Alternative View of Filter Cake Formation in Fractures. In Proceedings of the SPE/DOE Improved Oil Recovery Symposium, Tulsa, OK, USA, 13–17 April 2002. [Google Scholar]
- Llamedo, M.A.; Fernández, I.J.; Pérez, D.L.; Rauseo, O.; Valero, E.; Espinoza, J. Evaluation of the Effect of the Water Formation Salinity in the Performance of Gels for Water Shutoff. In Proceedings of the SPE International Symposium on Oilfield Chemistry, The Woodlands, TX, USA, 2–4 February 2005. [Google Scholar]
- Brattekås, B.; Graue, A.; Seright, R.S. Low Salinity Chase Waterfloods Improve Performance of Cr(III)-Acetate HPAM Gel in Fractured Cores. In Proceedings of the SPE International Symposium on Oilfield Chemistry, The Woodlands, TX, USA, 13–15 April 2015. [Google Scholar]
- Belyh, A.M.; Ganiev, I.M.; Ismagilov, T.A. Application of Polymer Flooding in Carbonate Reservoirs of Mesheryakovskoe Oilfield. Eng. Practice 2017, 7. (In Russian) [Google Scholar]
- Kornienko, R.F. Research of Polymer Plugging Solutions for Water Shut-off in Wells (Case Study of Urubcheno-Tohomskoe Oilfield). Master’s Thesis, Siberian Federal University, Krasnoyarsk, Russia, 2017. (In Russian). [Google Scholar]
- Ganguly, S.; Willhite, G.P.; Green, D.W.; McCool, C.S. The Effect of Fluid Leakoff on Gel Placement and Gel Stability in Fractures. SPE J. 2002, 7, 309–315. [Google Scholar] [CrossRef]
- Seright, R.S. Washout of Cr(III)-Acetate-HPAM Gels from Fractures. In Proceedings of the International Symposium on Oilfield Chemistry, Houston, TX, USA, 5–7 February 2003. [Google Scholar]
- Chalhub, O.S.; Ribeiro, R. 3D Visualization of Oil Displacement in Porous Media by the Injection of Microcapsule Suspension Using Confocal Microscopy. In Proceedings of the SPE Annual Technical Conference and Exhibition, Virtual, 26–29 October 2020. [Google Scholar]
- Kudaibergenov, S.E.; Abilkhairov, D.T.; Gussenov, I.S.; Sagindykov, A.A. Pilot Tests of Polymer Flooding Technology in Oilfield Kumkol. Oil Gas 2015, 3, 75–82. (In Russian) [Google Scholar]
- Report on the Application of Gellan for Conformance Control at the Kumkol Field; (Available upon request); Joint Stock Company “Scientific Research and Design Institute of Oil and Gas” (NIPIneftgas): Aktau, Kazakhsta, 2013.
- Seright, R.S.; Liang, J. A Survey of Field Applications of Gel Treatments for Water Shutoff. In Proceedings of the SPE Latin America/Caribbean Petroleum Engineering Conference, Buenos Aires, Argentina, 27–29 April 1994; Society of Petroleum Engineers: Richardson, TX, USA, 1994. [Google Scholar]
- Maya, G.; Castro, R.; Sandoval, J.; Pachon, Z.; Jimenez, R.; Pinto, K.; Diaz, V.; Zapata, J.; Perdomo, L.; Muñoz, S. Successful Polymer Gels Application in a Highly Channeled Peripheral Injection Well: Tello Field Pilot. In Proceedings of the SPE Latin America and Caribbean Petroleum Engineering Conference, Maracaibo, Venezuela, 21–23 May 2014. [Google Scholar]
- Perez, D.; Muñoz, L.F.; Acosta, W.; Falla, J.; Martínez, J.; Vidal, G.; Manrique, E.; Cabrera, F.; Romero, J.; Izadikamoue, M.; et al. Improving Sweep Efficiency in A Mature Waterflood: Balcon Field, Colombia. In Proceedings of the SPE Latin America and Caribbean Petroleum Engineering Conference, Mexico City, Mexico, 16–18 April 2012. [Google Scholar]
- Aldhaheri, M.; Wei, M.; Zhang, N.; Bai, B. A Review of Responses of Bulk Gel Treatments in Injection Wells-Part I: Oil Production. In Proceedings of the SPE Improved Oil Recovery Conference, Tulsa, OK, USA, 14–18 April 2018. [Google Scholar]
- Sydansk, R.D.; Romero-Zeron, L. Reservoir Conformance Improvement; Society of Petroleum Engineers: Richardson, TX, USA, 2011. [Google Scholar]
- Dai, L.C.; You, Q.; Yuhong, X.; Long, H.; Ya, C.; Fulin, Z. Case Study on Polymer Gel to Control Water Coning for Horizontal Well in Offshore Oilfield. In Proceedings of the Offshore Technology Conference, Houston, TX, USA, 2–5 May 2011. [Google Scholar]
- Qu, J.; Wang, P.; You, Q.; Zhao, G.; Sun, Y.; Liu, Y. Soft Movable Polymer Gel for Controlling Water Coning of Horizontal Well in Offshore Heavy Oil Cold Production. Gels 2022, 8, 352. [Google Scholar] [CrossRef] [PubMed]
- Hernando, L.; Martin, N.; Zaitoun, A.; Al Mufargi, H.; Al Harthi, H.; Al Naabi, A.; Al Subhi, K.; Al Harrasi, M.T. Successful Water Shutoff Treatment of Fractured Carbonate Horizontal Well Under Aquifer Pressure Support. In Proceedings of the Abu Dhabi International Petroleum Exhibition & Conference, Abu Dhabi, UAE, 9–12 November 2020. [Google Scholar]
- Seright, R.S.; Wang, D. 2023 Polymer Flooding: Current Status and Future Directions. Pet. Sci. 2023, 20, 910–921. [Google Scholar] [CrossRef]
- Bealessio, B.A.; Alonso, N.A.B.; Mendes, N.J.; Sande, A.V.; Hascakir, B. A review of enhanced oil recovery (EOR) methods applied in Kazakhstan. Petroleum 2021, 7, 1–9. [Google Scholar] [CrossRef]
- Sagyndikov, M.; Mukhambetov, B.; Orynbasar, Y.; Nurbulatov, A.; Aidarbayev, S. Evaluation of polymer flooding efficiency at brownfield development stage of giant Kalamkas Oilfield, Western Kazakhstan. In Proceedings of the SPE Annual Caspian Technical Conference and Exhibition, Astana, Kazakhstan, 31 October–2 November 2018; p. SPE-192555-MS. [Google Scholar] [CrossRef]
- Kudaibergenov, S.E. Synthetic and natural polymers for drilling, enhanced oil recovery and oil transportation. Oil Gas 2018, 5, 107–120. (In Russian) [Google Scholar]
- Sun, I.; Shagirbaev, S.; Lobanov; et al. Scientific and Applied Aspects of the Gel Polymer Flooding Project at the North Buzachi Field. LLC RN-UfaNIPIneft. Materials of the international scientific-practical conference at JSC “KazNIPImunaigaz”, Aktau, Kazakhstan. 2011. [Google Scholar]
- Bai, B.; Huang, F.; Liu, Y.; Seright, R.S.; Yefei, W. Case Study on Preformed Particle Gel for In-Depth Fluid Diversion. In Proceedings of the SPE Symposium on Improved Oil Recovery, Tulsa, OK, USA, 20–23 April 2008. [Google Scholar] [CrossRef]
- Bai, B.; Li, L.; Liu, Y.; Liu, H.; Wang, Z.; Chunmei, Y. Preformed Particle Gel for Conformance Control: Factors Affecting Its Properties and Applications. SPE Res. Eval. Eng. 2007, 10, 415–422. [Google Scholar] [CrossRef]
- Altunina, L.K.; Kuvshinov, V.A. Ninka, Galka, and Romka to Increase Oil Production. ‘World Energy’ June 2004. Available online: http://www.worldenergy.ru/mode.1349-id.3416-type.html (accessed on 7 October 2023).
- Kudaibergenov, S.E.; Shakhvorostov, A.V.; Gussenov, I.S.; Tatykhanova, G.S.; Kunakbayev, E.T.; Mukasheva, T.D.; Berzhanova, R.Z.; Akhmetova, M.V. On the Perspective of Organization of Polysaccharide—Gellan from Domestic Raw Materials for Oil and Gas Industry. In Proceedings of the Materials of International Online Conference “Innovation Technologies in Oil & Gas Sector. Implementation Experience and Perspectives of Development”, Aktau, Kazakhstan, 19 November 2021; pp. 155–168. [Google Scholar]
- Zhu, G.; Sheng, L.; Tong, Q. A New Strategy to Enhance Gellan Production by Two-Stage Culture in Sphingomonas Paucimobilis. Carbohydr. Polym. 2013, 98, 829–834. [Google Scholar] [CrossRef]
- Kudaibergenov, S.E.; Tatykhanova, G.S.; Gizatullina, N.N.; Tuleyeva, R.N.; Kaldybekov, D.B.; Gussenov, I.S.; Berzhanova, R.Z.; Mukasheva, T.D.; Vamvakaki, M.; Aseyev, V.O.; et al. Anionic polysaccharide—Gellan as perspective polymer for potential application in medicine and oil recovery: A mini-review. Uzb. J. Polym. 2023, 2, 39–56. [Google Scholar]
- El Yousfi, R.; Brahmi, M.; Dalli, M.; Achalhi, N.; Azougagh, O.; Tahani, A.; Touzani, R.; El Idrissi, A. Recent Advances in Nanoparticle Development for Drug Delivery: A Comprehensive Review of Polycaprolactone-Based Multi-Arm Architectures. Polymers 2023, 15, 1835. [Google Scholar] [CrossRef] [PubMed]
- Bouammali, H.; Bourassi, L.; Bouammali, B.; Siaj, M.; Challioui, A.; Touzani, R. Graphene and chitosan innovative materials for water treatment. Rev. Mater. Today Proc. 2023, 72, 3577–3588. [Google Scholar] [CrossRef]
- Benahmed, A.; Azzaoui, K.; El Idrissi, A.; Belkheir, H.; Said Hassane, S.O.; Touzani, R.; Rhazi, L. Cellulose Acetate-g-Polycaprolactone Copolymerization Using Diisocyanate Intermediates and the Effect of Polymer Chain Length on Surface, Thermal, and Antibacterial Properties. Molecules 2022, 27, 1408. [Google Scholar] [CrossRef] [PubMed]
- Iurciuc (Tincu), C.; Savin, A.; Lungu, C.; Martin, P.; Popa, M. Gellan. Food Applications. Cellulose Chem. Technol. 2016, 50, 1–13. [Google Scholar]
- Deverton, J.; Wang, C.; Lai, R.C.; Su, K.; Zhang, K.; Wang, D.-A. An improved injectable polysaccharide hydrogel: Modified gellan gum for long-term cartilage regeneration in vitro. J. Mater. Chem. 2009, 19, 1968–1977. [Google Scholar] [CrossRef]
- Osmalek, T.; Froelich, A.; Tasarek, S. Application of gellan gum in pharmacy and medicine. Int. J. Pharm. 2014, 466, 328–340. [Google Scholar] [CrossRef] [PubMed]
- D’Arrigo, G.; Di Meo, C.; Gaucci, E.; Chichiarelli, S.; Coviello, T.; Capitani, D.; Alhaaique, P.; Matricardi, P. Self-assembled gellan gum nanohydrogel as a tool for prednisolone delivery. Soft Matter 2012, 8, 11557–11564. [Google Scholar] [CrossRef]
- Silva-Correa, J.; Oliveira, J.M.; Caridade, S.G.; Oliveira, J.T.; Sousa, R.A.; Mano, J.F.; Reis, R.I. Gellan gum-based hydrogels for intervertebral disc tissue engineering applications. J. Tissue Eng. Regen. Med. 2011, 5, e97–e107. [Google Scholar] [CrossRef]
- Tatykhanova, G.; Aseyev, V.; Kudaibergenov, S. Mucoadhesive properties of gellan and its modified derivatives. Rev. Adv. Chem. 2020, 10, 140–157. [Google Scholar] [CrossRef]
- Silva-Correa, J.; Zavan, B.; Vindigni, V.; Silva, T.H.; Oliveira, J.M.; Abatangelo, G.; Reis, R.L. Biocompatibility evaluation of ionic- and photo-crosslinked methacryalted gellan gum hydrogels: In vivo and in vitro study. Adv. Health Mater. 2013, 2, 568–575. [Google Scholar] [CrossRef]
- Oliveira, J.T.; Gardel, L.S.; Rada, T.; Martins, L.; Gomes, M.E.; Reis, R.L. Injectable gellan gum hydrogels with autologous cells for the treatment of rabbit articular cartilage defects. J. Orthop. Res. 2010, 28, 1193–1199. [Google Scholar] [CrossRef]
- Coutinho, D.F.; Sant, S.; Shin, H.; Oliveira, J.T.; Gomes, M.E.; Neves, N.M.; Khademhosseini, A.; Reis, R.L. Modified gellan gum hydrogels with tunable physical and mechanical properties. Biomaterials 2010, 31, 7494–7502. [Google Scholar] [CrossRef]
- Tsaryk, R.; Silva-Correia, J.; Oliveira, J.M.; Unger, R.E.; Landes, C.; Brochhausen, C.; Chanaati, S.; Reis, R.L.; Kirkpatrick, C.J. Biological performance of cell-encapsulated methacrylated gellan gum-based hydrogels for nucleus pulposes regeneration. J. Tissue Eng. Regen. Med. 2017, 11, 637–648. [Google Scholar] [CrossRef]
- Silva-Correa, J.; Miranda-Goncalves, V.; Salgado, A.J.; Sousa, N.; Oliveira, J.M.; Reis, R.L. Angiogenic potential of gellan-gum-based hydrogels for application nucleus pulposes regeneration: In vivo study. Tissue Eng. Part A 2012, 18, 1203–1212. [Google Scholar] [CrossRef]


| Polymer | Salinity, ppm | T, °C | Time, Days | Refs. |
|---|---|---|---|---|
| Xanthan | 170 000 | 80 | 300 | [27] |
| Scleroglucan | 30 000 | 100 | 720 | [12] |
| - | 80 | 90 | [28] | |
| - | 90 | - | [29,30] | |
| Diutan | - | 85 | 90 | [1] |
| HPAM | 30 000 | 85 | 100 | [31] |
| HPAM | 20 000 | 90 | 619 | [32] |
| Type of Metal Ions | K+ | Na+ | Ca2+ | Mg2+ | Cu2+ | Zn2+ | Pb2+ |
|---|---|---|---|---|---|---|---|
| Content, meq∙g−1 | 0.671 | 0.41 | 0.32 | 0.21 | 0.016 | 0.008 | <0.001 |
| Salt Type | BaCl2 | CaCl2 | MgCl2 | KCl | NaCl |
|---|---|---|---|---|---|
| Ccrit inducing the sol-gel transition of gellan derived from viscometric data illustrated in Figure 1b, mol∙L−1 | 0.0045 | 0.006 | 0.006 | 0.01 | 0.1 |
| Salt Type | ∆C *, J∙g−1∙K−1 | |||
|---|---|---|---|---|
| Concentration of Salt, mol∙L−1 | ||||
| 0.005 | 0.01 | 0.05 | 0.1 | |
| NaCl | 107.63 | 95.58 | 66.33 | 59.93 |
| KCl | 111.75 | 105.70 | 103.23 | 96.07 |
| CaCl2 | 113.47 | 113.28 | 100.64 | 84.09 |
| MgCl2 | 118.90 | 117.38 | 96.50 | 92.38 |
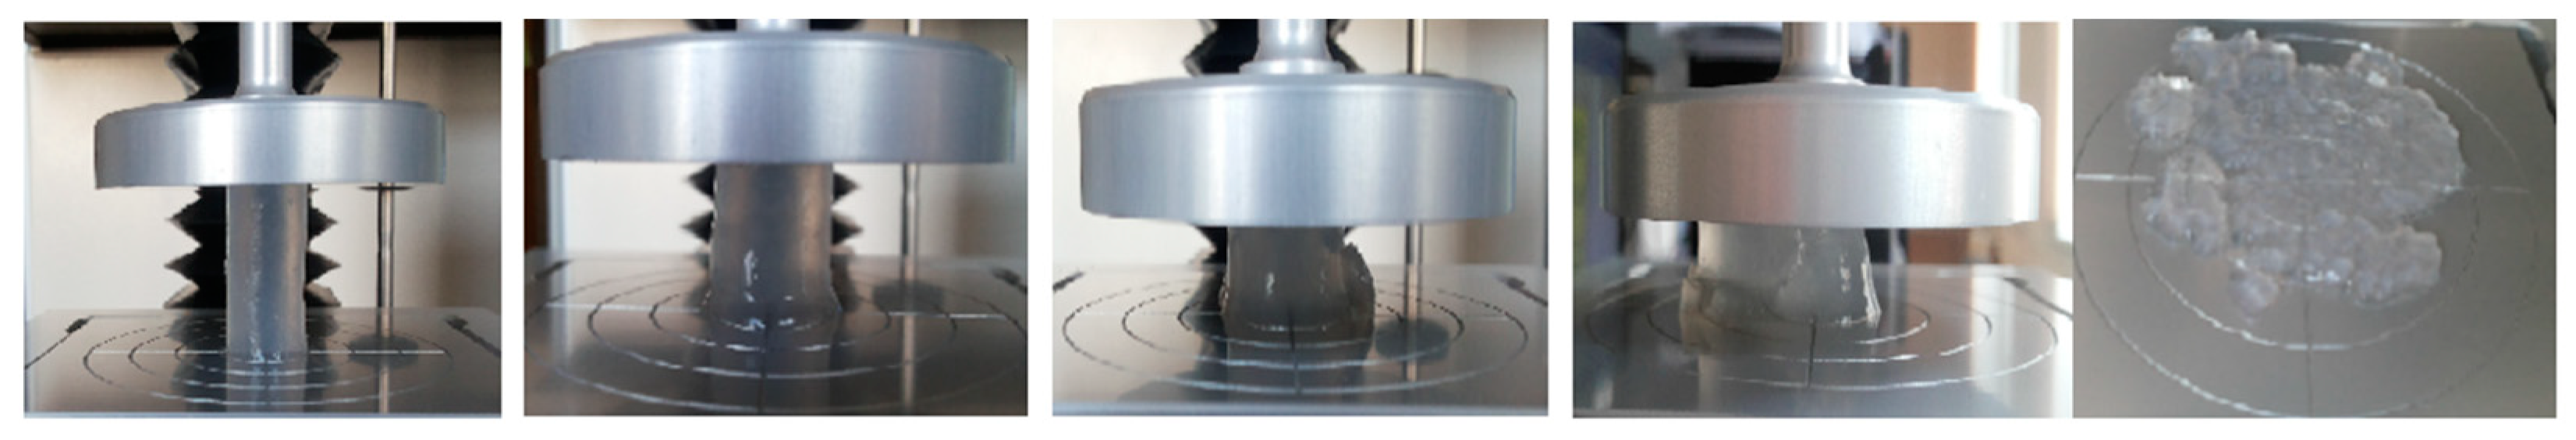
| Type of Salts | Young’s Modulus, 10−2 N·m−2 | Fracture Stress, % |
|---|---|---|
| NaCl | 7.84 | 26.1 |
| KCl | 8.45 | 31.7 |
| MgCl2 | 9.01 | 31.7 |
| CaCl2 | 9.36 | 32.0 |
| Oilfield saline water | 9.54 | 33.1 |
| Sample Number | Length, cm | Diameter, cm | Gas Permeability, mD | Porosity, % | Pore Volume, cm3 |
|---|---|---|---|---|---|
| 28 | 5.07 | 2.39 | 203.17 | 21.97 | 5.564 |
| 24 | 5.07 | 2.5 | 66.71 | 18.3 | 4.661 |
| Project and Source of Data | m3 (bbls) of Incremental Oil Produced per 1 kg of Dry Polymer Injected, m3 (bbls)/kg | Refs |
|---|---|---|
| Average result of 114 injection well treatments with HPAM or xanthan gels * | 0.84 (5.28) | [72] |
| Tello Field Pilot, 1 injector, HPAM gels | 1.6 (10) | [73] |
| Balcon field 2 injectors, HPAM gels | 2 (12.7) | [74] |
| 61 gel treatment filed projects | 3.52 (22) | [75] |
| Kumkol, 2 injectors, gellan gum | 3.52 (22) | [52] |
| Big Horn Basin, 17 injectors, HPAM gels | 4.78 (29.92) | [76] |
| Treatment | Oil Production Increase | Water Cut Decrease | Literature Source |
|---|---|---|---|
| 274 production well polymer and gel treatments | On average 3 times increase | On average from 98.7 to 87.5% (by 11%) | [72] |
| 768 m3 of HPAM gel into the horizontal with water coning | From 0 to 16.3–27.4 t/d | Decrease by 6–9% on average within one year following the treatment | [77] |
| 500 m3 of HPAM gel into the horizontal with water coning | From 9.2 to 20.0 m3/d | Reduction from 90 to 8%. Increased to 60–70% over the next 14 months. | [78] |
| Horizontal well, above an aquifer in a fractured carbonate reservoir. 90 m3 of microgel slug alternated with 50 m3 of polymer gelant | From 6.4 to 14.4 m3/day | Reduction by 11% | [79] |
| Oilfield/Reagent, Year | Number of Injection Oil Reservoirs | Mass of Dry Reagent, Tons | Mass of Additional Produced Oil, Tons | Polymer Utilization Factor *, Tons/Tons | Duration, Months | Literature Source |
|---|---|---|---|---|---|---|
| Kumkol, Kazakhstan/Gellan gum, 2013 | 2 | 2 | 5890 | 2945 | 11 | [58] |
| Kumkol, Kazakhstan/Gellan gum, 2014 | 3 | 3 | 8695 | 2898 | 8 | [83] |
| Balcon, Colombia/HPAM, 2010 | 2 | 16.68 | 28,418 | 1703 | 10 | [74] |
| Tello, Colombia/HPAM, 2009 | 1 | 34 | 45,576 | 1340 | 55 | [73] |
| Kumkol, Kazakhstan/Gellan gum, 2017 | 5 | 5 | 5808 | 1160 | 6 | [83] |
| Buzachi, Kazakhstan/Polyacrylamide,2011 | 1 | 42 | 16,000 | 380 | 12 | [84] |
| Daqing, China/Gel–polymer system | 4 | 134 | 15,000 | 113 | 10 | [85] |
| Zhong-guang, China/Gel–polymer system | 2 | 20.5 | 3239 | 158 | 3 | [86] |
| Usinskoe, Russia/Thermotropic gel “Galka” | No data | 117 | 10,316 | 88 | 6 | [87] |
| HAG Produced from Glucose–Fructose Syrup of Zharkent Corn Starch Plant | Molecular Mass, Dalton | PDI | ||
|---|---|---|---|---|
| Mw | Mn | Mz | Mw/Mn | |
| 343,500 | 333,000 | 360,000 | 1.03 | |
| Type of Raw Materials | Pure Glucose | Zharkent Glucose– Fructose Syrup | Burunday Glucose– Fructose Syrup |
|---|---|---|---|
| Shear viscosity, Pa∙s | 2.3 | 3.2 | 4.4 |
Disclaimer/Publisher’s Note: The statements, opinions and data contained in all publications are solely those of the individual author(s) and contributor(s) and not of MDPI and/or the editor(s). MDPI and/or the editor(s) disclaim responsibility for any injury to people or property resulting from any ideas, methods, instructions or products referred to in the content. |
© 2023 by the authors. Licensee MDPI, Basel, Switzerland. This article is an open access article distributed under the terms and conditions of the Creative Commons Attribution (CC BY) license (https://creativecommons.org/licenses/by/4.0/).
Share and Cite
Gussenov, I.; Berzhanova, R.Z.; Mukasheva, T.D.; Tatykhanova, G.S.; Imanbayev, B.A.; Sagyndikov, M.S.; Kudaibergenov, S.E. Exploring Potential of Gellan Gum for Enhanced Oil Recovery. Gels 2023, 9, 858. https://doi.org/10.3390/gels9110858
Gussenov I, Berzhanova RZ, Mukasheva TD, Tatykhanova GS, Imanbayev BA, Sagyndikov MS, Kudaibergenov SE. Exploring Potential of Gellan Gum for Enhanced Oil Recovery. Gels. 2023; 9(11):858. https://doi.org/10.3390/gels9110858
Chicago/Turabian StyleGussenov, Iskander, Ramza Zh. Berzhanova, Togzhan D. Mukasheva, Gulnur S. Tatykhanova, Bakyt A. Imanbayev, Marat S. Sagyndikov, and Sarkyt E. Kudaibergenov. 2023. "Exploring Potential of Gellan Gum for Enhanced Oil Recovery" Gels 9, no. 11: 858. https://doi.org/10.3390/gels9110858
APA StyleGussenov, I., Berzhanova, R. Z., Mukasheva, T. D., Tatykhanova, G. S., Imanbayev, B. A., Sagyndikov, M. S., & Kudaibergenov, S. E. (2023). Exploring Potential of Gellan Gum for Enhanced Oil Recovery. Gels, 9(11), 858. https://doi.org/10.3390/gels9110858