
Optimization of SA-Gel Hydrogel Printing Parameters for Extrusion-Based 3D Bioprinting


Abstract

1. Introduction
2. Experimental Setup and Data Validation
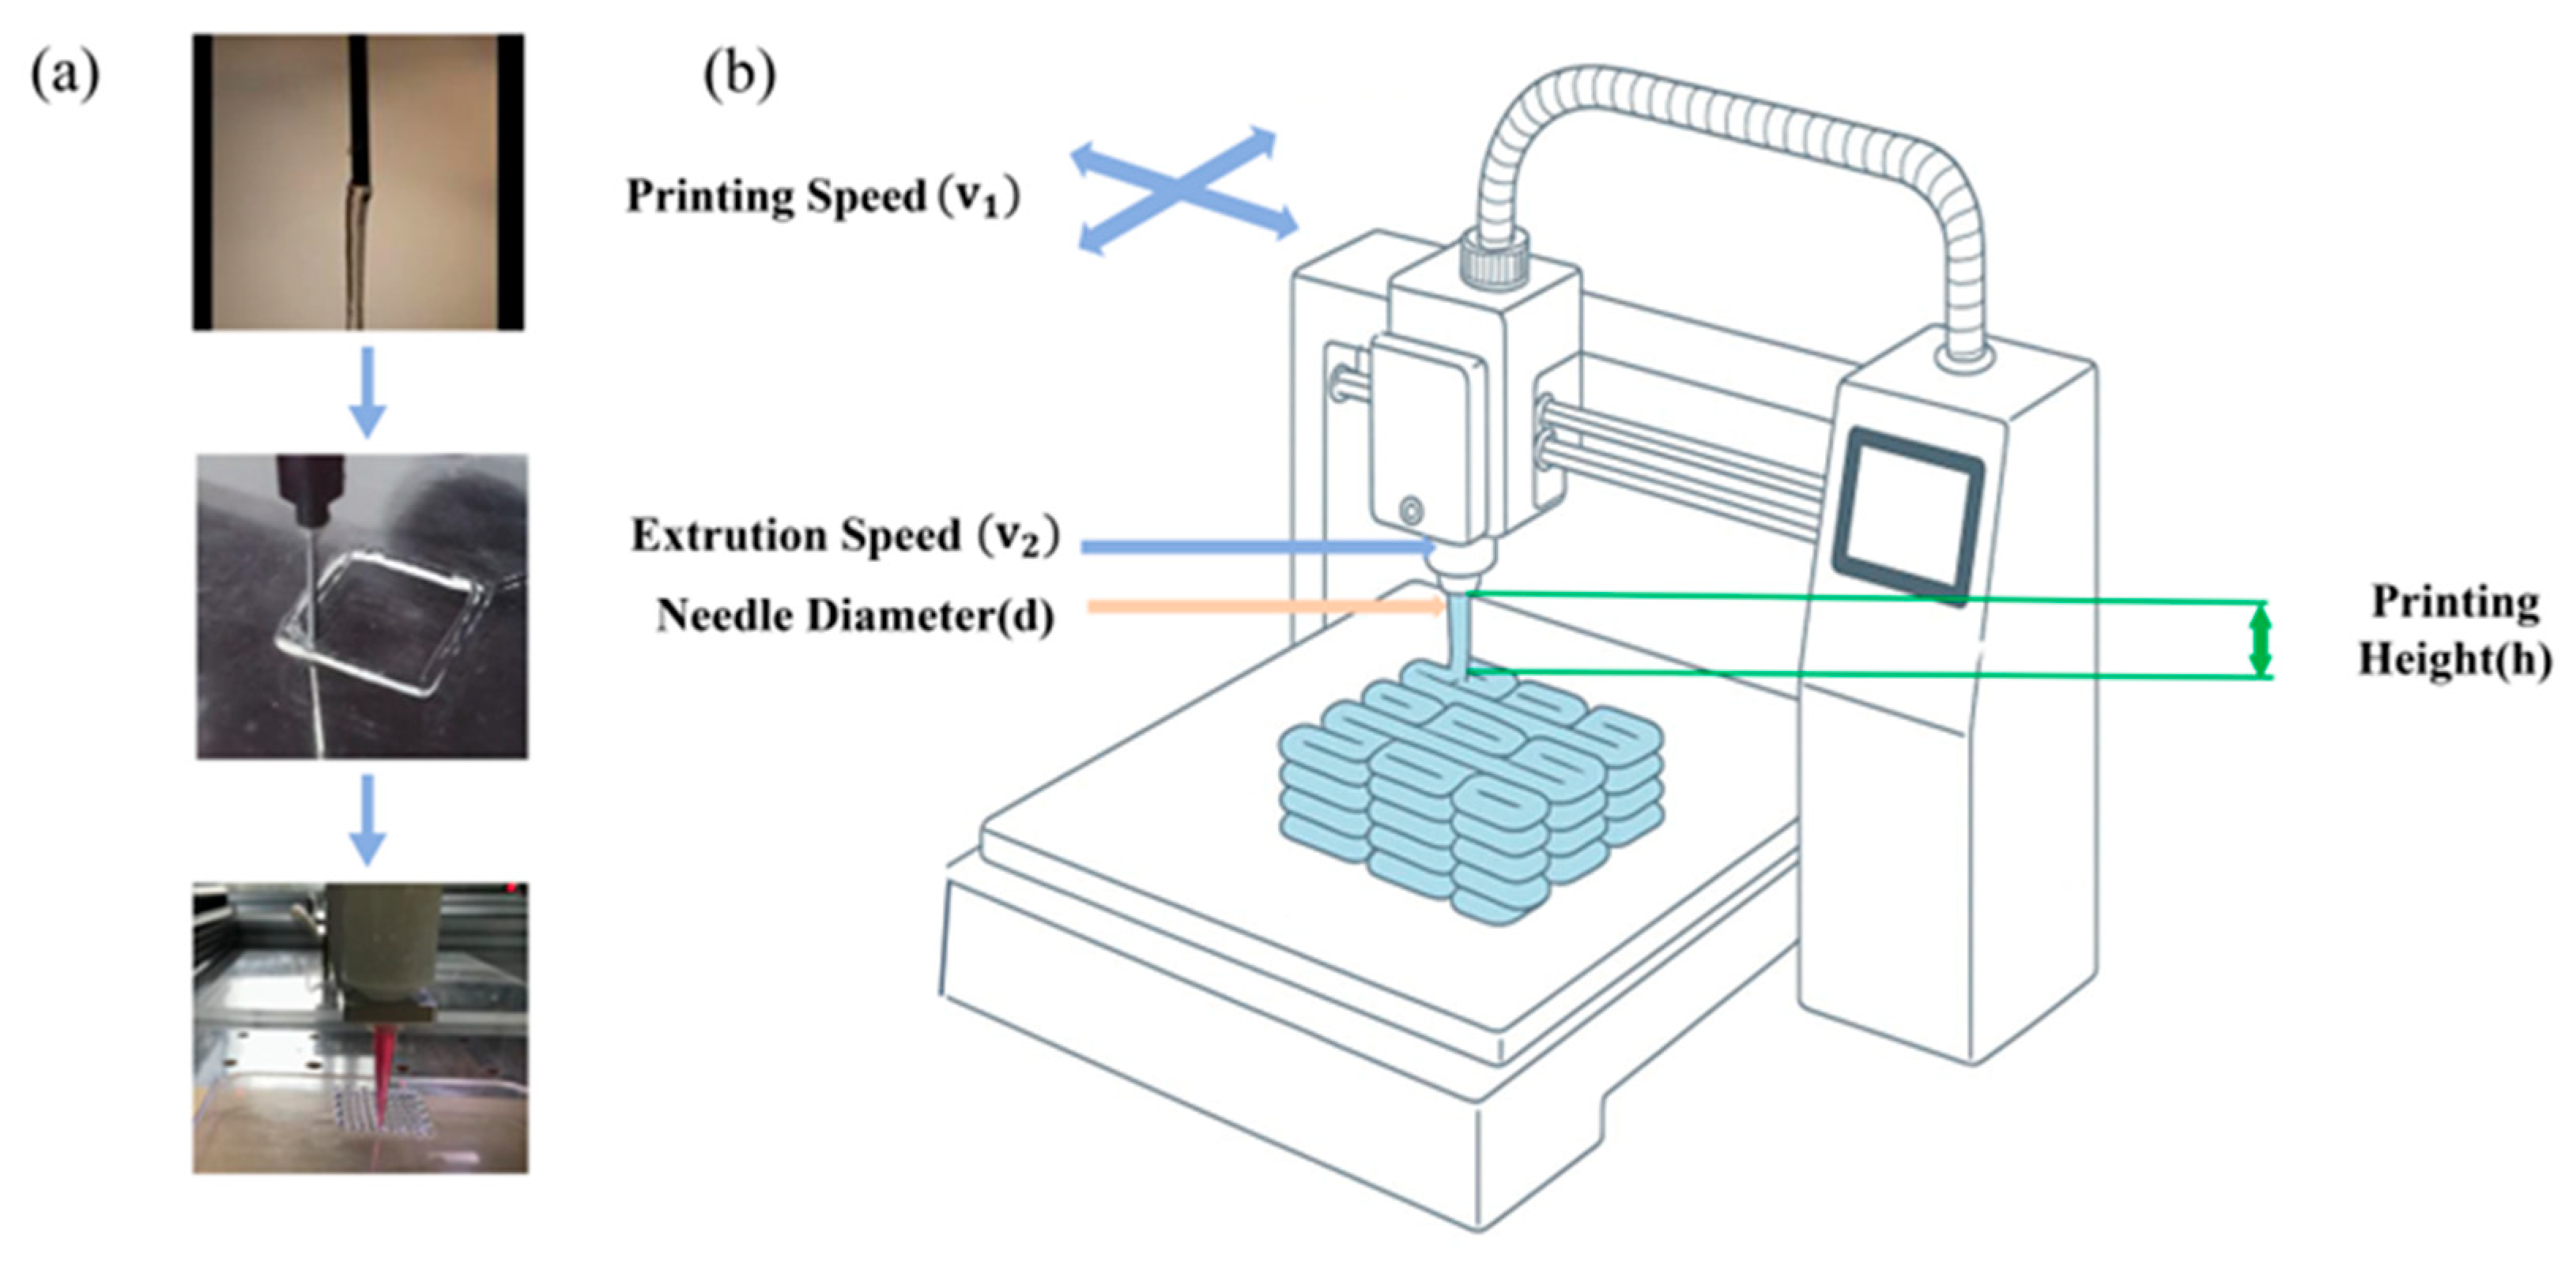
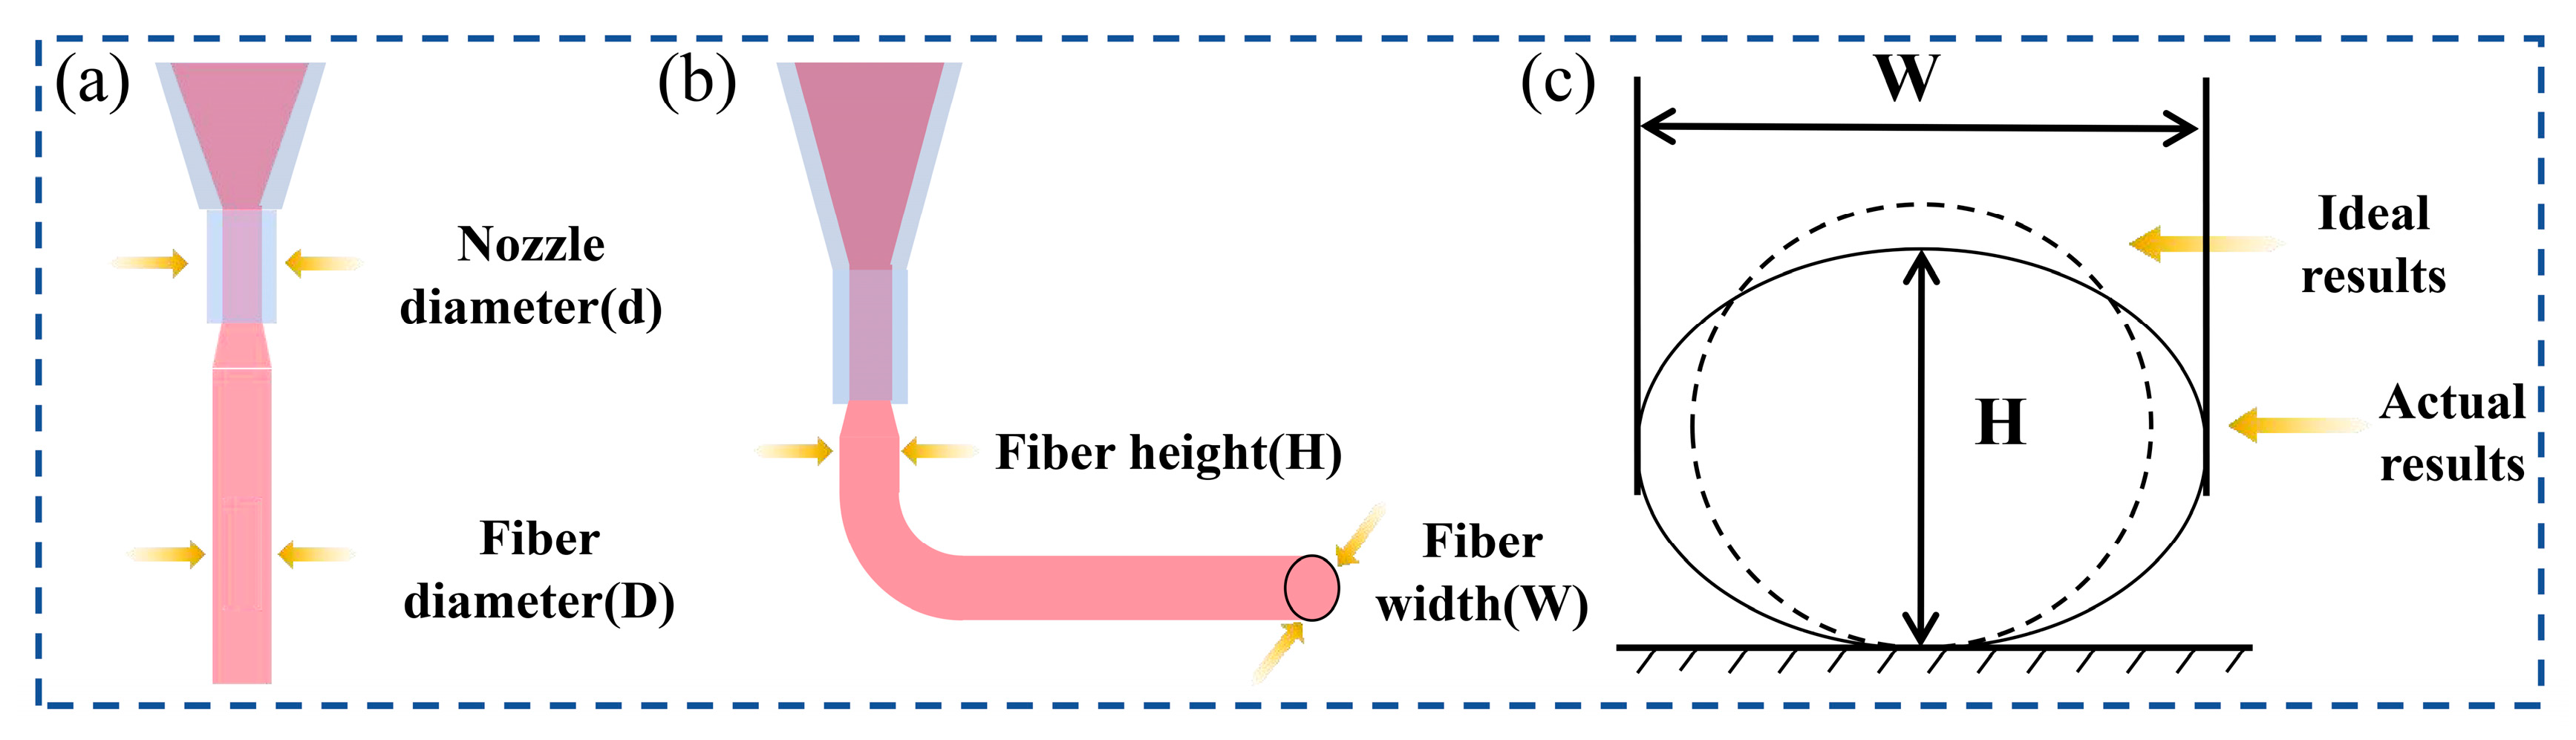
2.1. Analysis of Hydrogel 3D Printing Process
2.2. Optimal Object
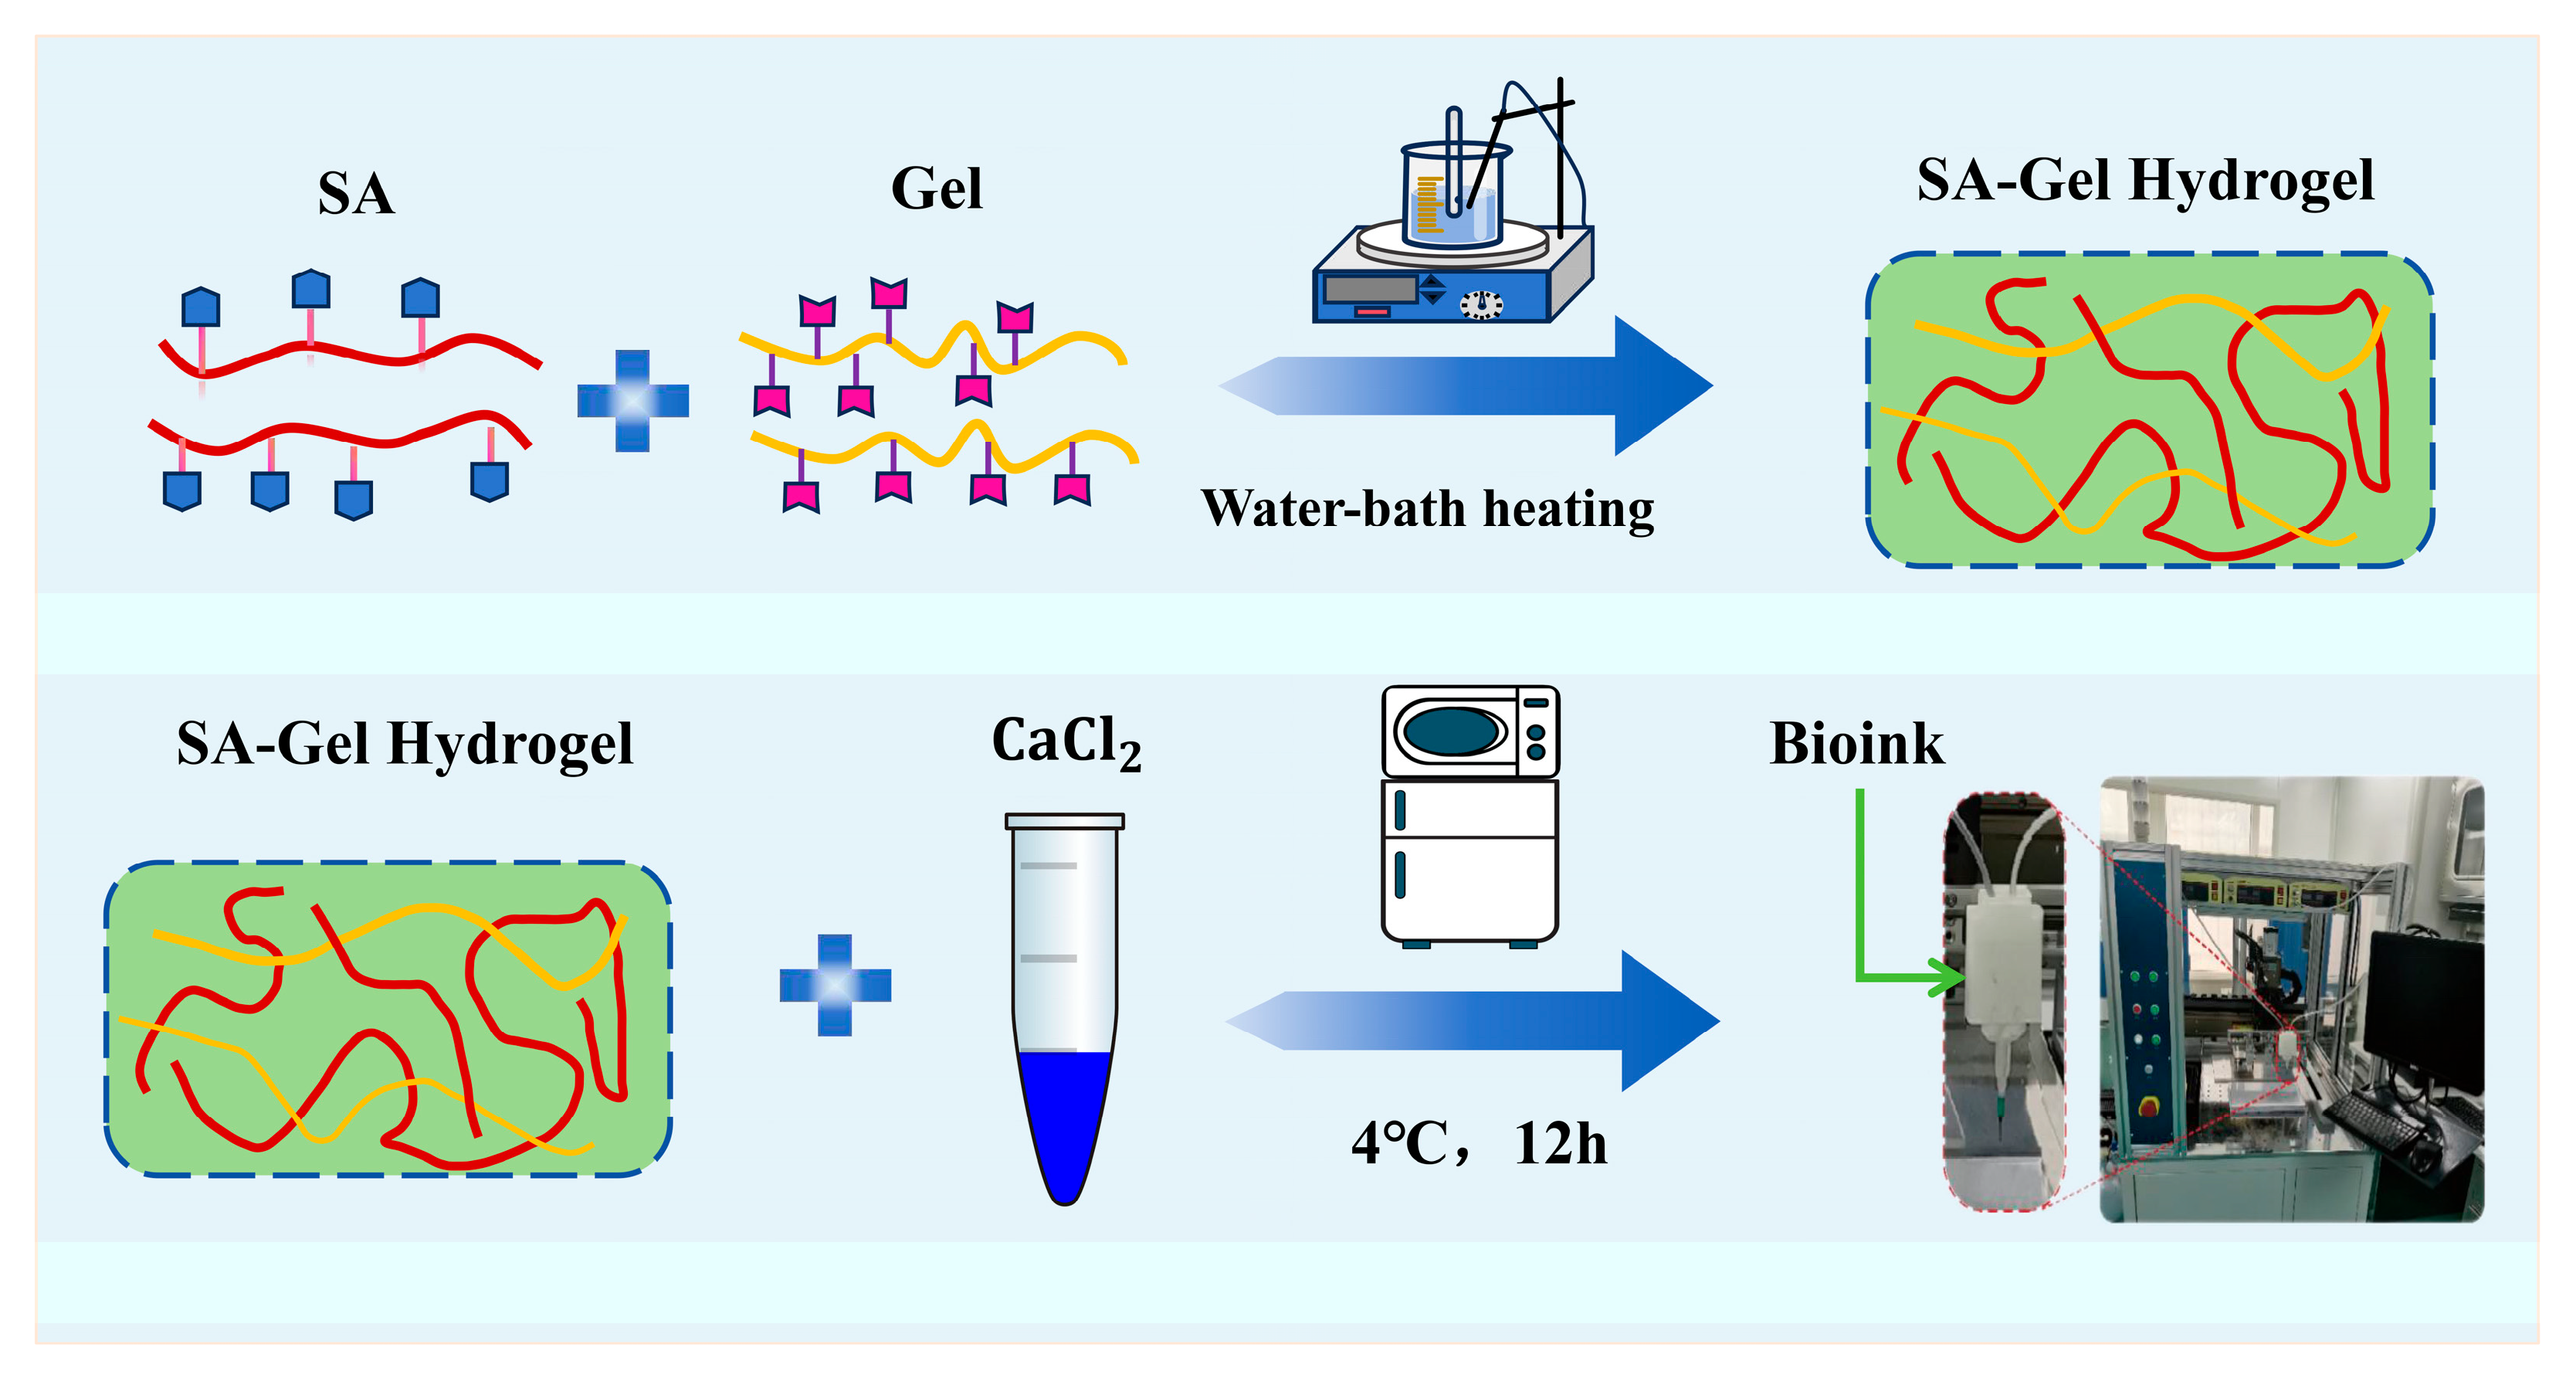
2.3. Preparation of SA-Gel Hydrogels
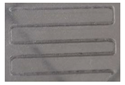
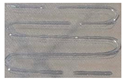
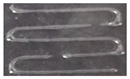
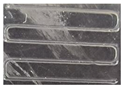
2.4. Printing Experimental Design and Results
2.5. Printing Experimental Data Processing
2.5.1. Grey Relational Analysis
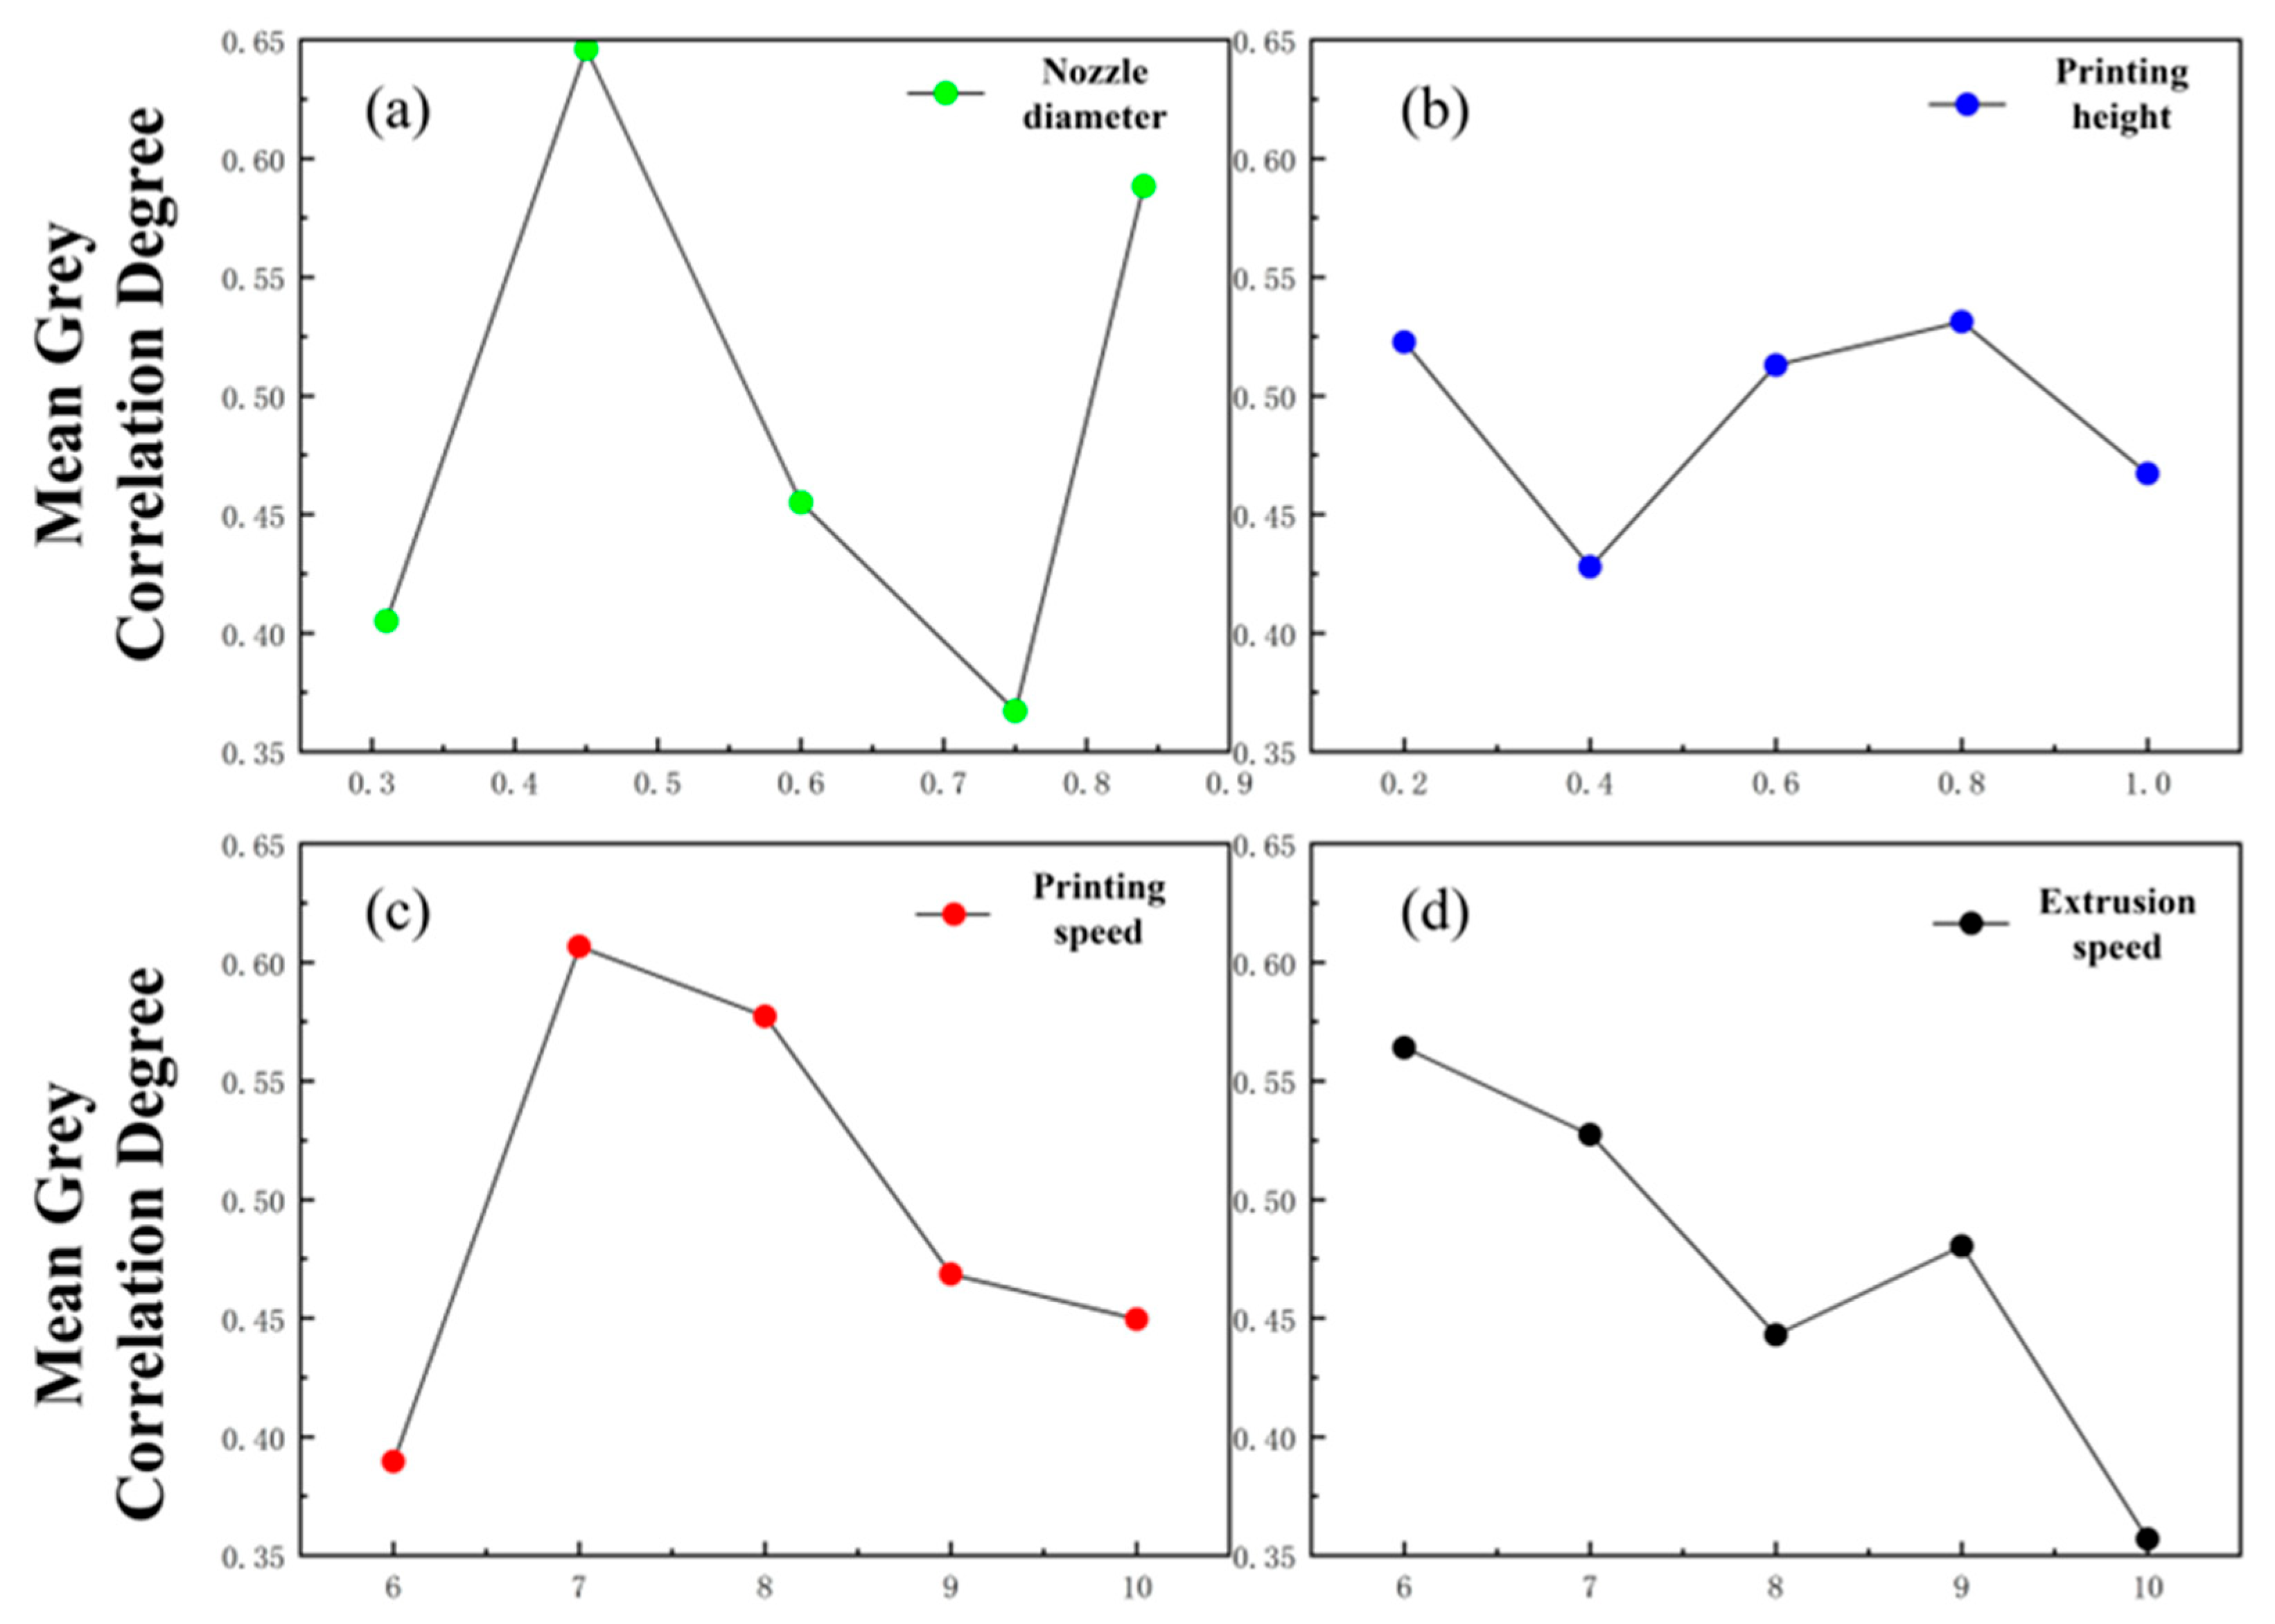
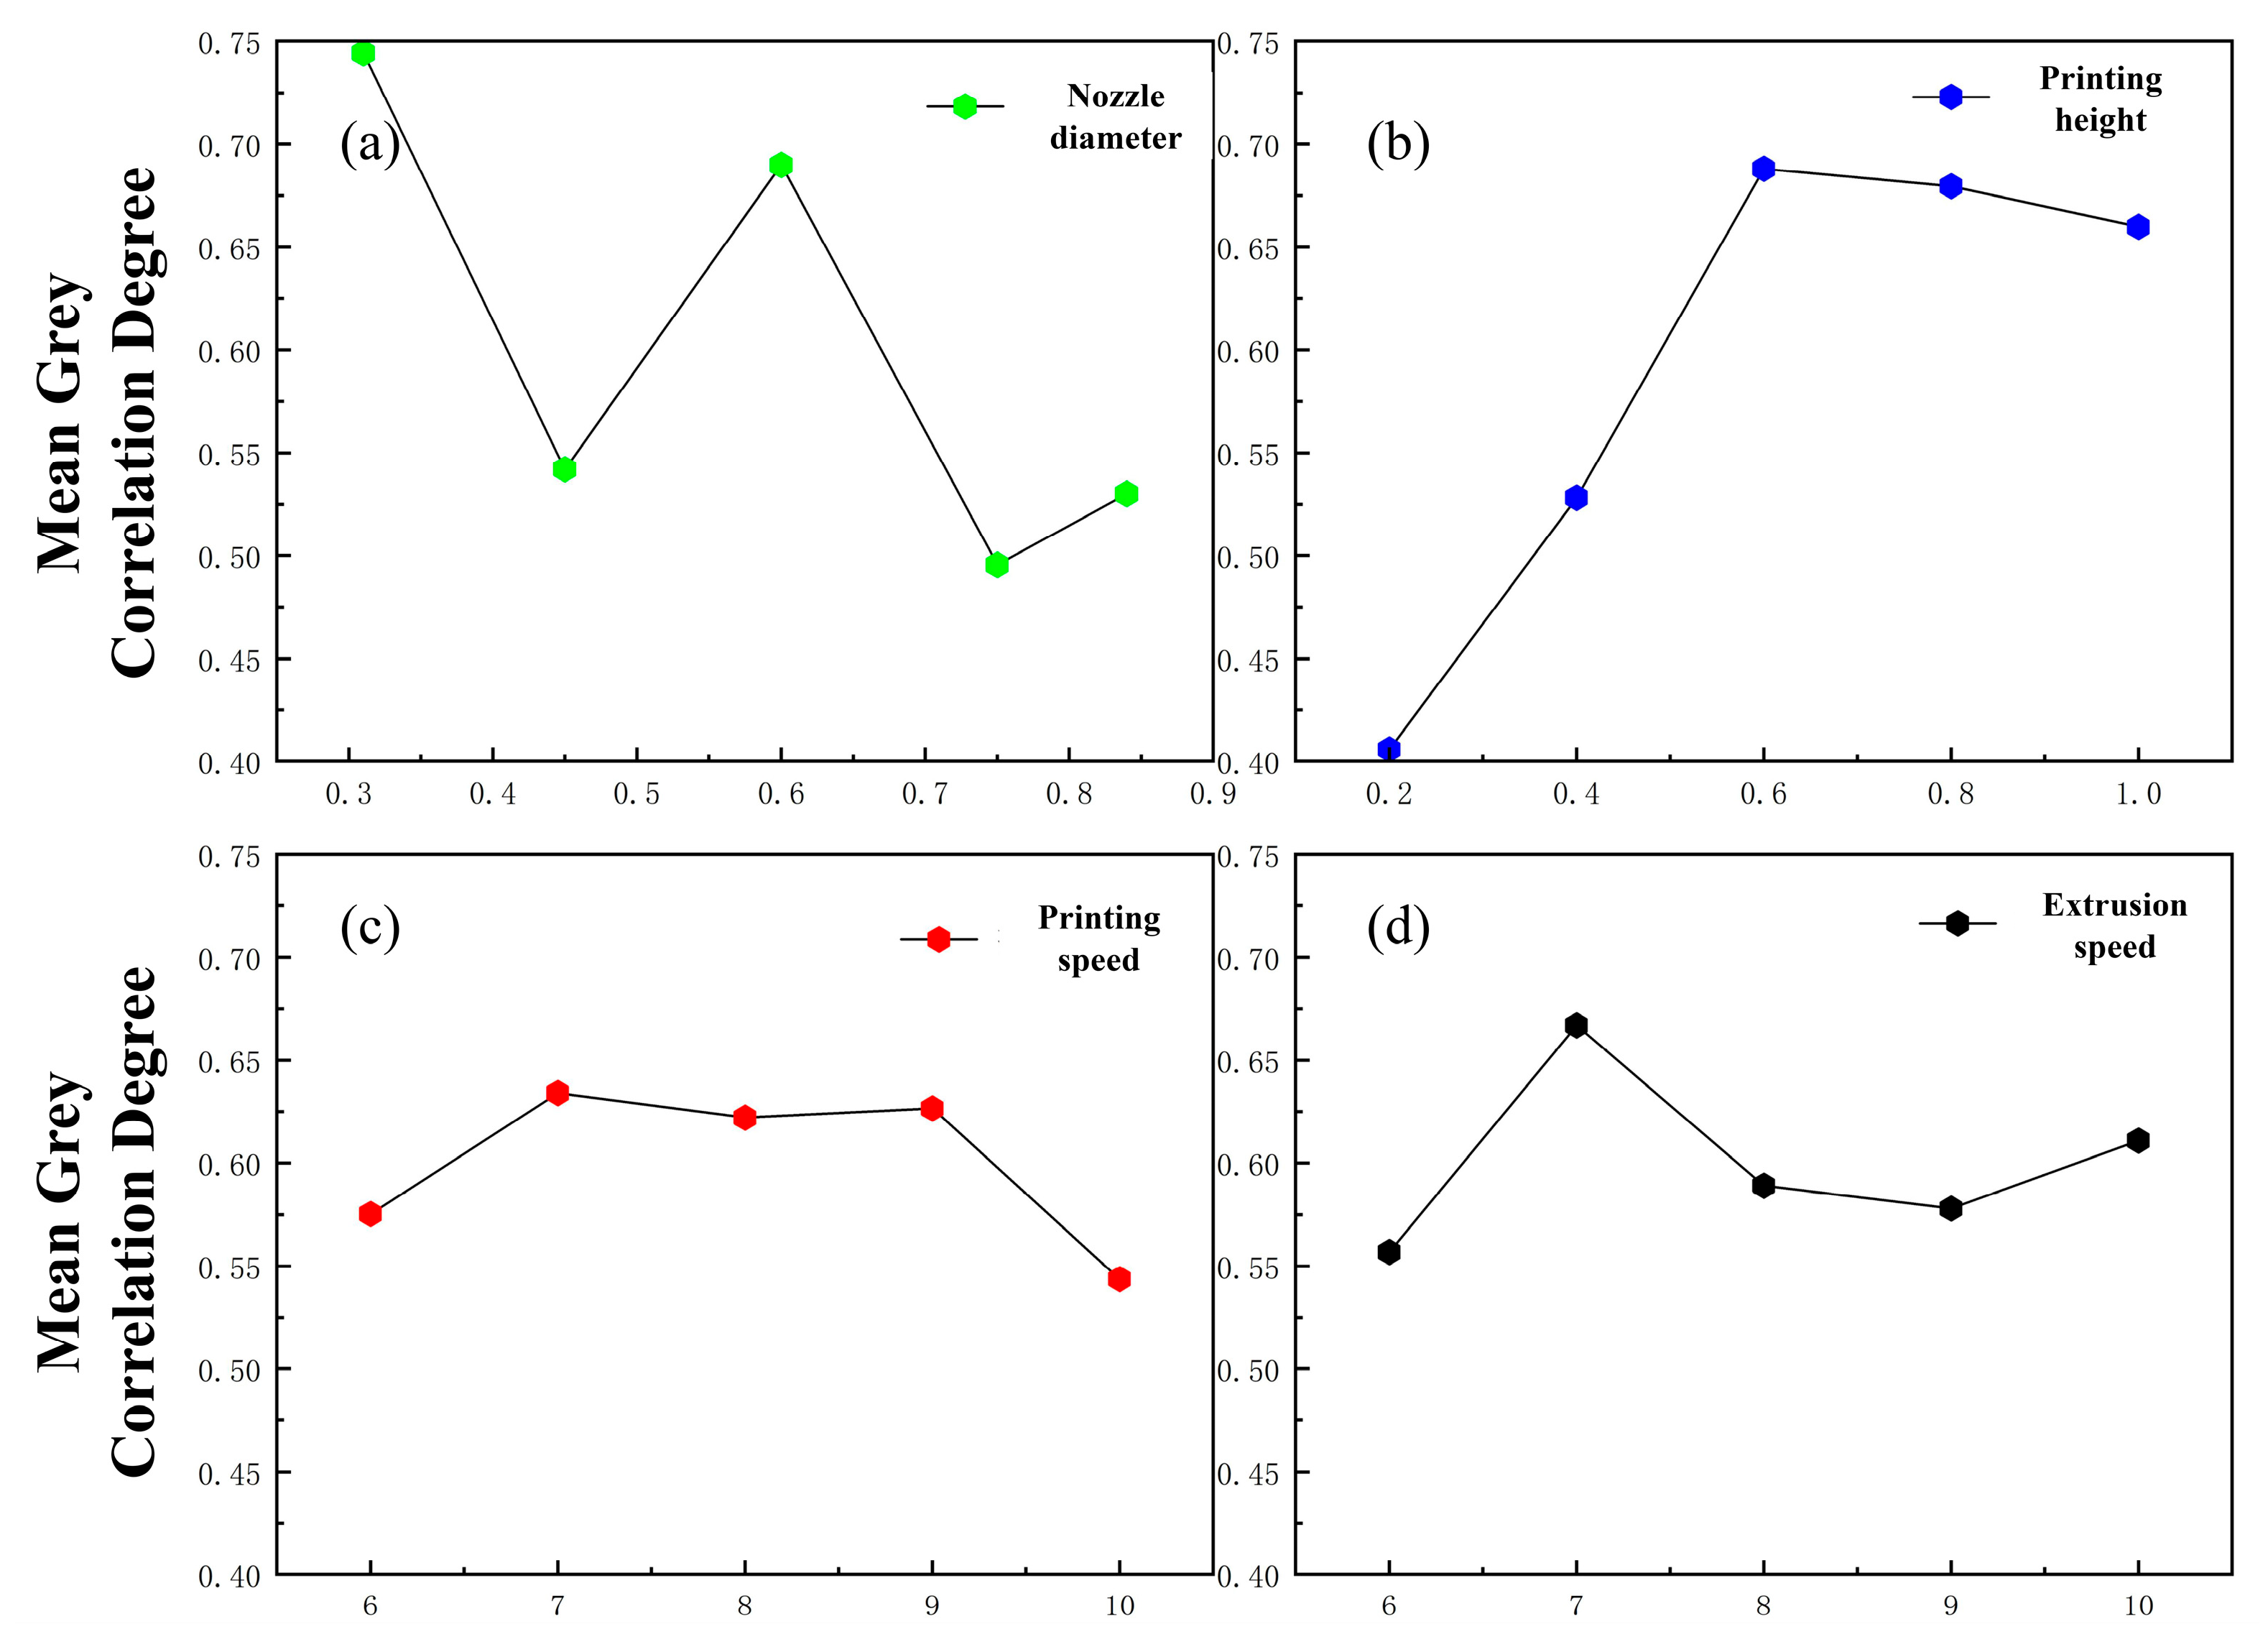
2.5.2. Grey Relational Analysis Results
2.6. Establishment of Grey Correlation Response Model for Printing Processes
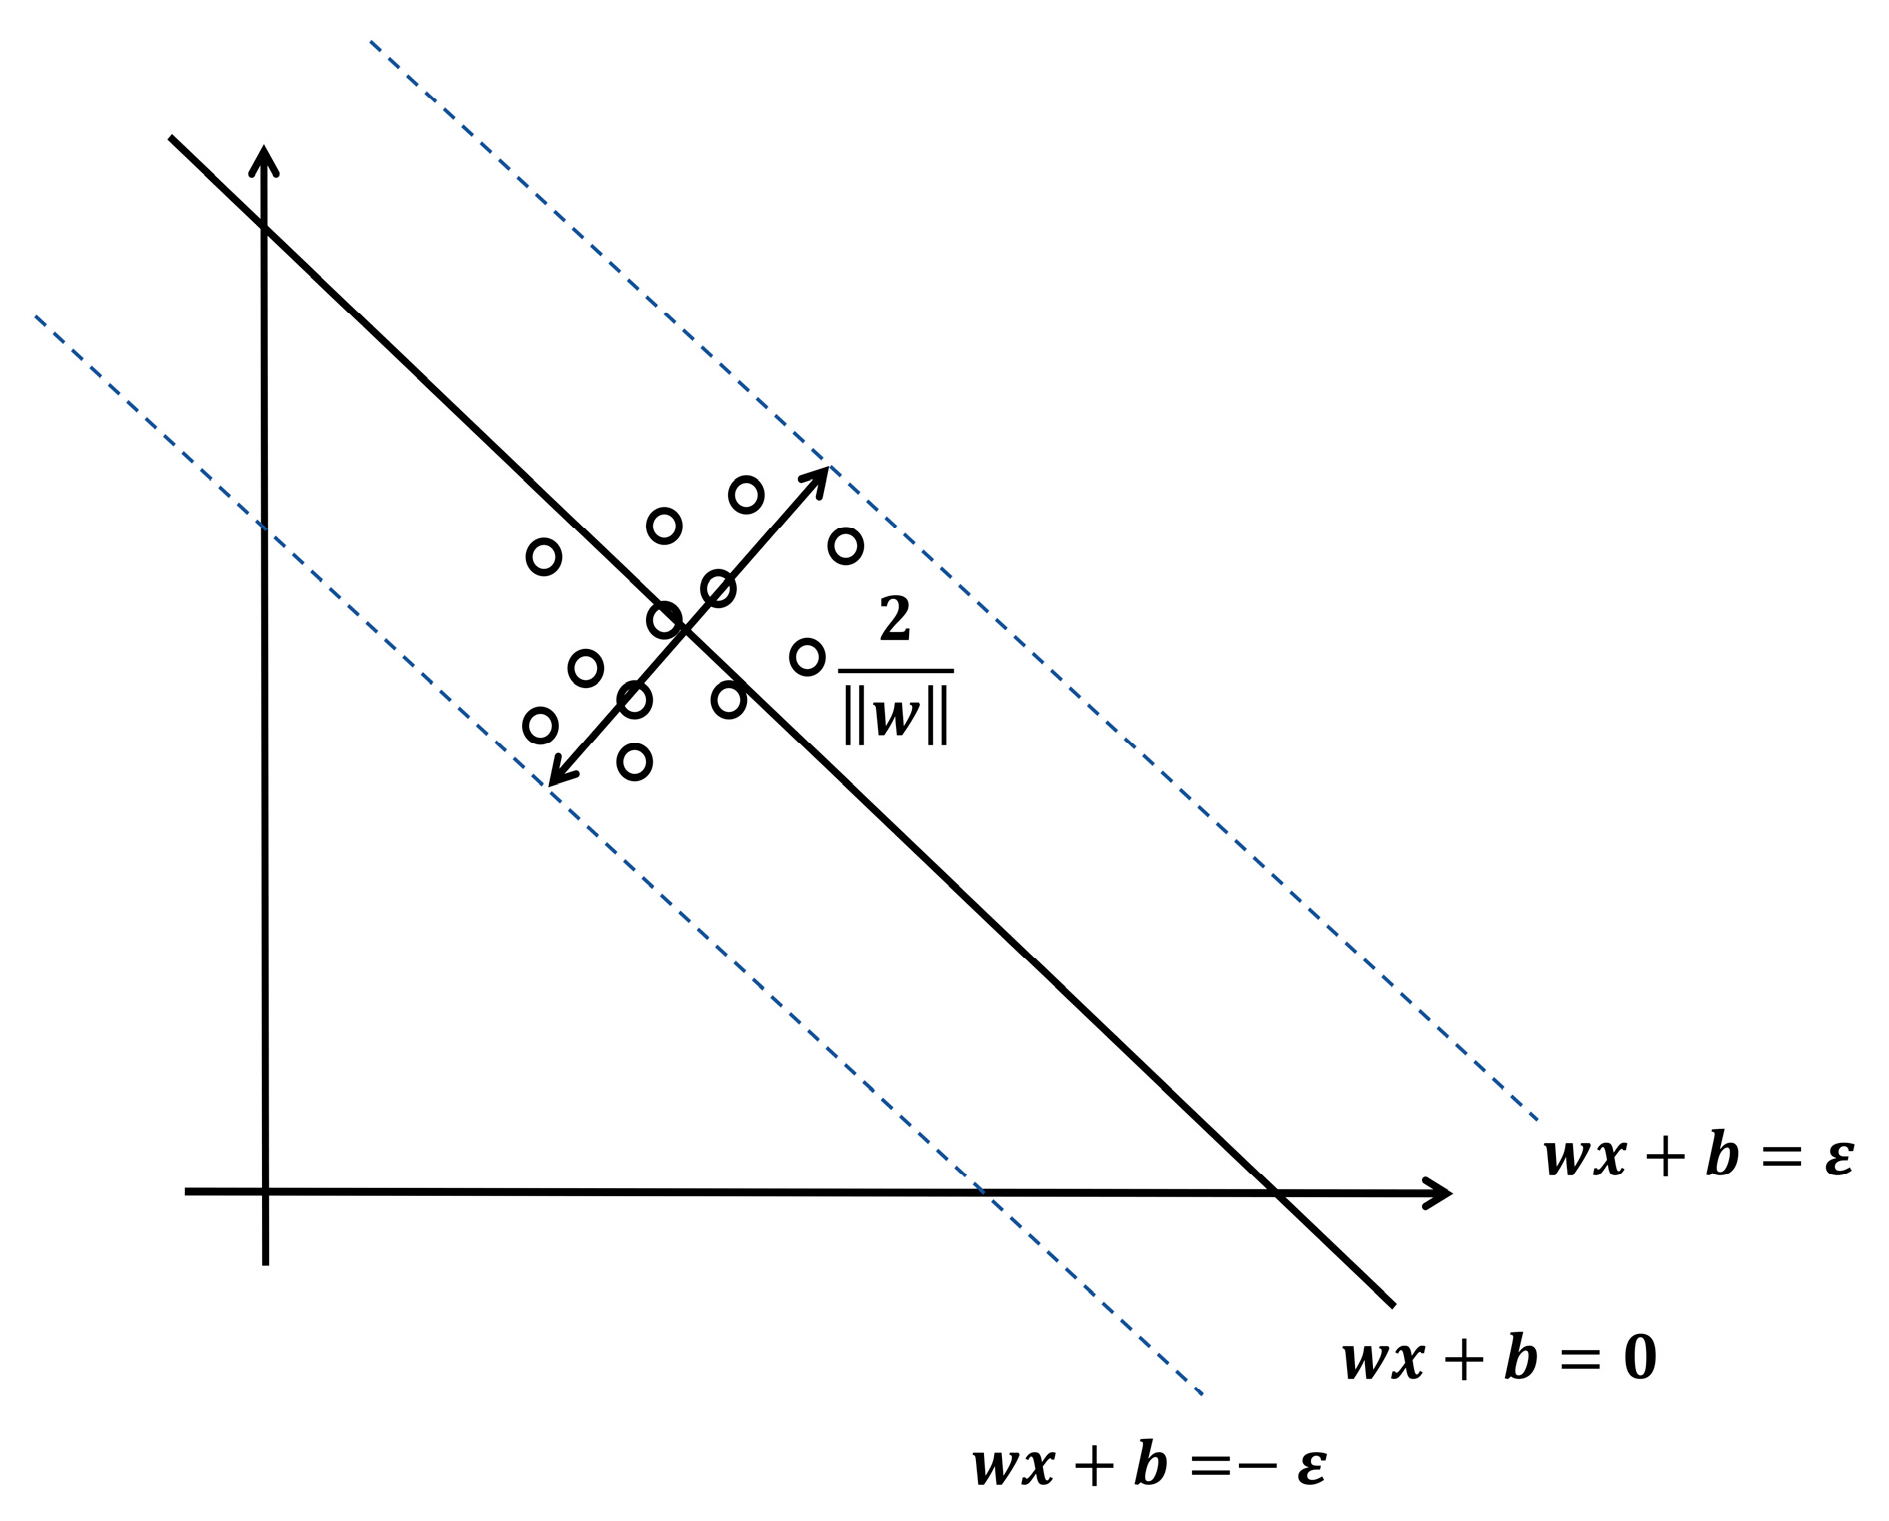
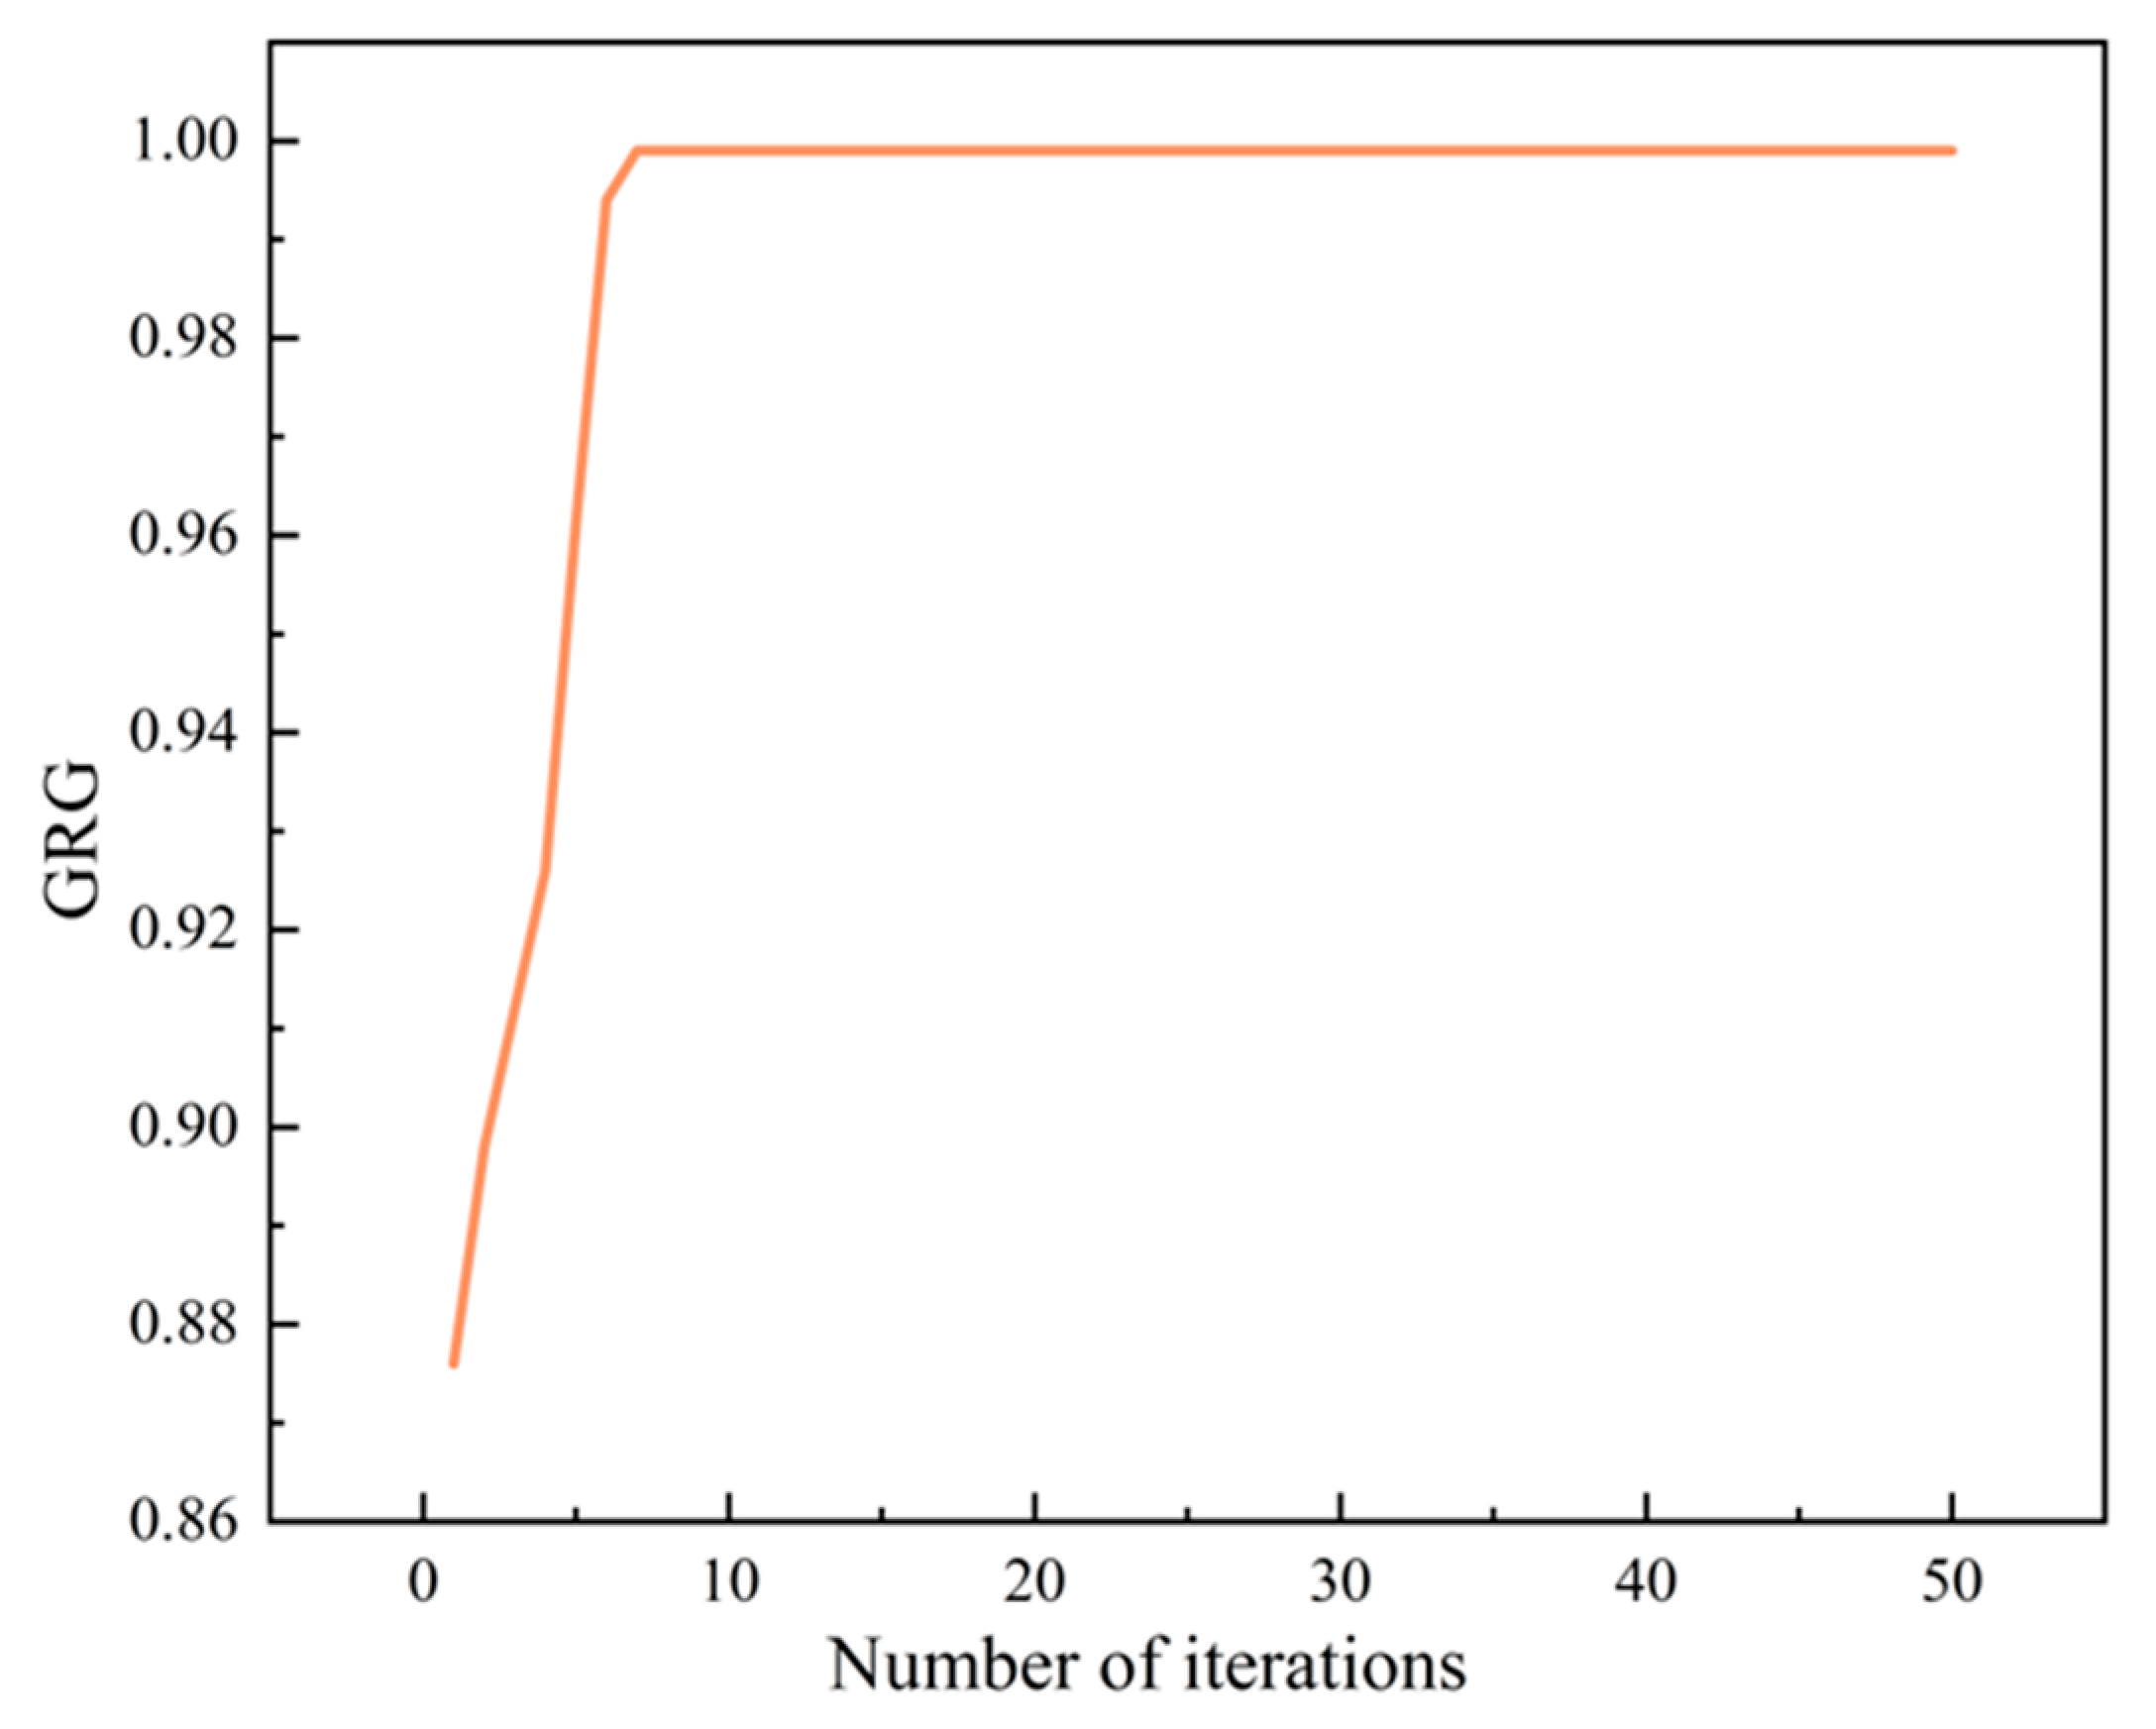
2.6.1. Support Vector Machine Regression Algorithm
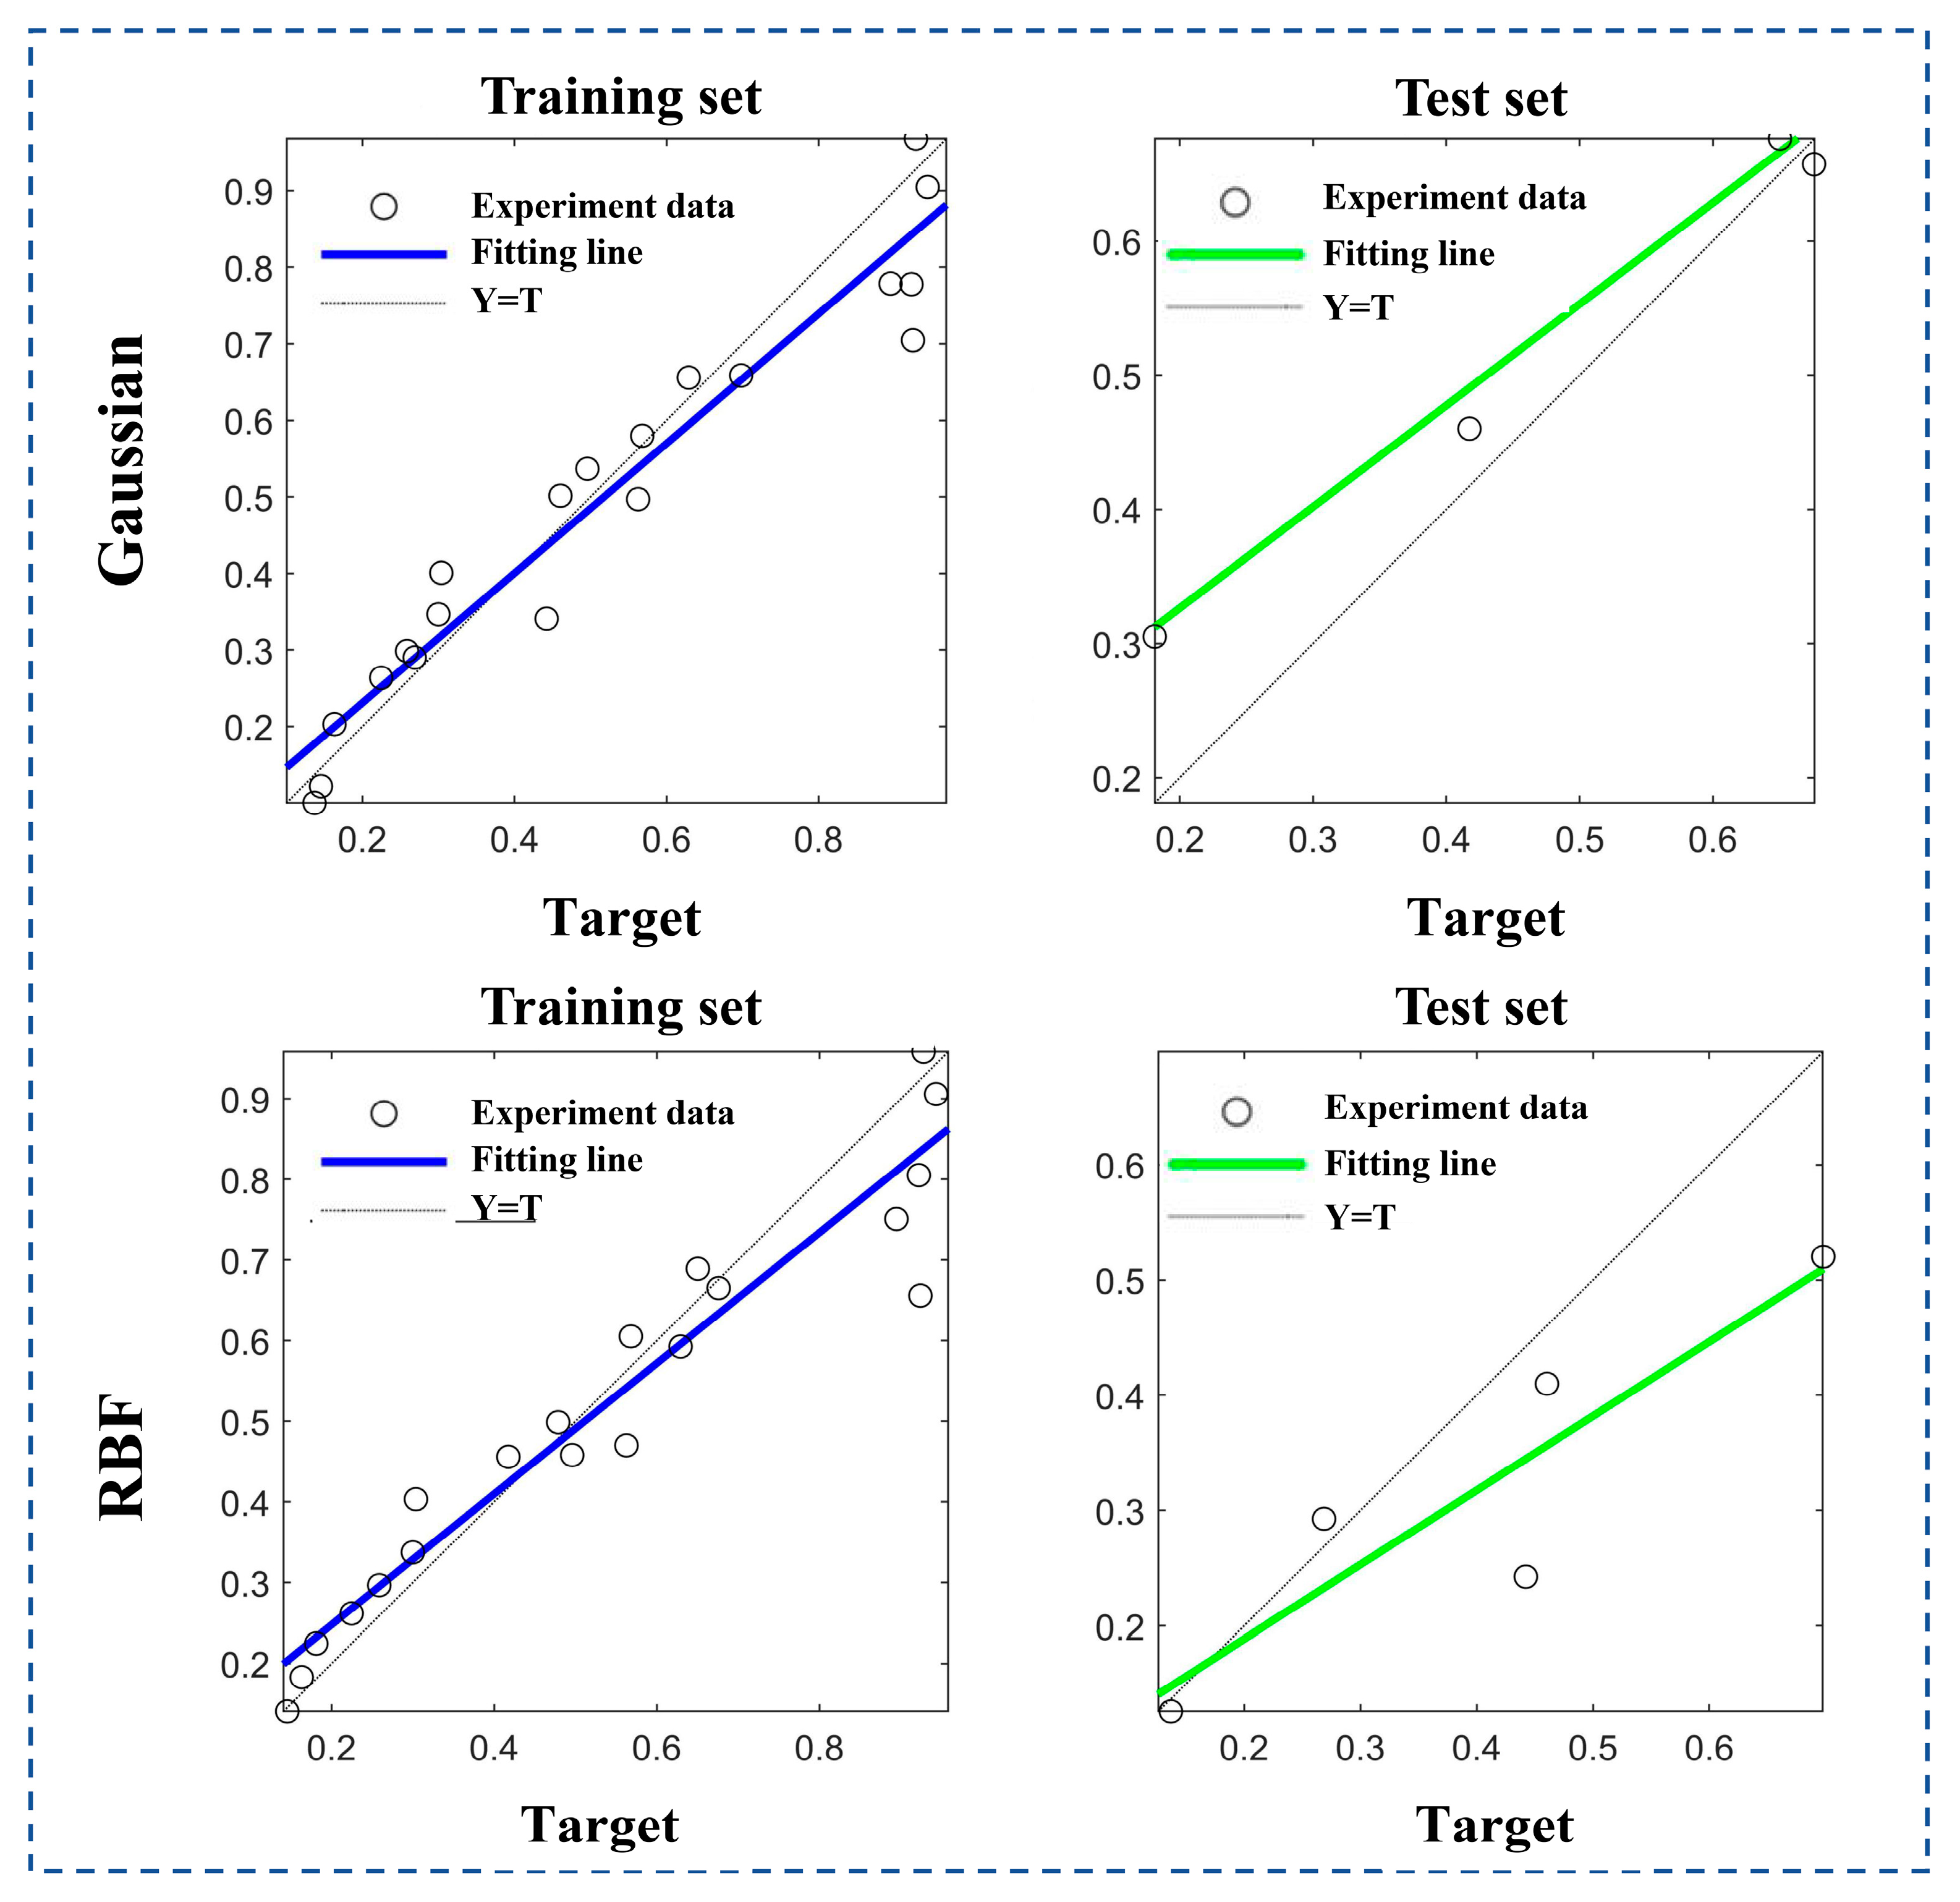
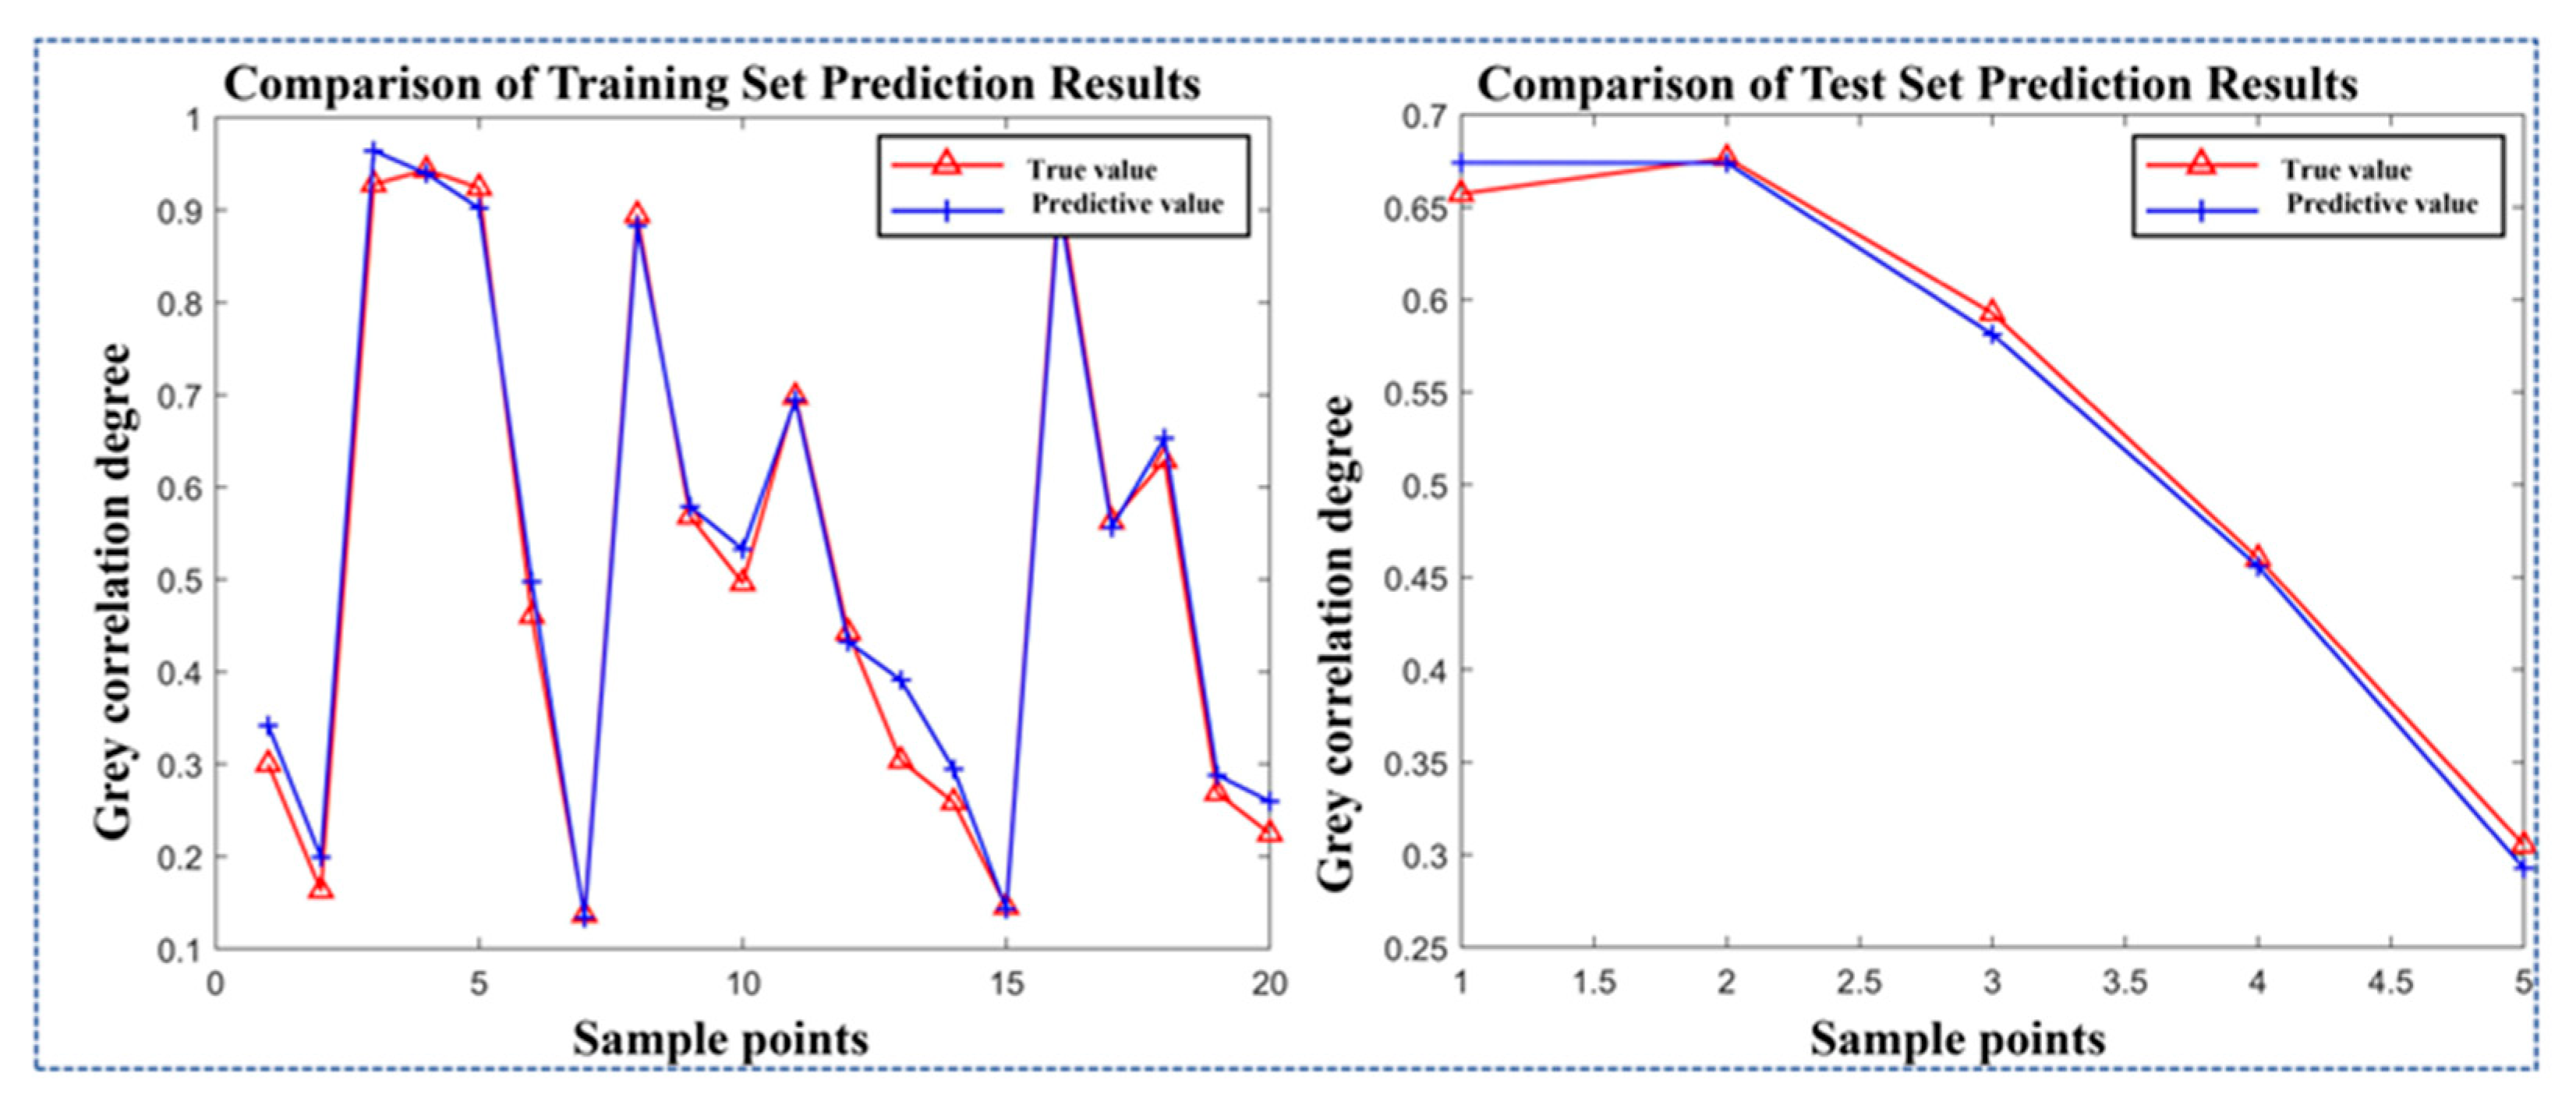
2.6.2. Development of the Response Model
2.7. Optimization of Optimal Process Parameter Combination
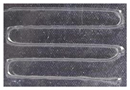
2.8. Optimal Printing Process Validation
2.8.1. Printing Preparation
2.8.2. Comparison Experiment
3. Conclusions
Author Contributions
Funding
Institutional Review Board Statement
Informed Consent Statement
Data Availability Statement
Conflicts of Interest
References
- Landers, R.; Hübner, U.; Schmelzeisen, R.; Mülhaupt, R. Rapid Prototyping of Scaffolds Derived from Thermoreversible Hydrogels and Tailored for Applications in Tissue Engineering. Biomaterials 2002, 23, 4437–4447. [Google Scholar] [CrossRef] [PubMed]
- Tuan, R.S.; Boland, G.; Tuli, R. Adult Mesenchymal Stem Cells and Cell-Based Tissue Engineering. Arthritis Res. Ther. 2003, 5, 32–45. [Google Scholar] [CrossRef] [PubMed]
- Zhang, W.; Ullah, I.; Shi, L.; Zhang, Y.; Ou, H.; Zhou, J.; Ullah, M.W.; Zhang, X.; Li, W. Fabrication and Characterization of Porous Polycaprolactone Scaffold via Extrusion-Based Cryogenic 3D Printing for Tissue Engineering. Mater. Des. 2019, 180, 107946. [Google Scholar] [CrossRef]
- Yoon, S.; Park, J.A.; Lee, H.-R.; Yoon, W.H.; Hwang, D.S.; Jung, S. Inkjet-Spray Hybrid Printing for 3D Freeform Fabrication of Multilayered Hydrogel Structures. Adv. Healthc. Mater. 2018, 7, 1800050. [Google Scholar] [CrossRef] [PubMed]
- Rimann, M.; Bono, E.; Annaheim, H.; Bleisch, M.; Graf-Hausner, U. Standardized 3D Bioprinting of Soft Tissue Models with Human Primary Cells. JALA 2016, 21, 496–509. [Google Scholar] [CrossRef] [PubMed]
- Soleymani Eil Bakhtiari, S.; Bakhsheshi-Rad, H.R.; Karbasi, S.; Razzaghi, M.; Tavakoli, M.; Ismail, A.F.; Sharif, S.; RamaKrishna, S.; Chen, X.; Berto, F. 3-Dimensional Printing of Hydrogel-Based Nanocomposites: A Comprehensive Review on the Technology Description, Properties, and Applications. Adv. Eng. Mater. 2021, 23, 2100477. [Google Scholar] [CrossRef]
- Mandrycky, C.; Wang, Z.; Kim, K.; Kim, D.-H. 3D Bioprinting for Engineering Complex Tissues. Biotechnol. Adv. 2016, 34, 422–434. [Google Scholar] [CrossRef] [PubMed]
- Derakhshanfar, S.; Mbeleck, R.; Xu, K.; Zhang, X.; Zhong, W.; Xing, M. 3D Bioprinting for Biomedical Devices and Tissue Engineering: A Review of Recent Trends and Advances. Bioact. Mater. 2018, 3, 144–156. [Google Scholar] [CrossRef] [PubMed]
- Chen, X.; Zhang, H.; Cui, J.; Wang, Y.; Li, M.; Zhang, J.; Wang, C.; Liu, Z.; Wei, Q. Enhancing Conductivity and Self-Healing Properties of PVA/GEL/OSA Composite Hydrogels by GO/SWNTs for Electronic Skin. Gels 2023, 9, 155. [Google Scholar] [CrossRef] [PubMed]
- Li, B.; Huang, C.; Wang, Z.; Shi, Z.; Xu, L.; Huang, S.; Qu, M.; Xu, Z.; Zhang, D.; Guo, B.; et al. Modeling of Extrusion 3D Bioprinting Precision Considering the Non-Newtonian Rheological Dynamics of Gelatin-Chitosan Hydrogels. ACS Appl. Polym. Mater. 2025, 7, 1257–1270. [Google Scholar] [CrossRef]
- Gao, T.; Gillispie, G.J.; Copus, J.S.; Pr, A.K.; Seol, Y.-J.; Atala, A.; Yoo, J.J.; Lee, S.J. Optimization of Gelatin-Alginate Composite Bioink Printability Using Rheological Parameters: A Systematic Approach. Biofabrication 2018, 10, 034106. [Google Scholar] [CrossRef] [PubMed]
- Ning, L.; Mehta, R.; Cao, C.; Theus, A.; Tomov, M.; Zhu, N.; Weeks, E.R.; Bauser-Heaton, H.; Serpooshan, V. Embedded 3D Bioprinting of Gelatin Methacryloyl-Based Constructs with Highly Tunable Structural Fidelity. ACS Appl. Mater. Interfaces 2020, 12, 44563–44577. [Google Scholar] [CrossRef] [PubMed]
- Kim, J.H.; Yoo, J.J.; Lee, S.J. Three-Dimensional Cell-Based Bioprinting for Soft Tissue Regeneration. Tissue Eng. Regen. Med. 2016, 13, 647–662. [Google Scholar] [CrossRef] [PubMed]
- Tao, Y.; Du, J.; Hu, T.; Li, P.; Pan, L.; Kong, F.; Zhang, J. A Case Study on Fish Gelatin/Microcrystalline Cellulose Biomaterial Inks for Extrusion-Based Bioprinting. Gels 2025, 11, 458. [Google Scholar] [CrossRef] [PubMed]
- Shi, Y.; Xing, T.L.; Zhang, H.B.; Yin, R.X.; Yang, S.M.; Wei, J.; Zhang, W.J. Tyrosinase-Doped Bioink for 3D Bioprinting of Living Skin Constructs. Biomed. Mater. 2018, 13, 035008. [Google Scholar] [CrossRef] [PubMed]
- Shin, S.; Park, S.; Park, M.; Jeong, E.; Na, K.; Youn, H.J.; Hyun, J. Cellulose Nanofibers for the Enhancement of Printability of Low Viscosity Gelatin Derivatives. Bioresources 2017, 12, 2941–2954. [Google Scholar] [CrossRef]
- Ibanez, R.I.R.; Do Amaral, R.J.F.C.; Simpson, C.R.; Casey, S.M.; Reis, R.L.; Marques, A.P.; Murphy, C.M.; O’Brien, F.J. 3D Printed Scaffolds Incorporated with Platelet-Rich Plasma Show Enhanced Angiogenic Potential While Not Inducing Fibrosis. Adv. Funct. Mater. 2022, 32, 2109915. [Google Scholar] [CrossRef]
- Wei, Q.; An, Y.; Zhao, X.; Li, M.; Zhang, J. Three-Dimensional Bioprinting of Tissue-Engineered Skin: Biomaterials, Fabrication Techniques, Challenging Difficulties, and Future Directions: A Review. Int. J. Biol. Macromol. 2024, 266, 131281. [Google Scholar] [CrossRef] [PubMed]
- Li, M.; Wang, Y.; Wei, Q.; Zhang, J.; Chen, X.; An, Y. A High-Stretching, Rapid-Self-Healing, and Printable Composite Hydrogel Based on Poly(Vinyl Alcohol), Nanocellulose, and Sodium Alginate. Gels 2024, 10, 258. [Google Scholar] [CrossRef] [PubMed]
- Park, J.; Lee, S.J.; Chung, S.; Lee, J.H.; Kim, W.D.; Lee, J.Y.; Park, S.A. Cell-Laden 3D Bioprinting Hydrogel Matrix Depending on Different Compositions for Soft Tissue Engineering: Characterization and Evaluation. Mater. Sci. Eng. C Mater. Biol. Appl. 2017, 71, 678–684. [Google Scholar] [CrossRef] [PubMed]
- Tabriz, A.G.; Hermida, M.A.; Leslie, N.R.; Shu, W. Three-Dimensional Bioprinting of Complex Cell Laden Alginate Hydrogel Structures. Biofabrication 2015, 7, 045012. [Google Scholar] [CrossRef] [PubMed]
- Nashchekina, Y.; Militsina, A.; Elokhovskiy, V.; Ivan’kova, E.; Nashchekin, A.; Kamalov, A.; Yudin, V. Precisely Printable Silk Fibroin/Carboxymethyl Cellulose/Alginate Bioink for 3D Printing. Polymers 2024, 16, 1027. [Google Scholar] [CrossRef] [PubMed]
- Fratini, C.; Weaver, E.; Moroni, S.; Irwin, R.; Bashi, Y.H.D.; Uddin, S.; Casettari, L.; Wylie, M.P.; Lamprou, D.A. Combining Microfluidics and Coaxial 3D-Bioprinting for the Manufacturing of Diabetic Wound Healing Dressings. Biomater. Adv. 2023, 153, 213557. [Google Scholar] [CrossRef] [PubMed]
- Khalil, S.; Sun, W. Biopolymer Deposition for Freeform Fabrication of Hydrogel Tissue Constructs. Mater. Sci. Eng. C-Biomim. Supramol. Syst. 2007, 27, 469–478. [Google Scholar] [CrossRef]
- Suntornnond, R.; Tan, E.Y.S.; An, J.; Chua, C.K. A Mathematical Model on the Resolution of Extrusion Bioprinting for the Development of New Bioinks. Materials 2016, 9, 756. [Google Scholar] [CrossRef] [PubMed]
- Feng, C.; Zhou, J.; Xu, X.; Jiang, Y.; Shi, H.; Zhao, G. Research on 3-D Bio-Printing Molding Technology of Tissue Engineering Scaffold by Nanocellulose/Gelatin Hydrogel Composite. BioResources 2019, 14, 9244–9257. [Google Scholar] [CrossRef]
- Tu, Y.; Arrieta-Escobar, J.A.; Hassan, A.; Zaman, U.K.U.; Siadat, A.; Yang, G. Optimizing Process Parameters of Direct Ink Writing for Dimensional Accuracy of Printed Layers. 3D Print. Addit. Manuf. 2023, 10, 816–827. [Google Scholar] [CrossRef]
- Jin, Y.; Compaan, A.; Bhattacharjee, T.; Huang, Y. Granular Gel Support-Enabled Extrusion of Three-Dimensional Alginate and Cellular Structures. Biofabrication 2016, 8, 025016. [Google Scholar] [CrossRef] [PubMed]
- Soltan, N.; Ning, L.; Mohabatpour, F.; Papagerakis, P.; Chen, X. Printability and Cell Viability in Bioprinting Alginate Dialdehyde-Gelatin Scaffolds. ACS Biomater. Sci. Eng. 2019, 5, 2976–2987. [Google Scholar] [CrossRef] [PubMed]
- Arjoca, S.; Bojin, F.; Neagu, M.; Paunescu, A.; Neagu, A.; Paunescu, V. Hydrogel Extrusion Speed Measurements for the Optimization of Bioprinting Parameters. Gels 2024, 10, 103. [Google Scholar] [CrossRef] [PubMed]
- Tian, S.; Stevens, R.; McInnes, B.; Lewinski, N. Machine Assisted Experimentation of Extrusion-Based Bioprinting Systems. Micromachines 2021, 12, 780. [Google Scholar] [CrossRef] [PubMed]
- Xiao, H.; Han, W.; Ming, Y.; Ding, Z.; Duan, Y. A Sensitivity Analysis-Based Parameter Optimization Framework for 3D Printing of Continuous Carbon Fiber/Epoxy Composites. Materials 2019, 12, 3961. [Google Scholar] [CrossRef] [PubMed]
- Comminal, R.; Serdeczny, M.P.; Pedersen, D.B.; Spangenberg, J. Numerical Modeling of the Strand Deposition Flow in Extrusion-Based Additive Manufacturing. Addit. Manuf. 2018, 20, 68–76. [Google Scholar] [CrossRef]
- Comminal, R.; Pimenta, F.; Hattel, J.H.; Alves, M.A.; Spangenberg, J. Numerical Simulation of the Planar Extrudate Swell of Pseudoplastic and Viscoelastic Fluids with the Streamfunction and the VOF Methods. J. Non-Newton. FLUID Mech. 2018, 252, 1–18. [Google Scholar] [CrossRef]
- Gong, X.; Wen, Z.; Liang, Z.; Xiao, H.; Lee, S.; Rossello-Martinez, A.; Xing, Q.; Wright, T.; Nguyen, R.Y.; Mak, M. Instant Assembly of Collagen for Tissue Engineering and Bioprinting. Nat. Mater. 2025. [Google Scholar] [CrossRef] [PubMed]
- Li, L.; McGuan, R.; Isaac, R.; Kavehpour, P.; Candler, R. Improving Precision of Material Extrusion 3D Printing by In-Situ Monitoring & Predicting 3D Geometric Deviation Using Conditional Adversarial Networks. Addit. Manuf. 2021, 38, 101695. [Google Scholar] [CrossRef]
- Li, J.; Wu, C.; Chu, P.K.; Gelinsky, M. 3D Printing of Hydrogels: Rational Design Strategies and Emerging Biomedical Applications. Mater. Sci. Eng. R Rep. 2020, 140, 100543. [Google Scholar] [CrossRef]
- Wei, Q.; An, Y.; Zhao, X.; Li, M.; Zhang, J.; Cui, N. Optimal Design of Multi-Biomaterials Mixed Extrusion Nozzle for 3D Bioprinting Considering Cell Activity. Virtual Phys. Prototyp. 2025, 20, e2438897. [Google Scholar] [CrossRef]
- Meissner, P.; Watschke, H.; Winter, J.; Vietor, T. Artificial Neural Networks-Based Material Parameter Identification for Numerical Simulations of Additively Manufactured Parts by Material Extrusion. Polymers 2020, 12, 2949. [Google Scholar] [CrossRef] [PubMed]
- John, J.; Devjani, D.; Ali, S.; Abdallah, S.; Pervaiz, S. Optimization of 3D Printed Polylactic Acid Structures with Different Infill Patterns Using Taguchi-Grey Relational Analysis. Adv. Ind. Eng. Polym. Res. 2023, 6, 62–78. [Google Scholar] [CrossRef]
- Roy, A.; Chakraborty, S. Support Vector Machine in Structural Reliability Analysis: A Review. Reliab. Eng. Syst. Saf. 2023, 233, 109126. [Google Scholar] [CrossRef]
- Ben Chaabene, W.; Flah, M.; Nehdi, M.L. Machine Learning Prediction of Mechanical Properties of Concrete: Critical Review. Constr. Build. Mater. 2020, 260, 119889. [Google Scholar] [CrossRef]
- Limon, S.M.; Quigley, C.; Sarah, R.; Habib, A. Advancing Scaffold Porosity through a Machine Learning Framework in Extrusion Based 3D Bioprinting. Front. Mater. 2024, 10, 1337485. [Google Scholar] [CrossRef]
- van Zyl, J.-P.; Engelbrecht, A.P. Set-Based Particle Swarm Optimisation: A Review. Mathematics 2023, 11, 2980. [Google Scholar] [CrossRef]
- Jain, M.; Saihjpal, V.; Singh, N.; Singh, S.B. An Overview of Variants and Advancements of PSO Algorithm. Appl. Sci. 2022, 12, 8392. [Google Scholar] [CrossRef]
- Tang, J.; Liu, G.; Pan, Q. A Review on Representative Swarm Intelligence Algorithms for Solving Optimization Problems: Applications and Trends. IEEE/CAA J. Autom. Sin. 2021, 8, 1627–1643. [Google Scholar] [CrossRef]


| Level Value | Factor | |||
|---|---|---|---|---|
| d (mm) | h (mm) | (mm/s) | (mm/s) | |
| 1 | 0.31 | 0.2 | 6 | 6 |
| 2 | 0.45 | 0.4 | 7 | 7 |
| 3 | 0.60 | 0.6 | 8 | 8 |
| 4 | 0.75 | 0.8 | 9 | 9 |
| 5 | 0.84 | 1 | 10 | 10 |
| d = 0.31 | D (mm) | d = 0.45 | D (mm) | d = 0.60 | D (mm) | d = 0.75 | D (mm) | d = 0.84 | D (mm) |
|---|---|---|---|---|---|---|---|---|---|
 | 0.343 |  | 0.510 |  | 0.670 |  | 0.817 |  | 1.025 |
 | 0.332 |  | 0.540 |  | 0.650 |  | 0.767 |  | 0.867 |
 | 0.322 |  | 0.549 |  | 0.660 |  | 0.800 |  | 0.894 |
 | 0.34 |  | 0.468 |  | 0.610 |  | 0.767 |  | 1.000 |
 | 0.325 |  | 0.462 |  | 0.690 |  | 0.850 |  | 0.921 |
| d = 0.31 | W (mm) | d = 0.45 | W (mm) | D = 0.60 | W (mm) | d = 0.75 | W (mm) | d = 0.84 | W (mm) |
|---|---|---|---|---|---|---|---|---|---|
 | 0.551 |  | 1.043 | 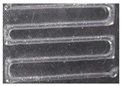 | 1.595 | 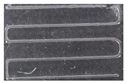 | 1.246 |  | 1.569 |
 | 0.385 |  | 0.717 |  | 0.940 | 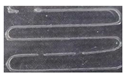 | 1.361 | 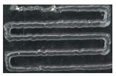 | 1.562 |
 | 0.739 | 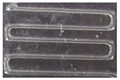 | 0.780 | 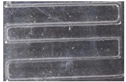 | 1.113 | 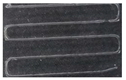 | 1.125 | 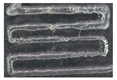 | 1.509 |
 | 0.409 |  | 0.612 | 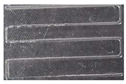 | 0.734 |  | 1.475 | 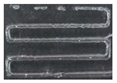 | 1.634 |
 | 0.444 |  | 0.853 | 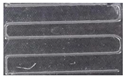 | 0.883 | 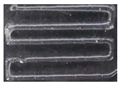 | 1.486 |  | 1.426 |
| Serial Number | Factor | Result | ||||
|---|---|---|---|---|---|---|
| d (mm) | H (mm) | (mm/s) | (mm/s) | (%) | (%) | |
| 1 | 1 | 2 | 5 | 3 | 110.71 | 62.24 |
| 2 | 1 | 3 | 4 | 5 | 107.14 | 86.16 |
| 3 | 1 | 1 | 1 | 1 | 102.38 | 43.57 |
| 4 | 1 | 4 | 3 | 2 | 109.52 | 83.16 |
| 5 | 1 | 5 | 2 | 4 | 104.76 | 73.16 |
| 6 | 2 | 2 | 4 | 2 | 113.33 | 48.91 |
| 7 | 2 | 3 | 3 | 4 | 120.00 | 62.31 |
| 8 | 2 | 4 | 2 | 1 | 122.67 | 70.36 |
| 9 | 2 | 1 | 5 | 5 | 104 | 13.69 |
| 10 | 2 | 5 | 1 | 3 | 102.67 | 60.36 |
| 11 | 3 | 1 | 4 | 4 | 111.67 | 42.36 |
| 12 | 3 | 4 | 1 | 5 | 108.33 | 69.16 |
| 13 | 3 | 2 | 3 | 1 | 110 | 59.31 |
| 14 | 3 | 5 | 5 | 2 | 101.67 | 83.14 |
| 15 | 3 | 3 | 2 | 3 | 115 | 78.16 |
| 16 | 4 | 1 | 3 | 3 | 108.89 | 23.36 |
| 17 | 4 | 2 | 2 | 5 | 102.22 | 31.12 |
| 18 | 4 | 4 | 5 | 4 | 106.67 | 53.16 |
| 19 | 4 | 3 | 1 | 2 | 102.22 | 59.67 |
| 20 | 4 | 5 | 4 | 1 | 113.33 | 63.33 |
| 21 | 5 | 1 | 2 | 2 | 122.58 | 35.68 |
| 22 | 5 | 2 | 1 | 4 | 103.23 | 59.36 |
| 23 | 5 | 4 | 4 | 3 | 106.45 | 59.24 |
| 24 | 5 | 5 | 3 | 5 | 119.35 | 66.12 |
| 25 | 5 | 3 | 5 | 1 | 109.68 | 40.1 |
| Parameter | Factor | |||
|---|---|---|---|---|
| d (mm) | h (mm) | v1 (mm/s) | v2 (mm/s) | |
| 112.268 | 109.90 | 103.77 | 111.61 | |
| 106.67 | 107.90 | 113.46 | 106.64 | |
| 109.33 | 110.78 | 113.55 | 108.74 | |
| 125.34 | 110.73 | 109.74 | 116.13 | |
| 106.92 | 108.36 | 106.55 | 104.67 | |
| 18.67 | 2.88 | 9.66 | 11.46 | |
| 43.75% | 6.75% | 22.64% | 26.86% | |
| Parameter | Factor | |||
|---|---|---|---|---|
| d (mm) | h (mm) | v1 (mm/s) | v2 (mm/s) | |
| 69.658 | 31.712 | 54.57 | 38.16 | |
| 51.09 | 52.188 | 63.34 | 55.34 | |
| 53.63 | 65.28 | 58.85 | 56.67 | |
| 46.12 | 67.02 | 60 | 58.07 | |
| 33.68 | 69.22 | 50.46 | 62.112 | |
| 35.978 | 37.51 | 12.88 | 23.95 | |
| 32.61% | 34% | 11.68% | 21.71% | |
| Serial Number | Result | ||
|---|---|---|---|
| GRG | |||
| 1 | 0.4675 | 0.60236 | 0.562589786 |
| 2 | 0.40338 | 1.00000 | 0.824056762 |
| 3 | 0.34102 | 0.45969 | 0.424694217 |
| 4 | 0.44397 | 0.92353 | 0.782107756 |
| 5 | 0.36959 | 0.93597 | 0.627924538 |
| 6 | 0.52923 | 0.49309 | 0.503747686 |
| 7 | 0.79727 | 0.60306 | 0.660332529 |
| 8 | 1 | 0.69636 | 0.785903436 |
| 9 | 0.35996 | 0.33333 | 0.341183187 |
| 10 | 0.34426 | 0.98411 | 0.513378235 |
| 11 | 0.48837 | 0.45274 | 0.463247287 |
| 12 | 0.4227 | 0.68066 | 0.604587596 |
| 13 | 0.45317 | 0.57438 | 0.538635171 |
| 14 | 0.33333 | 0.92307 | 0.749155674 |
| 15 | 0.57787 | 0.81915 | 0.747996528 |
| 16 | 0.43245 | 0.36588 | 0.385511493 |
| 17 | 0.33926 | 0.39699 | 0.379965423 |
| 18 | 0.39623 | 0.52336 | 0.485869363 |
| 19 | 0.33926 | 0.57768 | 0.507369942 |
| 20 | 0.52923 | 0.61347 | 0.588627624 |
| 21 | 0.99149 | 0.41786 | 0.587023487 |
| 22 | 0.3507 | 0.57484 | 0.508741114 |
| 23 | 0.39296 | 0.57375 | 0.520435029 |
| 24 | 0.75976 | 0.64389 | 0.678060063 |
| 25 | 0.447 | 0.44031 | 0.442282881 |
| Fitting Effect () | Rms Error (RMSE) | Average Absolute Error (MSA) | ||
|---|---|---|---|---|
| Gaussian function | Training set | 0.922 | 0.061 | 0.079 |
| Test set | 0.805 | 0.065 | 0.079 | |
| RBF | Training set | 0.907 | 0.059 | 0.084 |
| Test set | 0.586 | 0.926 | 0.122 | |
| d | h | |||
|---|---|---|---|---|
| Random set 1 | 0.45 mm | 0.2 mm | 4 mm/s | 8 mm/s |
| Random set 2 | 0.84 mm | 0.4 mm | 10 mm/s | 5 mm/s |
| Optimize combinations set | 0.6 mm | 0.3 mm | 8 mm/s | 8 mm/s |
Disclaimer/Publisher’s Note: The statements, opinions and data contained in all publications are solely those of the individual author(s) and contributor(s) and not of MDPI and/or the editor(s). MDPI and/or the editor(s) disclaim responsibility for any injury to people or property resulting from any ideas, methods, instructions or products referred to in the content. |
© 2025 by the authors. Licensee MDPI, Basel, Switzerland. This article is an open access article distributed under the terms and conditions of the Creative Commons Attribution (CC BY) license (https://creativecommons.org/licenses/by/4.0/).
Share and Cite
Chai, W.; An, Y.; Wang, X.; Yang, Z.; Wei, Q. Optimization of SA-Gel Hydrogel Printing Parameters for Extrusion-Based 3D Bioprinting. Gels 2025, 11, 552. https://doi.org/10.3390/gels11070552
Chai W, An Y, Wang X, Yang Z, Wei Q. Optimization of SA-Gel Hydrogel Printing Parameters for Extrusion-Based 3D Bioprinting. Gels. 2025; 11(7):552. https://doi.org/10.3390/gels11070552
Chicago/Turabian StyleChai, Weihong, Yalong An, Xingli Wang, Zhe Yang, and Qinghua Wei. 2025. "Optimization of SA-Gel Hydrogel Printing Parameters for Extrusion-Based 3D Bioprinting" Gels 11, no. 7: 552. https://doi.org/10.3390/gels11070552
APA StyleChai, W., An, Y., Wang, X., Yang, Z., & Wei, Q. (2025). Optimization of SA-Gel Hydrogel Printing Parameters for Extrusion-Based 3D Bioprinting. Gels, 11(7), 552. https://doi.org/10.3390/gels11070552