
Dynamic Simulation of Nano-Gel Microspheres for Plugging Preferential Flow Channels and Enhancing Oil Recovery in Waterflooded Reservoirs

 ,
,
Abstract
1. Introduction
2. Results and Discussion
2.1. Numerical Simulation of PFCs in Waterflooding Development
2.1.1. Coupled Simulation Setup for PFC Evolution
- (1)
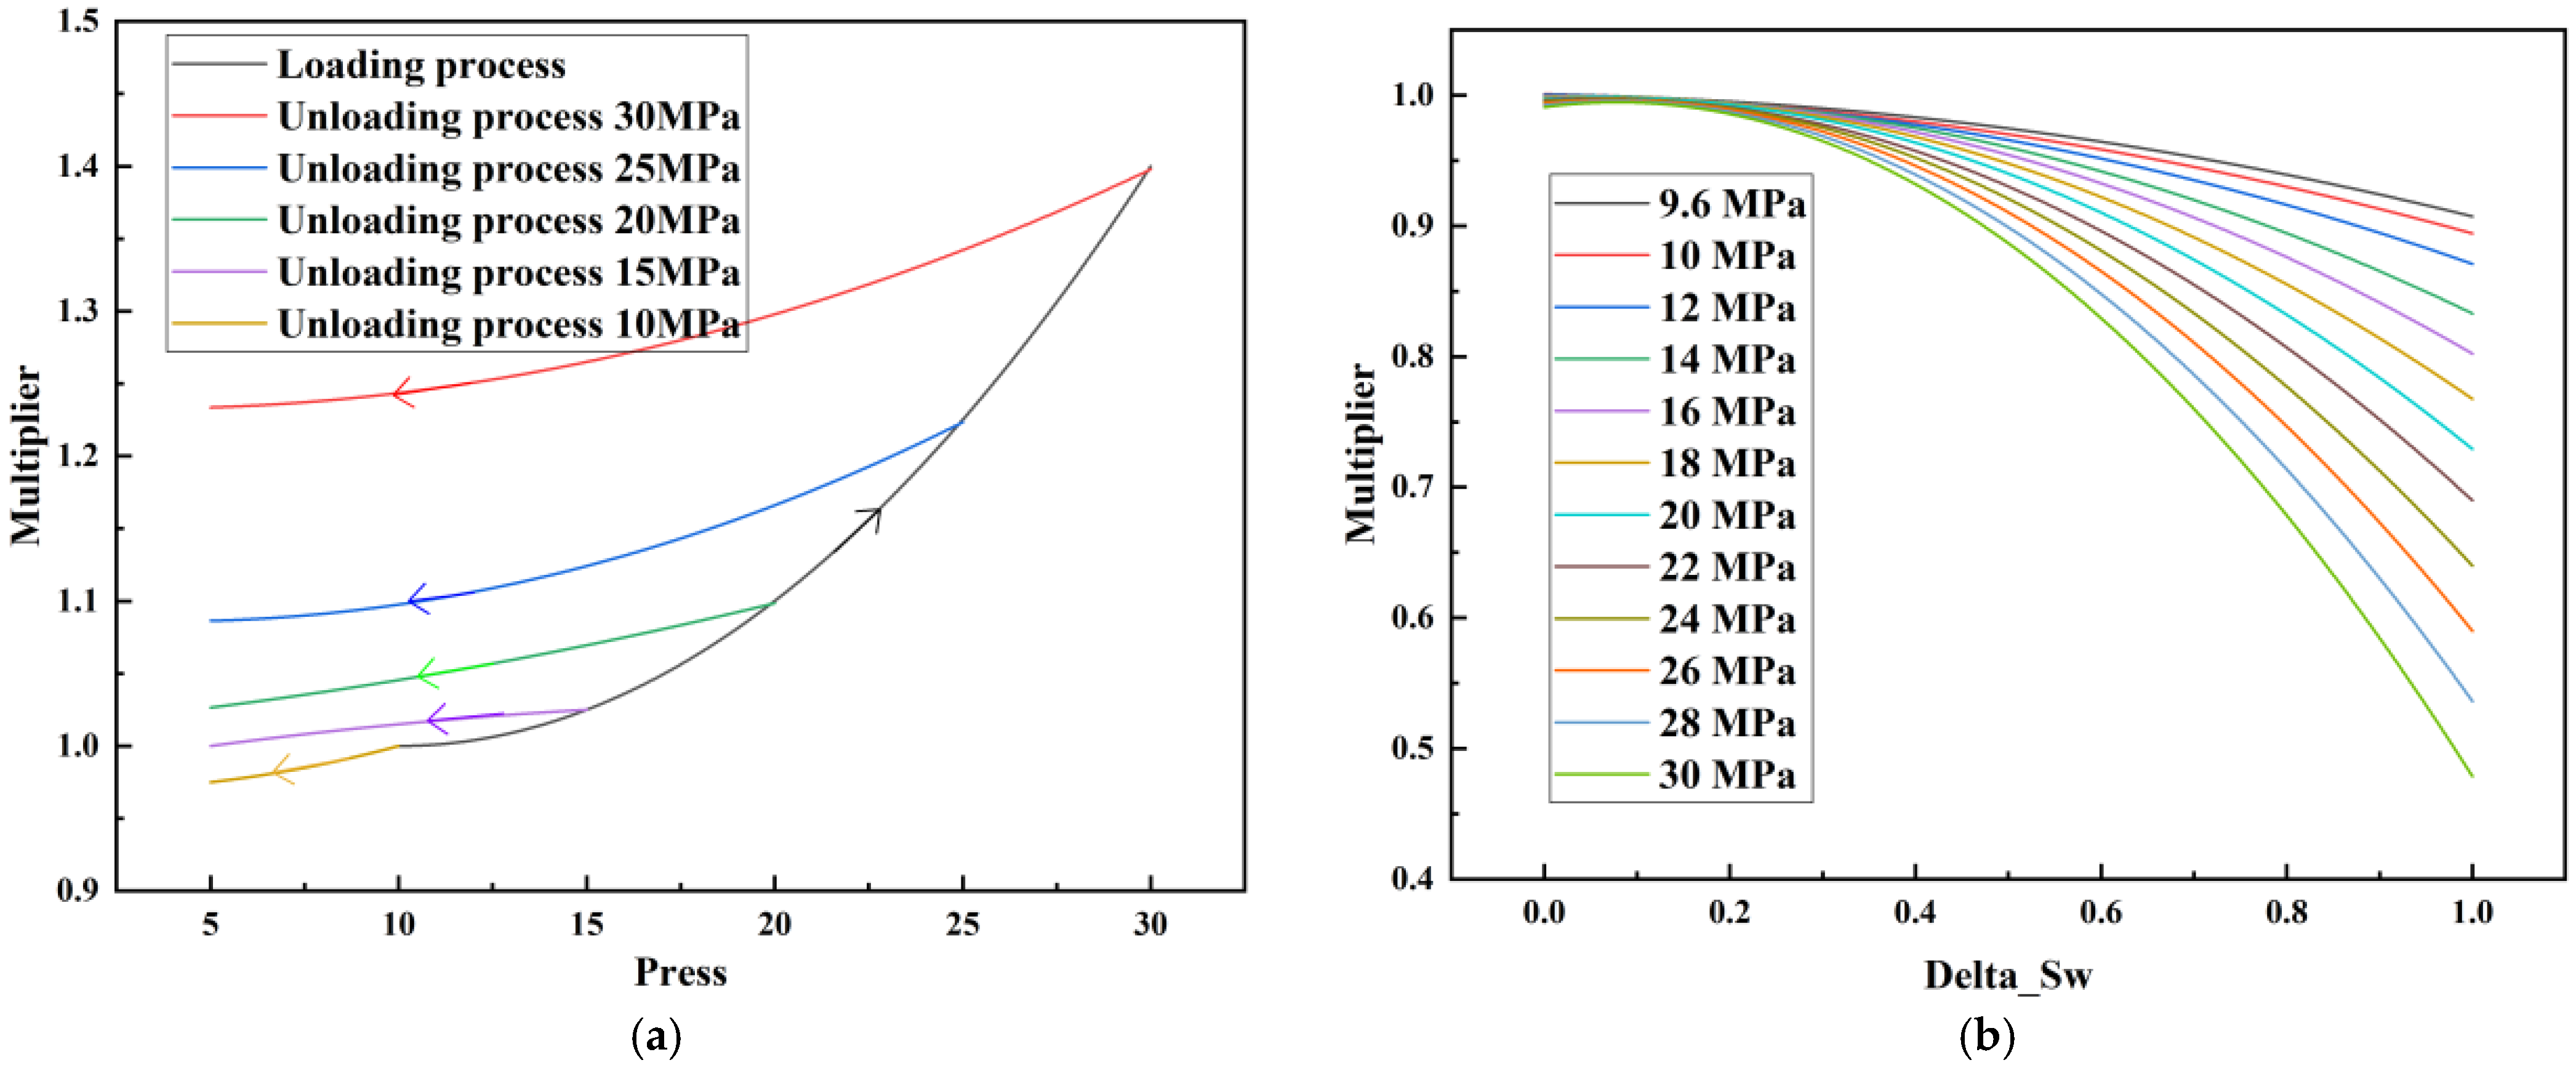
- CROCKTAB parameters (see Figure 1a) reveal nonlinear porosity growth during loading (black curve), with pronounced hysteresis during unloading. The elastic recovery capacity decays significantly under high-pressure unloading, confirming irreversible deformation from prolonged water injection.
- (2)
- CROCKTABW parameters (see Figure 1b) demonstrate a positive correlation between pore volume expansion and water saturation increments. High-stress conditions (e.g., 30 MPa) intensify pore structure adjustment during aqueous-phase seepage, quantitatively supporting PFC evolution.
2.1.2. Dynamic Evolution of Reservoir Properties During Waterflooding
2.1.3. Impact of PFCs on Waterflooding Performance
2.2. Simulation and Application of NGM Flooding After Waterflooding
2.2.1. Mechanism of NGM Profile Control
- (1)
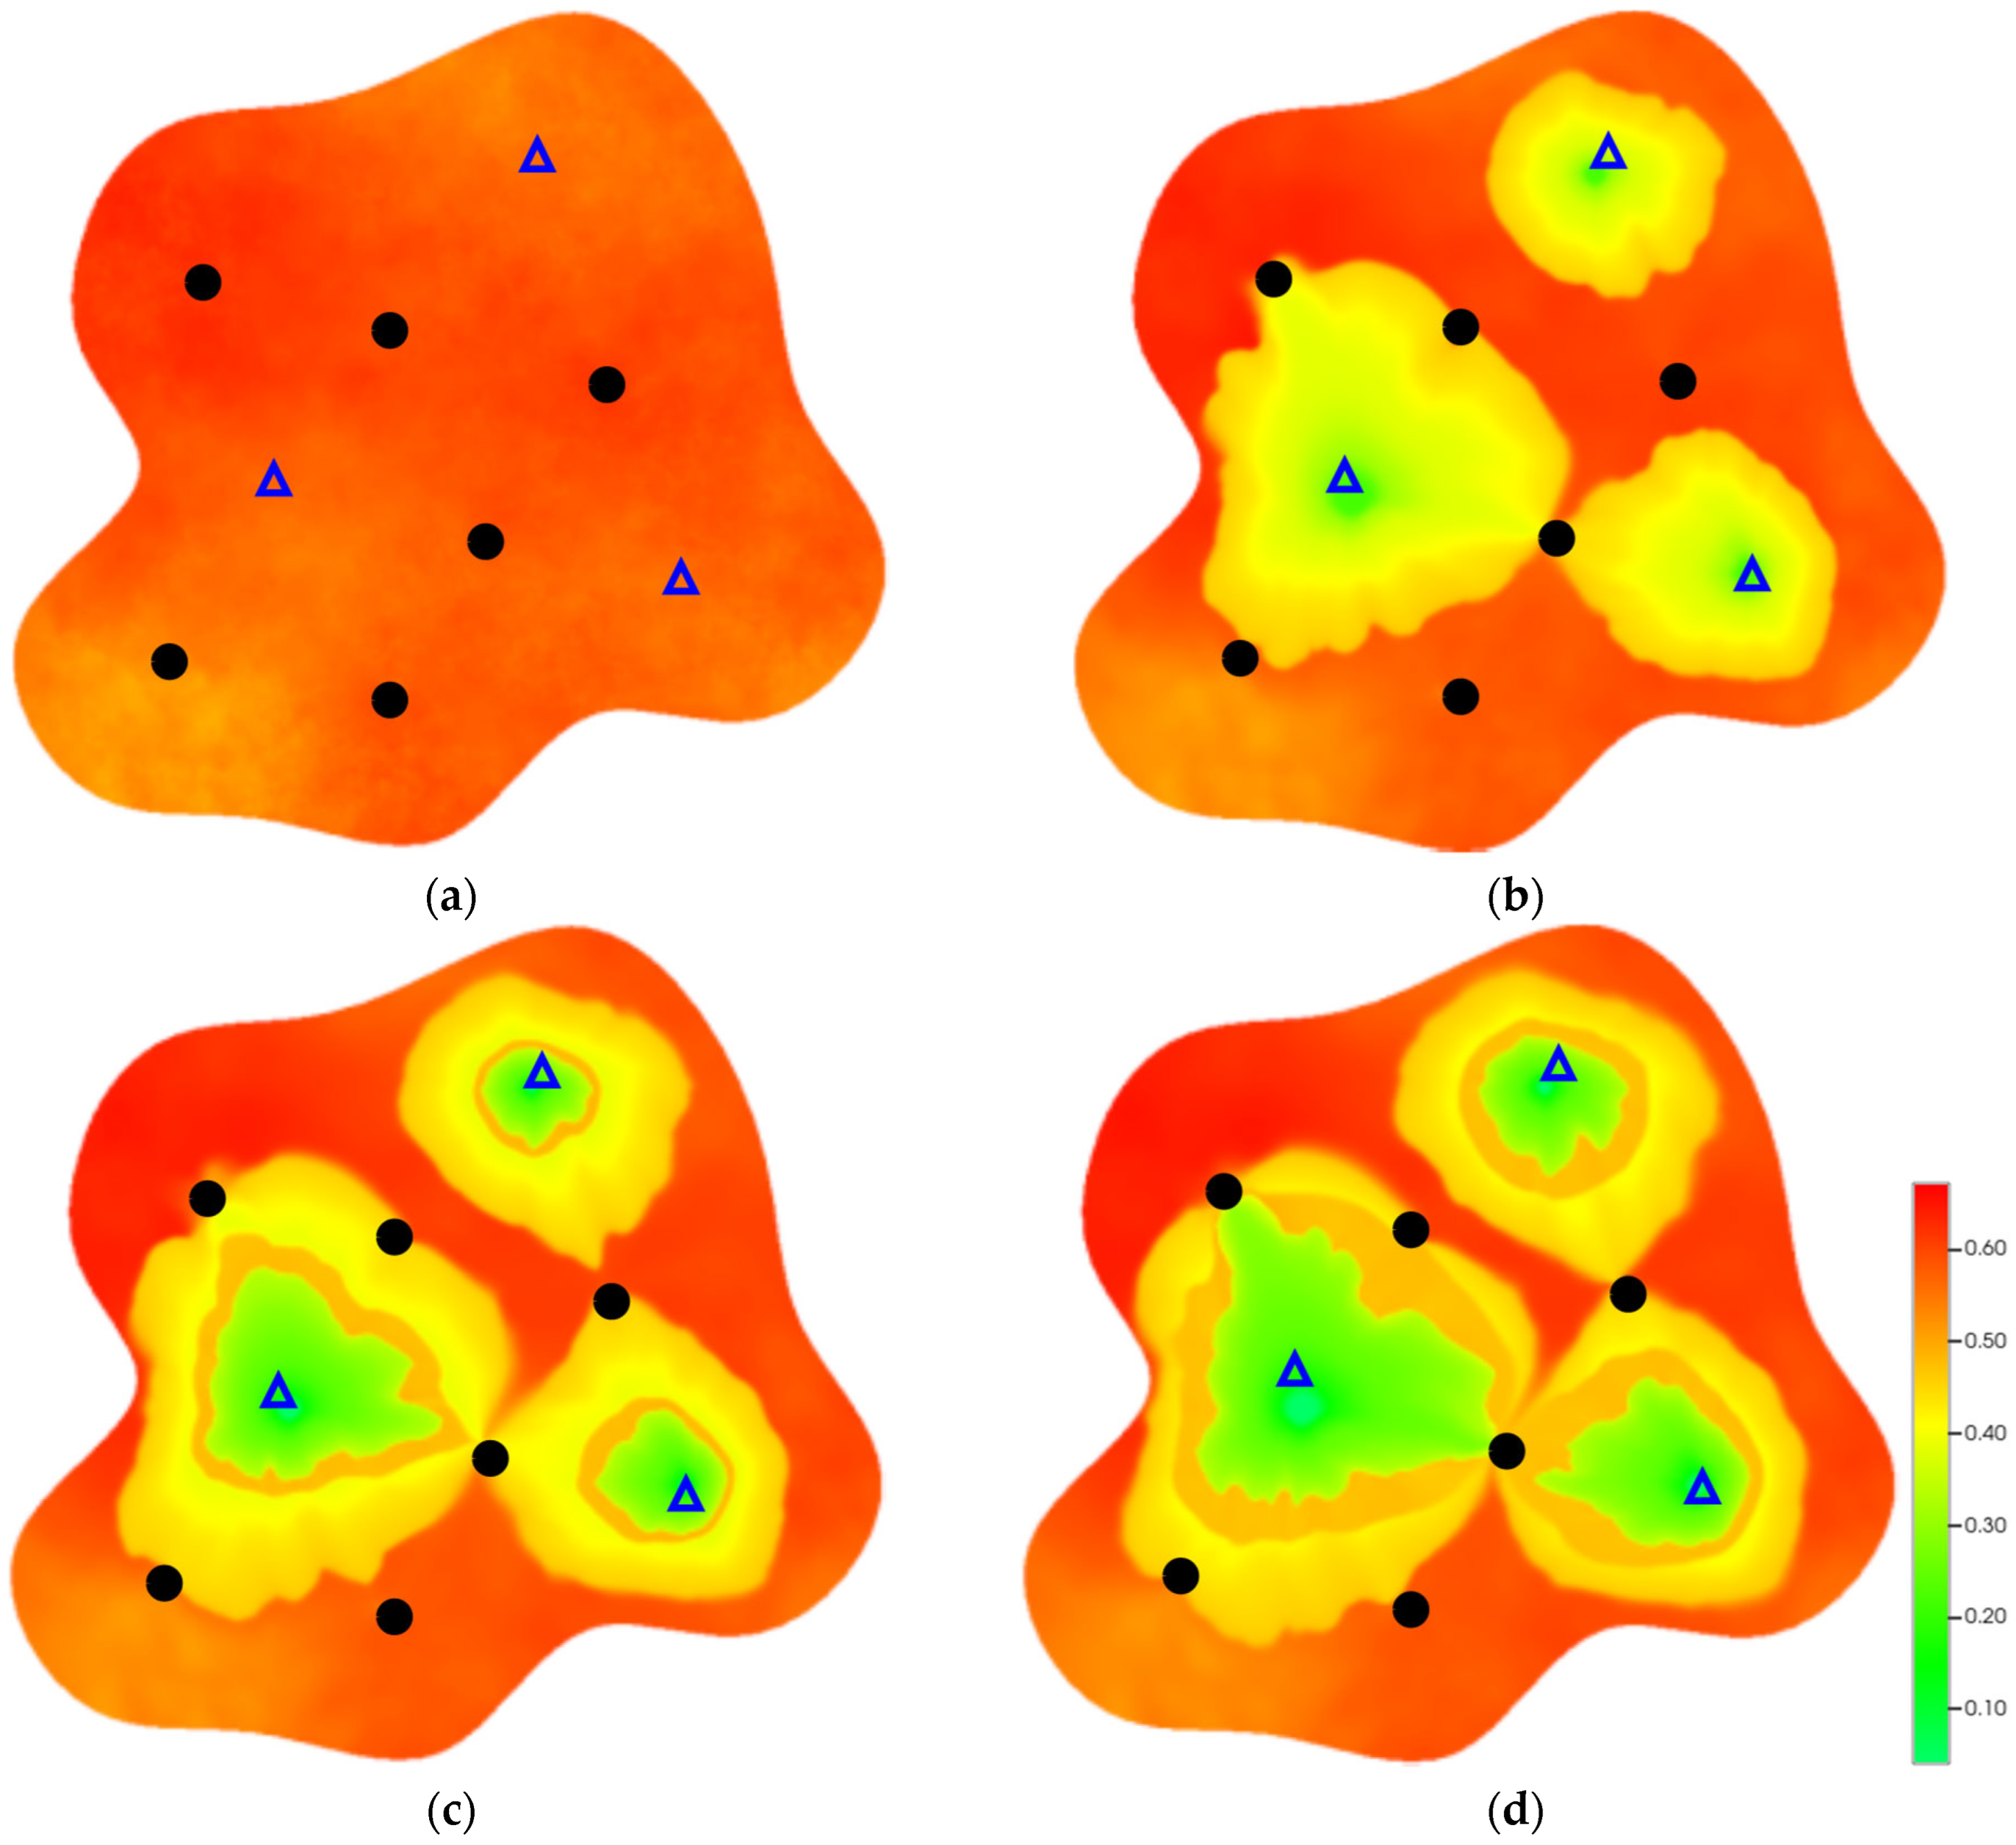
- NGMs block PFCs through physical retention and elastic deformation, redirecting injected water into low-permeability zones to mobilize residual oil [7].
- (2)
- (3)
- NGMs’ adsorption reduces oil-wetting sites on rock surfaces, shifting wettability toward water-wet states (validated by ESEM studies [8]). This decreases contact angles, reducing capillary forces that trap residual oil.
2.2.2. Simulation of NGM Flooding Effects
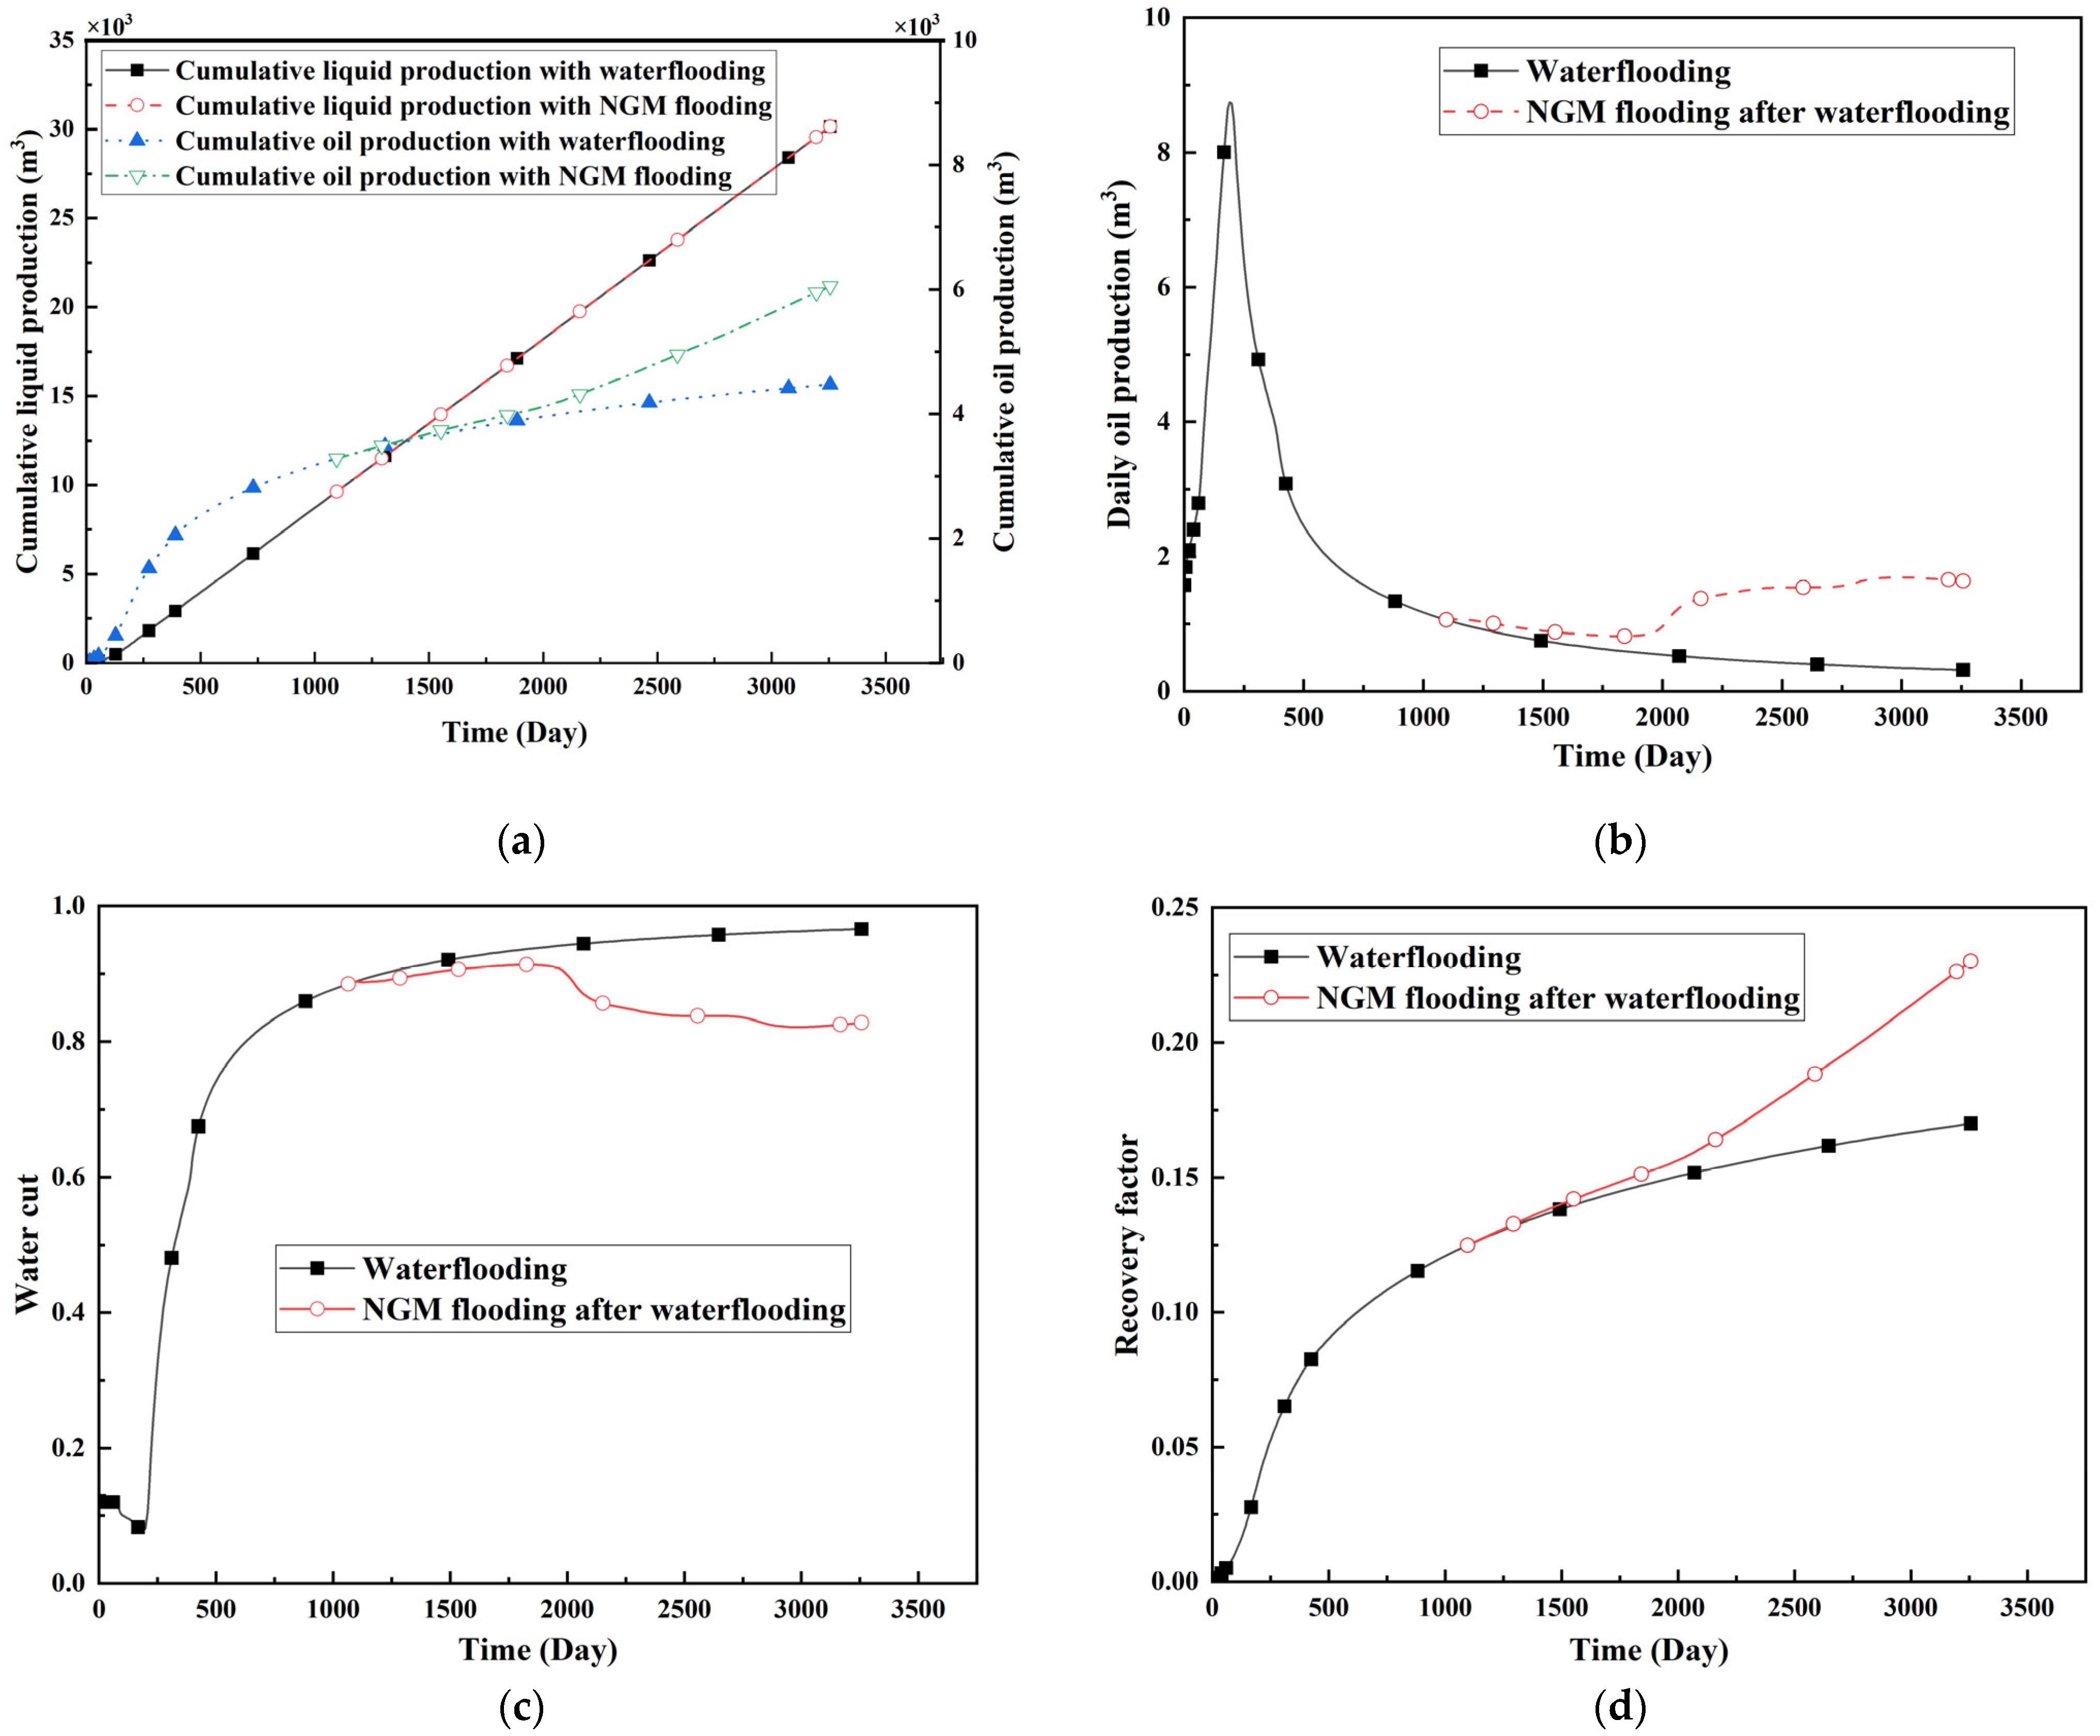
2.2.3. Macro-Scale Impact of NGMs on Oil Recovery
2.3. Field Application: Case Study of the Chang 6 Tight Oil Reservoir
3. Conclusions
- (1)
- Dynamic quantification of PFC evolution was achieved through coupled CROCKTAB (stress–porosity hysteresis) and CROCKTABW (water saturation-driven permeability evolution) modeling, revealing that conventional simulations overestimate recovery by 8.7% due to unaccounted permeability growth (from 8 to 12 mD, +50%) in high-conductivity layers during long-term waterflooding.
- (2)
- NGMs enable effective conformance control via synergistic “bridge-plug-filter cake” structures leveraging gel properties (15× swelling ratio, elasticity, adsorption), reducing thief-zone permeability by 33% (from 12 to 8 mD) while enhancing low-permeability layer flow capacity by 33% (from 4.5 to 6 mD) and decreasing residual oil saturation (from 0.35 to 0.28).
- (3)
- Field validation in the Chang 6 tight reservoir (permeability variation coefficient 0.82) confirmed a >10-year sustained performance: 0.84% incremental recovery (from 7.31% to 8.15%) with 8% water-cut reduction and favorable economics (ROI ≈ 10:1 at 70/bbl USD), demonstrating engineering viability for heterogeneous reservoirs.
- (4)
- This work establishes a transferable framework for gel-based EOR, with future research prioritizing adaptive NGM injection (size, concentration optimization) and integration with auxiliary techniques (e.g., surfactant, thermal methods) for complex pore systems in ultra-deep or high-temperature reservoirs.
4. Mechanisms and Methods
4.1. Formation and Numerical Characterization of PFCs
4.1.1. Formation Mechanism of PFCs
4.1.2. Numerical Modeling of PFC Evolution
- (1)
- Physical fidelity requirement: Conventional one-way coupling models fail to capture the hysteresis effects in stress–permeability relationships during cyclic water injection. The dual-keyword approach dynamically couples rock deformation with aqueous-phase pressure evolution—essential for simulating irreversible PFC formation in long-term waterflooding scenarios.
- (2)
- Field validation imperative: The CROCKTABW keyword explicitly links rock compaction to water injection operations (dominant in the Chang 6 reservoir), resolving the “static table limitation” of conventional geomechanical models. Field data confirm that the permeability changes correlate with water saturation increments.
- (3)
- Numerical efficiency advantage: The coupled framework achieves accurate PFC characterization with <5% additional computation time versus decoupled approaches.
- (1)
- To establish a coupling mechanism dominated by water-phase pressure: The water-phase fluid pressure is explicitly used as a direct input variable for calculating the effective stress change of rock grid cells. This allows the compaction or rebound response of the rock to be directly and dynamically bound to the flow, injection, or extraction processes of the water phase and the pressure field evolution in the model.
- (2)
- Realize true fluid–solid coupling (partial coupling): With CROCKTABW, the change of rock properties no longer depends only on a preset, static pressure field or stress path, but responds in real time to local water-phase pressure changes generated by the water-driven process.
- (3)
- Focus on water-driven dominated deformation processes: The model is explicitly instructed to focus on scenarios where the water phase is the main driver of pore pressure changes and rock deformation. This is especially applicable to oilfields where water injection is the main development method, and the main controlling factor of the rock mechanical response is the spatial and temporal distribution of water-phase pressure.
- (4)
- Reflecting engineering reality: in oilfield sites, water injection operations directly affect reservoir pressure, which in turn changes the effective stress and leads to rock deformation. The choice of CROCKTABW is to reproduce the dynamic change of rock properties directly triggered by the waterflooding operation in the numerical model, so that the simulation results are more in line with the physical reality and engineering observations.
4.1.3. Characterization of PFC Dynamics via Coupled Simulation
- (1)
- Pressure-induced temporal evolution of reservoir properties (CROCKTAB)
- (2)
- Temporal variation of reservoir properties due to water saturation (CROCKTABW):
4.2. Mechanisms of NGMs for Flooding and Profile Control
4.2.1. Plugging Mechanism of NGMs
4.2.2. Fluid Diversion Mechanism
4.2.3. Numerical Modeling of NGM Flooding Mechanisms
Author Contributions
Funding
Institutional Review Board Statement
Informed Consent Statement
Data Availability Statement
Conflicts of Interest
References
- van der Linden, J.H.; Tordesillas, A.; Narsilio, G.A. Preferential flow pathways in a deforming granular material: Self-organization into functional groups for optimized global transport. Sci. Rep. 2019, 9, 18231. [Google Scholar] [CrossRef] [PubMed]
- Zhao, P.; Zhu, H.Y.; Li, G.S.; Chen, Z.; Chen, S.J.; Shangguan, S.T.; Qi, X.F. Large-scale physical simulation of injection and production of hot dry rock in Gonghe Basin, Qinghai Province, China, Petroleum Exploration and Development. Pet. Explor. Dev. 2024, 51, 741–752. [Google Scholar] [CrossRef]
- Dai, C.L.; You, Q.; Zhao, M.W.; Zhang, G.; Zhang, F.L. Principles of Enhanced Oil Recovery; Springer Nature: Singapore, 2010. [Google Scholar] [CrossRef]
- Zhang, X.; Zhu, H.H.; Zhang, T.S.; Meng, Q.C.; Wang, H.T.; Zhang, J.X.; Yong, J.J.; Li, H.J.; Wang, X.X. Instantaneous resistivity vector difference used to simulate the seepage of polymer flooding in an oilfield. J. Pet. Sci. Eng. 2020, 191, 106922. [Google Scholar] [CrossRef]
- Ma, X.; Zhou, Y.H.; Yi, P.; Zhou, S.; Wang, Y.; Yang, D.Z. Design, preparation and properties of new polyacrylamide based composite nano-microspheres with like “ball in ball” structure, Colloids and surfaces. Colloids Surf. A Physicochem. Eng. Asp. 2022, 654, 130037. [Google Scholar] [CrossRef]
- Zhang, H.J.; Li, M.T.; Cai, C.; Zhang, S.; Liu, W.D.; Ma, Z.; Ding, B.; Zeng, J. Minireview on Plugging Agents for High-Conductivity Channels in Reservoirs. Energy Fuels 2024, 38, 19139–19155. [Google Scholar] [CrossRef]
- Feng, X.; Zhang, H.; Liu, H.; Hong, J.; Liu, J.; Yang, Y.; Liu, Z.; Abdullah, M.; Yang, H.; Yu, H. Investigation into the Flow Mechanism of Nano-Elastic Microspheres during Water Invasion. Processes 2023, 11, 3342. [Google Scholar] [CrossRef]
- Zhang, F.M.; Hou, B.F.; Wang, S.; Chen, H.; Yang, J.B.; Fan, H.M.; Gui, L. Study on the Profile Control and Oil Displacement Mechanism of a Polymer Nano-microsphere for Oilfield. Energy Fuels 2023, 37, 2692–2701. [Google Scholar] [CrossRef]
- Ge, L.; Chen, X.; Wang, G.; Zhang, G.; Li, J.; Liu, Y.; Xiao, L.; Wen, Y.; Yuan, W.; Qu, M.; et al. Analysis of the Distribution Pattern of Remaining Oil and Development Potential after Weak Gel Flooding in the Offshore LD Oilfield. Gels 2024, 10, 236. [Google Scholar] [CrossRef]
- Li, X.; Liu, S.; Zhang, J.; Han, S.; Zhao, L.; Xu, A.; Wang, J.; Zhou, F.; Li, M. High-Temperature-Resistant Profile Control System Formed by Hydrolyzed Polyacrylamide and Water-Soluble Phenol-Formaldehyde Resin. Gels 2024, 10, 413. [Google Scholar] [CrossRef]
- Wang, Z.; Jiang, J.; Huang, W.; Gan, Y.; Bai, Y. Construction of a ‘Simple, Fast and Accurate’ Evaluation Method for Profile Control and Plugging Effect of Gel Plugging Agent Based on Simulations. Gels 2025, 11, 115. [Google Scholar] [CrossRef]
- Zhang, L.; Liu, Y.; Wang, Z.; Li, H.; Zhao, Y.; Pan, Y.; Liu, Y.; Yuan, W.; Hou, J. Evaluation of Profile Control and Oil Displacement Effect of Starch Gel and Nano-MoS2 Combination System in High-Temperature Heterogeneous Reservoir. Gels 2024, 10, 127. [Google Scholar] [CrossRef] [PubMed]
- Su, Y.-C.; Li, Y.-L.; Wang, L.-L.; He, Y.-F. Experimental and Pilot Tests of Deep Profile Control by Injecting Small Slug-Size Nano-Microsphere in Offshore Oil Fields. In Proceedings of the Offshore Technology Conference, Houston, TX, USA, 6–9 May 2019. [Google Scholar] [CrossRef]
- Gao, Y.; Chen, Z.; Liang, X.; Li, Y.; Shen, S.; Li, D.; Huang, Z. Study on Permeability Enhancement and Heat Transfer of Oil Sands Reservoir Based on Hydrophobic Nanofluids. Energies 2025, 18, 927. [Google Scholar] [CrossRef]
- Liang, L.H.; Meng, S.W.; Tao, J.P.; Gong, C.P.; Shen, M.; Jin, X.; Fu, H.T. Displacement Mechanisms of Modified Carbon Black Nanofluid as a Novel Flooding System in Ultralow-Permeability Reservoirs. SPE J. 2025, 30, 2909–2922. [Google Scholar] [CrossRef]
- Ju, Y.T.; Luo, H.M.; Zhang, X.N.; Zhang, J. Microscopic regulation and displacement mechanism of polymer–microsphere plug combination for enhanced oil recovery in sandstone reservoirs. Can. J. Chem. Eng. 2025, 4, 25713. [Google Scholar] [CrossRef]
- Li, Y.T.; Zhang, B.; Wang, L.; Wu, Y.; Wang, H.X.; Peng, Z.H. Identification of dominant seepage channels in fractured rock masses of underground water–sealed oil storage: A case study. Bull. Eng. Geol. Environ. 2022, 81, 357. [Google Scholar] [CrossRef]
- Samier, P.; Onaisi, A.; Fontaine, G. Coupled Analysis of Geomechanics and Fluid Flow in Reservoir Simulation. In Proceedings of the SPE Reservoir Simulation Symposium, Houston, TX, USA, 3–6 February 2003; Society of Petroleum Engineers: Richardson, TX, USA, 2003. [Google Scholar] [CrossRef]
- Samier, P.; Onaisi, A.; de Gennaro, S. A Practical Iterative Scheme for Coupling Geomechanics with Reservoir Simulation. SPE Res. Eval. Eng. 2008, 11, 892–901. [Google Scholar] [CrossRef]
- Torskaya, T.; Jin, G.; Torres-Verdin, C. Pore-Level Analysis of the Relationship Between Porosity, Irreducible Water Saturation, and Permeability of Clastic Rocks. In Proceedings of the SPE Annual Technical Conference and Exhibition, Anaheim, CA, USA, 11–14 November 2007; Society of Petroleum Engineers: Richardson, TX, USA, 2007. [Google Scholar] [CrossRef]
- Wang, M.C.; Zhu, W.Y.; Wang, G.F.; Wang, M. Simulation study of nanopolymer microspheres in a medium-seepage high-water content oilfield. J. Southwest Pet. Univ. 2010, 32, 105–108. Available online: https://kns.cnki.net/kcms2/article/abstract?v=a4fp6zKrpgYjE4gJvKmIewGQrvXhS0lR4IfXVjMAK_QQg4sVY55WaenlBowUP3FLMP-xWG3f_S0vajYbjW84YNIHD8AITS4WanM2GvWtJdpkosuG2JEmsRs1XkcDh2v51d3mMzARSlkOr4le9k2HukqgGgIhWZlxqSdl43LsjCenaTi1QN3Yow==&uniplatform=NZKPT&language=CHS (accessed on 12 November 2010).
- Lin, R.Y.; Luo, P.Y.; Sun, Y.; Pan, Y.; Sun, L. Experimental Study on the Optimization of Multi-level Nano–Microsphere Deep Profile Control in the Process of Gas Injection in Fracture-Type Buried-Hill Reservoirs. ACS Omega 2021, 6, 24185–24195. [Google Scholar] [CrossRef]
- Lin, Y.B.; Zhang, J.; Lin, X.G.; Zhou, H.T. Characteristics of pore structure in the late high water-bearing reservoir of Lamaidean Oilfield. Pet. Explor. Dev. 2008, 2, 215–219. Available online: https://kns.cnki.net/kcms2/article/abstract?v=a4fp6zKrpgZpMCX2xc3SQtqOLq1DIskWbS8nJ_EMc4ubQiFOutjrRZhCRK99QvaPnMbFncasvNPVnp9lM6qeON5ErZoQAre8xHKcFOw0NAZB9qZL6yCC5gH9uRVjZDHvdAbAWuHx1IcuRsMzv_jU2c27N26OBglmaNuDy-wKmRMq2645PBgE-Q==&uniplatform=NZKPT&language=CHS (accessed on 16 May 2008). [CrossRef]
- Jia, X.F.; Lei, G.L.; Yin, J.H.; Yao, C.J.; Wang, C.; Li, W.Z. Theoretical study on the relationship between pore-throat scale elastic modulation drive microspheres and reservoir matching. Oil Drill. Technol. 2011, 39, 87–89. Available online: https://kns.cnki.net/kcms2/article/abstract?v=a4fp6zKrpgY1HvXmvDxLzpyH5zuISvc4gUXzKhKoSGeNitB_GsfuF5akHt23MzSwKx-P0zGnZ4GISXSmTsphIIqU8xfMT92hVZrPCBK6YmJWLKjP1vfHtypiInH9N8tC0Rjq2-6LaGBD2_7IP5XsmD1Wx6aYHBscQRtbwRklR07mdXTVGH8NYQ==&uniplatform=NZKPT&language=CHS (accessed on 17 October 2011).
- Hua, Z.; Lin, M.Q.; Dong, Z.X.; Li, M.Y.; Zhang, G.Q.; Yang, J. Study of deep profile control and oil displacement technologies with nanoscale polymer microspheres. J. Colloid Interface Sci. 2014, 424, 67–74. [Google Scholar] [CrossRef] [PubMed]
- Cai, J.C.; Zhang, Z.E.; Wei, W.; Guo, D.M.; Li, S.; Zhao, P.Q. The critical factors for permeability-formation factor relation in reservoir rocks: Pore–throat ratio, tortuosity and connectivity. Energy 2019, 188, 116051. [Google Scholar] [CrossRef]
- Li, Z.B.; Wang, M. Research and application evaluation of deep conditioning and driving technology of nano-microspheres in low-permeability oilfields. Xinjiang Oil Gas 2020, 16, 61–64. Available online: https://kns.cnki.net/kcms2/article/abstract?v=a4fp6zKrpgbzwlWSQ9hOqkZT7_jIT3B7BkfnP28TuQa3ZJCCShdYK2Zak3Nc6FpMtARYW5kdIjwJgFsePtO0yxMEKt9TgDRrOHxZHPx99lHVKM6wWNhgCiOqjZtW_erisjuZApheb1v9s5ID1MpEfQ1tYVNTUdcZi5Ix2LLBmk5FR2BujNf0Kw==&uniplatform=NZKPT&language=CHS (accessed on 8 June 2020).
- Li, J.B.; Niu, L.W.; Lu, X.G. Migration characteristics and deep profile control mechanism of polymer microspheres in porous media. Energy Sci. Eng. 2019, 7, 2026–2045. [Google Scholar] [CrossRef]
- Wang, G.Z.; Shen, H.; Gao, Y.; Xiang, Y.Q.; Yang, Z.H.; Lv, Q.C.; Dong, Z.X.; Lin, M.Q. Study on plugging, migration, and EOR capability of dual crosslinked terpolymer microspheres. J. Mol. Liq. 2025, 424, 127101. [Google Scholar] [CrossRef]
- Jiang, X.; Chen, J.B.; Zhang, D.J.; Cao, Y.; Sun, C. Static Adsorption of Nano-spheres on Mineral Surface in Liquid Phase. Oilfield Chem. 2022, 39, 281–287. [Google Scholar] [CrossRef]
- Wang, J.; Zhou, F.J.; Li, J.J.; Yang, K.; Zhang, L.F.; Fan, F. Evaluation of the oil/water selective plugging performance of nano-polymer microspheres in fractured carbonate reservoirs. J. Zhejiang Univ. Sci. A 2019, 20, 714–726. [Google Scholar] [CrossRef]
- Firozjaii, A.; Saghafi, H. Review on chemical enhanced oil recovery using polymer flooding: Fundamentals, experimental and numerical simulation. Petroleum 2020, 6, 115–122. [Google Scholar] [CrossRef]
- Gao, F.; Liu, B.; Liu, Y.; Xing, L.; Zhang, Y. Preparation and Enhanced Oil Recovery Mechanisms of Janus-SiO2-Reinforced Polymer Gel Microspheres. Gels 2025, 11, 506. [Google Scholar] [CrossRef]
- Wang, Z.; Lin, M.; Jin, S.; Yang, Z.; Dong, Z.; Zhang, J. Combined Flooding Systems with polymer microspheres and Nonionic Surfactant for Enhanced Water Sweep and Oil Displacement Efficiency in Heterogeneous Reservoirs. J. Dispers. Sci. Technol. 2020, 41, 267–276. [Google Scholar] [CrossRef]
- Shagymgereyeva, S.; Sarsenbekuly, B.; Kang, W.; Yang, H.; Turtabayev, S. Advances of polymer gel microspheres and Its Applications for Enhanced Oil Recovery. Colloids Surf. B Biointerfaces 2024, 233, 113622. [Google Scholar] [CrossRef] [PubMed]
- Wen, Y.; Hou, J. Experimental Study on Multi-Dimensional Visualization Simulation of Gas and Gel Foam Flooding in Fractured-Vuggy Reservoirs. Gels 2023, 9, 722. [Google Scholar] [CrossRef] [PubMed]
- Zhao, S.; Pu, W.F.; Wei, B.; Xu, X.G. A comprehensive investigation of polymer microspheres (PMs) migration in porous media: EOR implication. Fuel 2019, 235, 249–258. [Google Scholar] [CrossRef]
- Zhou, H.Y.; Liu, B.; Sun, Q.; Zhai, C.C.; Yue, B.L. Evaluation of multi-rounds driving effect of nano-gel microspheres in offshore fluvial-phase thick oil field. Xinjiang Oil Gas 2021, 17, 60–64. Available online: https://kns.cnki.net/kcms2/article/abstract?v=a4fp6zKrpgamI9YmNPg-Zeq63sm_F3loNMRQ8mdtkw5jhDsELBknfp3DA_t1FXSrIG0kzwVrdkNA2eztELNubY-CNq3PQsbdBhYj7_Sr_SbHUQ6C3ji1isW0hGVlmoqQuirKsgASkyV1m3TS0kkLIKi0kqligu4AsQJMqtwKvh_fxScH52aImw==&uniplatform=NZKPT&language=CHS (accessed on 31 March 2021).


| Reservoir Properties | Value |
|---|---|
| Depth to oil layer midpoint (m) | 1210 |
| Reference pressure (MPa) | 9.62 |
| Crude oil formation volume factor (rm3/sm3) | 1.206 |
| Crude oil compressibility (MPa−1) | 9.816 × 10⁻⁵ |
| Crude oil density (kg/m3) | 841 |
| Crude oil viscosity (mPa·s) | 2.62 |
| Water compressibility (MPa−1) | 5.0 × 10⁻⁵ |
| Water viscosity (mPa·s) | 0.5 |
| Rock compressibility (MPa−1) | 7.135 × 10⁻⁵ |
| Initial Development Stage | Waterless Oil Recovery Stage | Water Breakthrough Stage | High Water Cut Stage | ||
|---|---|---|---|---|---|
| Porosity |  |  |  |  |  |
| Permeability |  |  |  |  |  |
| Oil saturation |  |  |  |  |  |
| Initial Development Stage | Waterless Oil Recovery Stage | Water Breakthrough Stage | High Water Cut Stage | ||
|---|---|---|---|---|---|
| Porosity | 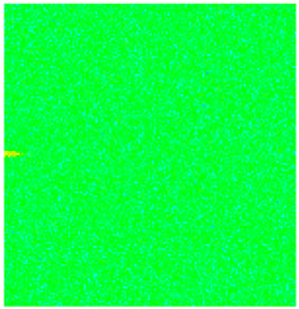 | 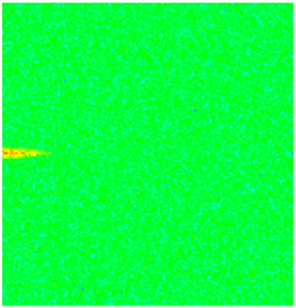 | 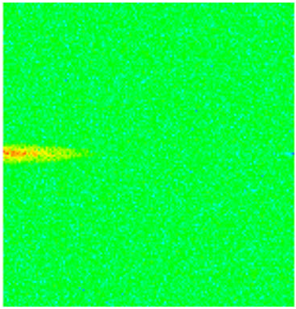 | 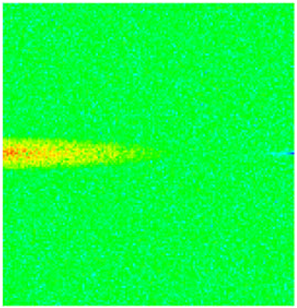 |  |
| Permeability |  |  |  |  |  |
| Oil saturation |  |  |  |  |  |
| Initial Development Stage | Waterless Oil Recovery Stage | Water Breakthrough Stage | High Water Cut Stage | |
|---|---|---|---|---|
| Porosity | 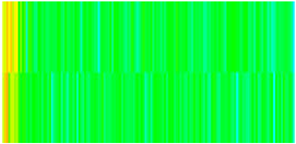 |  |  | 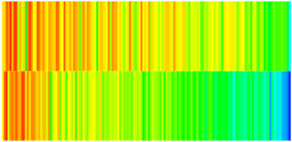 |
| Permeability | 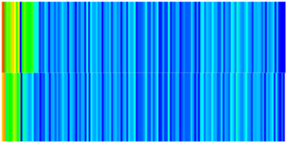 | 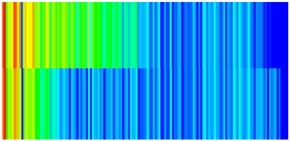 |  |  |
| Oil saturation |  |  |  |  |
| Early Stage of NGMs | Middle Stage of NGMs | Late Stage of NGMs | Final Stage of NGMs | ||
|---|---|---|---|---|---|
| Porosity |  |  |  |  |  |
| Permeability |  |  | 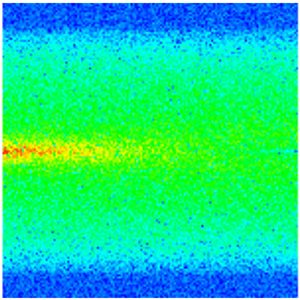 |  |  |
| Oil saturation | 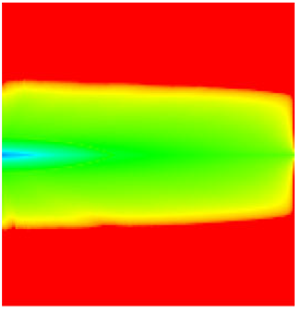 | 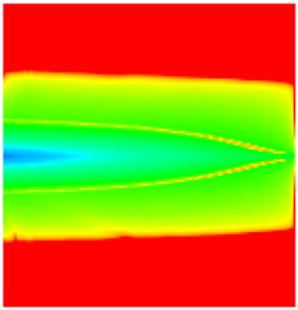 | 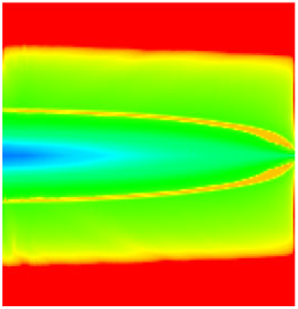 |  |  |
| Early Stage of NGMs | Middle Stage of NGMs | Late Stage of NGMs | Final Stage of NGMs | ||
|---|---|---|---|---|---|
| Porosity | 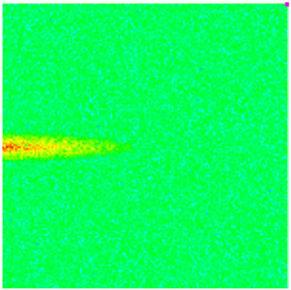 | 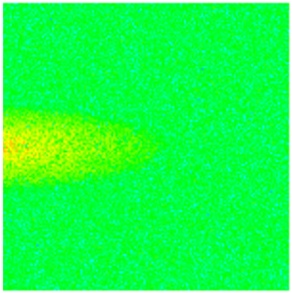 | 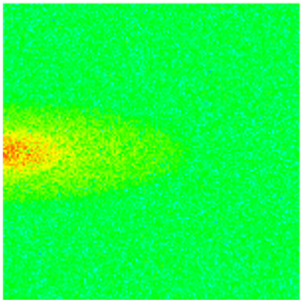 |  |  |
| Permeability | 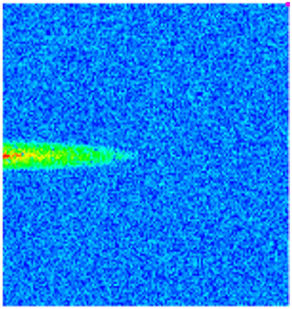 | 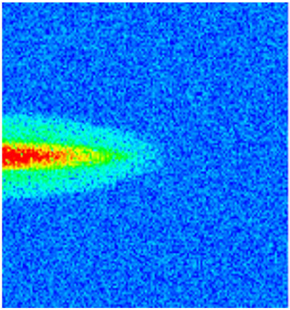 |  | 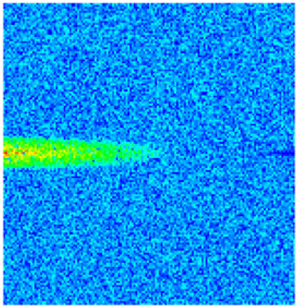 |  |
| Oil saturation | 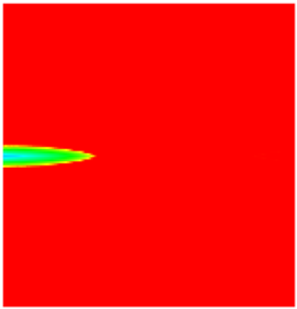 |  |  |  |  |
| Early Stage of NGMs | Middle Stage of NGMs | Late Stage of NGMs | Final Stage of NGMs | |
|---|---|---|---|---|
| Porosity |  |  |  |  |
| Permeability |  | 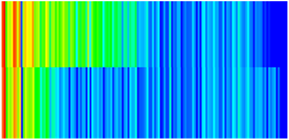 |  | 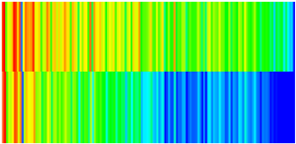 |
| Oil saturation |  |  |  |  |
Disclaimer/Publisher’s Note: The statements, opinions and data contained in all publications are solely those of the individual author(s) and contributor(s) and not of MDPI and/or the editor(s). MDPI and/or the editor(s) disclaim responsibility for any injury to people or property resulting from any ideas, methods, instructions or products referred to in the content. |
© 2025 by the authors. Licensee MDPI, Basel, Switzerland. This article is an open access article distributed under the terms and conditions of the Creative Commons Attribution (CC BY) license (https://creativecommons.org/licenses/by/4.0/).
Share and Cite
Ren, L.; Zhao, C.; Sun, J.; Jing, C.; Bai, H.; Li, Q.; Ma, X. Dynamic Simulation of Nano-Gel Microspheres for Plugging Preferential Flow Channels and Enhancing Oil Recovery in Waterflooded Reservoirs. Gels 2025, 11, 536. https://doi.org/10.3390/gels11070536
Ren L, Zhao C, Sun J, Jing C, Bai H, Li Q, Ma X. Dynamic Simulation of Nano-Gel Microspheres for Plugging Preferential Flow Channels and Enhancing Oil Recovery in Waterflooded Reservoirs. Gels. 2025; 11(7):536. https://doi.org/10.3390/gels11070536
Chicago/Turabian StyleRen, Long, Cong Zhao, Jian Sun, Cheng Jing, Haitao Bai, Qingqing Li, and Xin Ma. 2025. "Dynamic Simulation of Nano-Gel Microspheres for Plugging Preferential Flow Channels and Enhancing Oil Recovery in Waterflooded Reservoirs" Gels 11, no. 7: 536. https://doi.org/10.3390/gels11070536
APA StyleRen, L., Zhao, C., Sun, J., Jing, C., Bai, H., Li, Q., & Ma, X. (2025). Dynamic Simulation of Nano-Gel Microspheres for Plugging Preferential Flow Channels and Enhancing Oil Recovery in Waterflooded Reservoirs. Gels, 11(7), 536. https://doi.org/10.3390/gels11070536