
Evaluation of the Biological Activity of Manna Exudate, from Fraxinus ornus L., and Its Potential Use as Hydrogel Formulation in Dermatology and Cosmetology

 ,
,  ,
,  , ,
, , 
Abstract
1. Introduction
2. Results and Discussion
3. Conclusions
4. Materials and Methods
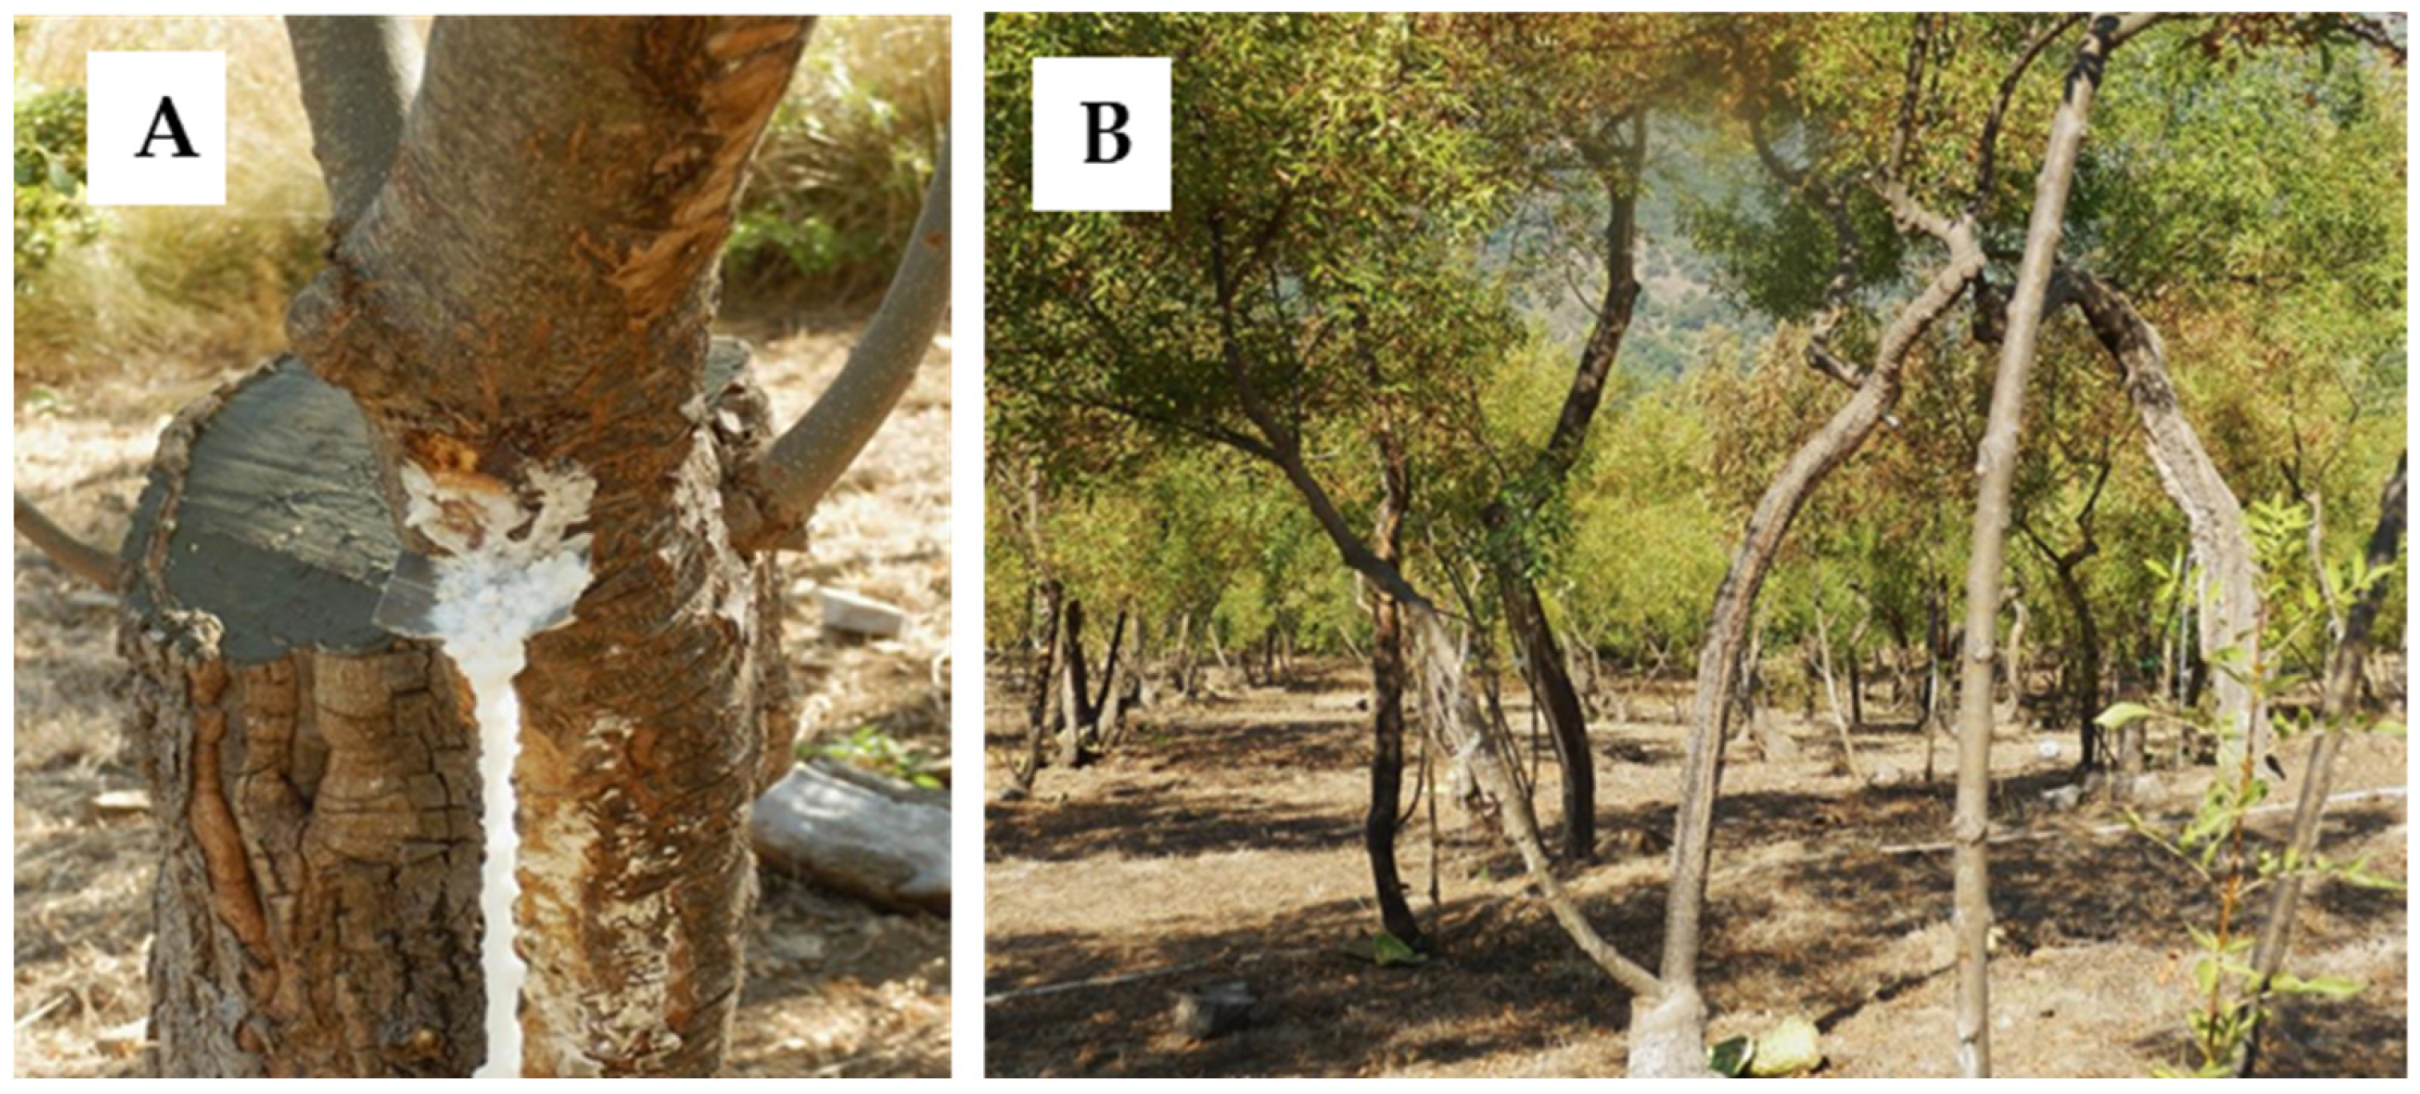
4.1. Plant Material
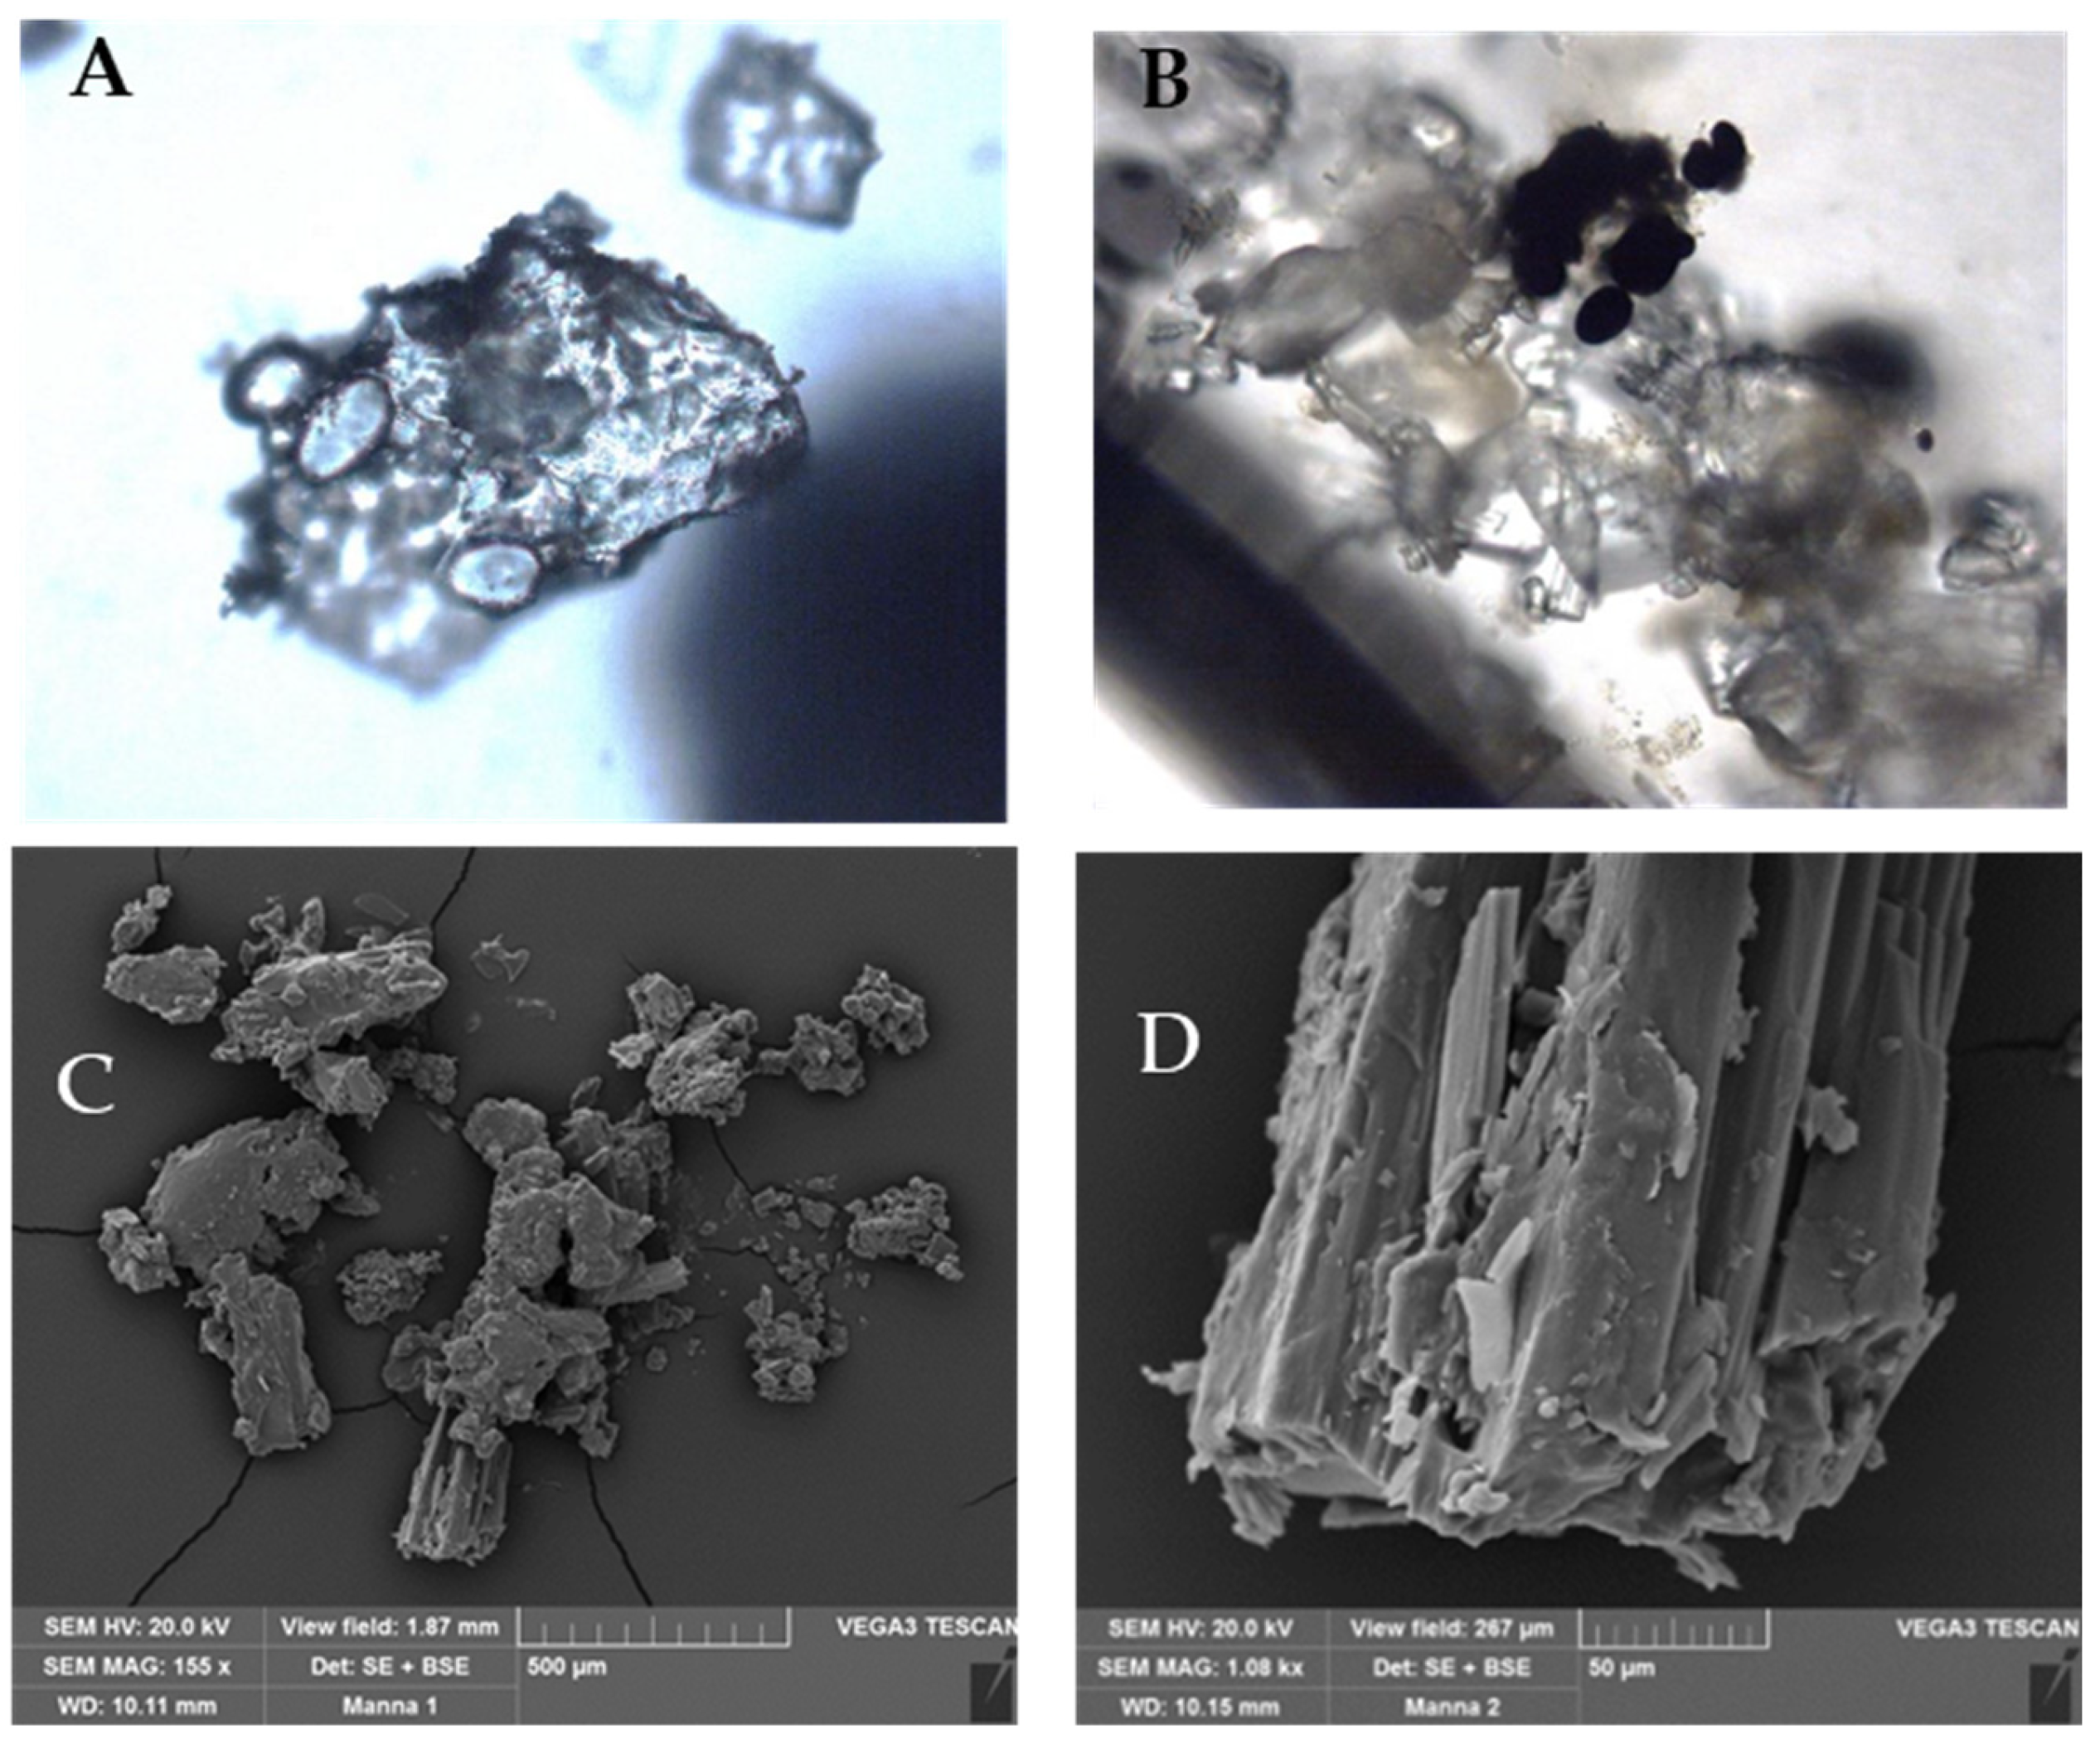
4.2. Microscopic Characterization
4.3. Phytochemical Screening
4.3.1. Quantification of Mannitol, Sugars and Total Starch Content
4.3.2. Quantification of Manna Phenolic Compounds
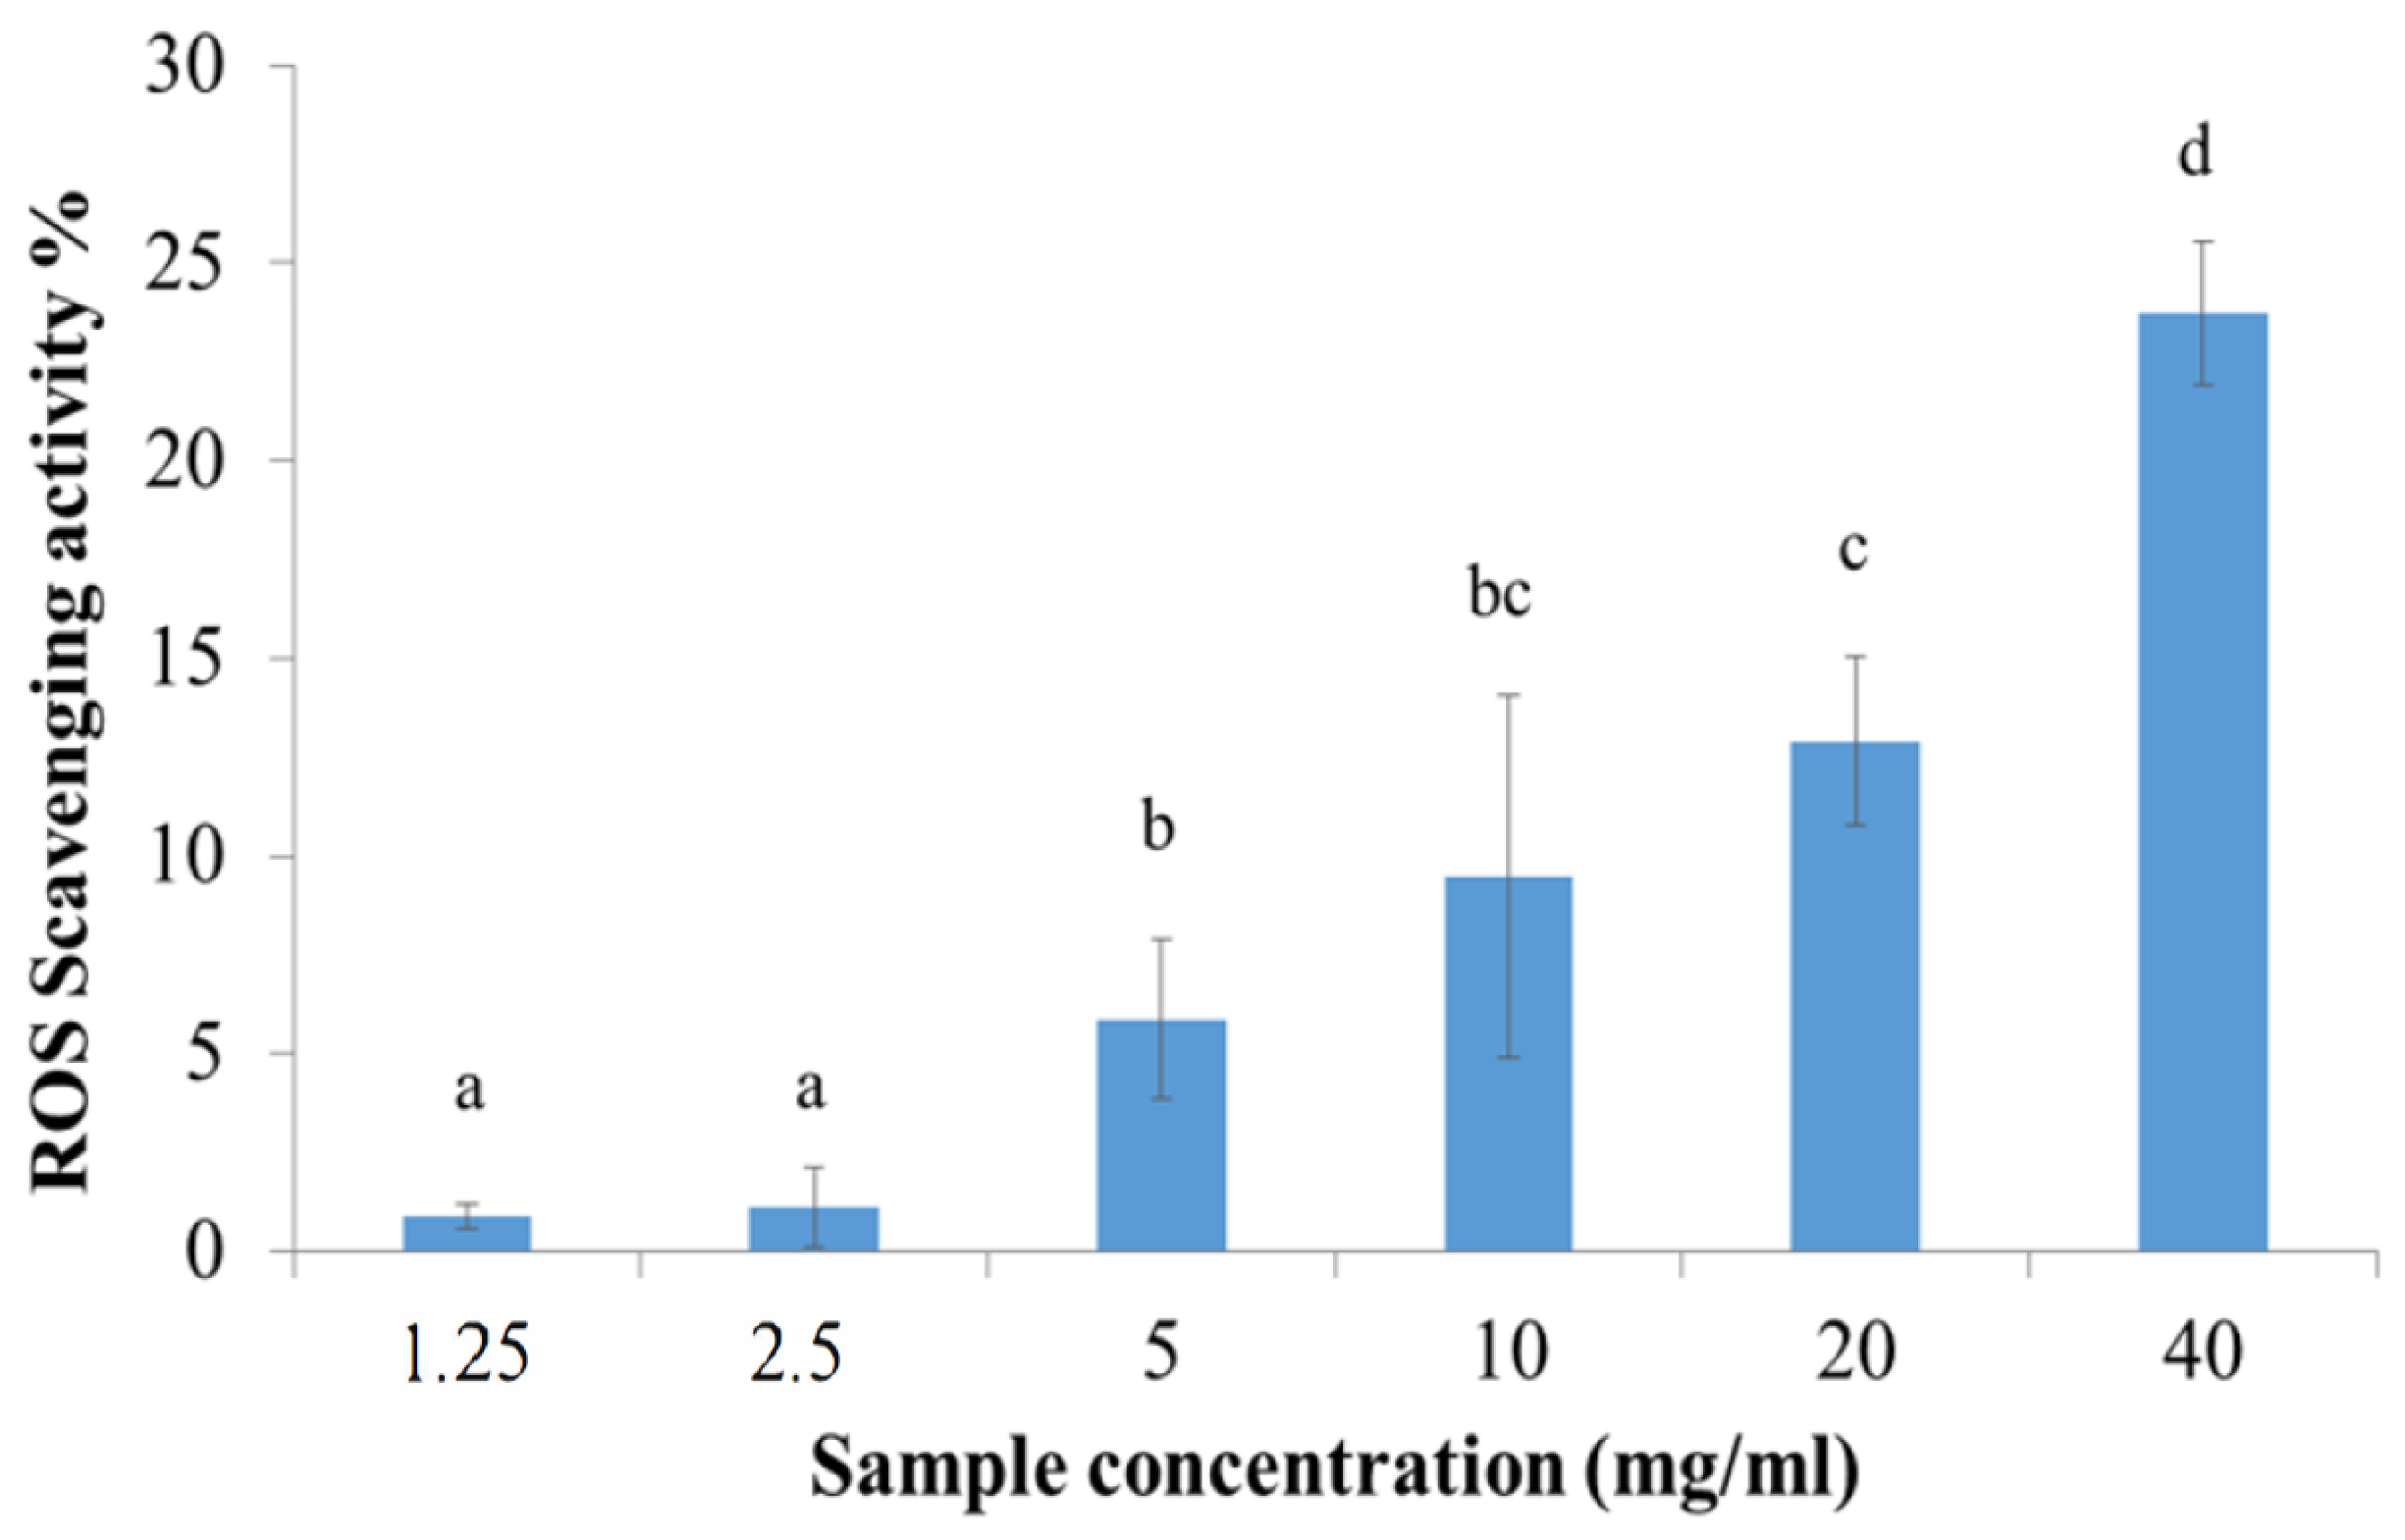
4.3.3. Manna Radical Scavenging Activity
4.3.4. Anti-Tyrosinase Activity
4.3.5. Anti-Elastase Activity
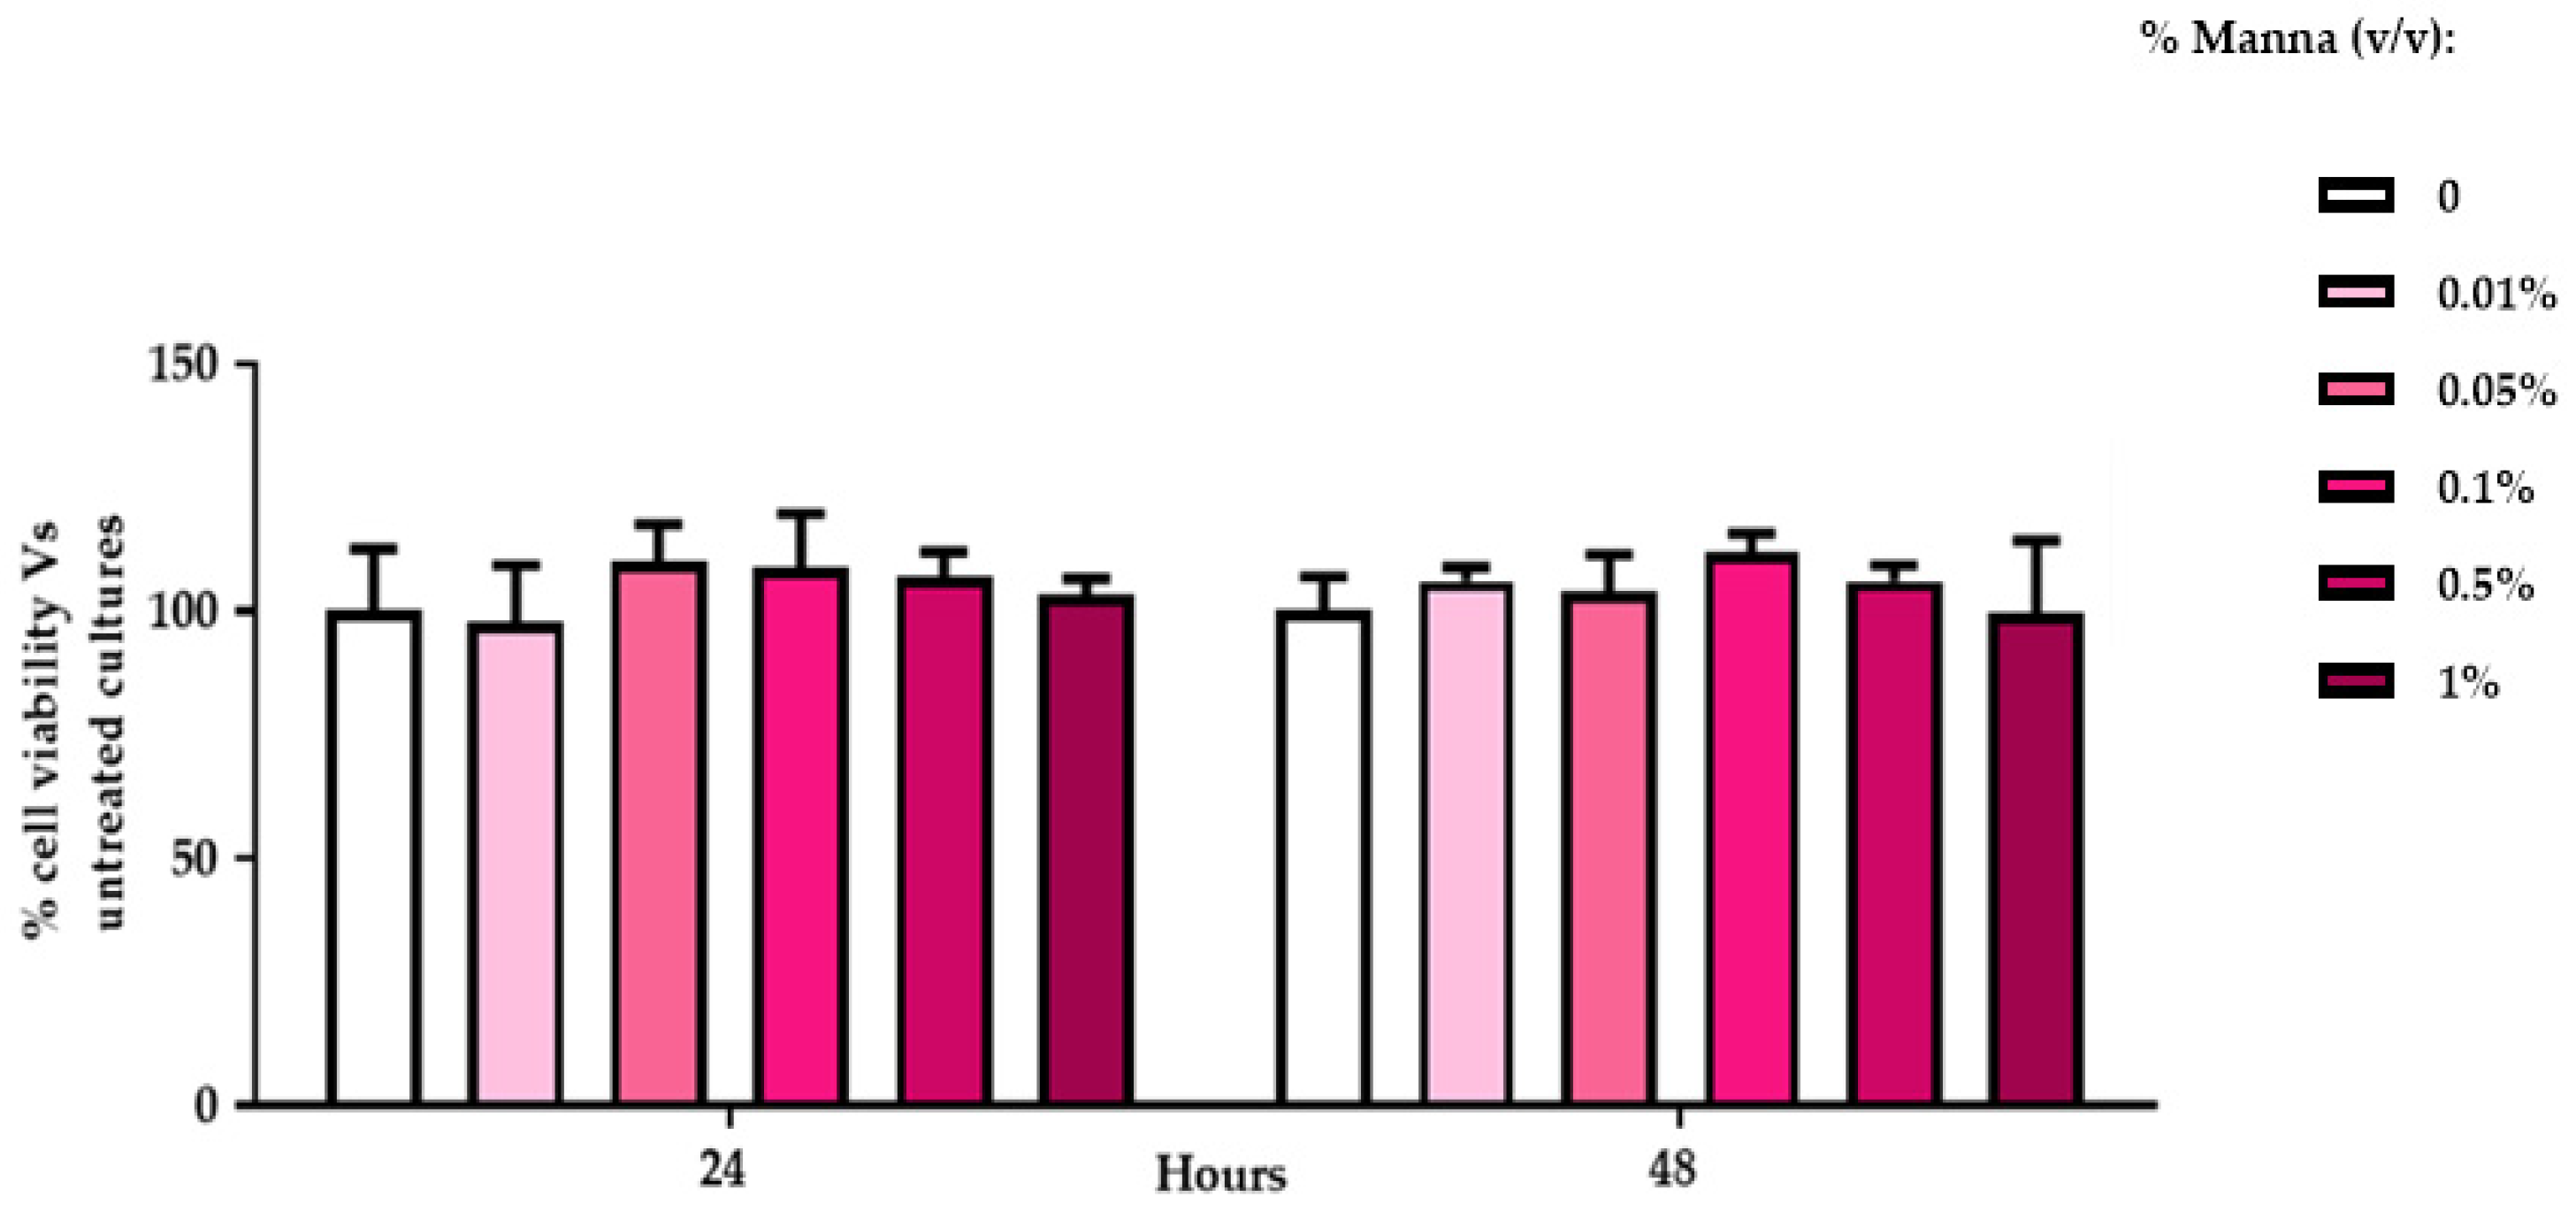
4.4. In vitro Cytotoxicity Analysis
4.4.1. Maintenance of Cell Culture
4.4.2. MTT Assay
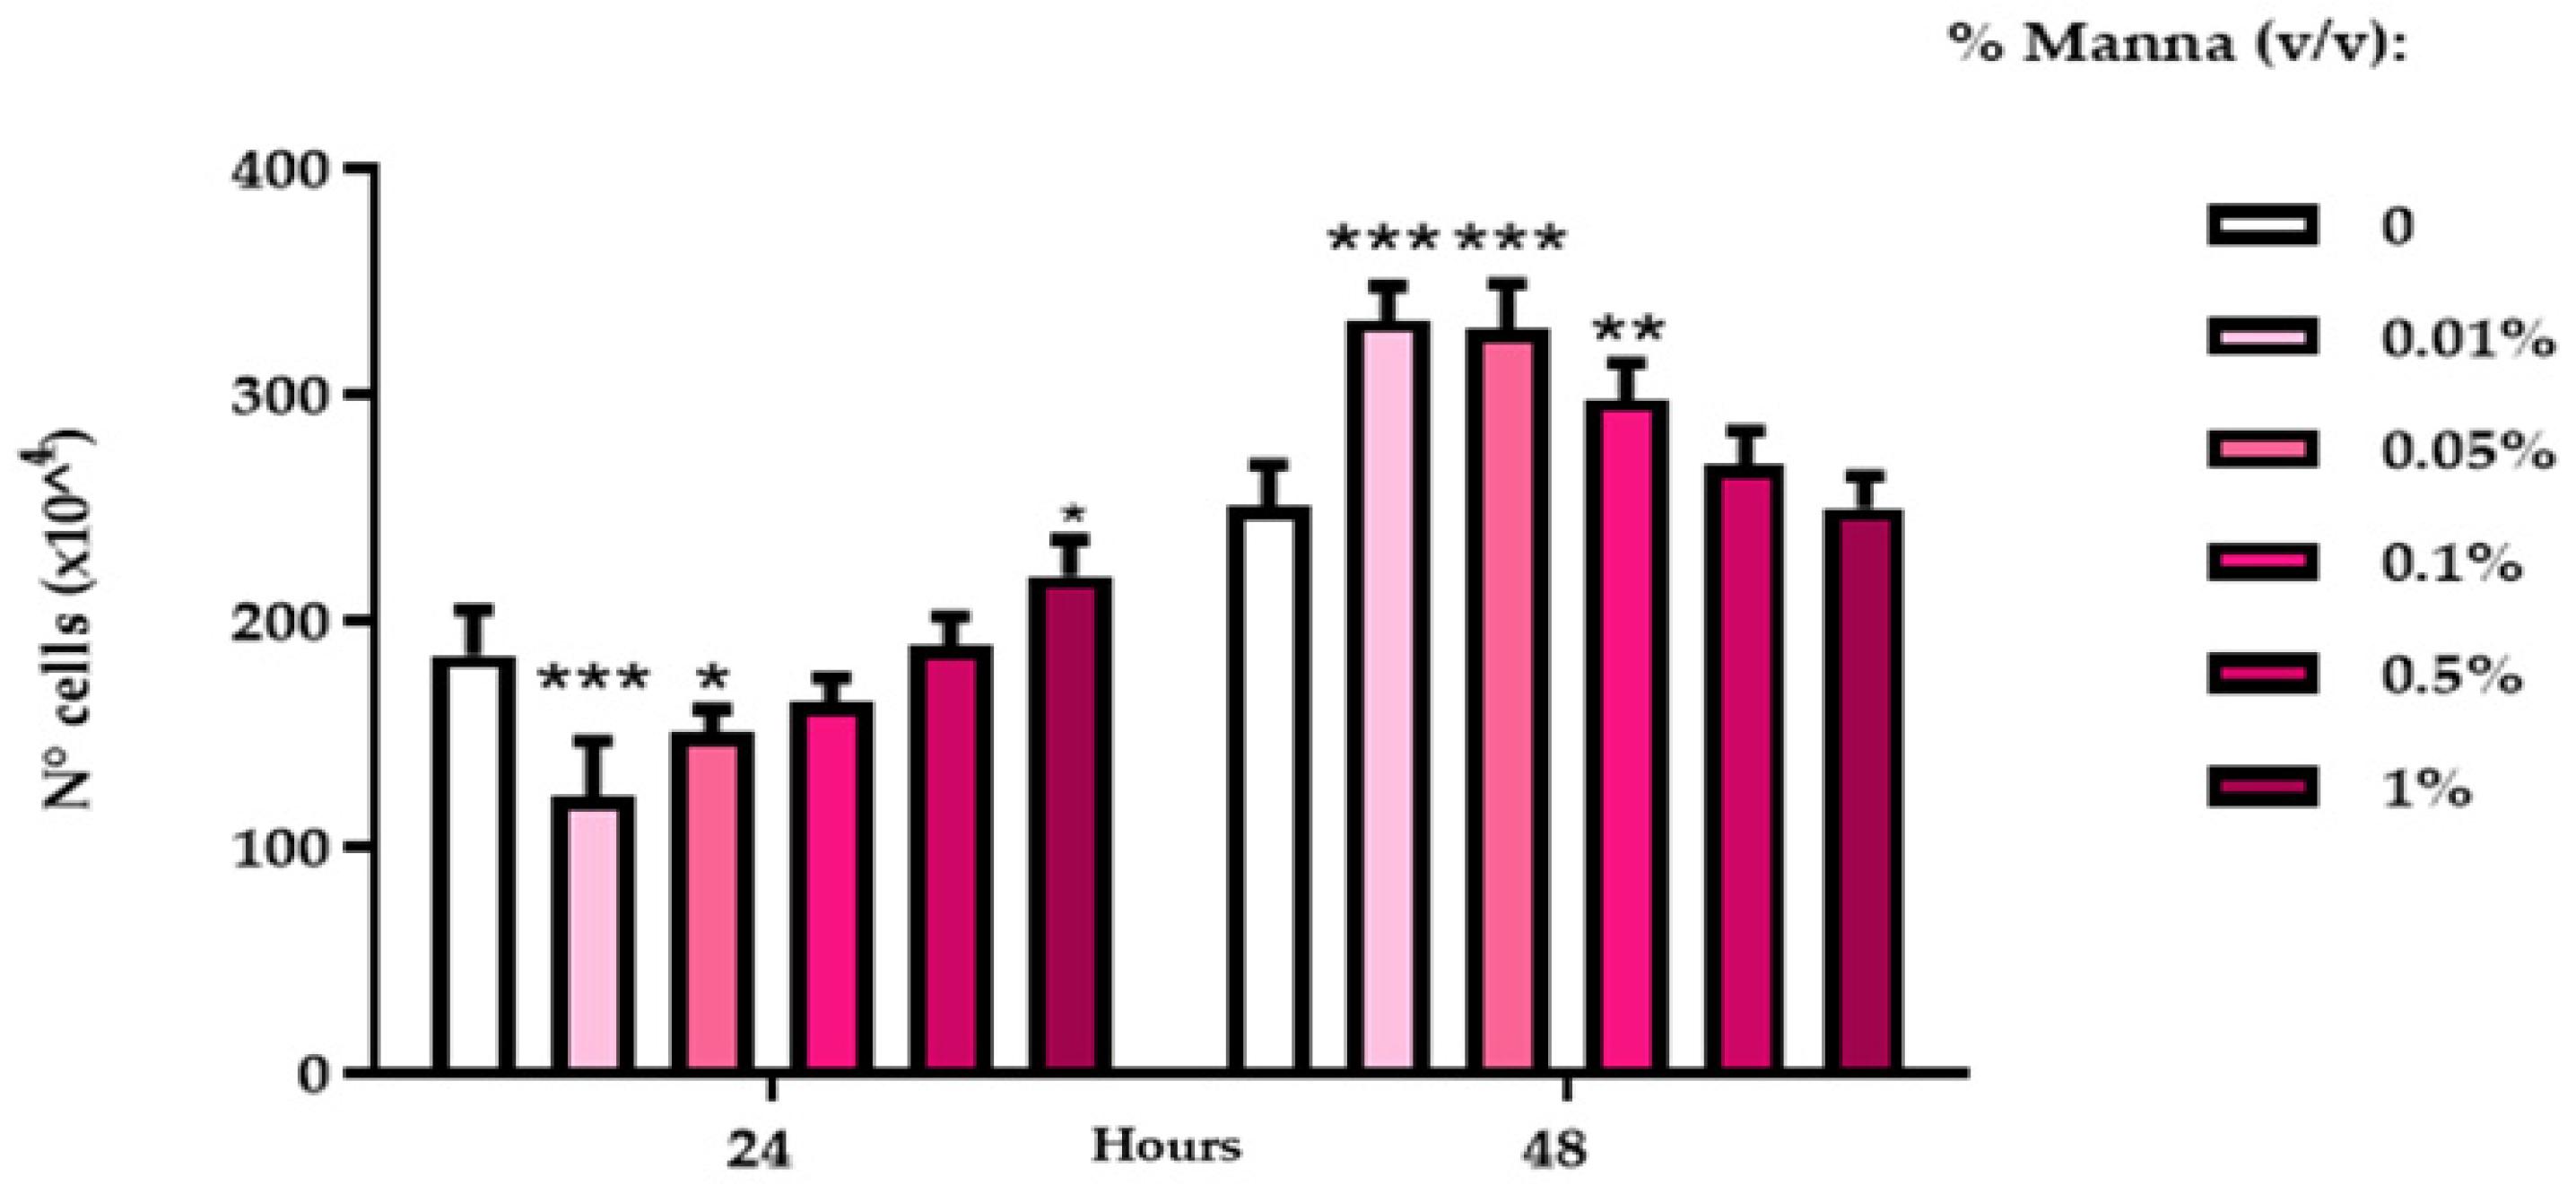
4.4.3. DNA Assay
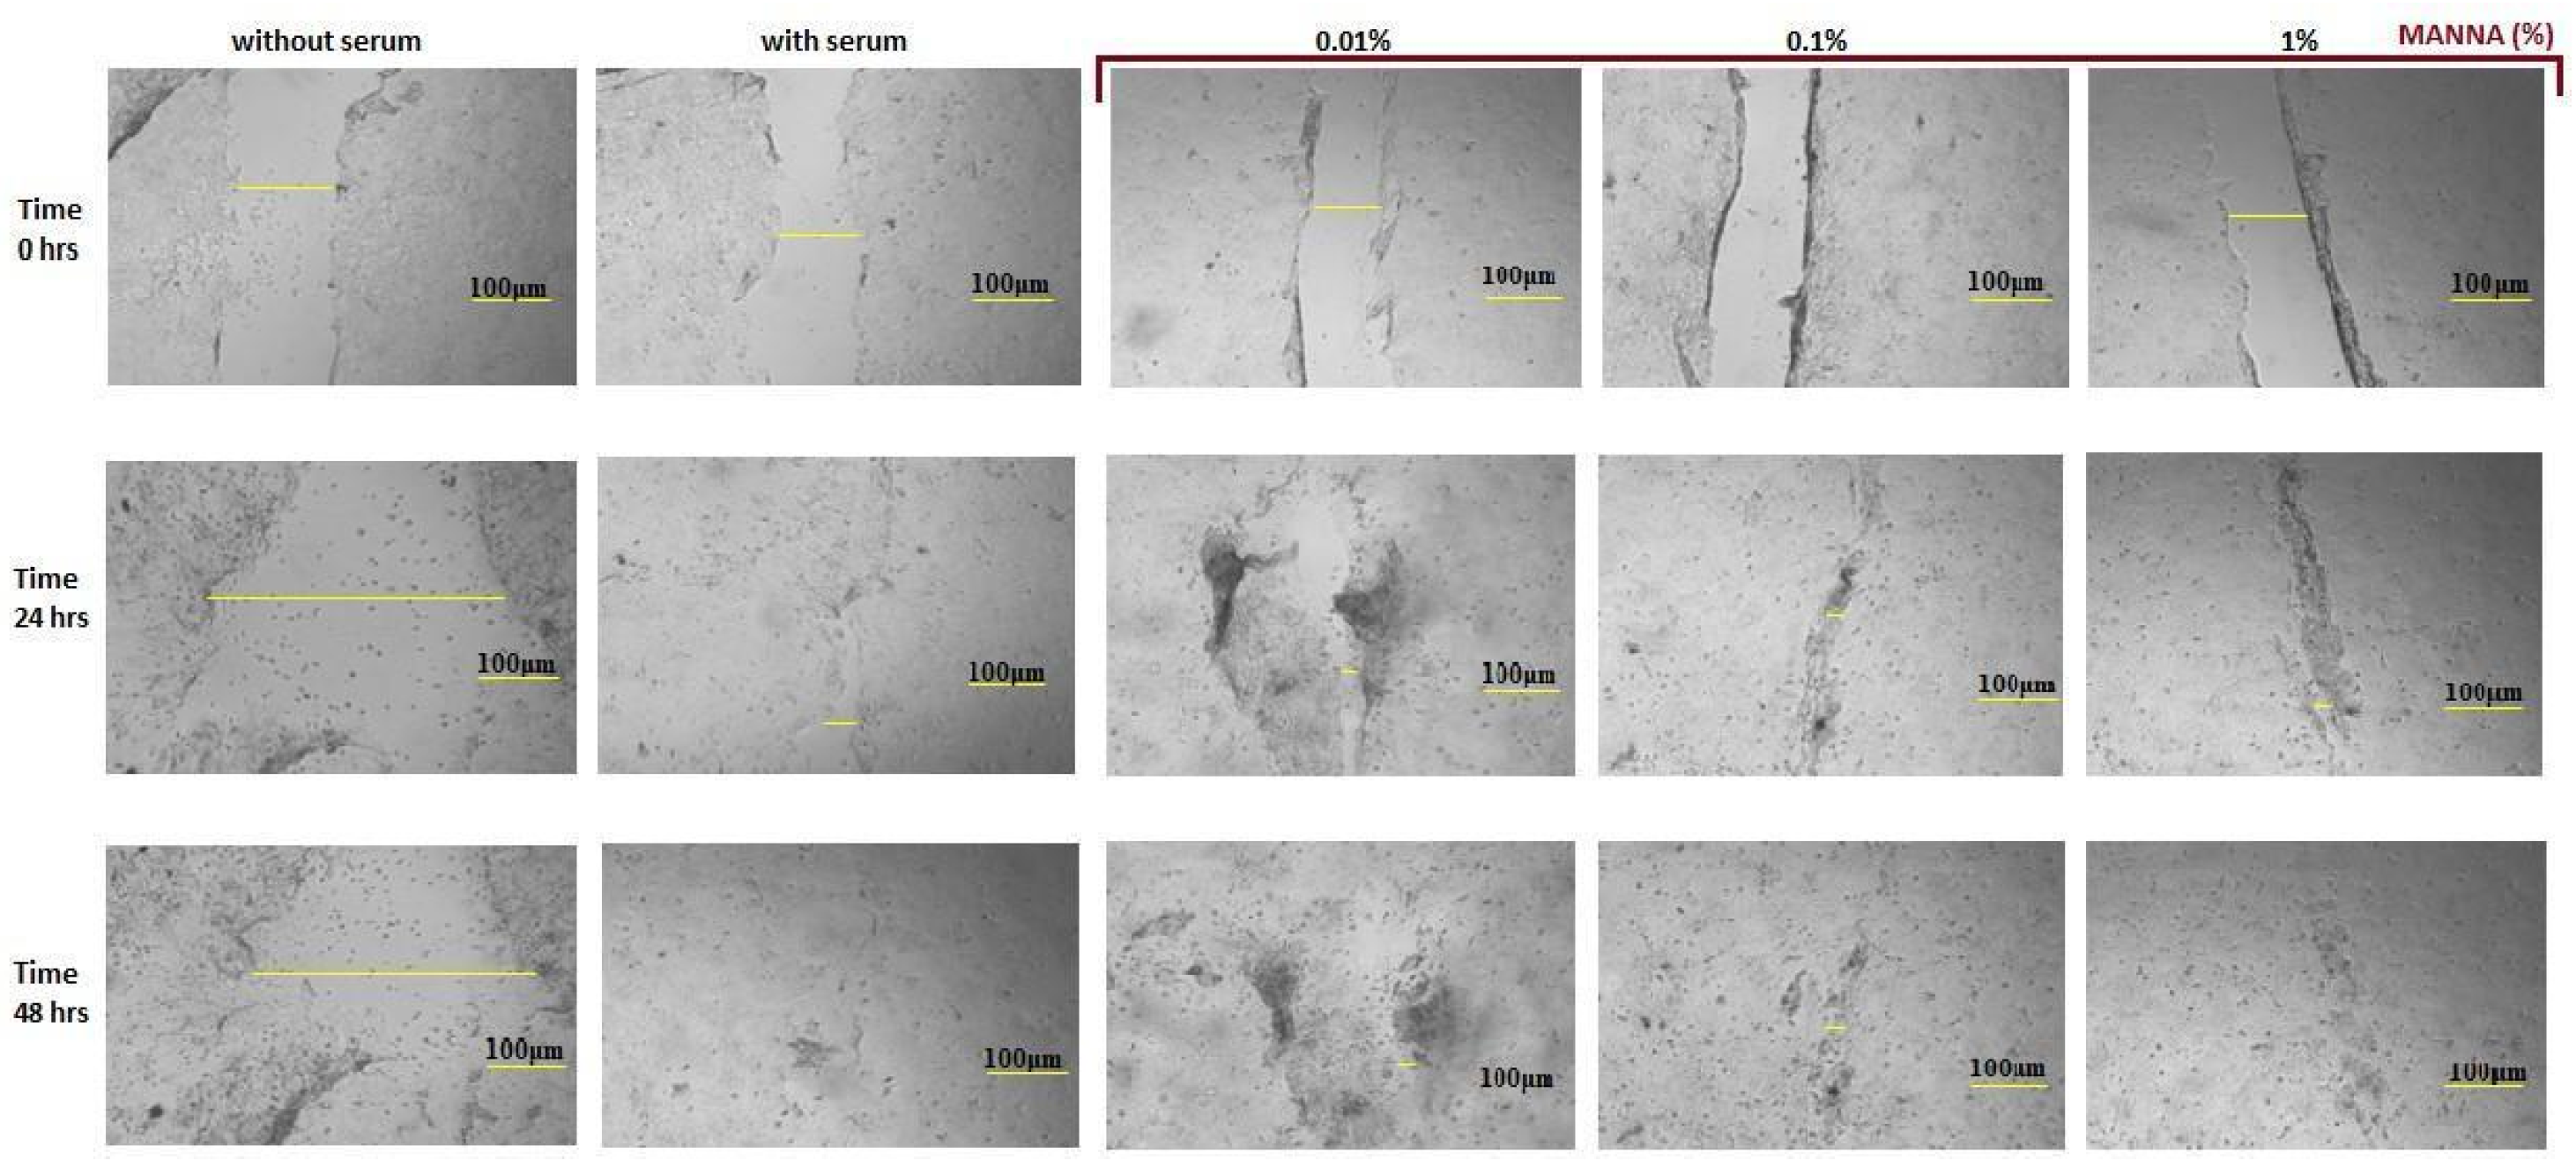
4.4.4. Scratch Wound Assay
4.5. Hydrogel Preparation
4.6. Hydrogel Characterization
4.6.1. pH Measurement
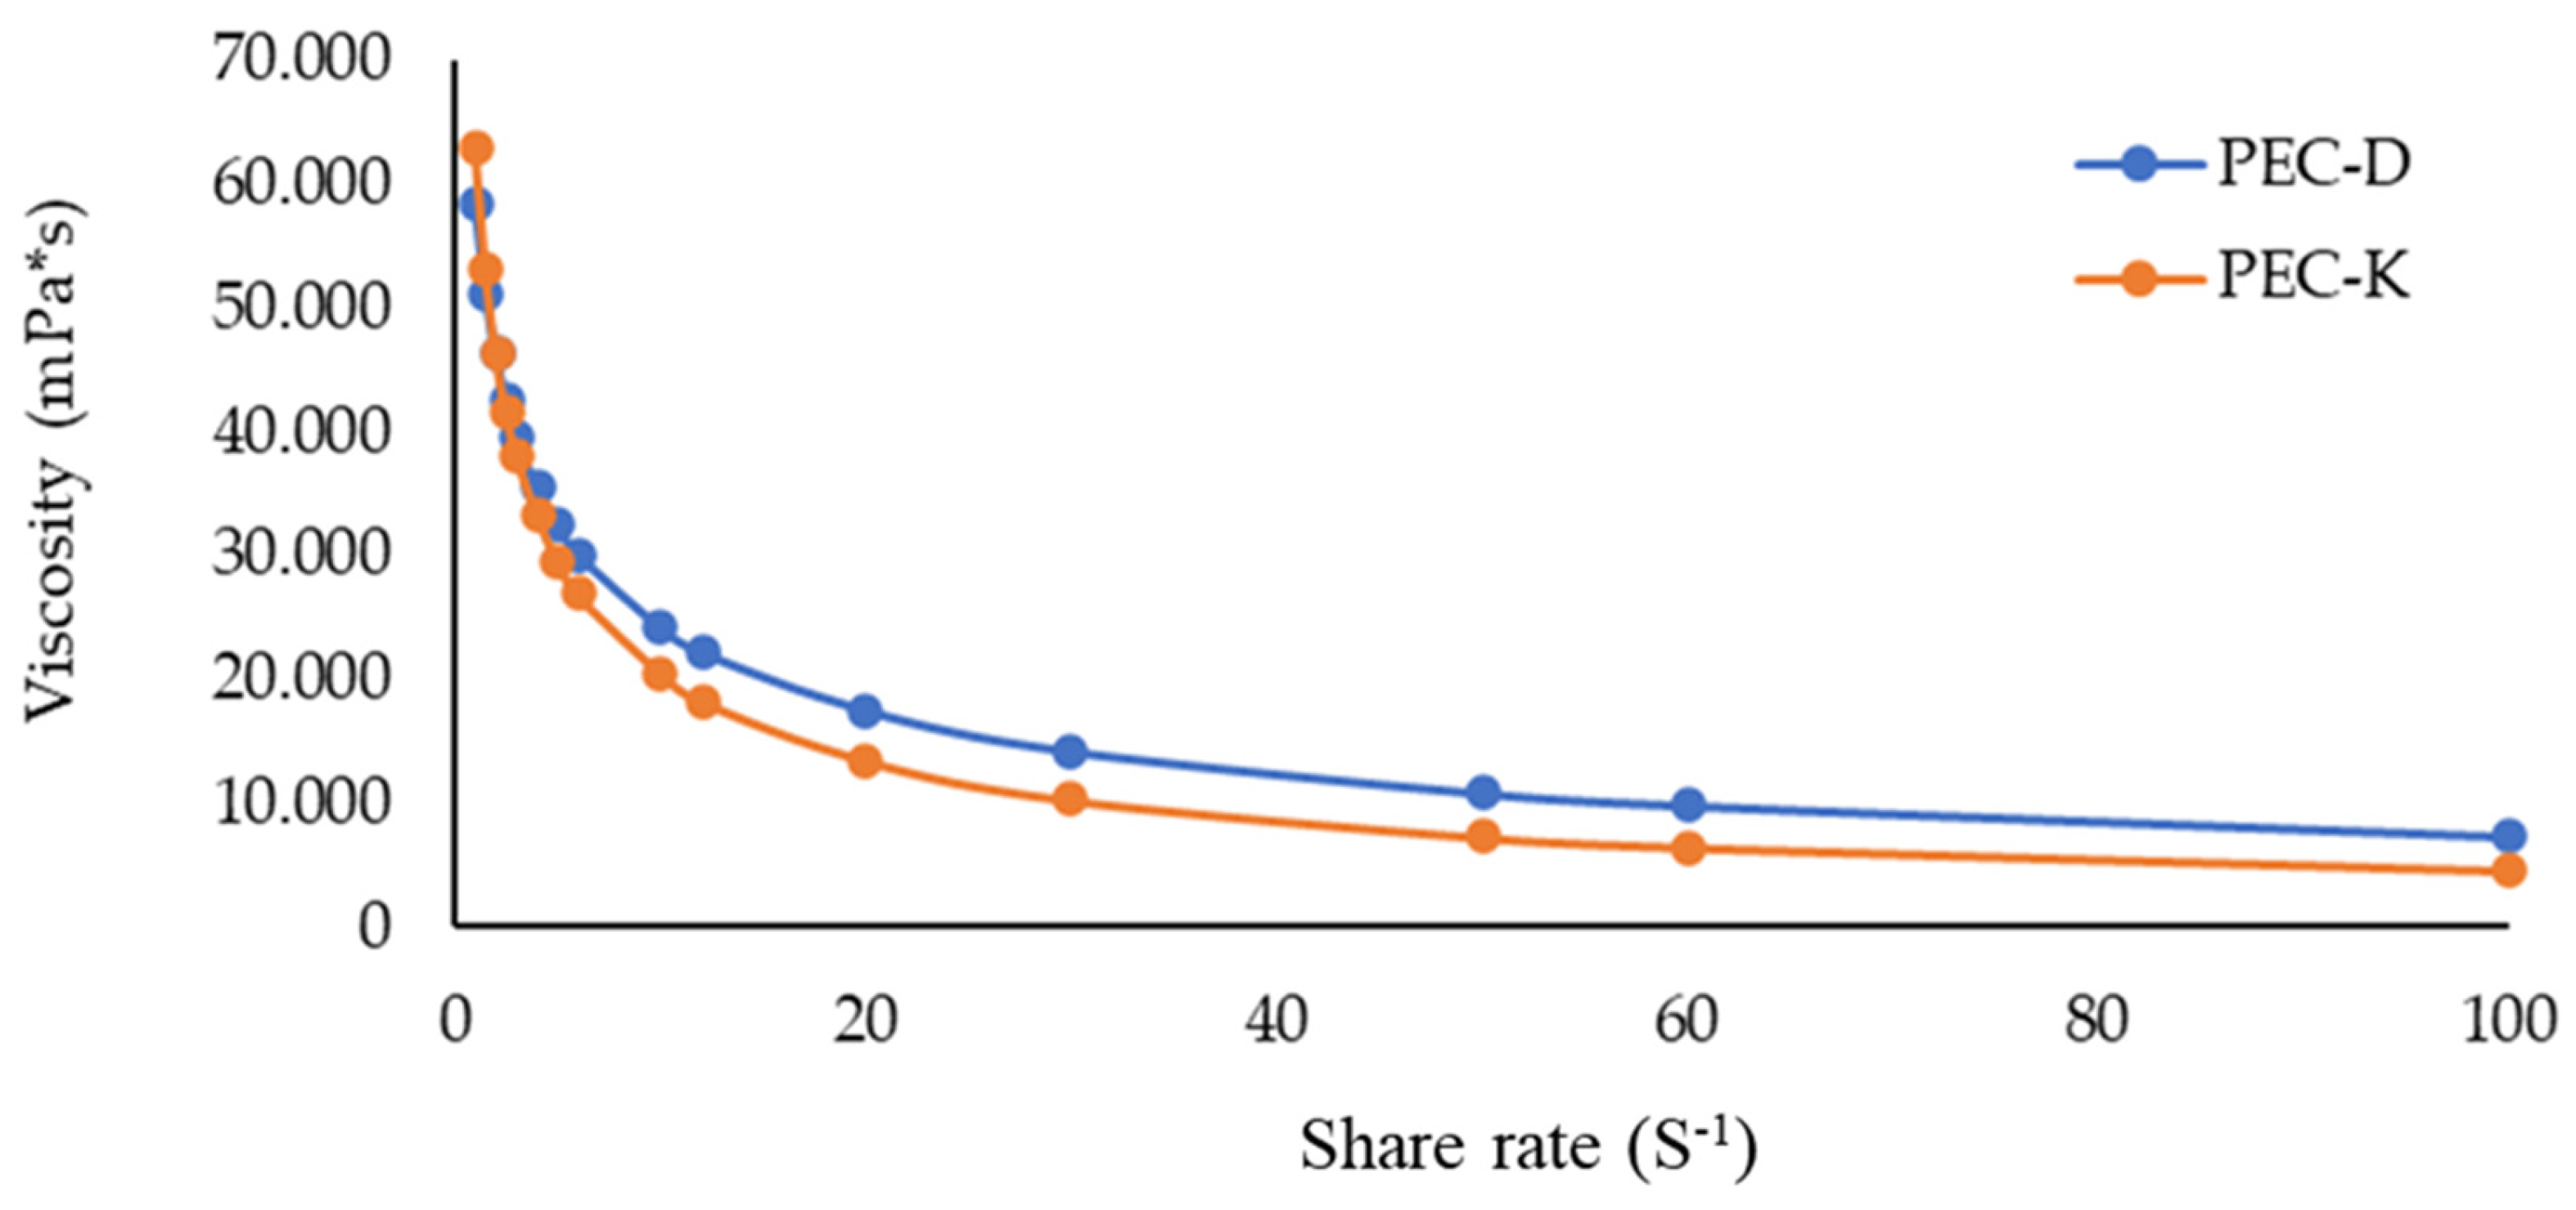
4.6.2. Rheological Study
4.6.3. Gel Antioxidant Activity
4.6.4. Folin–Ciocalteu Spectrophotometric Determination in Gels
4.7. Statistical Analysis
Author Contributions
Funding
Institutional Review Board Statement
Informed Consent Statement
Data Availability Statement
Acknowledgments
Conflicts of Interest
References
- Official Pharmacopoeia of the Republic Italian, 12th ed.; Polygraphic Institute and State Mint: Rome, Italy, 2008.
- Cornara, L.; Sanclemente, G.; Robustelli della Cuna, F.S.; Preda, S.; Raimondo, F. La Manna, Il Dono Delle Madonie. Erboristeria domani 2017, 402, 74–85. [Google Scholar]
- Boccone, P. Museo di Fisica e di Esperienze. Zuccato, J.B., Ed.; per Io. Baptista Zuccato: Venezia, Italy, 1697; pp. XIV–XV. [Google Scholar]
- Flückiger, F.A.; Hanbury, D. Histoire des Drogues D’origine Végétale; De Lanessan, J.L., Translator; Octave Doin, Paris II: Paris, France, 1878; pp. 322–323. [Google Scholar]
- Spadaro, V.; Raimondo, F.M. La manna delle Madonie (Sicilia): Dai frassineti ai prodotti farmaceutici e alimentari. Alimentazione Mediterranea. 2011, 1, 22–25. [Google Scholar]
- Caligiani, A.; Tonelli, L.; Palla, G.; Marseglia, A.; Rossi, D.; Bruni, R. Looking beyond Sugars: Phytochemical Profiling and Standardization of Manna Exudates from Sicilian Fraxinus Excelsior L. Fitoterapia 2013, 90, 65–72. [Google Scholar] [CrossRef]
- Attanzio, A.; D’Anneo, A.; Pappalardo, F.; Bonina, F.P.; Livrea, M.A.; Allegra, M.; Tesoriere, L. Phenolic Composition of Hydrophilic Extract of Manna from Sicilian Fraxinus angustifolia Vahl and Its Reducing, Antioxidant and Anti-Inflammatory Activity in Vitro. Antioxidants 2019, 8, 494. [Google Scholar] [CrossRef]
- Lazzarini, E.; Lonardoni, A.R. La Manna Salute Della Natura; Edizioni Mediterranee: Rome, Italy, 1984. [Google Scholar]
- Trease, G.E.; Evans, W.C. Farmacognosia. Piccin: Padova, Italy, 1995; pp. 315–316. [Google Scholar]
- Schicchi, R.; Camarda, L.; Spadaro, V.; Pitonzo, R. Caratterizzazione Chimica Della Manna Estratta Nelle Madonie (Sicilia) Da Cultivar Di Fraxinus angustifolia e Di Fraxinus ornus (Oleaceae). Quad. Bot. Amb. Appl. 2006, 17, 139–162. [Google Scholar]
- Lentini, F.; Mazzola, P.; Not, R. I frassini da manna. Nat. Montagna 1983, 30, 21–33. [Google Scholar]
- Guarcello, R.; Gaglio, R.; Todaro, A.; Alfonzo, A.; Schicchi, R.; Cirlincione, F.; Moschetti, G.; Francesca, N. Insights Into the Cultivable Microbial Ecology of “Manna” Ash Products Extracted From Fraxinus angustifolia (Oleaceae) Trees in Sicily, Italy. Front. Microbiol. 2019, 10, 984. [Google Scholar] [CrossRef]
- Guarrera, P.M.; Savo, V. Wild Food Plants Used in Traditional Vegetable Mixtures in Italy. J. Ethnopharmacol. 2016, 185, 202–234. [Google Scholar] [CrossRef]
- Kinghora, A.D.; Soejarto, D.D.; Inglett, G.E. Sweetening Agents of Plant Origin*. Crit. Rev. Plant Sci. 1986, 4, 79–120. [Google Scholar] [CrossRef]
- Lubrano, C.; Touzeau, B.; Laperdrix, C.; Robin, J. Development of a cosmetic plant active ingredient: Sustainable and scientific considerations. The example of an ash manna tree extract (Fraxinus ornus L.). Planta Med. 2013, 79, 1110. [Google Scholar] [CrossRef]
- Kadekaro, A.L.; Kavanagh, R.J.; Wakamatsu, K.; Ito, S.; Pipitone, M.A.; Abdel-Malek, Z.A. Cutaneous Photobiology. The Melanocyte vs. the Sun: Who Will Win the Final Round? Pigment Cell Res. 2003, 16, 434–447. [Google Scholar] [CrossRef]
- Wood, J.M.; Schallreuter, K.U. Studies on the Reactions between Human Tyrosinase, Superoxide Anion, Hydrogen Peroxide and Thiols. Biochim. Biophys. Acta 1991, 1074, 378–385. [Google Scholar] [CrossRef]
- Yasui, H.; Sakurai, H. Age-Dependent Generation of Reactive Oxygen Species in the Skin of Live Hairless Rats Exposed to UVA Light. Exp. Dermatol. 2003, 12, 655–661. [Google Scholar] [CrossRef]
- Ma, W.; Wlaschek, M.; Tantcheva-Poór, I.; Schneider, L.A.; Naderi, L.; Razi-Wolf, Z.; Schüller, J.; Scharffetter-Kochanek, K. Chronological Ageing and Photoageing of the Fibroblasts and the Dermal Connective Tissue. Clin. Exp. Dermatol. 2001, 26, 592–599. [Google Scholar] [CrossRef]
- Villa, C.; Rum, S.; Russo, E.; Kirilov, P. Green Synthesis of Organogelators from Renewable Natural Sources for Cosmetic and Pharmaceutical Applications. Mat. Lett. 2023, 340, 134170. [Google Scholar] [CrossRef]
- Villa, C.; Robustelli Della Cuna, F.S.; Russo, E.; Ibrahim, M.F.; Grignani, E.; Preda, S. Microwave-Assisted and Conventional Extractions of Volatile Compounds from Rosa x damascena Mill. Fresh Petals for Cosmetic Applications. Molecules 2022, 27, 3963. [Google Scholar] [CrossRef]
- Caviglia, D.; Russo, E.; Preda, S.; Robustelli della Cuna, F.S.; Villa, C. In Situ NADES Microwave-mediated Extraction of Bioactive Compounds from Beta vulgaris L. Var. Rubra Waste. Int. J. Food Sci. Technol. 2024, 59, 3271–3282. [Google Scholar] [CrossRef]
- Jacob, S.; Nair, A.B.; Shah, J.; Sreeharsha, N.; Gupta, S.; Shinu, P. Emerging Role of Hydrogels in Drug Delivery Systems, Tissue Engineering and Wound Management. Pharmaceutics 2021, 13, 357. [Google Scholar] [CrossRef]
- Sila, D.N.; Van Buggenhout, S.; Duvetter, T.; Fraeye, I.; De Roeck, A.; Van Loey, A.; Hendrickx, M. Pectins in Processed Fruits and Vegetables: Part II—Structure–Function Relationships. Compr. Rev. Food Sci. Food Saf. 2009, 8, 86–104. [Google Scholar] [CrossRef]
- Nordin, N.N.; Aziz, N.K.; Naharudin, I.; Anuar, N.K. Effects of Drug-Free Pectin Hydrogel Films on Thermal Burn Wounds in Streptozotocin-Induced Diabetic Rats. Polymers 2022, 14, 2873. [Google Scholar] [CrossRef]
- Oddo, E.; Saiano, F.; Alonzo, G.; Bellini, E. An Investigation of the Seasonal Pattern of Mannitol Content in Deciduous and Evergreen Species of the Oleaceae Growing in Northern Sicily. Ann. Bot. 2002, 90, 239–243. [Google Scholar] [CrossRef] [PubMed]
- Schofield, P.; Mbugua, D.; Pell, A. Analysis of Condensed Tannins: A Review. Anim. Feed Sci. Technol. 2001, 91, 21–40. [Google Scholar] [CrossRef]
- European Pharmacopoeia, 6th ed.; Council of Europe: Strasbourg, France, 2007; ISBN 978-92-871-6054-6.
- Porter, L.J.; Hrstich, L.N.; Chan, B.G. The Conversion of Procyanidins and Prodelphinidins to Cyanidin and Delphinidin. Phytochemistry 1985, 25, 223–230. [Google Scholar] [CrossRef]
- Chlapanidas, T.; Faragò, S.; Lucconi, G.; Perteghella, S.; Galuzzi, M.; Mantelli, M.; Avanzini, M.A.; Tosca, M.C.; Marazzi, M.; Vigo, D.; et al. Sericins Exhibit ROS-Scavenging, Anti-Tyrosinase, Anti-Elastase, and in Vitro Immunomodulatory Activities. Int. J. Biol. Macromol. 2013, 58, 47–56. [Google Scholar] [CrossRef] [PubMed]
- Mosmann, T. Rapid Colorimetric Assay for Cellular Growth and Survival: Application to Proliferation and Cytotoxicity Assays. J. Immunol. Methods 1983, 65, 55–63. [Google Scholar] [CrossRef] [PubMed]
- Rao, J.; Otto, W.R. Fluorimetric DNA Assay for Cell Growth Estimation. Anal. Biochem. 1992, 207, 186–192. [Google Scholar] [CrossRef] [PubMed]
- Rengarajan, K.; Cristol, S.; Mehta, M.; Nickerson, J. Quantifying DNA Concentrations Using Fluorometry: A Comparison of Fluorophores. Mol. Vis. 2002, 8, 416–421. [Google Scholar]
- Joshi, M.; Patravale, V. Formulation and Evaluation of Nanostructured Lipid Carrier (NLC)-Based Gel of Valdecoxib. Drug Dev. Ind. Pharm. 2006, 32, 911–918. [Google Scholar] [CrossRef]
- Russo, E.; Spallarossa, A.; Comite, A.; Pagliero, M.; Guida, P.; Belotti, V.; Caviglia, D.; Schito, A.M. Valorization and Potential Antimicrobial Use of Olive Mill Wastewater (OMW) from Italian Olive Oil Production. Antioxidants 2022, 11, 903. [Google Scholar] [CrossRef]
- Singleton, V.L.; Orthofer, R.; Lamuela-Raventós, R.M. [14] Analysis of Total Phenols and Other Oxidation Substrates and Antioxidants by Means of Folin-Ciocalteu Reagent. In Methods in Enzymology; Oxidants and Antioxidants Part A; Academic Press: Cambridge, MA, USA, 1999; Volume 299, pp. 152–178. [Google Scholar]


| Compound | Quantity (g/100 g) |
|---|---|
| Glucose | 2.43 ± 0.04 |
| Fructose | 5.84 ± 0.27 |
| Resistant Starch | 1.93 ± 0.08 |
| Starch | 1.34 ± 0.08 |
| Mannitol | 75.78 ± 0.68 |
| Total polyphenols | 0.21 ± 0.03 |
| Hydroxycinnamic Acids | 0.04 ± 0.01 |
| Flavonoids | 0.02 ± 0.01 |
| Tannins | 0.06 ± 0.03 |
| Sample Concentration (mg/mL) | Anti-Tyrosinase Activity % (Mean ± SE) | Km (μM) (Mean ± SE) | Vmax (μmol/min) (Mean ± SE) |
|---|---|---|---|
| CTR | - | 19.75 ± 0.645 a | 1.43 ± 0.022 a |
| 1.25 | 0.46 ± 0.069 a | 25.47 ± 1.041 a | 1.58 ± 0.034 a |
| 2.5 | 2.33 ± 1.122 a | 19.92 ± 0.843 a | 1.43 ± 0.029 a |
| 5 | 3.63 ± 1.401 a | 20.29 ± 0.634 a | 1.45 ± 0.022 a |
| 10 | 5.47 ± 1.152 a | 19.91 ± 0.632 a | 1.45 ± 0.022 a |
| 20 | 10.08 ± 3.584 b | 19.54 ± 0.949 a | 1.42 ± 0.033 a |
| 40 | 10.96 ± 4.051 b | 18.78 ± 0.884 a | 1.31 ± 0.029 a |
| Sample Concentration (mg/mL) | Anti-Elastase Activity % (Mean ± SE) | Km (μM) (Mean ± SE) | Vmax (μmol/min) (Mean ± SE) |
|---|---|---|---|
| CTR | - | 6.63 ± 0.387 a | 0.98 ± 0.016 a |
| 1.25 | 10.69 ± 4.086 a | 12.57 ± 4.166 b | 0.87 ± 0.112 a |
| 2.5 | 10.16 ± 3.140 a | 8.45 ± 0.389 b | 1.06 ± 0.016 a |
| 5 | 11.57 ± 2.772 a | 8.48 ± 0.287 b | 1.03 ± 0.011 a |
| 10 | 16.13 ± 3.003 a | 8.18 ± 0.525 b | 1.00 ± 0.020 a |
| 20 | 26.00 ± 3.452 b | 11.63 ± 0.456 b | 1.08 ± 0.016 a |
| 40 | 25.05 ± 5.110 b | 12.16 ± 0.794 b | 1.11 ± 0.028 a |
| Hydrogel Sample | pH |
|---|---|
| BN PEC-D | 5.04 ± 0.02 |
| BN PEC-K | 6.10 ± 0.01 |
| PEC-D | 5.50 ± 0.01 |
| PEC-K | 6.80 ± 0.02 |
| Absorbance λ = 515 nm | % DPPH | AA% | |
|---|---|---|---|
| DPPH | 0.443 | 100 | - |
| PEC-K | 0.340 | 76.75 ± 0.3 | 11.71 ± 0.3 |
| PEC-D | 0.351 | 79.23 ± 0.2 | 10.33 ± 0.2 |
| Absorbance λ = 750 nm | mg GAE/g gel | |
|---|---|---|
| PEC-K | 0.436 | 35.66 ± 0.15 |
| PEC-D | 0.361 | 29.51 ± 0.22 |
| Formulation | Pectin Citrus (% w/w) | Manna (% w/w) | CaCl2 (mL) | Dermosoft (%) | Potassium Sorbate (%) |
|---|---|---|---|---|---|
| BN PEC-D | 2.5 | - | 1 | 2 | - |
| BN PEC-K | 2.5 | - | 1 | - | 0.5 |
| PEC-D | 2.5 | 1 | 1 | 2 | - |
| PEC-K | 2.5 | 1 | 1 | - | 0.5 |
Disclaimer/Publisher’s Note: The statements, opinions and data contained in all publications are solely those of the individual author(s) and contributor(s) and not of MDPI and/or the editor(s). MDPI and/or the editor(s) disclaim responsibility for any injury to people or property resulting from any ideas, methods, instructions or products referred to in the content. |
© 2024 by the authors. Licensee MDPI, Basel, Switzerland. This article is an open access article distributed under the terms and conditions of the Creative Commons Attribution (CC BY) license (https://creativecommons.org/licenses/by/4.0/).
Share and Cite
Villa, C.; Cuna, F.S.R.d.; Grignani, E.; Perteghella, S.; Panzeri, D.; Caviglia, D.; Russo, E. Evaluation of the Biological Activity of Manna Exudate, from Fraxinus ornus L., and Its Potential Use as Hydrogel Formulation in Dermatology and Cosmetology. Gels 2024, 10, 351. https://doi.org/10.3390/gels10060351
Villa C, Cuna FSRd, Grignani E, Perteghella S, Panzeri D, Caviglia D, Russo E. Evaluation of the Biological Activity of Manna Exudate, from Fraxinus ornus L., and Its Potential Use as Hydrogel Formulation in Dermatology and Cosmetology. Gels. 2024; 10(6):351. https://doi.org/10.3390/gels10060351
Chicago/Turabian StyleVilla, Carla, Francesco Saverio Robustelli della Cuna, Elena Grignani, Sara Perteghella, Davide Panzeri, Debora Caviglia, and Eleonora Russo. 2024. "Evaluation of the Biological Activity of Manna Exudate, from Fraxinus ornus L., and Its Potential Use as Hydrogel Formulation in Dermatology and Cosmetology" Gels 10, no. 6: 351. https://doi.org/10.3390/gels10060351
APA StyleVilla, C., Cuna, F. S. R. d., Grignani, E., Perteghella, S., Panzeri, D., Caviglia, D., & Russo, E. (2024). Evaluation of the Biological Activity of Manna Exudate, from Fraxinus ornus L., and Its Potential Use as Hydrogel Formulation in Dermatology and Cosmetology. Gels, 10(6), 351. https://doi.org/10.3390/gels10060351