

Ionic Strength Impacts the Physical Properties of Agarose Hydrogels

 ,
,  ,
,  , and
, and 
Abstract
1. Introduction
2. Results and Discussion
3. Conclusions
4. Materials and Methods
4.1. Preparation of Agarose Hydrogels
4.2. Compression Tests
4.3. Rheological Characterization
4.4. BSA Diffusion Tests
4.5. Low Field NMR Relaxometry
4.6. Average Mesh Size Determination
Supplementary Materials
Author Contributions
Funding
Data Availability Statement
Conflicts of Interest
References
- Zarrintaj, P.; Manouchehri, S.; Ahmadi, Z.; Saeb, M.R.; Urbanska, A.M.; Kaplan, D.L.; Mozafari, M. Agarose-based biomaterials for tissue engineering. Carbohydr. Polym. 2018, 187, 66–84. [Google Scholar] [CrossRef] [PubMed]
- Cok, M.; Sacco, P.; Porrelli, D.; Travan, A.; Borgogna, M.; Marsich, E.; Paoletti, S.; Donati, I. Mimicking mechanical response of natural tissues. Strain hardening induced by transient reticulation in lactose-modified chitosan (chitlac). Int. J. Biol. Macromol. 2018, 106, 656–660. [Google Scholar] [CrossRef] [PubMed]
- Sacco, P.; Furlani, F.; Paoletti, S.; Donati, I. PH-Assisted Gelation of Lactose-Modified Chitosan. Biomacromolecules 2019, 20, 3070–3075. [Google Scholar] [CrossRef]
- Sacco, P.; Furlani, F.; Cok, M.; Travan, A.; Borgogna, M.; Marsich, E.; Paoletti, S.; Donati, I. Boric Acid Induced Transient Cross-Links in Lactose-Modified Chitosan (Chitlac). Biomacromolecules 2017, 18, 4206–4213. [Google Scholar] [CrossRef] [PubMed]
- Khong, T.T.; Aarstad, O.A.; Skjåk-Bræk, G.; Draget, K.I.; Vårum, K.M. Gelling concept combining chitosan and alginate—Proof of principle. Biomacromolecules 2013, 14, 2765–2771. [Google Scholar] [CrossRef] [PubMed]
- Furlani, F.; Sacco, P.; Scognamiglio, F.; Asaro, F.; Travan, A.; Borgogna, M.; Marsich, E.; Cok, M.; Paoletti, S.; Donati, I. Nucleation, reorganization and disassembly of an active network from lactose-modified chitosan mimicking biological matrices. Carbohydr. Polym. 2019, 208, 451–456. [Google Scholar] [CrossRef] [PubMed]
- Donati, I.; Christensen, B.E. Alginate-metal cation interactions: Macromolecular approach. Carbohydr. Polym. 2023, 321, 121280. [Google Scholar] [CrossRef]
- Tako, M.; Nakamura, S. Gelation mechanism of agarose. Carbohydr. Res. 1988, 180, 277–284. [Google Scholar] [CrossRef]
- Manno, M.; Emanuele, A.; Martorana, V.; Bulone, D.; San Biagio, P.L.; Palma-Vittorelli, M.B.; Palma, M.U. Multiple interactions between molecular and supramolecular ordering. Phys. Rev. E 1999, 59, 2222. [Google Scholar] [CrossRef]
- Feke, G.T.; Prins, W. Spinodal Phase Separation in a Macromolecular Sol → Gel Transition. Macromolecules 1974, 7, 527–530. [Google Scholar] [CrossRef]
- Matsuo, M.; Tanaka, T.; Ma, L. Gelation mechanism of agarose and κ-carrageenan solutions estimated in terms of concentration fluctuation. Polymer 2002, 43, 5299–5309. [Google Scholar] [CrossRef]
- Rüther, A.; Forget, A.; Roy, A.; Carballo, C.; Mießmer, F.; Dukor, R.K.; Nafie, L.A.; Johannessen, C.; Shastri, V.P.; Lüdeke, S. Unravelling a Direct Role for Polysaccharide β-Strands in the Higher Order Structure of Physical Hydrogels. Angew. Chem. Int. Ed. 2017, 56, 4603–4607. [Google Scholar] [CrossRef] [PubMed]
- Xiong, J.Y.; Narayanan, J.; Liu, X.Y.; Chong, T.K.; Chen, S.B.; Chung, T.S. Topology evolution and gelation mechanism of agarose gel. J. Phys. Chem. B 2005, 109, 5638–5643. [Google Scholar] [CrossRef] [PubMed]
- Piazza, F.; Parisse, P.; Passerino, J.; Marsich, E.; Bersanini, L.; Porrelli, D.; Baj, G.; Donati, I.; Sacco, P.; Piazza, F.; et al. Controlled Quenching of Agarose Defines Hydrogels with Tunable Structural, Bulk Mechanical, Surface Nanomechanical and Cell Response in 2d Cultures. Adv. Healthc. Mater. 2023, 12, 2300973. [Google Scholar] [CrossRef] [PubMed]
- Buckley, C.T.; Thorpe, S.D.; O’Brien, F.J.; Robinson, A.J.; Kelly, D.J. The effect of concentration, thermal history and cell seeding density on the initial mechanical properties of agarose hydrogels. J. Mech. Behav. Biomed. Mater. 2009, 2, 512–521. [Google Scholar] [CrossRef] [PubMed]
- Normand, V.; Lootens, D.L.; Amici, E.; Plucknett, K.P.; Aymard, P. New insight into agarose gel mechanical properties. Biomacromolecules 2000, 1, 730–738. [Google Scholar] [CrossRef] [PubMed]
- Sugiyama, J.; Rochas, C.; Turquois, T.; Taravel, F.; Chanzy, H. Direct imaging of polysaccharide aggregates in frozen aqueous dilute systems. Carbohydr. Polym. 1994, 23, 261–264. [Google Scholar] [CrossRef]
- Pines, E.; Prins, W. Structure-Property Relations of Thermoreversible Macromolecular Hydrogels. Macromolecules 1973, 6, 888–895. [Google Scholar] [CrossRef]
- Le Goff, K.J.; Gaillard, C.; Helbert, W.; Garnier, C.; Aubry, T. Rheological study of reinforcement of agarose hydrogels by cellulose nanowhiskers. Carbohydr. Polym. 2015, 116, 117–123. [Google Scholar] [CrossRef]
- Rochas, C.; Hecht, A.M.; Geissler, E. Scattering properties of agarose gels. Macromol. Symp. 1999, 138, 157–163. [Google Scholar] [CrossRef]
- Bica, C.I.D.; Borsali, R.; Geissler, E.; Rochas, C. Dynamics of cellulose whiskers in agarose gels. 1. Polarized dynamic light scattering. Macromolecules 2001, 34, 5275–5279. [Google Scholar] [CrossRef]
- Piazza, F.; Sacco, P.; Marsich, E.; Baj, G.; Asaro, F.; Grassi, G.; Grassi, M.; Donati, I. Cell activities on viscoelastic substrates show an elastic energy threshold and correlate with the linear elastic energy loss in the strain-softening region. Adv. Funct. Mater. 2023, 33, 2307224. [Google Scholar] [CrossRef]
- Sacco, P.; Piazza, F.; Pizzolitto, C.; Baj, G.; Brun, F.; Marsich, E.; Donati, I.; Sacco, P.; Piazza, F.; Baj, G.; et al. Regulation of Substrate Dissipation via Tunable Linear Elasticity Controls Cell Activity. Adv. Funct. Mater. 2022, 32, 2200309. [Google Scholar] [CrossRef]
- Lee, H.; Gu, L.; Mooney, D.J.; Levenston, M.E.; Chaudhuri, O. Mechanical confinement regulates cartilage matrix formation by chondrocytes. Nat. Mater. 2017, 16, 1243–1251. [Google Scholar] [CrossRef] [PubMed]
- Köpf, M.; Campos, D.F.D.; Blaeser, A.; Sen, K.S.; Fischer, H. A tailored three-dimensionally printable agarose–collagen blend allows encapsulation, spreading, and attachment of human umbilical artery smooth muscle cells. Biofabrication 2016, 8, 025011. [Google Scholar] [CrossRef] [PubMed]
- Roach, B.L.; Nover, A.B.; Ateshian, G.A.; Hung, C.T. Agarose Hydrogel Characterization for Regenerative Medicine Applications: Focus on Engineering Cartilage. Biomater. Nat. Adv. Devices Ther. 2016, 258–273. [Google Scholar] [CrossRef]
- Awadhiya, A.; Tyeb, S.; Rathore, K.; Verma, V. Agarose bioplastic-based drug delivery system for surgical and wound dressings. Eng. Life Sci. 2017, 17, 204–214. [Google Scholar] [CrossRef] [PubMed]
- Iwata, H.; Takagi, T.; Amemiya, H.; Shimizu, H.; Yamashita, K.; Kobayashi, K.; Akutsu, T. Agarose for a bioartificial pancreas. J. Biomed. Mater. Res. 1992, 26, 967–977. [Google Scholar] [CrossRef] [PubMed]
- Yamada, Y.; Yoshida, C.; Hamada, K.; Kikkawa, Y.; Nomizu, M. Development of Three-Dimensional Cell Culture Scaffolds Using Laminin Peptide-Conjugated Agarose Microgels. Biomacromolecules 2020, 21, 3765–3771. [Google Scholar] [CrossRef] [PubMed]
- Jin, N.; Morin, E.A.; Henn, D.M.; Cao, Y.; Woodcock, J.W.; Tang, S.; He, W.; Zhao, B. Agarose hydrogels embedded with pH-responsive diblock copolymer micelles for triggered release of substances. Biomacromolecules 2013, 14, 2713–2723. [Google Scholar] [CrossRef] [PubMed]
- Pauly, H.M.; Place, L.W.; Haut Donahue, T.L.; Kipper, M.J. Mechanical Properties and Cell Compatibility of Agarose Hydrogels Containing Proteoglycan Mimetic Graft Copolymers. Biomacromolecules 2017, 18, 2220–2229. [Google Scholar] [CrossRef] [PubMed]
- Wei, W. Hofmeister Effects Shine in Nanoscience. Adv. Sci. 2023, 10, 2302057. [Google Scholar] [CrossRef] [PubMed]
- Singh, T.; Meena, R.; Kumar, A. Effect of sodium sulfate on the gelling behavior of agarose and water structure inside the gel networks. J. Phys. Chem. B 2009, 113, 2519–2525. [Google Scholar] [CrossRef] [PubMed]
- Watase, M.; Nishinari, K. Effect of alkali metal ions on the viscoelasticity of concentrated kappa-carrageenan and agarose gels. Rheol. Acta 1982, 21, 318–324. [Google Scholar] [CrossRef]
- Sacco, P.; Cok, M.; Asaro, F.; Paoletti, S.; Donati, I. The role played by the molecular weight and acetylation degree in modulating the stiffness and elasticity of chitosan gels. Carbohydr. Polym. 2018, 196, 405–413. [Google Scholar] [CrossRef] [PubMed]
- Chaudhuri, O.; Cooper-White, J.; Janmey, P.A.; Mooney, D.J.; Shenoy, V.B. Effects of extracellular matrix viscoelasticity on cellular behaviour. Nature 2020, 584, 535–546. [Google Scholar] [CrossRef] [PubMed]
- Hribar, B.; Southall, N.T.; Vlachy, V.; Dill, K.A. How ions affect the structure of water. J. Am. Chem. Soc. 2002, 124, 12302–12311. [Google Scholar] [CrossRef] [PubMed]
- De’Nobili, M.D.; Rojas, A.M.; Abrami, M.; Lapasin, R.; Grassi, M. Structure characterization by means of rheological and NMR experiments as a first necessary approach to study the l-(+)-ascorbic acid diffusion from pectin and pectin/alginate films to agar hydrogels that mimic food materials. J. Food Eng. 2015, 165, 82–92. [Google Scholar] [CrossRef]
- Pescosolido, L.; Feruglio, L.; Farra, R.; Fiorentino, S.; Colombo, I.; Coviello, T.; Matricardi, P.; Hennink, W.E.; Vermonden, T.; Grassi, M. Mesh size distribution determination of interpenetrating polymer network hydrogels. Soft Matter 2012, 8, 7708–7715. [Google Scholar] [CrossRef]
- Abrami, M.; Bignotti, F.; Baldi, F.; Spagnoli, G.; Biasin, A.; Grassi, L.; Grassi, G.; Grassi, M. Rheological and low field NMR characterization of hydrophobically-modified PEG hydrogels for drug delivery. Int. J. Pharm. 2023, 637, 122882. [Google Scholar] [CrossRef]
- Coviello, T.; Matricardi, P.; Alhaique, F.; Farra, R.; Tesei, G.; Fiorentino, S.; Asaro, F.; Milcovich, G.; Grassi, M. Guar gum/borax hydrogel: Rheological, low field NMR and release characterizations. Express Polym. Lett. 2013, 7, 733–746. [Google Scholar] [CrossRef]
- Abrami, M.; Chiarappa, G.; Farra, R.; Grassi, G.; Marizza, P.; Grassi, M. Use of low-field NMR for the characterization of gels and biological tissues. ADMET DMPK 2018, 6, 34–46. [Google Scholar] [CrossRef]
- Sacco, P.; Brun, F.; Donati, I.; Porrelli, D.; Paoletti, S.; Turco, G. On the Correlation between the Microscopic Structure and Properties of Phosphate-Cross-Linked Chitosan Gels. ACS Appl. Mater. Interfaces 2018, 10, 10761–10770. [Google Scholar] [CrossRef] [PubMed]
- Medda, L.; Monduzzi, M.; Salis, A. The molecular motion of bovine serum albumin under physiological conditions is ion specific. Chem. Commun. 2015, 51, 6663–6666. [Google Scholar] [CrossRef] [PubMed]
- Chui, M.M.; Phillips, R.J.; McCarthy, M.J. Measurement of the Porous Microstructure of Hydrogels by Nuclear Magnetic Resonance. J. Colloid. Interface Sci. 1995, 174, 336–344. [Google Scholar] [CrossRef]
- Flory, P.J. Principles of Polymer Chemistry; Cornell University Press: Ithaca, NY, USA, 1953. [Google Scholar]
- Schurz, J. Rheology of polymer solutions of the network type. Prog. Polym. Sci. 1991, 16, 1–53. [Google Scholar] [CrossRef]

| I (M) | LiCl | NaCl | ||
|---|---|---|---|---|
| (kPa) | (%) | (kPa) | (%) | |
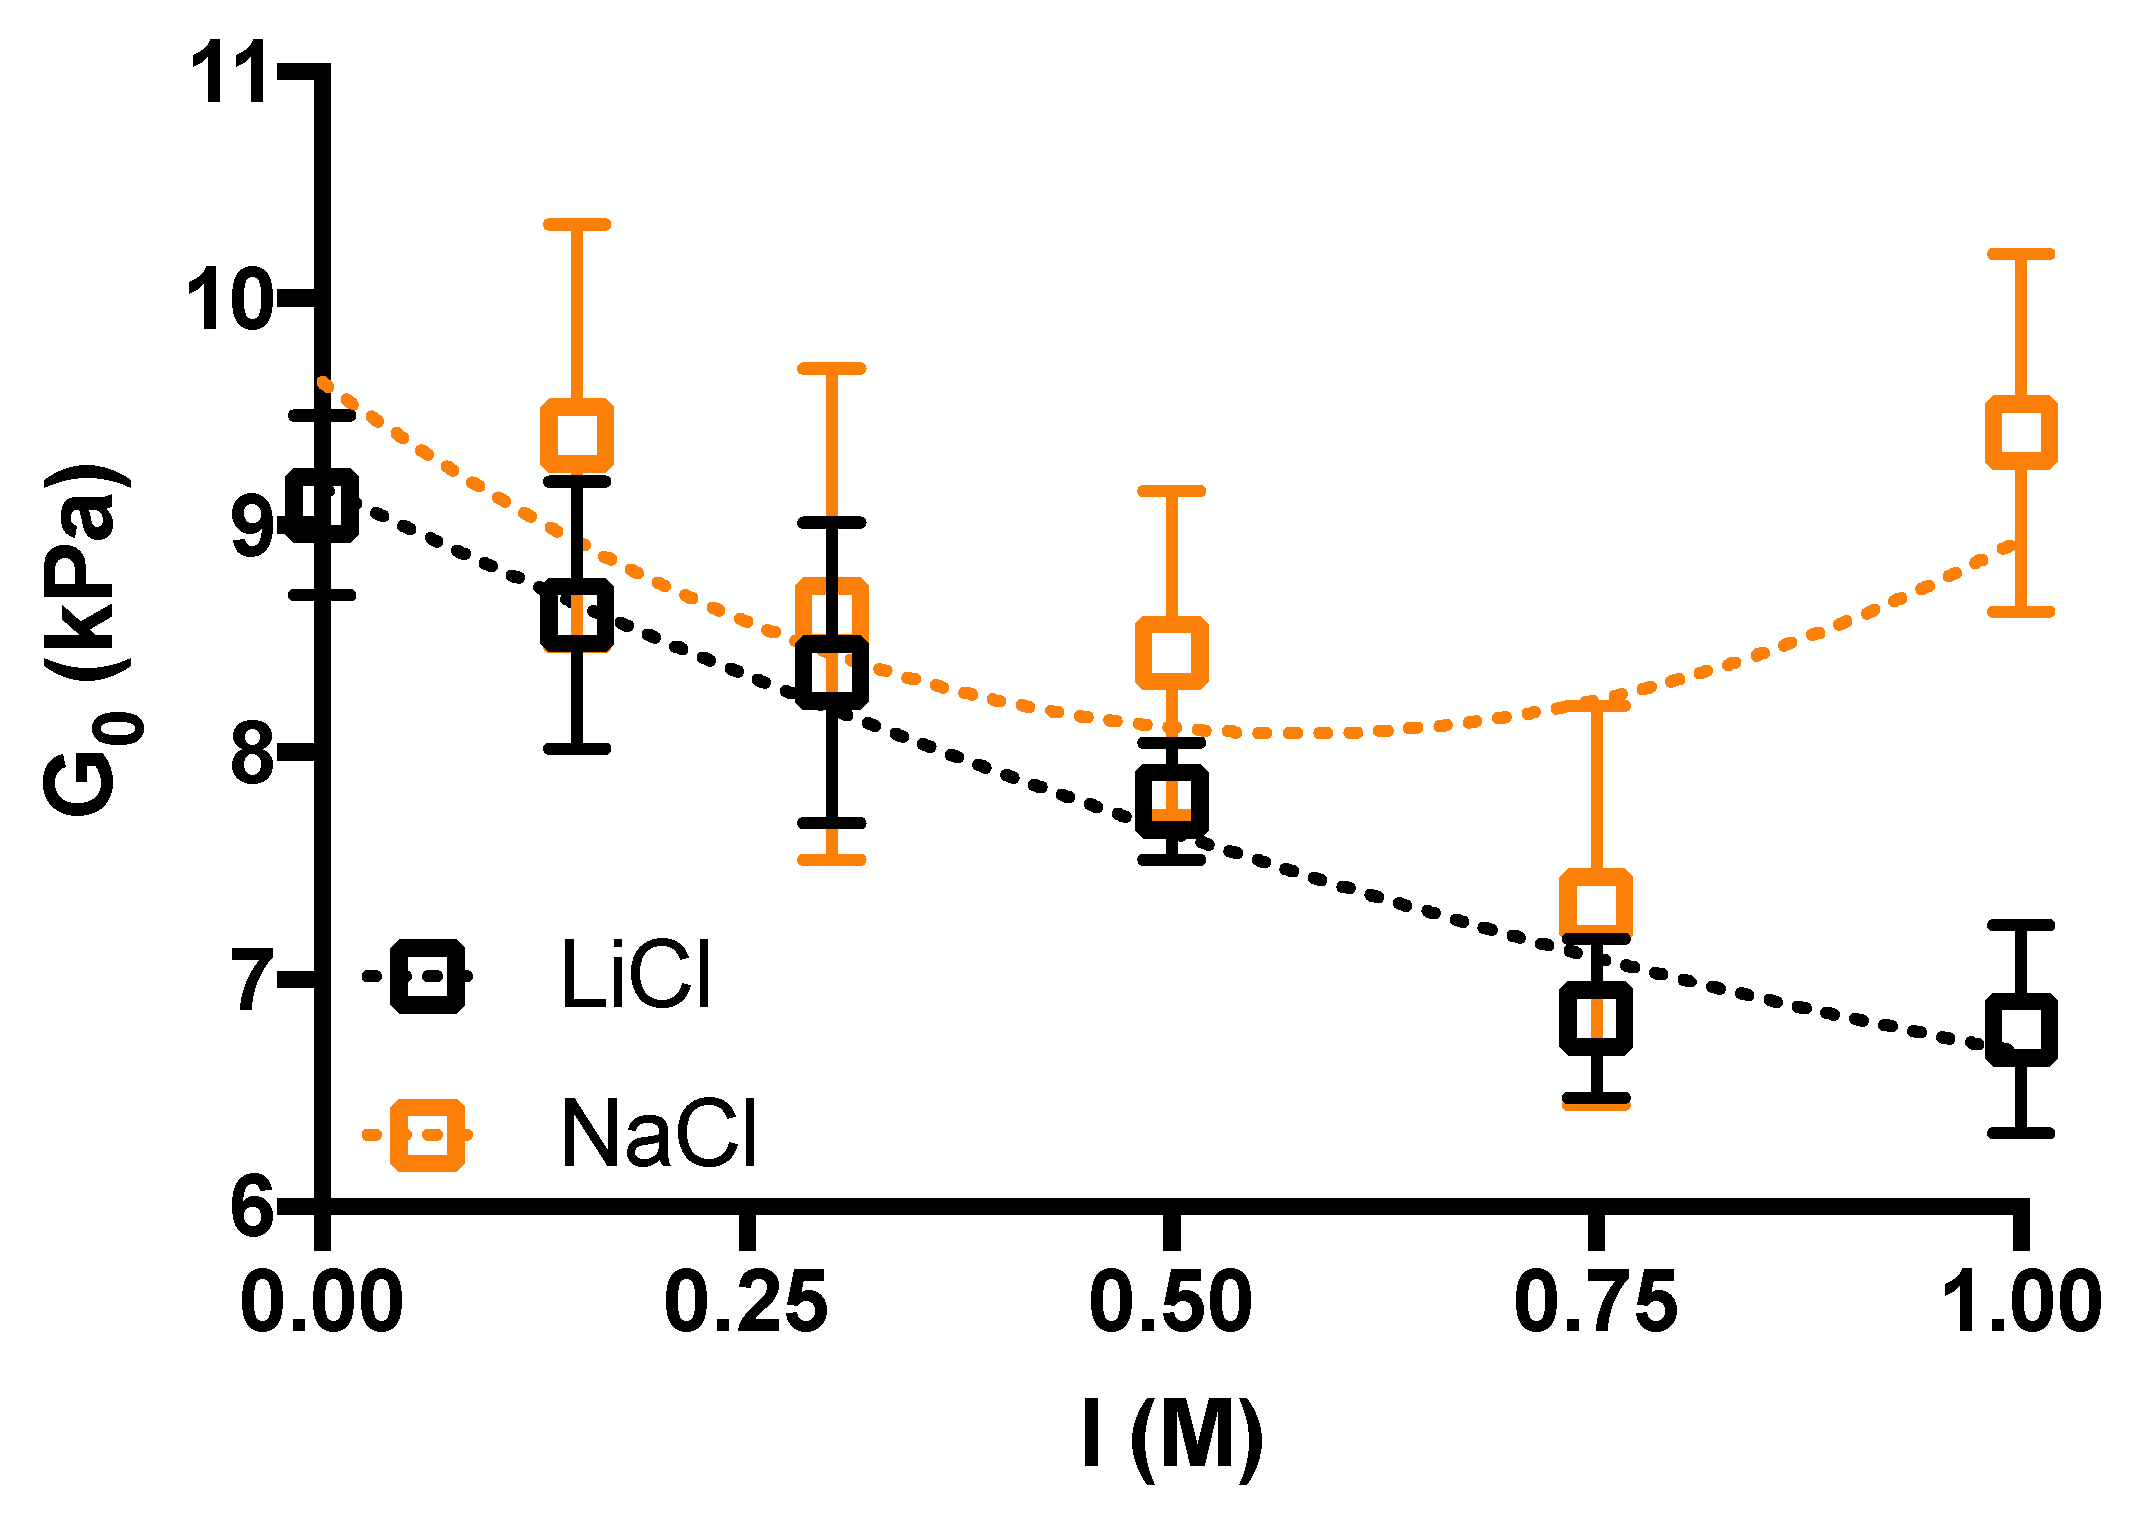
| 0 | 9.1 ± 0.4 | 0.7 ± 0.4 | 9.1 ± 0.4 | 0.7 ± 0.4 |
| 0.15 | 8.6 ± 0.6 | 1.5 ± 0.7 | 9.4 ± 0.9 | 1.3 ± 0.9 |
| 0.30 | 8.4 ± 0.7 | 1.7 ± 0.8 | 8.6 ± 1.1 | 2.3 ± 1.3 |
| 0.50 | 7.8 ± 0.3 | 2.6 ± 0.8 | 8.4 ± 0.7 | 3.2 ± 1.1 |
| 0.75 | 6.8 ± 0.4 | 4.3 ± 0.6 | 7.3 ± 0.9 | 4.9 ± 0.8 |
| 1.00 | 6.8 ± 0.5 | 3.7 ± 1.0 | 9.4 ± 0.8 | 2.6 ± 0.2 |
| I (M) | LiCl | NaCl | ||
|---|---|---|---|---|
| ρx (mol/m3) | (nm) | ρx (mol/m3) | (nm) | |
| 0 | 3.53 | 9.66 | 3.53 | 9.66 |
| 0.15 | 3.34 | 9.84 | 3.65 | 9.56 |
| 0.30 | 3.24 | 9.94 | 3.34 | 9.84 |
| 0.50 | 3.02 | 10.18 | 3.28 | 9.91 |
| 0.75 | 2.65 | 10.63 | 2.84 | 10.38 |
| 1.00 | 2.63 | 10.66 | 3.65 | 9.55 |
Disclaimer/Publisher’s Note: The statements, opinions and data contained in all publications are solely those of the individual author(s) and contributor(s) and not of MDPI and/or the editor(s). MDPI and/or the editor(s) disclaim responsibility for any injury to people or property resulting from any ideas, methods, instructions or products referred to in the content. |
© 2024 by the authors. Licensee MDPI, Basel, Switzerland. This article is an open access article distributed under the terms and conditions of the Creative Commons Attribution (CC BY) license (https://creativecommons.org/licenses/by/4.0/).
Share and Cite
Sacco, P.; Piazza, F.; Marsich, E.; Abrami, M.; Grassi, M.; Donati, I. Ionic Strength Impacts the Physical Properties of Agarose Hydrogels. Gels 2024, 10, 94. https://doi.org/10.3390/gels10020094
Sacco P, Piazza F, Marsich E, Abrami M, Grassi M, Donati I. Ionic Strength Impacts the Physical Properties of Agarose Hydrogels. Gels. 2024; 10(2):94. https://doi.org/10.3390/gels10020094
Chicago/Turabian StyleSacco, Pasquale, Francesco Piazza, Eleonora Marsich, Michela Abrami, Mario Grassi, and Ivan Donati. 2024. "Ionic Strength Impacts the Physical Properties of Agarose Hydrogels" Gels 10, no. 2: 94. https://doi.org/10.3390/gels10020094
APA StyleSacco, P., Piazza, F., Marsich, E., Abrami, M., Grassi, M., & Donati, I. (2024). Ionic Strength Impacts the Physical Properties of Agarose Hydrogels. Gels, 10(2), 94. https://doi.org/10.3390/gels10020094