
Structural Build-Up and Stability of Hybrid Monoglyceride–Triglyceride Oleogels


Abstract

1. Introduction
2. Results and Discussion
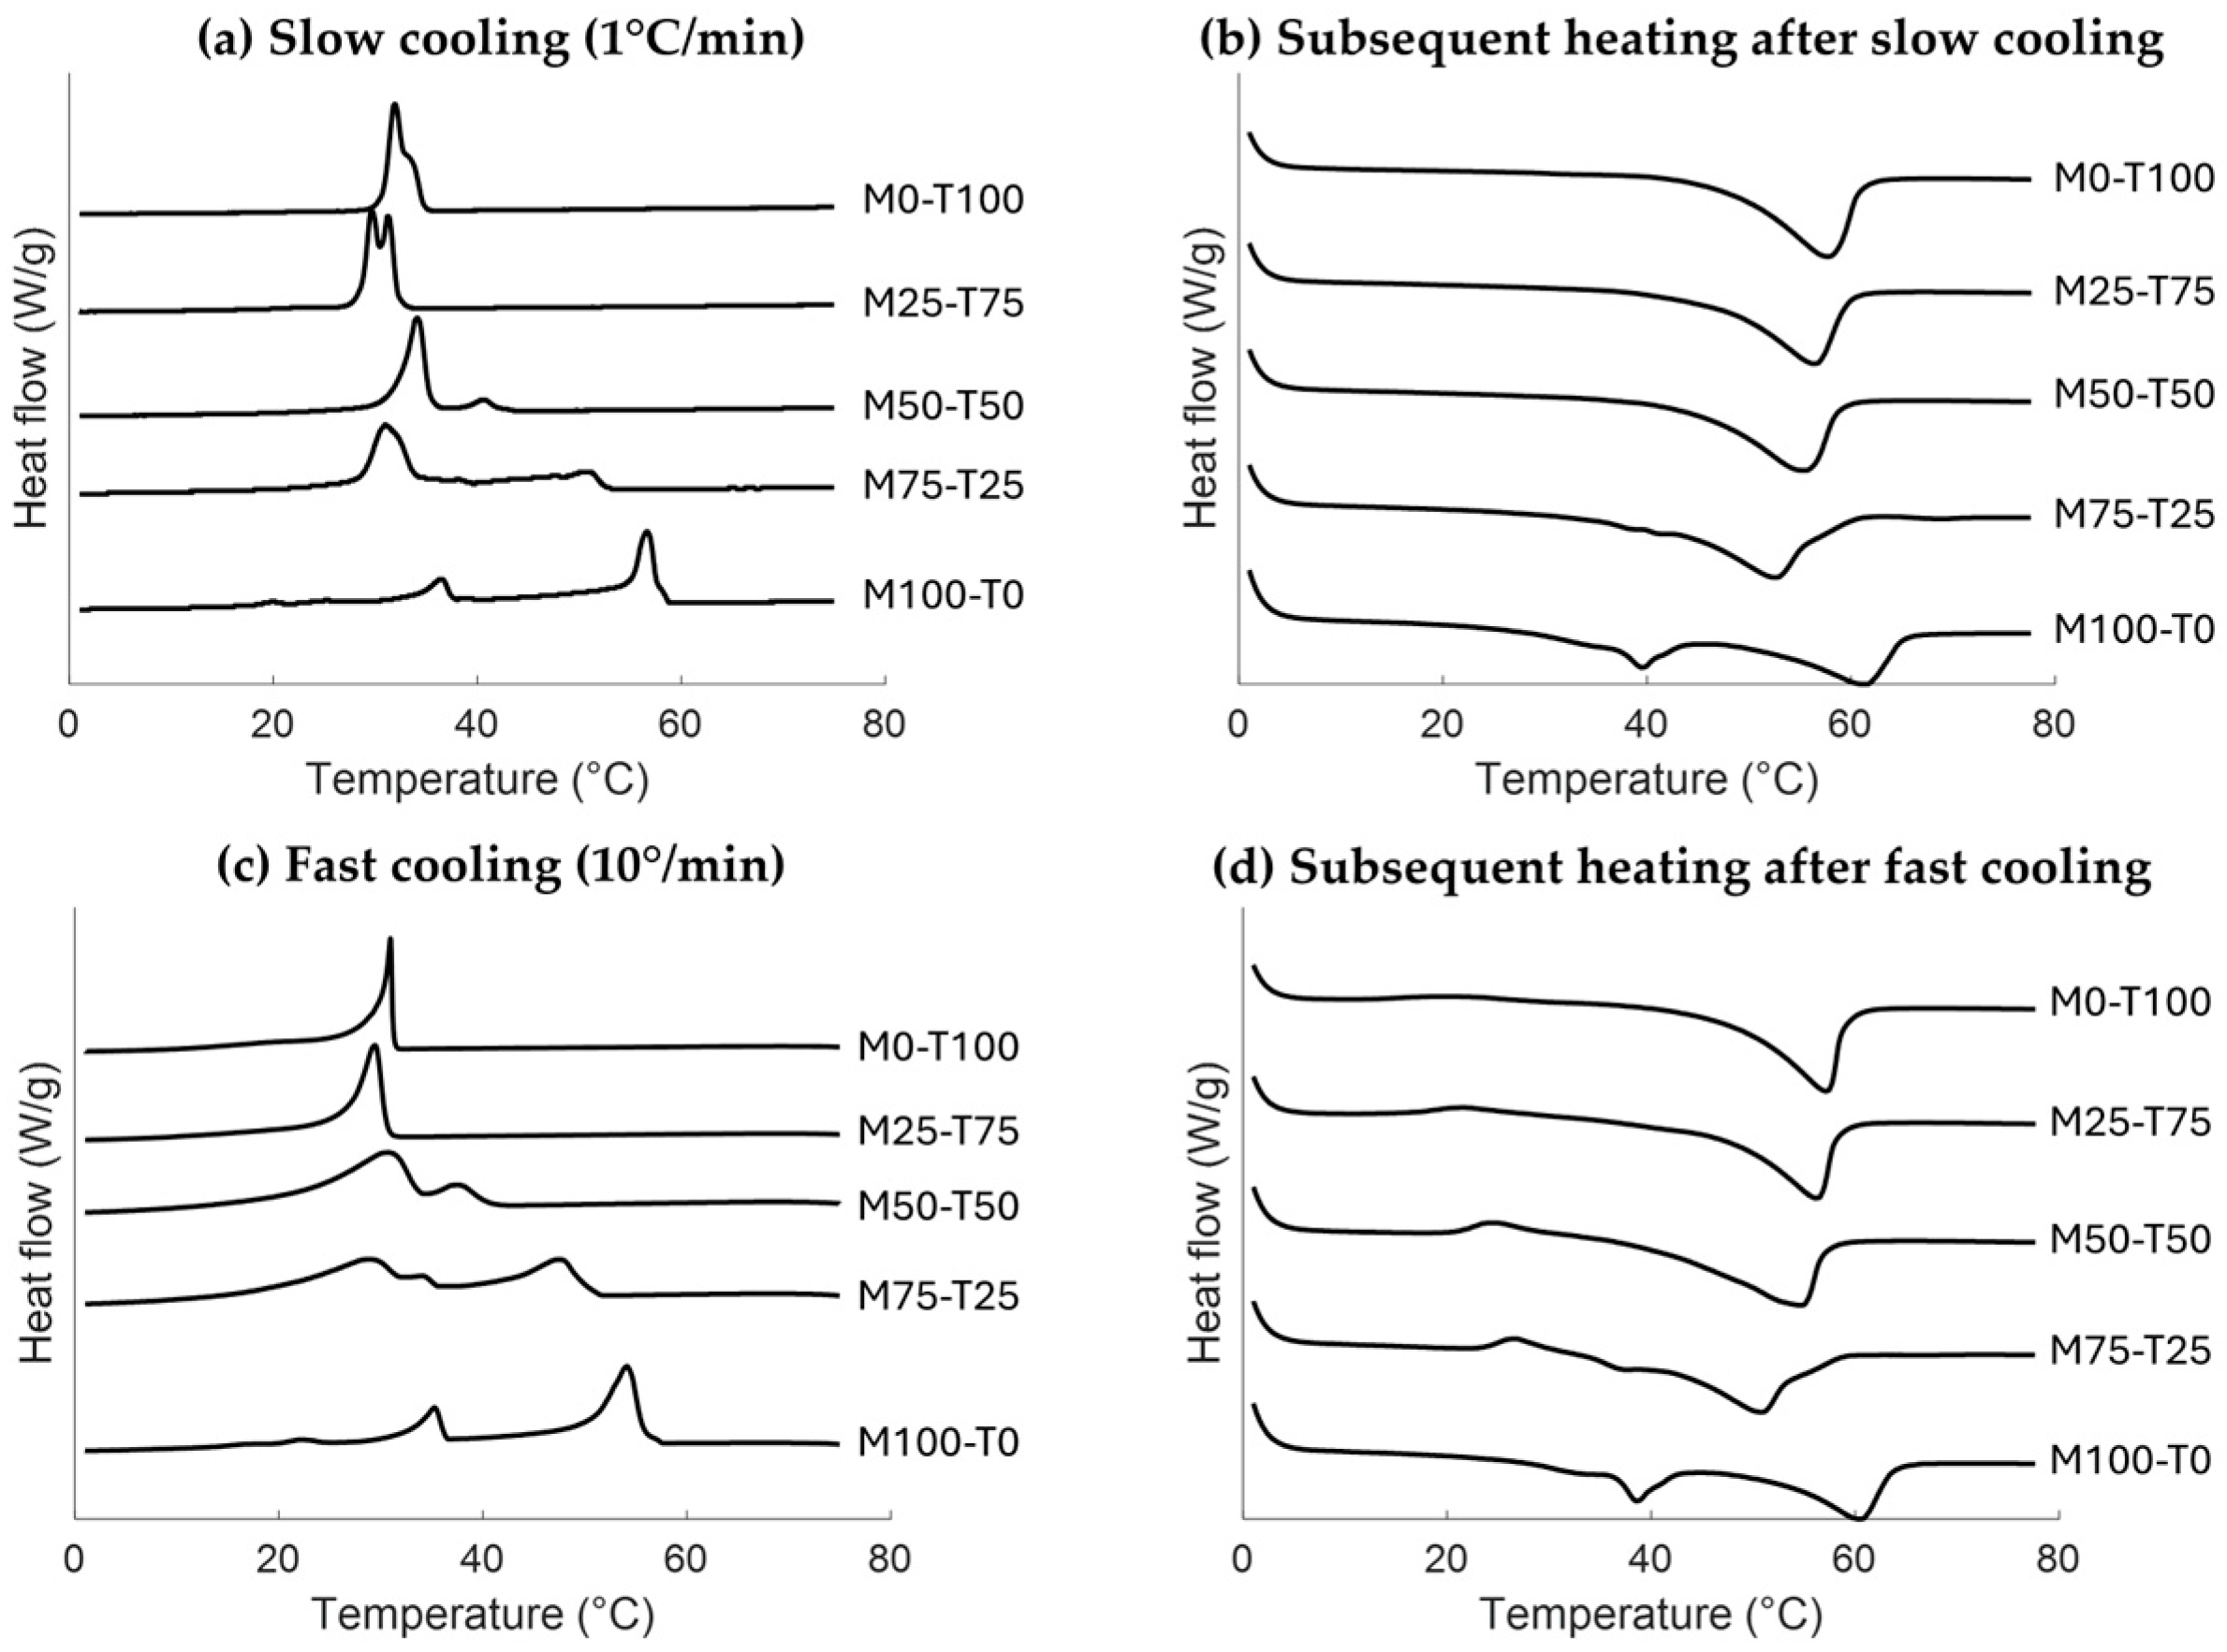
2.1. Crystallization and Melting Behaviors
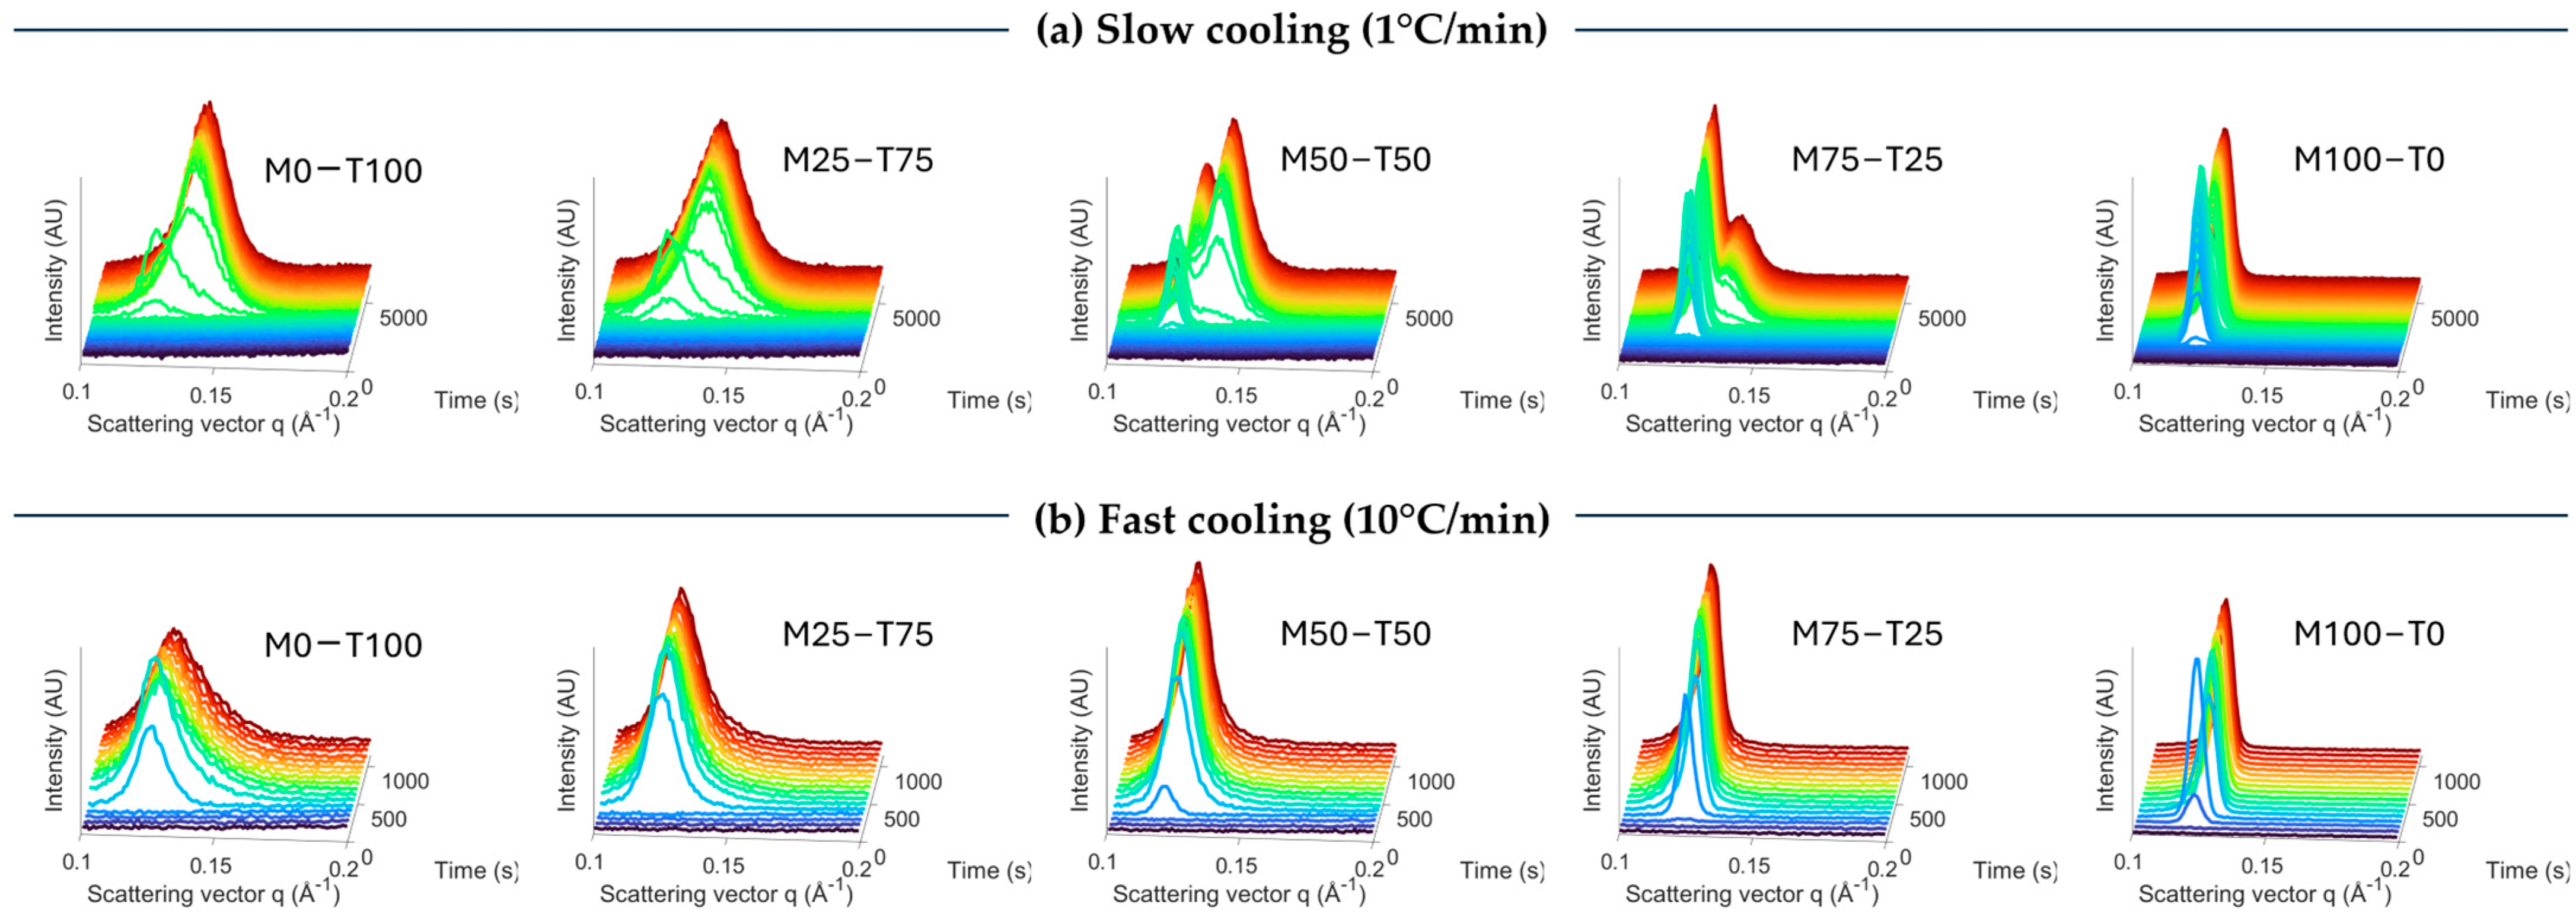
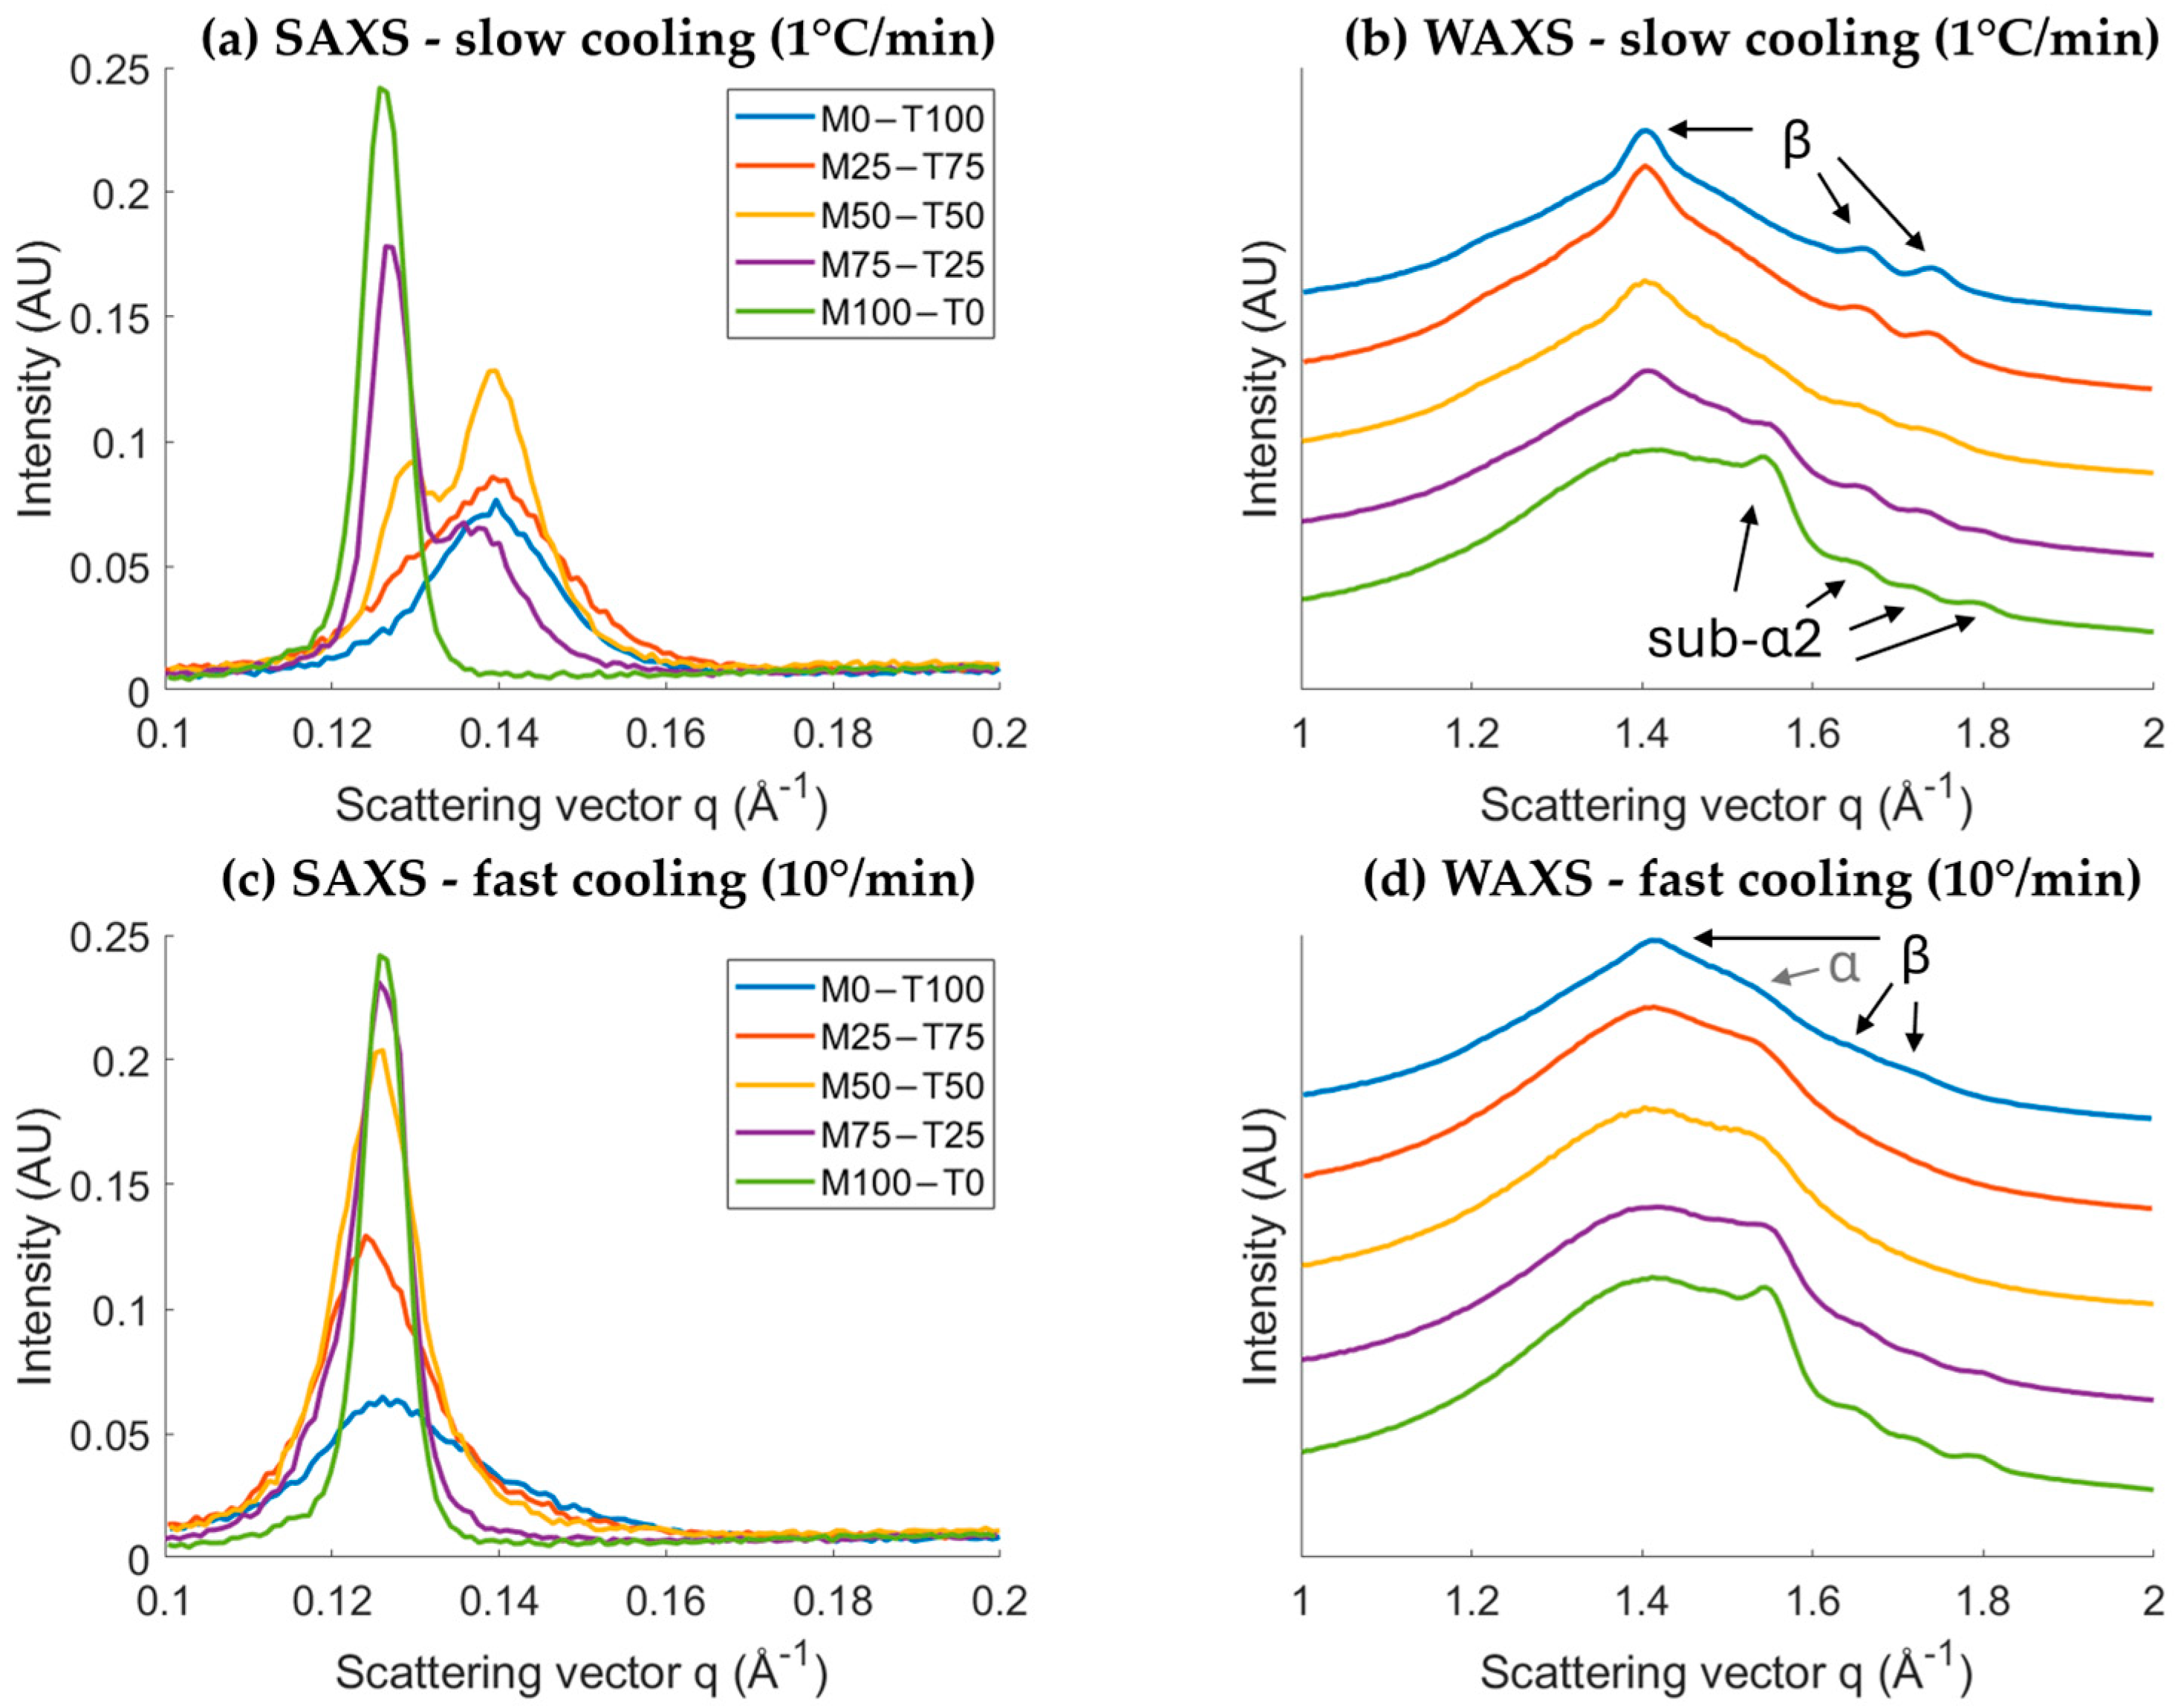
2.1.1. Impact of Cooling Rate
Thermal Properties
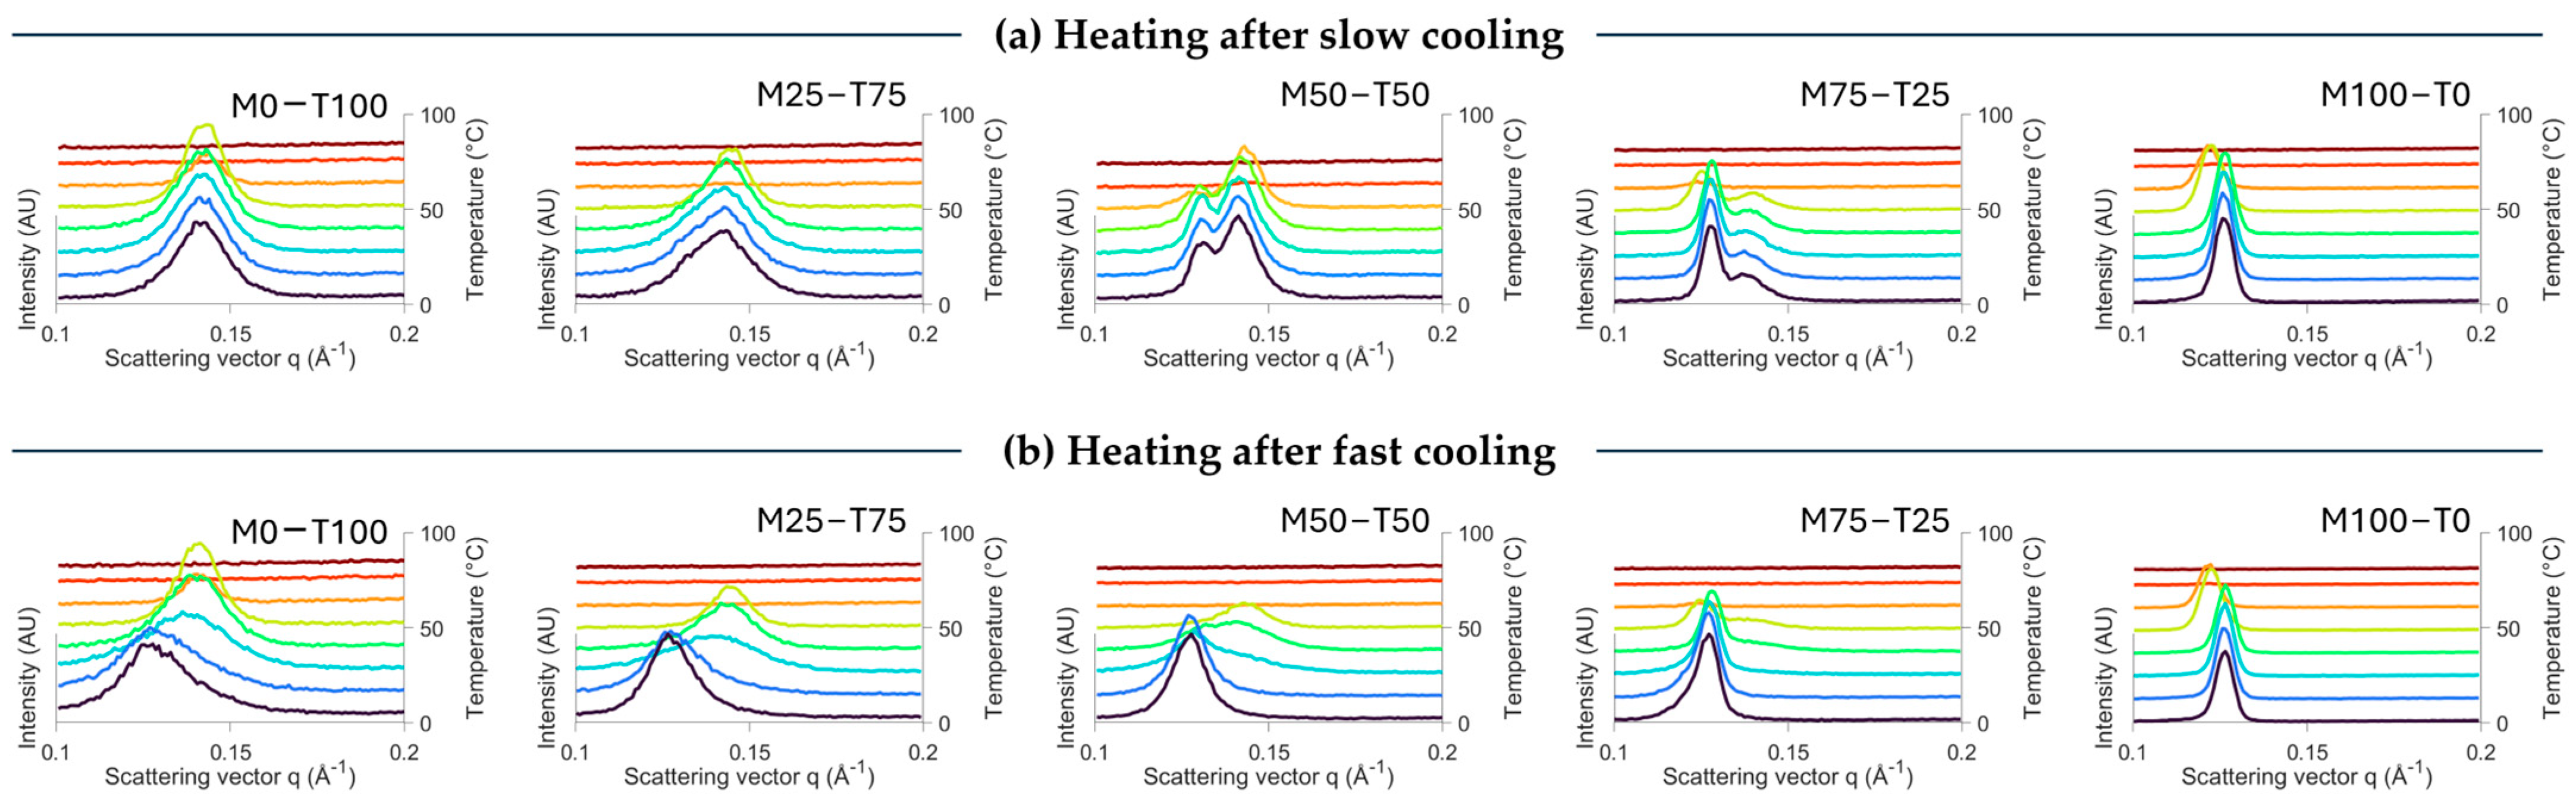
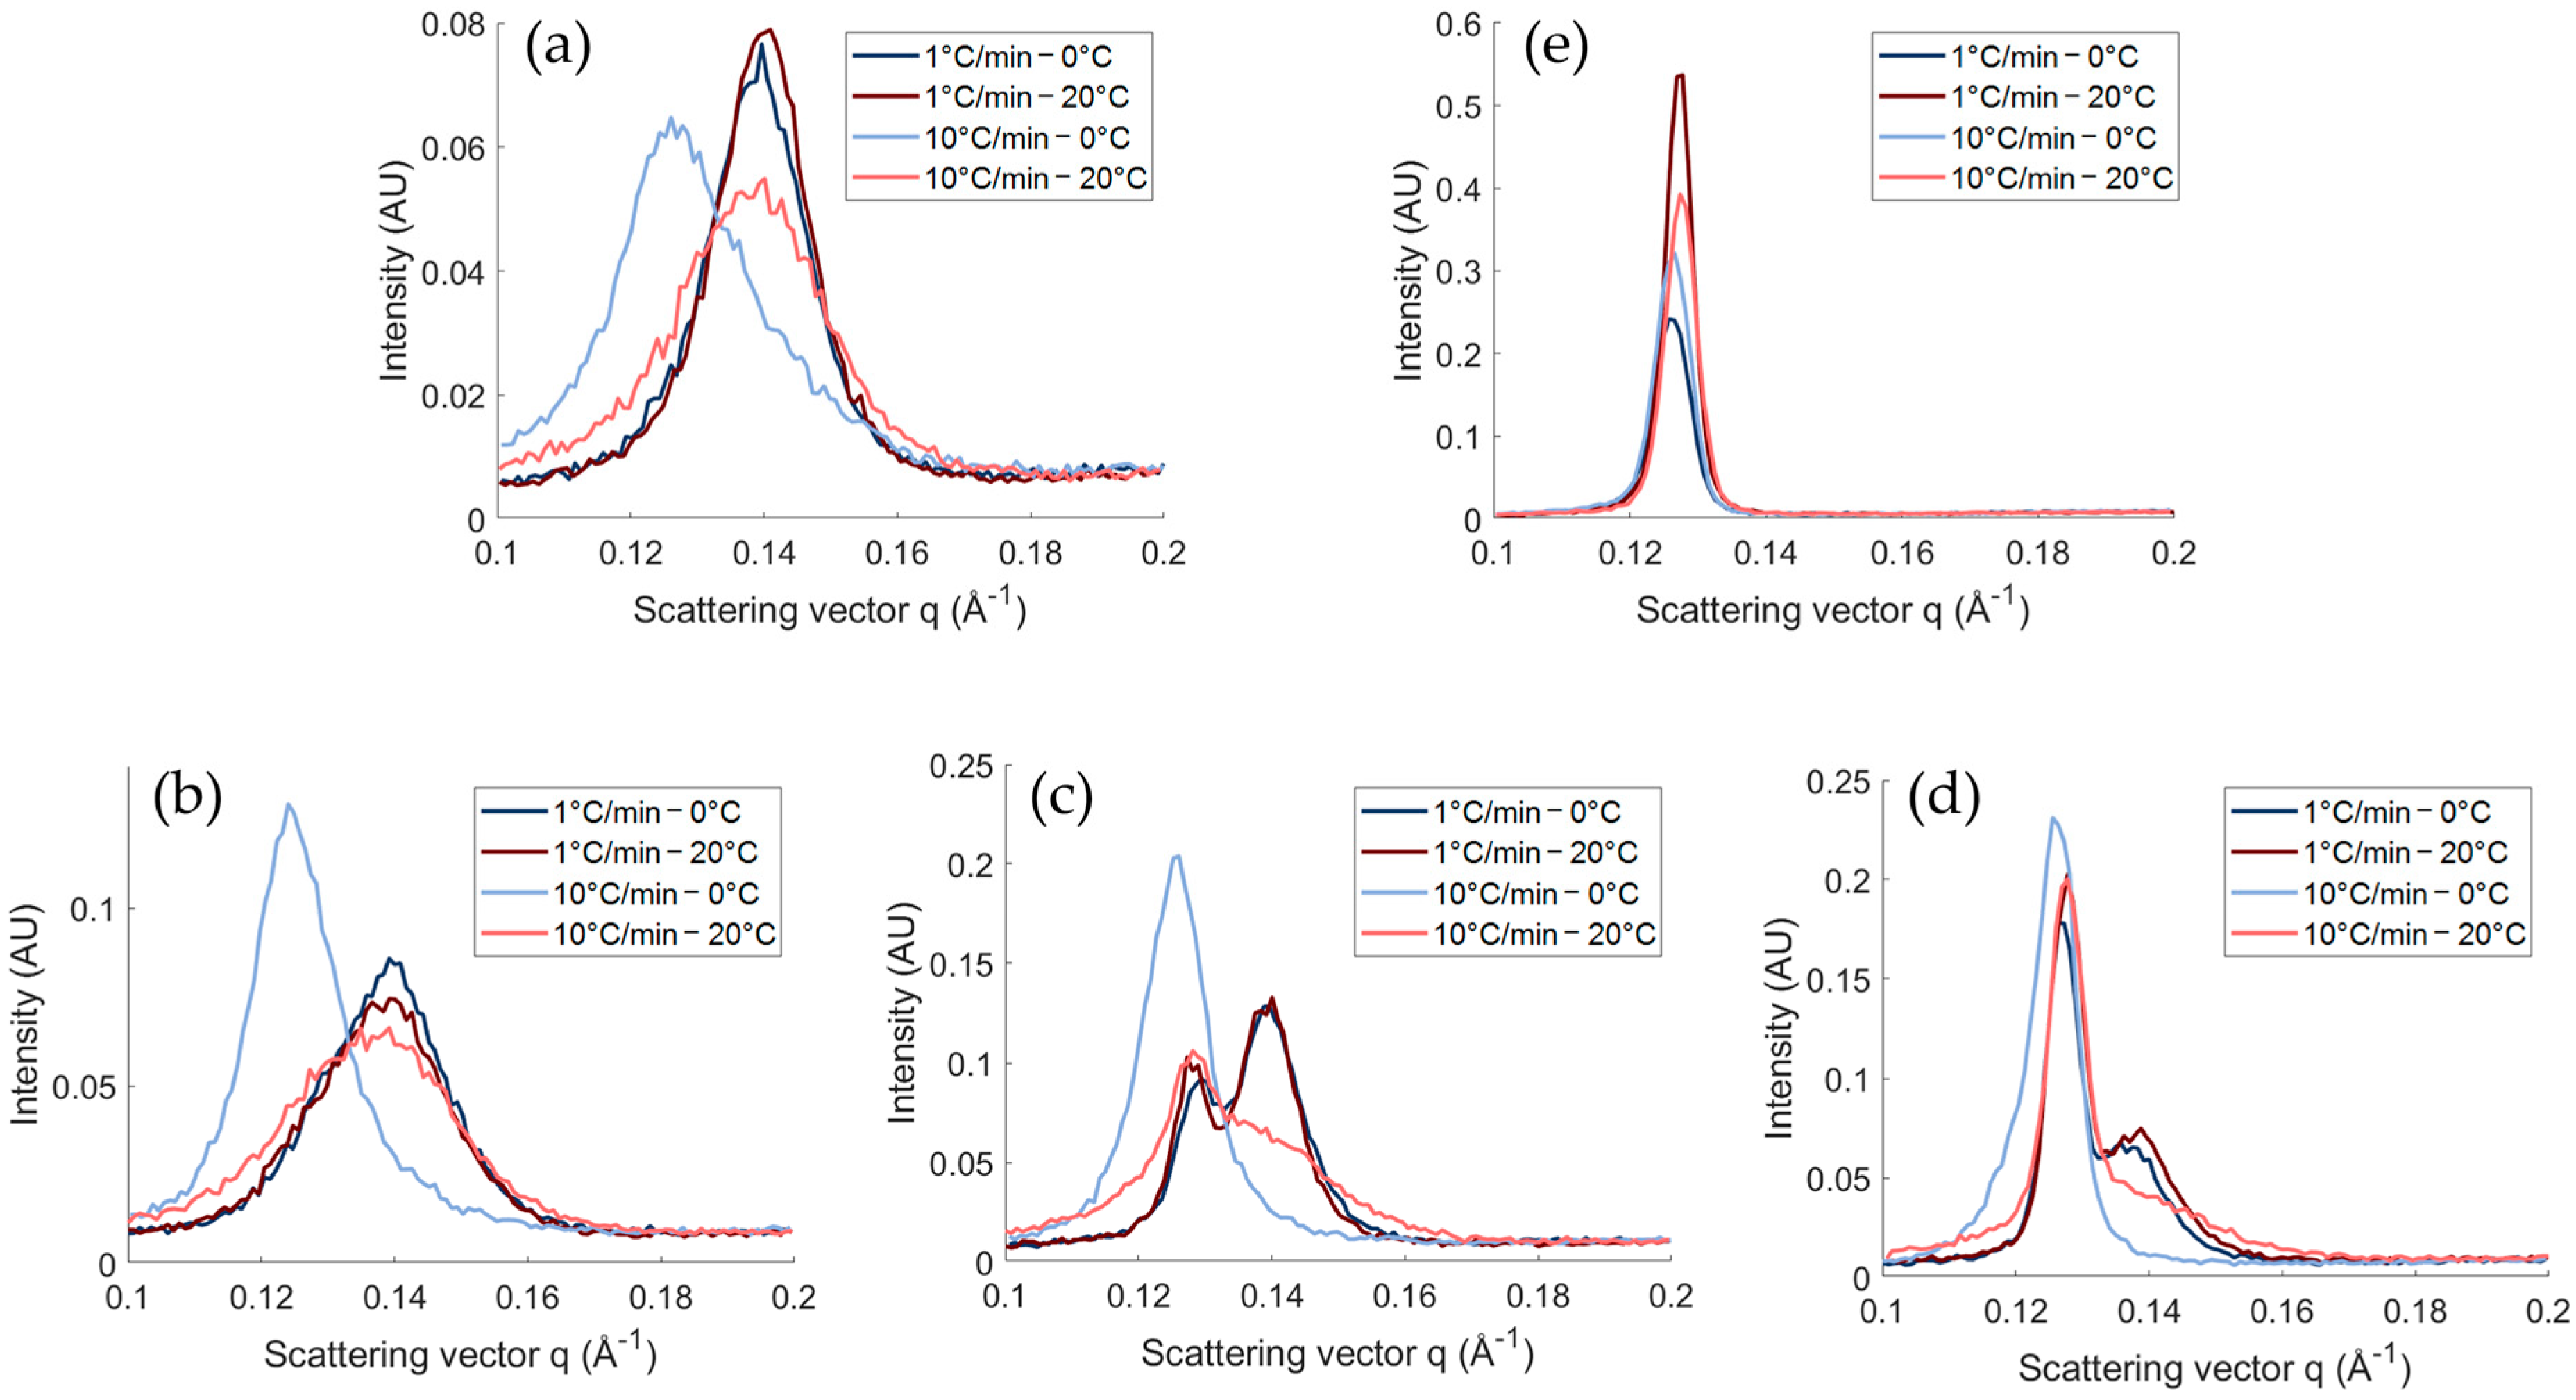
Polymorphism
2.1.2. Impact of the Final Temperature
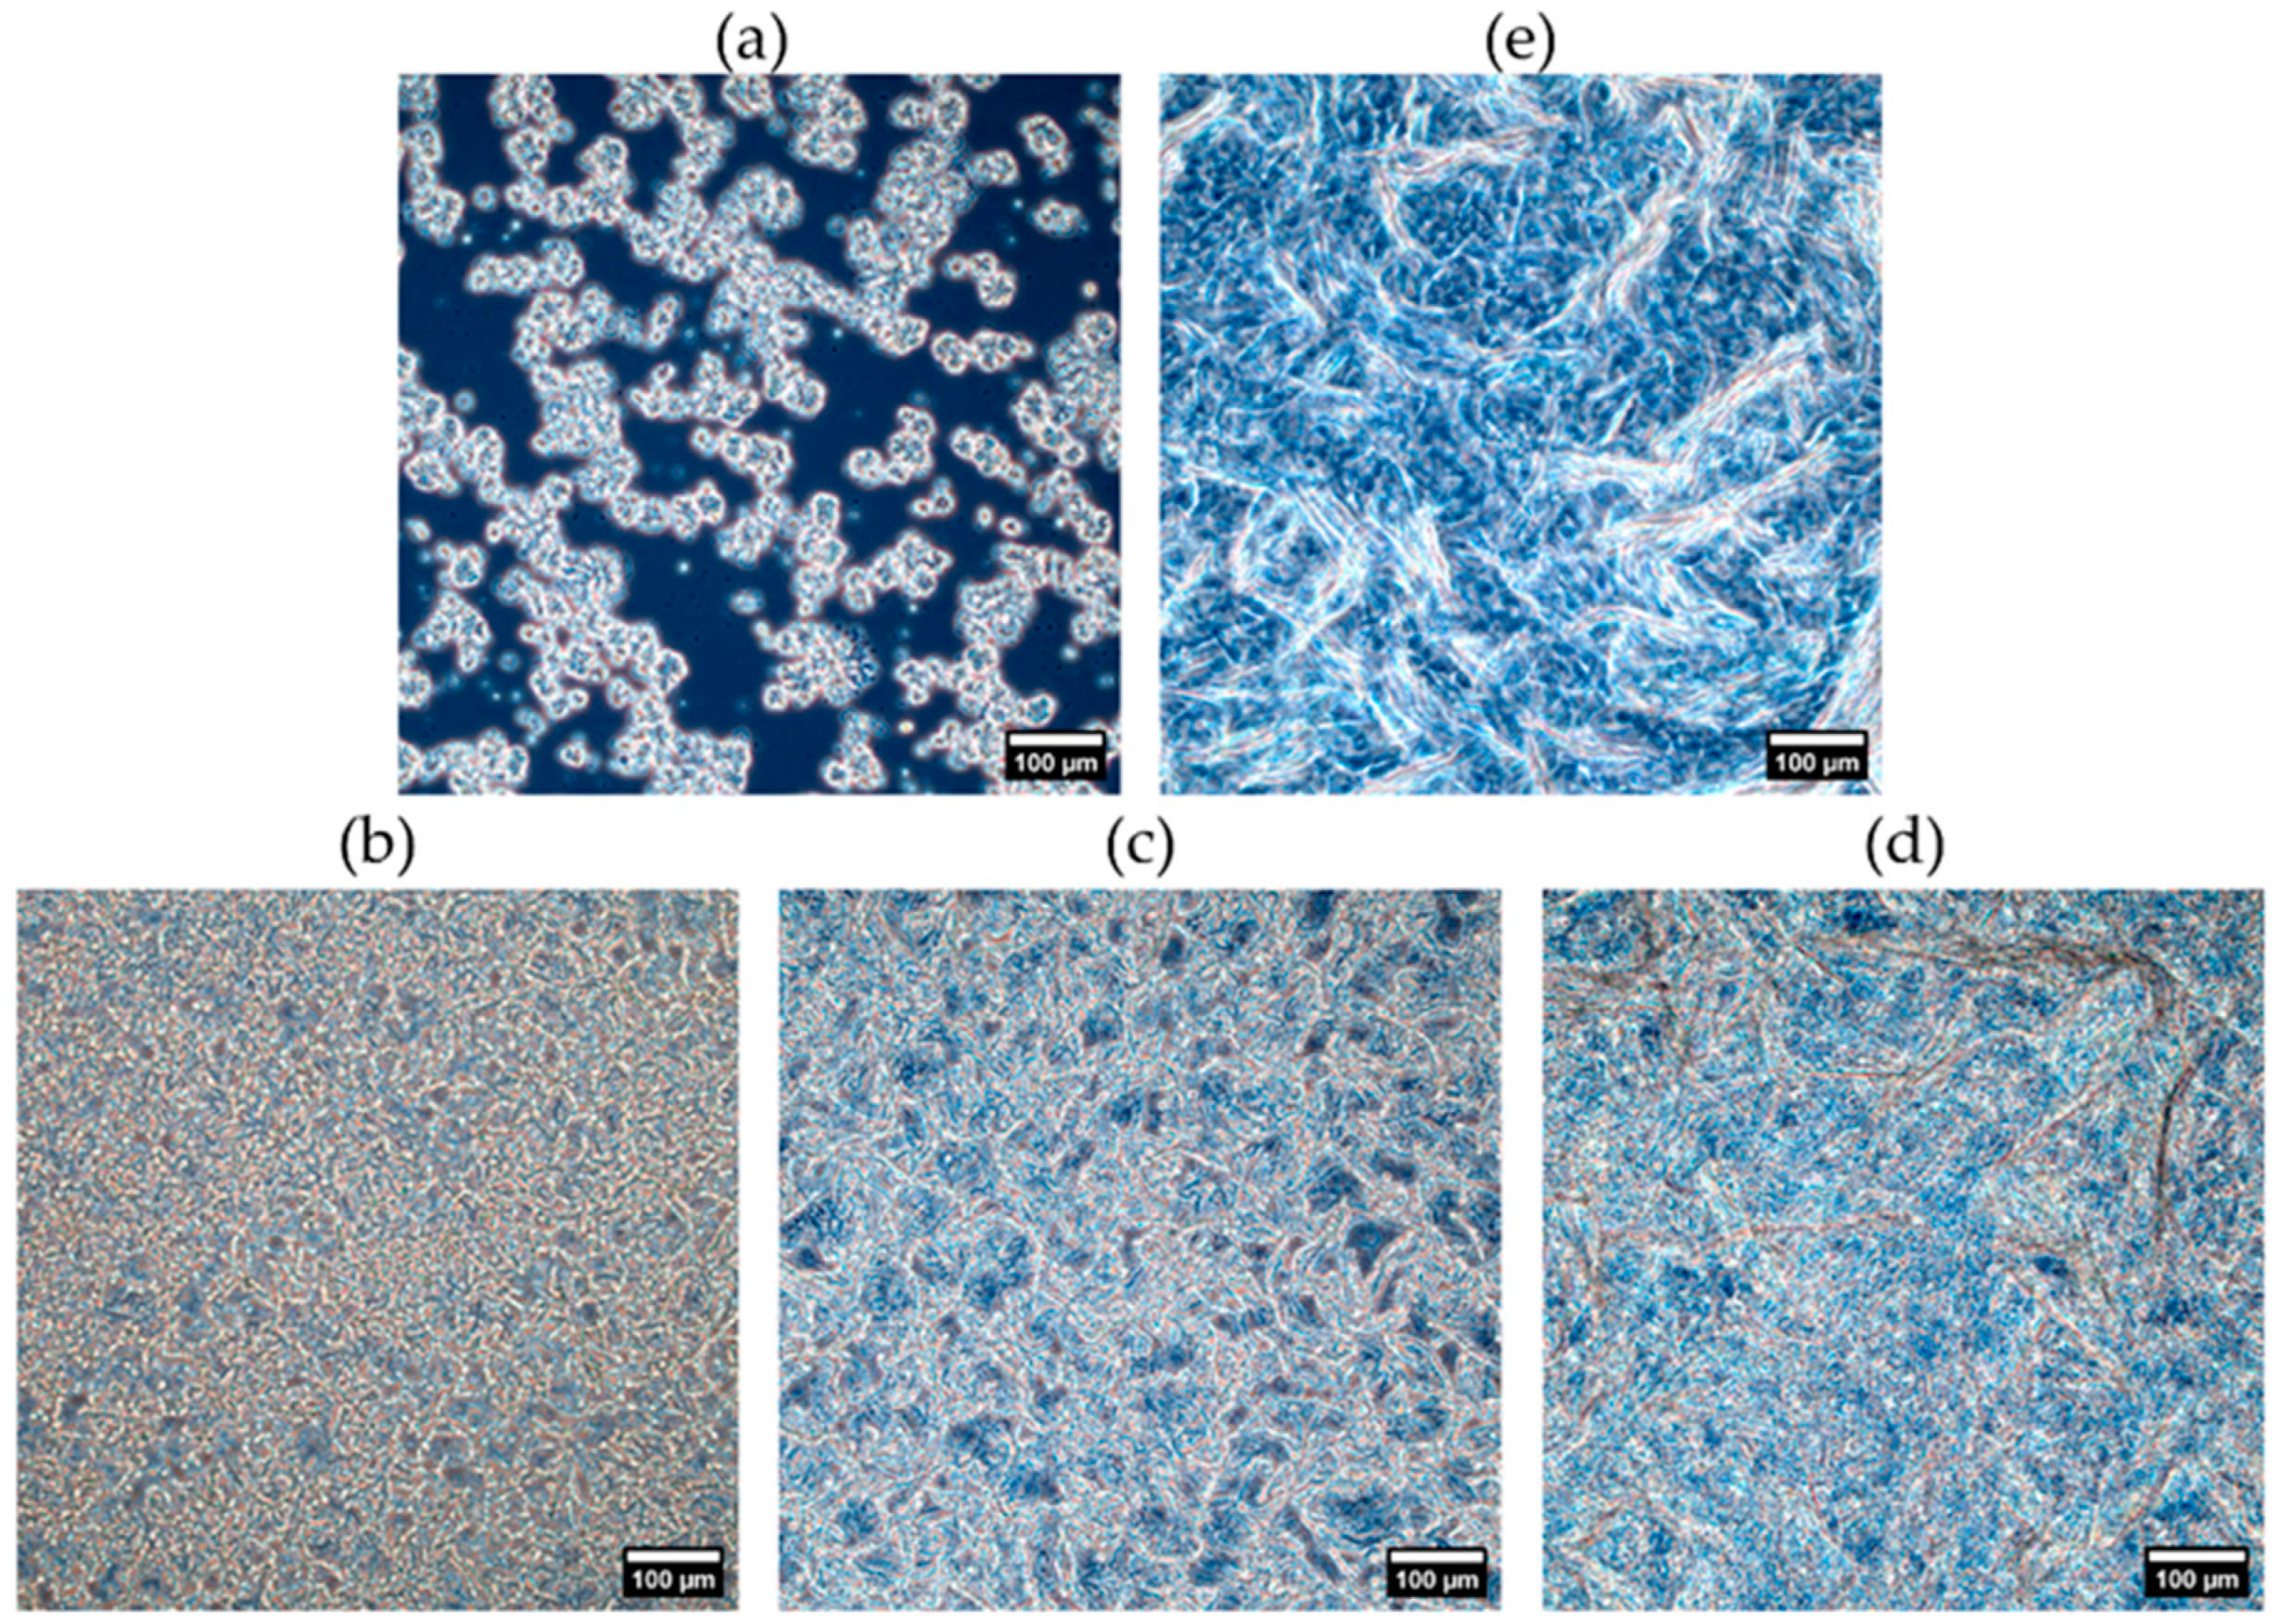
2.1.3. Crystal Morphology
2.2. Stability of Dynamically Produced Oleogels
2.2.1. Melting Behavior
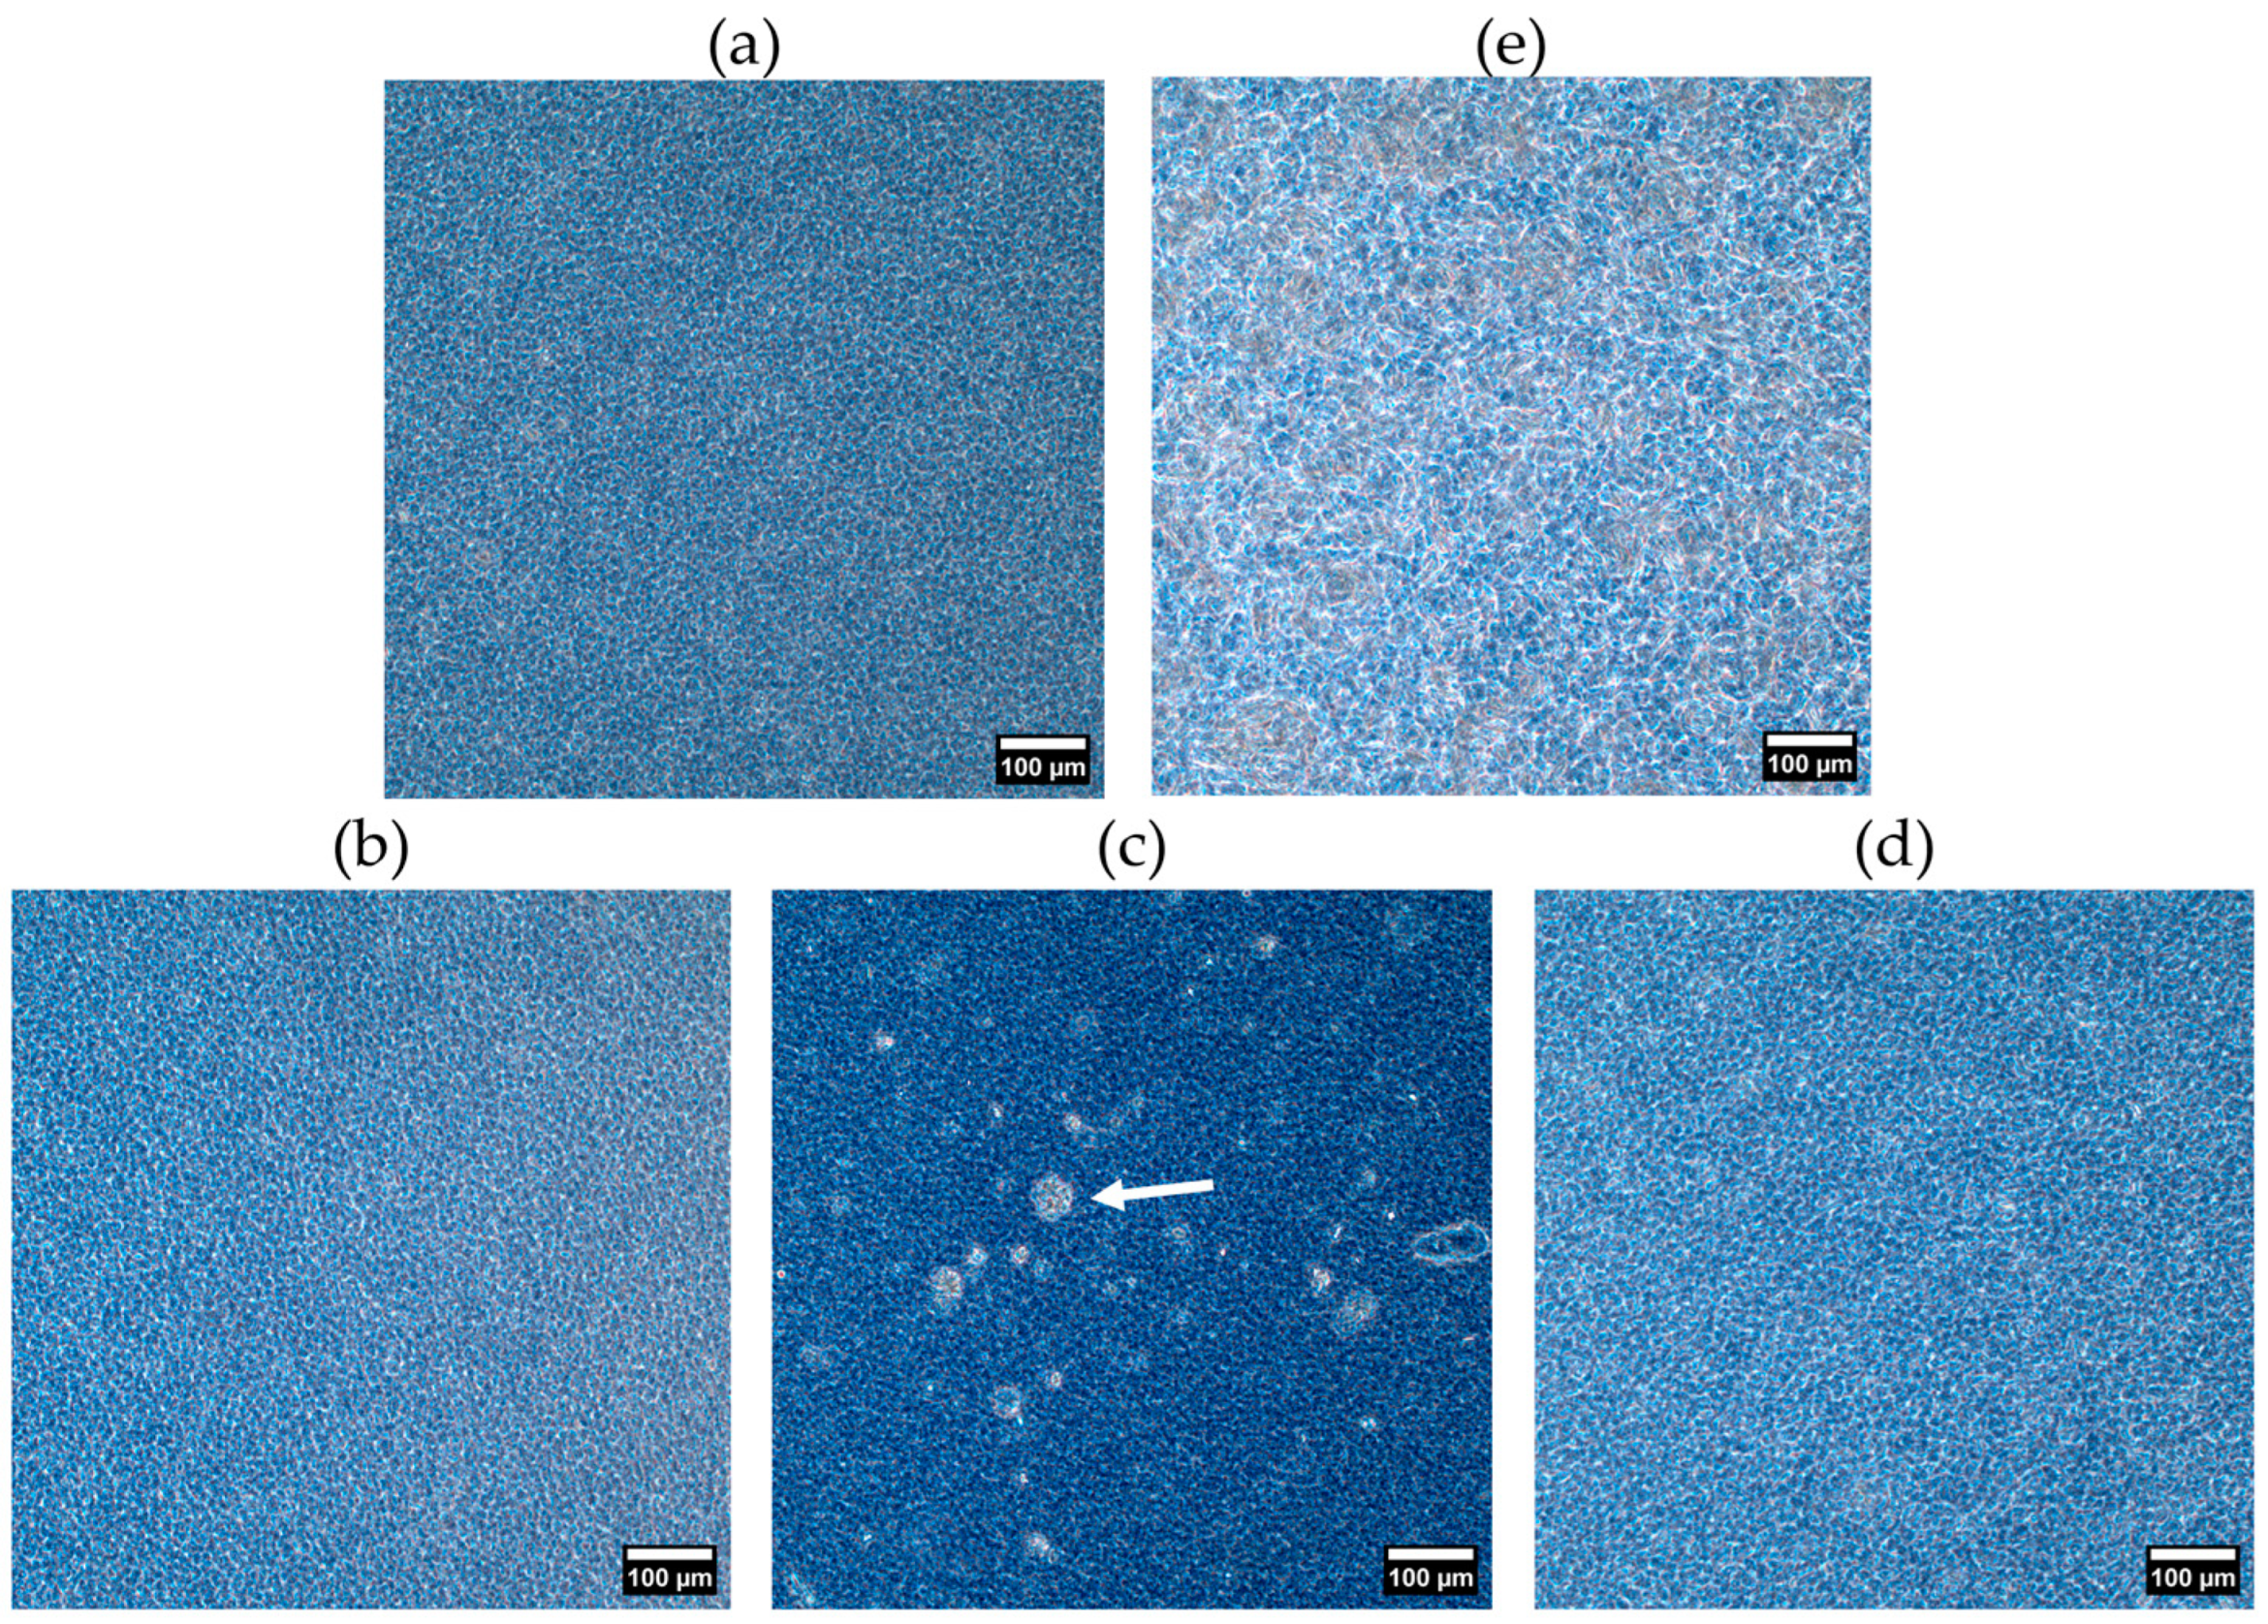
2.2.2. Crystal Morphology
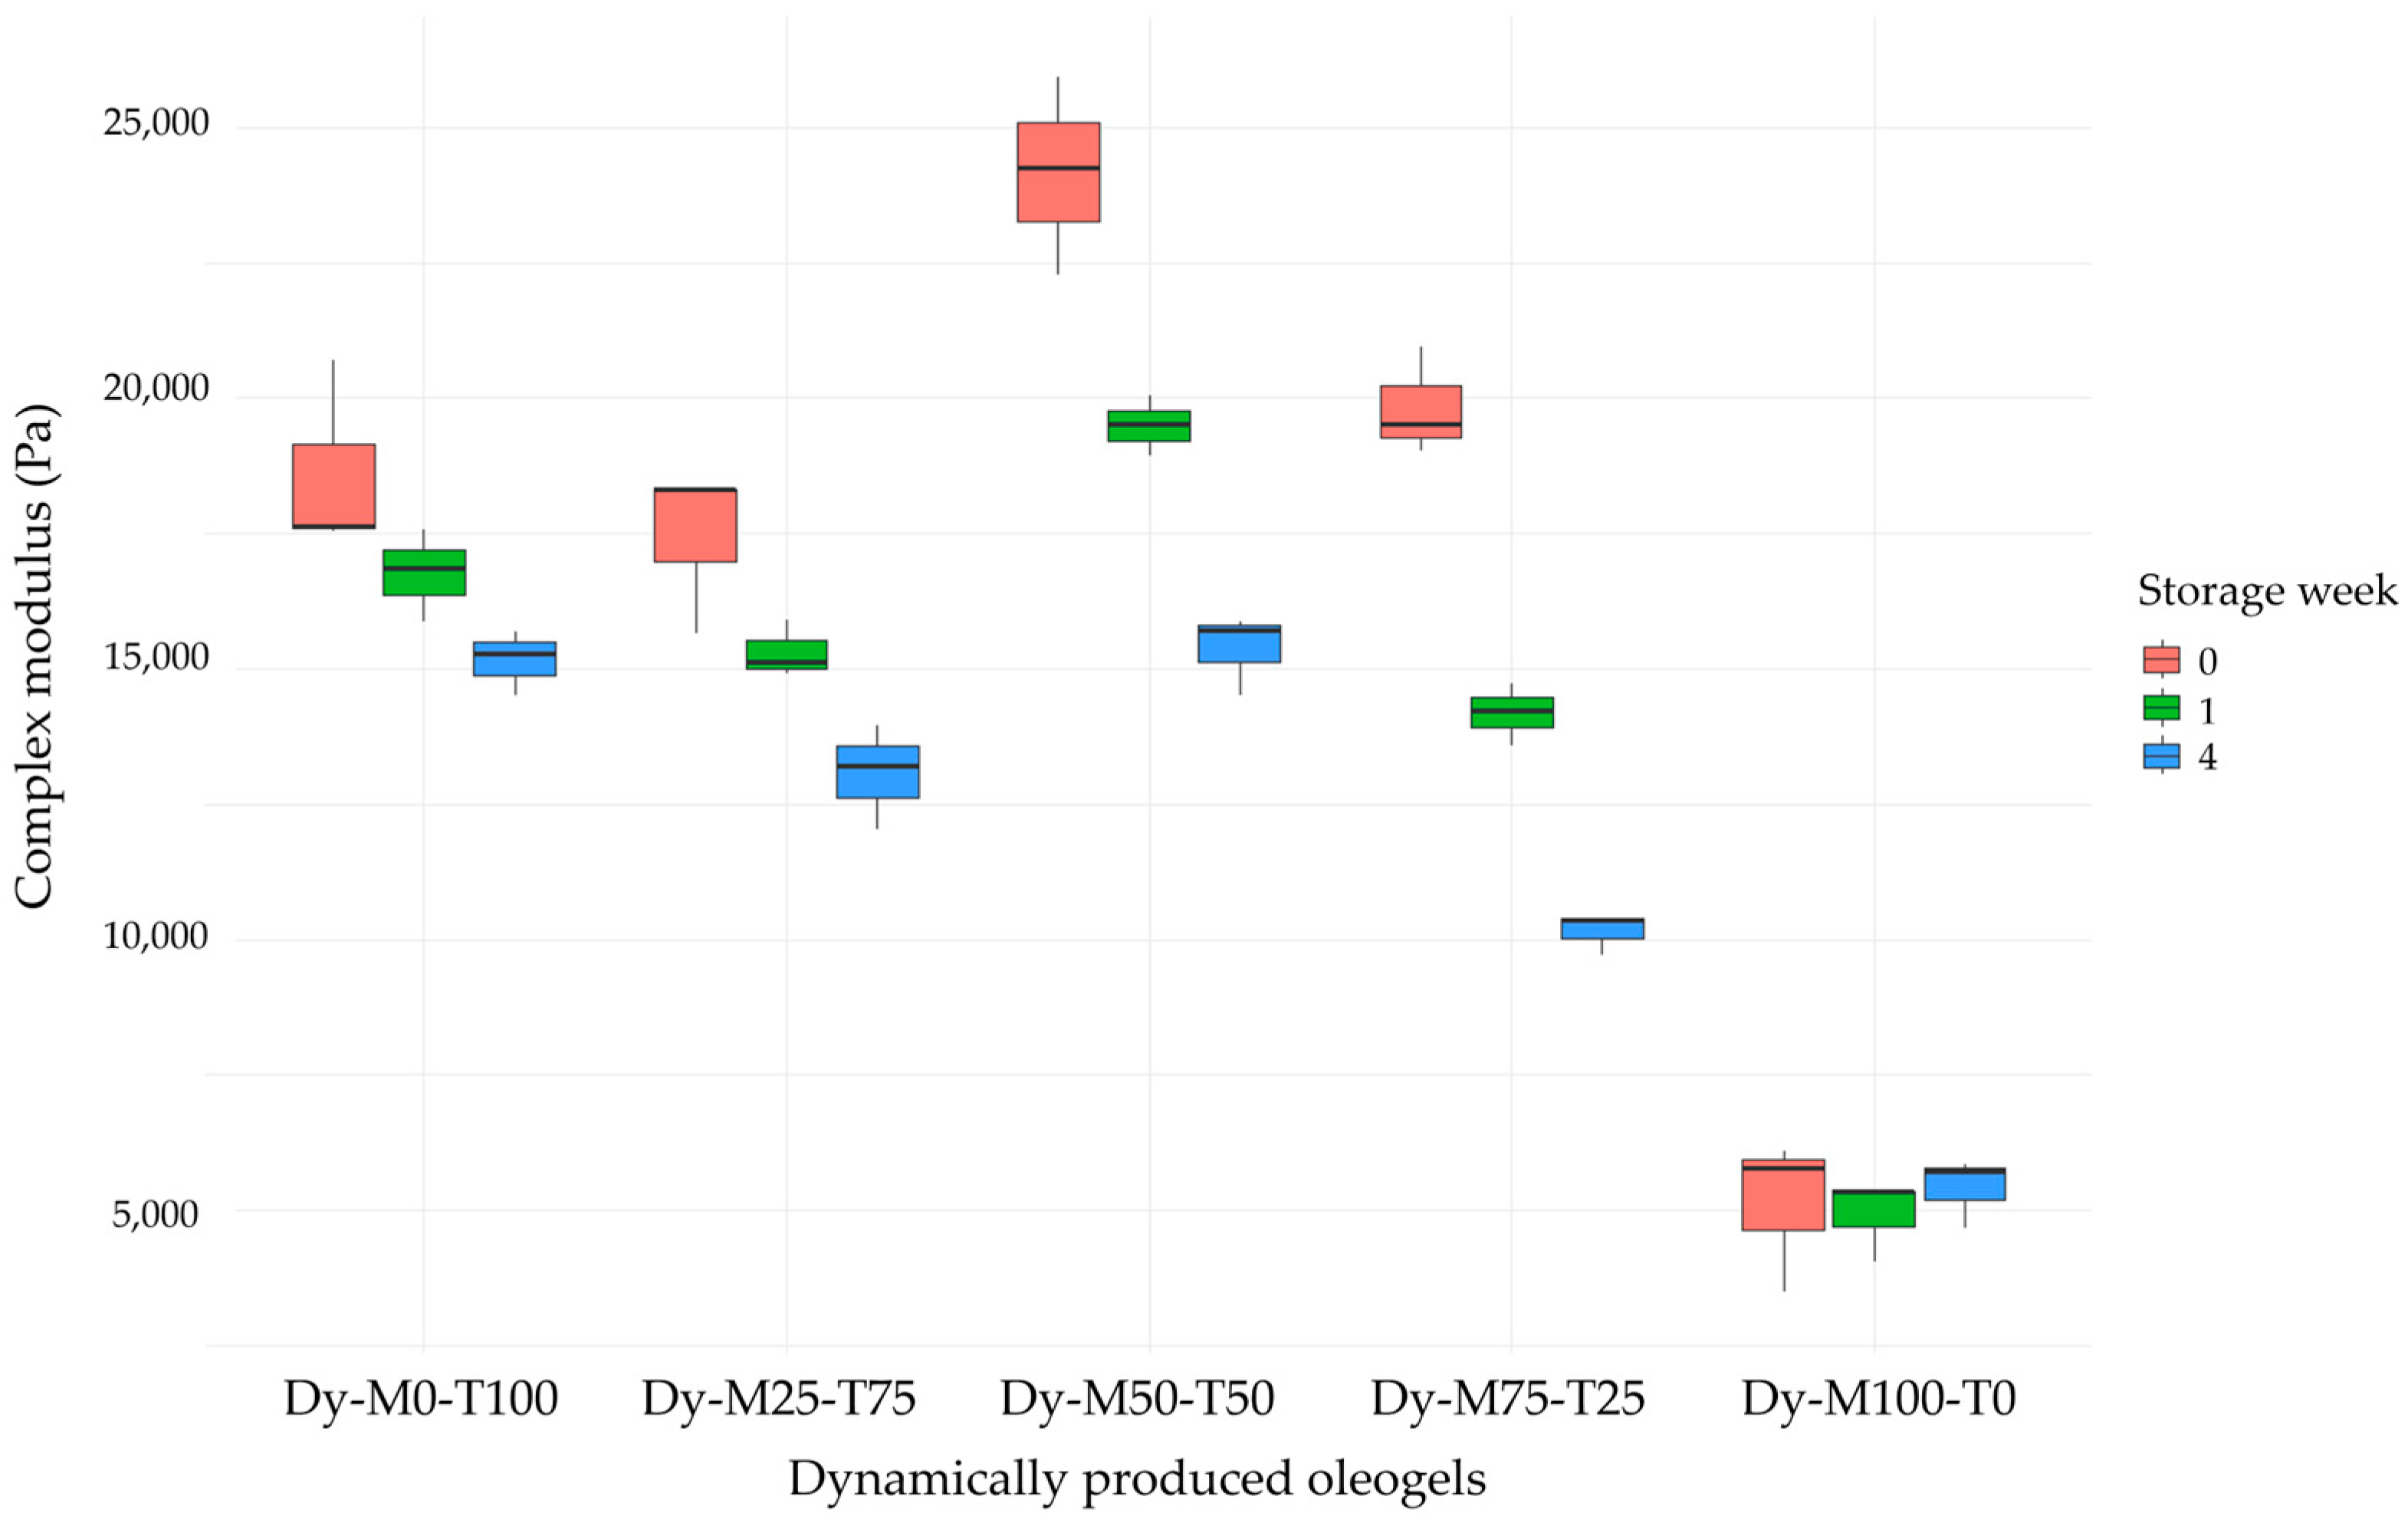
2.2.3. Physicochemical Properties
3. Conclusions
4. Materials and Methods
4.1. Samples
4.2. Oleogel Production
4.3. Analysis of the Statically Produced Oleogels
4.3.1. DSC
4.3.2. X-ray Scattering
4.3.3. Phase Contrast Microscopy
4.4. Follow-Up Study of the Dynamically Produced Oleogels
4.4.1. Phase Contrast Microscopy
4.4.2. Rheology
4.4.3. Oil Binding Capacity
4.5. Statistics
Supplementary Materials
Author Contributions
Funding
Institutional Review Board Statement
Informed Consent Statement
Data Availability Statement
Acknowledgments
Conflicts of Interest
References
- Marangoni, A.G.; van Duynhoven, J.P.M.; Acevedo, N.C.; Nicholson, R.A.; Patel, A.R. Advances in our understanding of the structure and functionality of edible fats and fat mimetics. Soft Matter 2020, 16, 289–306. [Google Scholar] [CrossRef] [PubMed]
- Flöter, E.; Wettlaufer, T.; Conty, V.; Scharfe, M. Oleogels—Their Applicability and Methods of Characterization. Molecules 2021, 26, 1673. [Google Scholar] [CrossRef] [PubMed]
- Maki, K.C.; Dicklin, M.R.; Kirkpatrick, C.F. Saturated fats and cardiovascular health: Current evidence and controversies. J. Clin. Lipidol. 2021, 15, 765–772. [Google Scholar] [CrossRef] [PubMed]
- Li, L.; Liu, G.; Bogojevic, O.; Pedersen, J.N.; Guo, Z. Edible oleogels as solid fat alternatives: Composition and oleogelation mechanism implications. Compr. Rev. Food Sci. Food Saf. 2022, 21, 2077–2104. [Google Scholar] [CrossRef] [PubMed]
- Palla, C.A.; Dominguez, M.; Carrín, M.E. An overview of structure engineering to tailor the functionality of monoglyceride oleogels. Compr. Rev. Food Sci. Food Saf. 2022, 21, 2587–2614. [Google Scholar] [CrossRef]
- Hwang, H.-S. A critical review on structures, health effects, oxidative stability, and sensory properties of oleogels. Biocatal. Agric. Biotechnol. 2020, 26, 101657. [Google Scholar] [CrossRef]
- Barroso, N.G.; Okuro, P.K.; Ribeiro, A.P.B.; Cunha, R.L. Tailoring Properties of Mixed-Component Oleogels: Wax and Monoglyceride Interactions Towards Flaxseed Oil Structuring. Gels 2020, 6, 5. [Google Scholar] [CrossRef]
- Choi, K.O.; Hwang, H.S.; Jeong, S.; Kim, S.; Lee, S. The thermal, rheological, and structural characterization of grapeseed oil oleogels structured with binary blends of oleogelator. J. Food Sci. 2020, 85, 3432–3441. [Google Scholar] [CrossRef] [PubMed]
- Chen, C.; Zhang, C.; Zhang, Q.Y.; Ju, X.R.; Wang, Z.G.; He, R. Study of monoglycerides enriched with unsaturated fatty acids at sn-2 position as oleogelators for oleogel preparation. Food Chem. 2021, 354, 8. [Google Scholar] [CrossRef]
- Bin Sintang, M.D.; Rimaux, T.; Van de Walle, D.; Dewettinck, K.; Patel, A.R. Oil structuring properties of monoglycerides and phytosterols mixtures. European J. Lipid Sci. Technol. 2017, 119, 1500517. [Google Scholar] [CrossRef]
- Bin Sintang, M.D.; Danthine, S.; Brown, A.; Van de Walle, D.; Patel, A.R.; Tavernier, I.; Rimaux, T.; Dewettinck, K. Phytosterols-induced viscoelasticity of oleogels prepared by using monoglycerides. Food Res. Int. 2017, 100, 832–840. [Google Scholar] [CrossRef]
- Rodríguez-Hernández, A.K.; Pérez-Martínez, J.D.; Gallegos-Infante, J.A.; Toro-Vazquez, J.F.; Ornelas-Paz, J.J. Rheological properties of ethyl cellulose-monoglyceride-candelilla wax oleogel vis-a-vis edible shortenings. Carbohydr. Polym. 2021, 252, 117171. [Google Scholar] [CrossRef]
- Alfutimie, A.; Al-Janabi, N.; Curtis, R.; Tiddy, G.J.T. The Effect of monoglycerides on the crystallisation of triglyceride. Colloids Surf. A Physicochem. Eng. Asp. 2016, 494, 170–179. [Google Scholar] [CrossRef]
- Wright, A.J.; Hartel, R.W.; Narine, S.S.; Marangoni, A.G. The effect of minor components on milk fat crystallization. J. Am. Oil Chem. Soc. 2000, 77, 463–475. [Google Scholar] [CrossRef]
- Basso, R.C.; Ribeiro, A.P.B.; Masuchi, M.H.; Gioielli, L.A.; Gonçalves, L.A.G.; dos Santos, A.O.; Cardoso, L.P.; Grimaldi, R. Tripalmitin and monoacylglycerols as modifiers in the crystallisation of palm oil. Food Chem. 2010, 122, 1185–1192. [Google Scholar] [CrossRef]
- Rondou, K.; Dewettinck, A.; Dewettinck, K.; Van der Meeren, P.; Van Bockstaele, F. Hybrid monoglyceride-triglyceride oleogels: Insights into the crystallization behavior. In Proceedings of the 2nd Berlin Symposium on Structured Lipid Phases, Berlin, Germany, 30 September–2 October 2024. [Google Scholar]
- Seilert, J.; Rappolt, M.; Dol, G.; Flöter, E. Interplay of Polymorphic Transition and Mixed Crystal Formation in Model Fat Systems. Cryst. Growth Des. 2024, 24, 1146–1158. [Google Scholar] [CrossRef]
- Rondou, K.; De Witte, F.; Penagos, I.A.; Chen, O.; Dewettinck, K.; Van Bockstaele, F. Crystallization behavior of monoglyceride oleogels: A comparison between a fully hydrogenated palm oil and a fully hydrogenated rapeseed oil based monoglycerides. Eur. J. Lipid Sci. Technol. 2024, 126, 2300261. [Google Scholar] [CrossRef]
- Vereecken, J.; Meeussen, W.; Foubert, I.; Lesaffer, A.; Wouters, J.; Dewettinck, K. Comparing the crystallization and polymorphic behaviour of saturated and unsaturated monoglycerides. Food Res. Int. 2009, 42, 1415–1425. [Google Scholar] [CrossRef]
- López-Martínez, A.; Morales-Rueda, J.A.; Dibildox-Alvarado, E.; Charó-Alonso, M.A.; Marangoni, A.G.; Toro-Vazquez, J.F. Comparing the crystallization and rheological behavior of organogels developed by pure and commercial monoglycerides in vegetable oil. Food Res. Int. 2014, 64, 946–957. [Google Scholar] [CrossRef]
- Cholakova, D.; Denkov, N. Polymorphic phase transitions in triglycerides and their mixtures studied by SAXS/WAXS techniques: In bulk and in emulsions. Adv. Colloid Interface Sci. 2024, 323, 103071. [Google Scholar] [CrossRef]
- Kellens, M.; Meeussen, W.; Reynaers, H. Crystallization and phase transition studies of tripalmitin. Chem. Phys. Lipids 1990, 55, 163–178. [Google Scholar] [CrossRef]
- Chen, C.-H.; Damme, I.; Terentjev, E. Phase behavior of C18 monoglyceride in hydrophobic solutions. Soft Matter 2008, 5, 432–439. [Google Scholar] [CrossRef]
- Rogers, M.; Tang, D.; Ahmadi, L.; Marangoni, A. Fat Crystal Networks. In Food Materials Science; Springer: Berlin/Heidelberg, Germany, 2008; pp. 369–414. [Google Scholar] [CrossRef]
- Rondou, K.; De Witte, F.; Rimaux, T.; Dewinter, W.; Dewettinck, K.; Verwaeren, J.; Van Bockstaele, F. Multiscale analysis of monoglyceride oleogels during storage. J. Am. Oil Chem. Soc. 2022, 99, 1019–1031. [Google Scholar] [CrossRef]
- Tran, T.; Rousseau, D. Influence of shear on fat crystallization. Food Res. Int. 2016, 81, 157–162. [Google Scholar] [CrossRef]
- Omonov, T.S.; Bouzidi, L.; Narine, S.S. Quantification of oil binding capacity of structuring fats: A novel method and its application. Chem. Phys. Lipids 2010, 163, 728–740. [Google Scholar] [CrossRef]
- Yao, Y.; Zhou, H.; Liu, W.; Li, C.; Wang, S. The Effect of Cooling Rate on the Microstructure and Macroscopic Properties of Rice Bran Wax Oleogels. J. Oleo Sci. 2021, 70, 135–143. [Google Scholar] [CrossRef]
- Campos, R. Experimental Methodology. In Structure and Properties of Fat Crystal Networks; Marangoni, A.G., Wesdorp, L.H., Eds.; CRC Press: Boca Raton, FL, USA, 2012; pp. 267–349. [Google Scholar] [CrossRef]
- Macias-Rodriguez, B.; Marangoni, A.G. Rheological characterization of triglyceride shortenings. Rheol. Acta 2016, 55, 767–779. [Google Scholar] [CrossRef]
- Yang, S.; Yang, G.; Chen, X.; Chen, J.; Liu, W. Interaction of monopalmitate and carnauba wax on the properties and crystallization behavior of soybean oleogel. Grain Oil Sci. Technol. 2020, 3, 49–56. [Google Scholar] [CrossRef]


| Cooling Rate (°C/min) | Total Enthalpy (J/g) | Onset Temperature (°C) | Peak Temperature Event 1 (°C) | Peak Temperature Event 2 (°C) | Peak Temperature Event 3 (°C) | |
|---|---|---|---|---|---|---|
| M0-T100 | 1 | 17.9 ± 0.3 a,A | 33.41 ± 0.08 a,A | 31.90 ± 0.03 a,A | n/a | n/a |
| 10 | 13.4 ± 0.1 a,A | 31.26 ± 0.09 a,B | 30.99 ± 0.07 a,A | n/a | n/a | |
| M25-T75 | 1 | 17.5 ± 0.5 a,A | 32.51 ± 0.29 a,A | 31.31 ± 0.19 a,A | 29.75 ± 019 a | n/a |
| 10 | 12.1 ± 0.4 a,A | 31.19 ± 0.53 a,A | 29.31 ± 0.47 a,B | n/a | n/a | |
| M50-T50 | 1 | 15.9 ± 0.3 b,A | 35.45 ± 0.07 b,A | 40.22 ± 0.55 b,A | 34.06 ± 0.07 b,A | n/a |
| 10 | 10.1 ± 0.4 b,A | 34.13 ± 0.08 b,A | 36.99 ± 0.76 b,B | 30.73 ± 0.15 a,A | n/a | |
| M75-T25 | 1 | 15.4 ± 0.3 b,A | 51.41 ± 0.93 c,A | 49.33 ± 1.14 c,A | 36.45 ± 1.41 b,c,A | n/a |
| 10 | 11.2 ± 1.1 a,b,B | 49.23 ± 1.06 c,B | 46.79 ± 0.60 c,B | 33.98 ± 0.35 b,A | 28.73 ± 0.32 a | |
| M100-T0 | 1 | 19.4 ± 0.1 c,A | 56.04 ± 1.51 c,A | 54.87 ± 1.53 d,A | 37.01 ± 0.46 c,A | 25.92 ± 0.58 A |
| 10 | 17.9 ± 0.2 c,B | 53.41 ± 2.12 c,B | 52.65 ± 1.32 d,A | 36.02 ± 0.65 c,A | 22.83 ± 0.58 a,A |
| Storage (Weeks) | Complex Modulus in LVR (Pa) | Phase Shift Angle in LVR (°) | Yield Stress (Pa) | Flow Point (Pa) | OBC (%) | |
|---|---|---|---|---|---|---|
| Dy-M0-T100 | 0 | 1.9 × 10⁴ ± 1.8 × 10³ a,b,A | 6.07 ± 0.17 a,A | 26 ± 4 a,A | 481 ± 9 a,A | 99.7 ± 0.3 a,A |
| 1 | 1.7 × 10⁴ ± 8.5 × 10² a,b,c,A,B | 6.38 ± 0.15 a,A | 22 ± 2 a,A,B | 450 ± 4 a,B | 99.8 ± 0.2 a,A | |
| 4 | 1.5 × 10⁴ ± 6.1 × 10² a,B | 6.36 ± 0.18 a,A | 18 ± 2 a,B | 434 ± 6 a,B | 99.2 ± 0.4 a,A | |
| Dy-M25-T75 | 0 | 1.7 × 10⁴ ± 1.5 × 10³ a,A | 6.26 ± 0.27 a,A | 22 ± 3 a,A | 428 ± 3 b,A | 99.4 ± 0.6 a,A |
| 1 | 1.5 × 10⁴ ±5.3 × 10² a,A,B | 6.60 ± 0.08 a,A | 16 ± 2 a,A,B | 409 ± 6 b,B | 100.0 ± 0.1 a,A | |
| 4 | 1.3 × 10⁴ ± 9.6 × 10² a,b,B | 6.61 ± 0.25 a,b,A | 12 ± 2 a,c,B | 382 ± 10 b,C | 99.8 ± 0.3 a,A | |
| Dy-M50-T50 | 0 | 2.4 × 10⁴ ± 1.8 × 10³ b,c,A | 6.39 ± 0.07 a,A | 24 ± 4 a,b,A | 519 ± 9 c,A | 99.4 ± 0.2 a,A |
| 1 | 1.9 × 10⁴ ± 5.6 × 10² b,B | 7.22 ± 0.08 b,A | 19 ± 2 a,A,B | 452 ± 5 a,B | 99.5 ± 0.4 * | |
| 4 | 1.5 × 10⁴ ± 7.5 × 10² a,C | 7.47 ± 0.46 a,b,A | 15 ± 4 a,B | 419 ± 13 a,b,C | 99.6 ± 0.2 a,A | |
| Dy-M75-T25 | 0 | 2.0 × 10⁴ ± 1.0 × 10³ a,c,A | 7.27 ± 0.51 a,A | 12 ± 5 b,A | 353 ± 1 d,A | 99.6 ± 0.4 a,A |
| 1 | 1.4 × 10⁴ ± 5.7 × 10² a,B | 8.06 ± 0.98 a,b,A | 7 ± 4 b,A | 276 ± 8 c,B | 99.0 ± 0.6 * | |
| 4 | 1.0 × 10⁴ ± 3.9 × 10² b,C | 8.18 ± 0.40 b,A | 7 ± 2 b,c,A | 234 ± 9 c,C | 98.7 ± 0.6 a,A | |
| Dy-M100-T0 | 0 | 5.1 × 10³ ± 1.4 × 10³ d,A | 12.59 ± 2.24 a,A | 2 ± 1 c,A | 75 ± 3 e,A | 96.6 ± 1.3 a,A |
| 1 | 4.9 × 10³ ± 7.6 × 10² c,A | 16.10 ± 2.28 b,A | 2 ± 1 b,A | 57 ± 5 d,B | 94.4 ± 0.8 b,A,B | |
| 4 | 5.4 × 10³ ± 6.5 × 10² c,A | 15.40 ± 1.35 c,A | 3 ± 2 b,A | 52 ± 4 d,B | 93.6 ± 0.4 b,B |
Disclaimer/Publisher’s Note: The statements, opinions and data contained in all publications are solely those of the individual author(s) and contributor(s) and not of MDPI and/or the editor(s). MDPI and/or the editor(s) disclaim responsibility for any injury to people or property resulting from any ideas, methods, instructions or products referred to in the content. |
© 2024 by the authors. Licensee MDPI, Basel, Switzerland. This article is an open access article distributed under the terms and conditions of the Creative Commons Attribution (CC BY) license (https://creativecommons.org/licenses/by/4.0/).
Share and Cite
Rondou, K.; Dewettinck, A.; Dewettinck, K.; Van Bockstaele, F. Structural Build-Up and Stability of Hybrid Monoglyceride–Triglyceride Oleogels. Gels 2024, 10, 650. https://doi.org/10.3390/gels10100650
Rondou K, Dewettinck A, Dewettinck K, Van Bockstaele F. Structural Build-Up and Stability of Hybrid Monoglyceride–Triglyceride Oleogels. Gels. 2024; 10(10):650. https://doi.org/10.3390/gels10100650
Chicago/Turabian StyleRondou, Kato, Antonia Dewettinck, Koen Dewettinck, and Filip Van Bockstaele. 2024. "Structural Build-Up and Stability of Hybrid Monoglyceride–Triglyceride Oleogels" Gels 10, no. 10: 650. https://doi.org/10.3390/gels10100650
APA StyleRondou, K., Dewettinck, A., Dewettinck, K., & Van Bockstaele, F. (2024). Structural Build-Up and Stability of Hybrid Monoglyceride–Triglyceride Oleogels. Gels, 10(10), 650. https://doi.org/10.3390/gels10100650