
Development and Validation of a HTS Platform for the Discovery of New Antifungal Agents against Four Relevant Fungal Phytopathogens


Abstract
:
1. Introduction
2. Materials and Methods
2.1. Fungal Strains and Conidia Production
2.2. Agar-Based Assays against Fungal Phytopathogens
2.3. Liquid-Based Assays against Fungal Phytopathogens
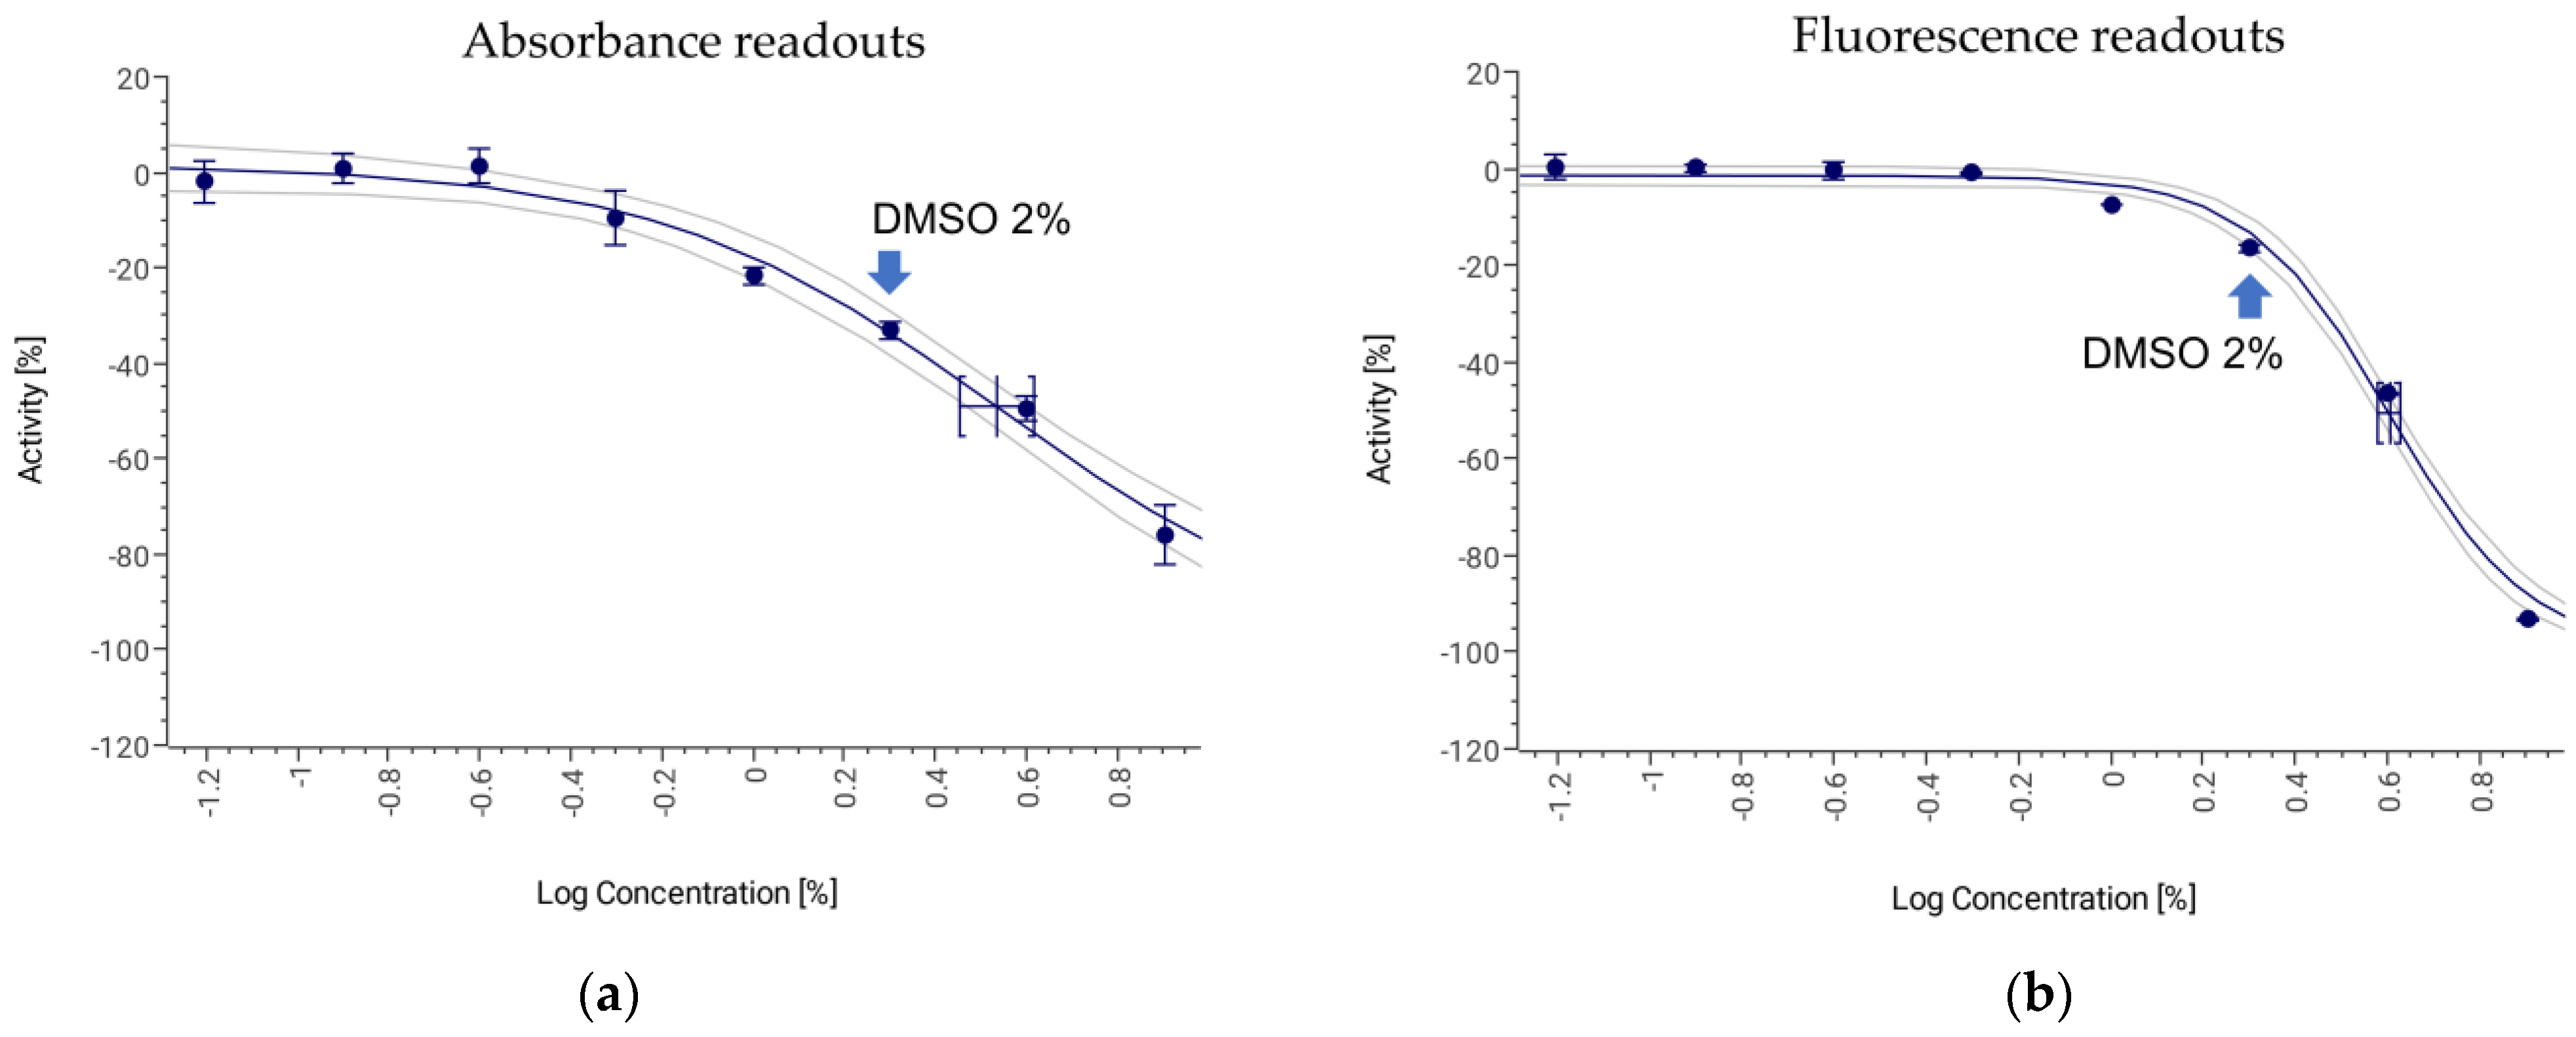
2.4. Validation of Assay Conditions
2.5. Data Analysis
3. Results and Discussion
3.1. Induction of the Sporulation of Fungal Phytopathogens
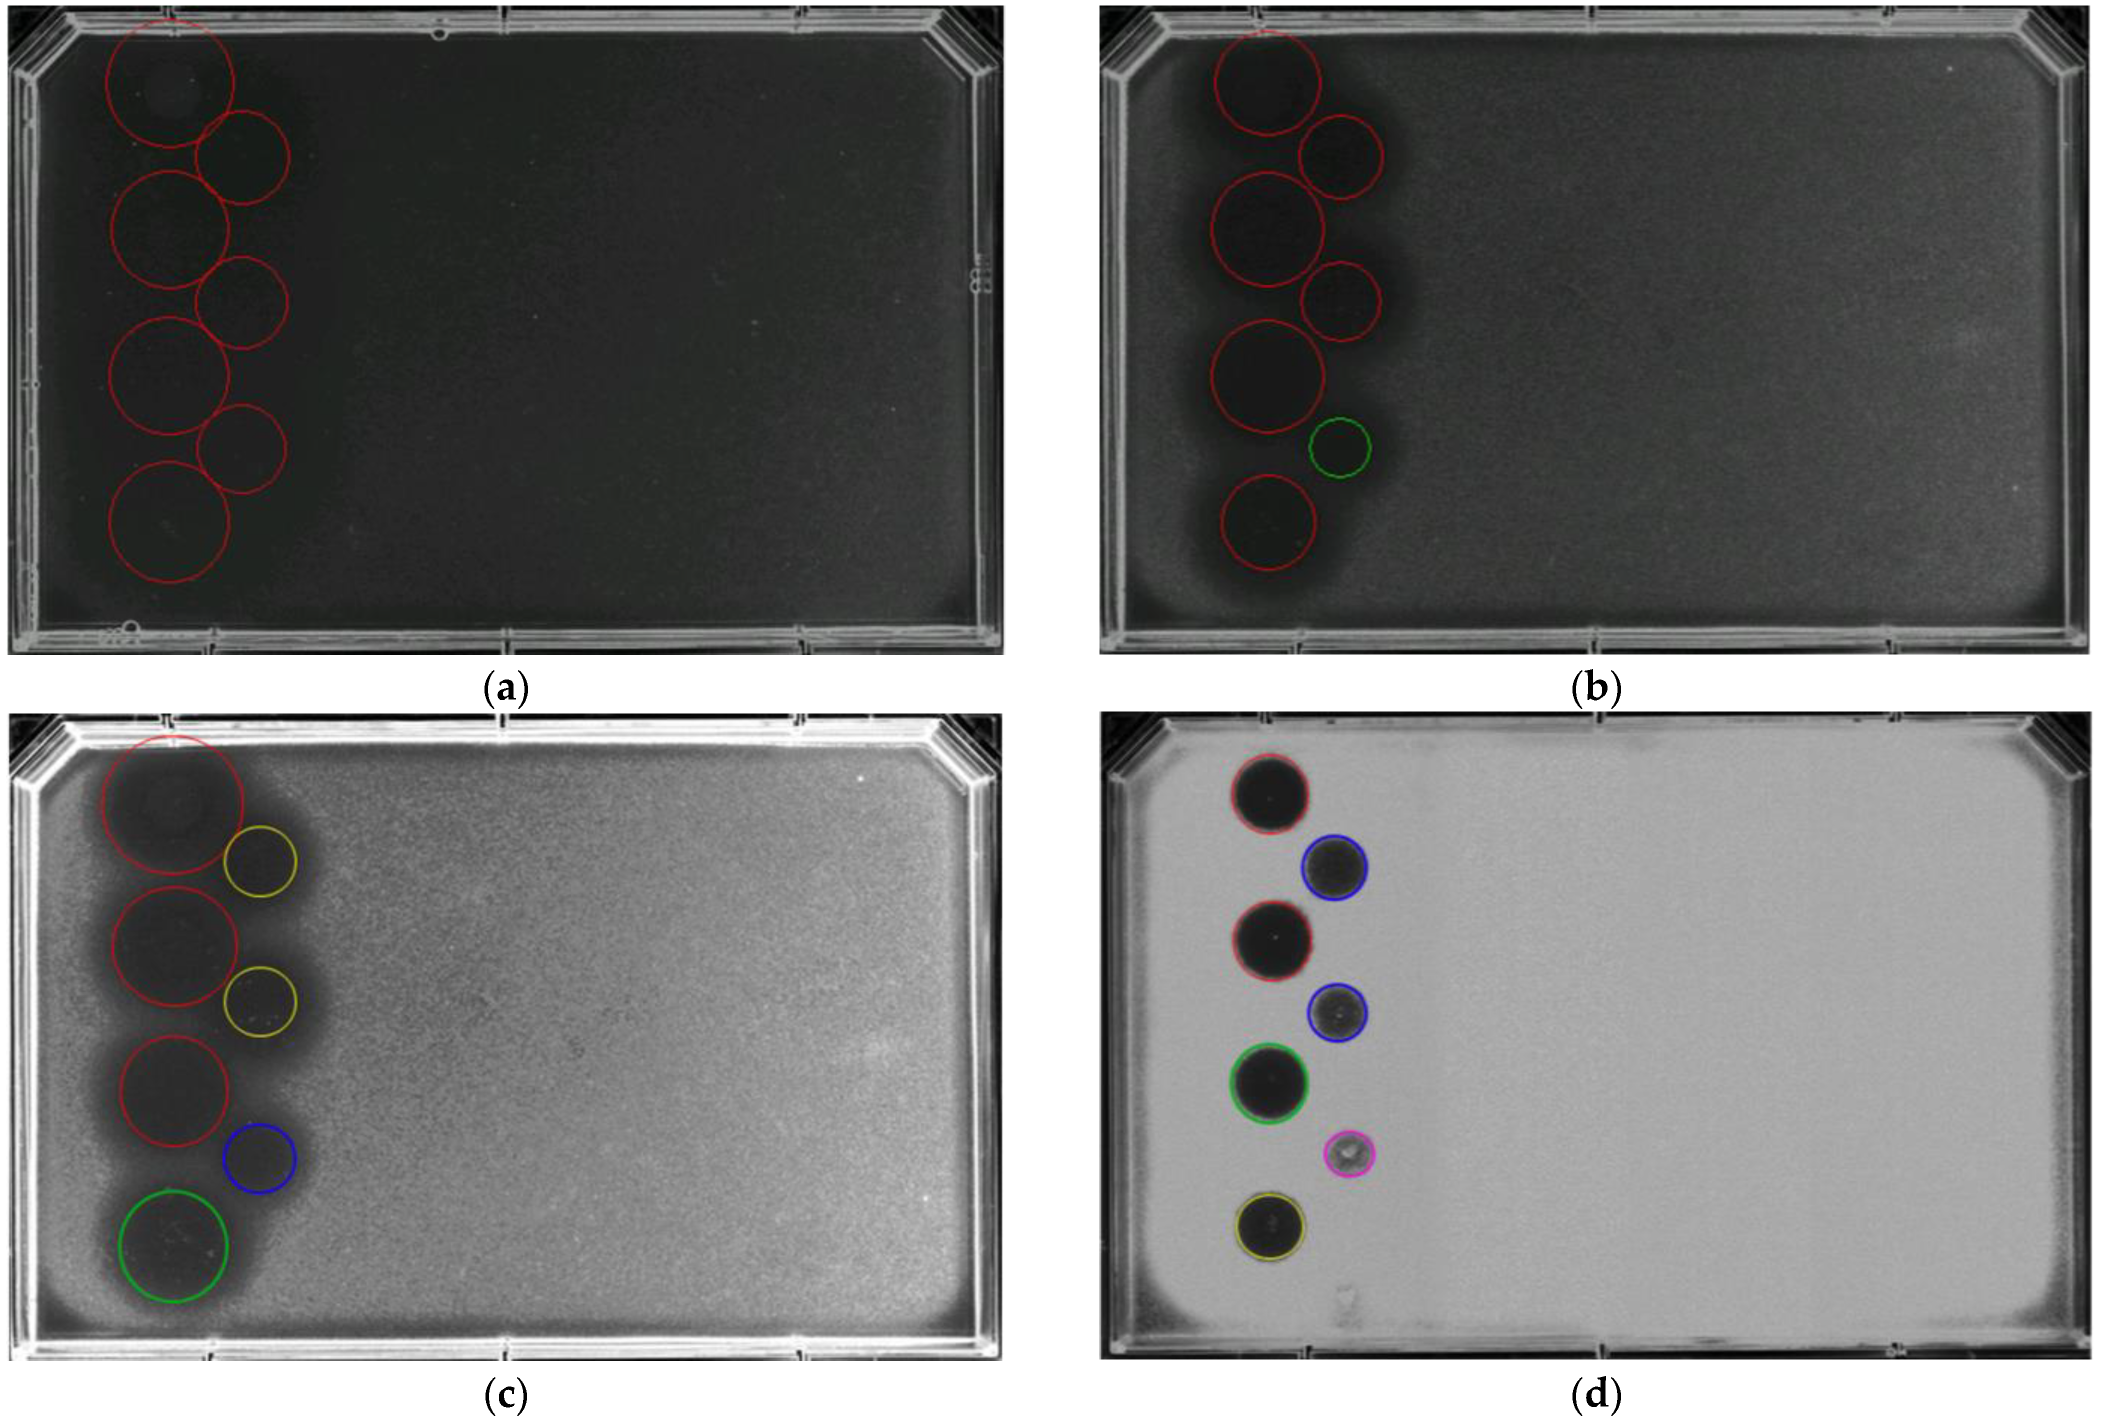
3.2. Botrytis cinerea Agar-Based Assay
3.3. Botrytis cinerea Microdilution Assay
3.4. Colletotrichum acutatum Microdilution Assay
3.5. Fusarium proliferatum Microdilution Assay
3.6. Magnaporthe grisea Microdilution Assay
3.7. Sensitivity and Resistance to Antifungal Standards
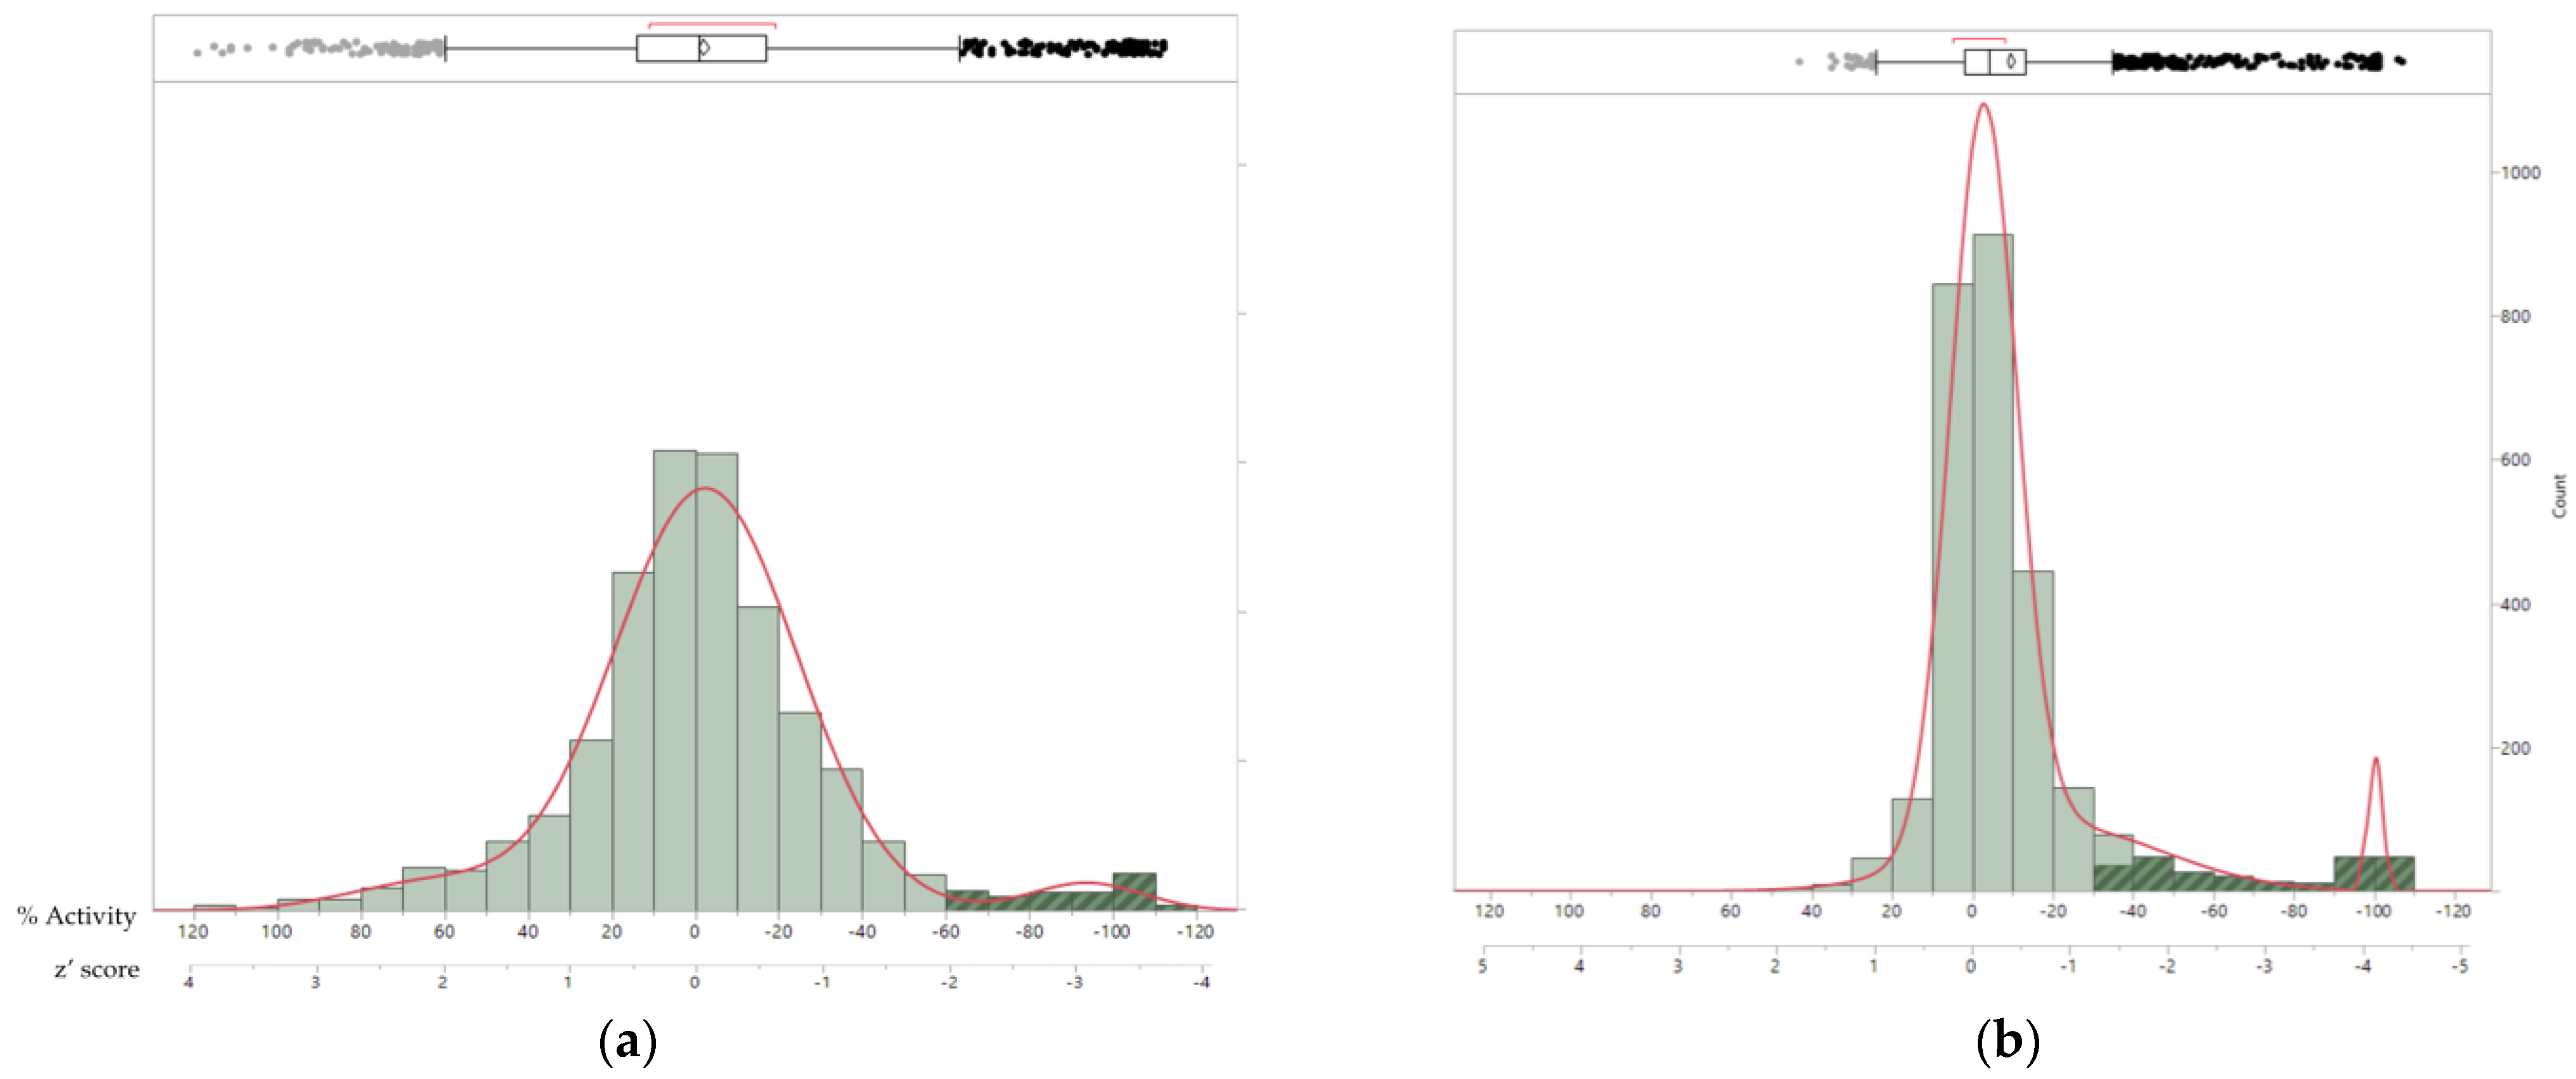
3.8. Antifungal Potential of Microbial Extract Libraries
4. Conclusions
Author Contributions
Funding
Institutional Review Board Statement
Informed Consent Statement
Data Availability Statement
Acknowledgments
Conflicts of Interest
References
- Cattò, C.; de Vincenti, L.; Borgonovo, G.; Bassoli, A.; Marai, S.; Villa, F.; Cappitelli, F.; Saracchi, M. Sub-lethal concentrations of Perilla frutescens essential oils affect phytopathogenic fungal biofilms. J. Environ. Manag. 2019, 245, 264–272. [Google Scholar] [CrossRef]
- Iftikhar, S.; Vigne, A.; Sepulveda-Diaz, J.E. Droplet-based microfluidics platform for antifungal analysis against filamentous fungi. Sci. Rep. 2021, 11, 22998. [Google Scholar] [CrossRef] [PubMed]
- Adnan, M.; Islam, W.; Shabbir, A.; Khan, K.A.; Ghramh, H.A.; Huang, Z.; Chen, H.Y.H.; Lu, G.D. Plant defense against fungal pathogens by antagonistic fungi with Trichoderma in focus. Microb. Pathog. 2019, 129, 7–18. [Google Scholar] [PubMed]
- Dean, R.; Van Kan, J.A.; Pretorius, Z.A.; Hammond-Kosack, K.E.; Di Pietro, A.; Spanu, P.D.; Rudd, J.J.; Dickman, M.; Kahmann, R.; Ellis, J.; et al. The Top 10 fungal pathogens in molecular plant pathology. Mol. Plant Pathol. 2012, 13, 414–430. [Google Scholar] [CrossRef]
- Viaud, M.C.; Balhadère, P.; Talbot, N.J. A Magnaporthe grisea cyclophilin acts as a virulence determinant during plant infection. Plant Cell 2002, 14, 917–930. [Google Scholar] [CrossRef]
- Kohli, M.M.; Mehta, Y.R.; Guzman, E.; de Viedma, L.; Cubilla, L.E. Pyricularia blast—A threat to wheat cultivation. Czech J. Genet. Plant Breed. 2011, 47, S130–S134. [Google Scholar]
- Koeck, M.; Hardham, A.; Dodds, P.N. The role of effectors of biotrophic and hemibiotrophic fungi in infection. Cell Microbiol. 2011, 13, 1849–1857. [Google Scholar] [CrossRef]
- Wang, Q.; Tao, S.; Dubé, C.; Tury, E.; Hao, Y.J.; Zhang, S.; Zhao, M.; Wu, W.; Khanizadeh, S. Postharvest changes in the total phenolic content, antioxidant capacity and L-phenylalanine ammonia-lyase activity of strawberries inoculated with Botrytis. J. Plant Stud. 2012, 1, 11–18. [Google Scholar] [CrossRef]
- Soylu, E.M.; Kurt, Ş.; Soylu, S. In vitro and in vivo antifungal activities of the essential oils of various plants against tomato grey mould disease agent Botrytis cinerea. Int. J. Food Microbiol. 2010, 143, 183–189. [Google Scholar] [CrossRef]
- Couderchet, M. Benefits and problems of fungicide control of Botrytis cinerea in vineyards of Champagne. Vitis 2003, 42, 165–171. [Google Scholar]
- Arias, M.M.; Leandro, L.F.; Munkvold, G.P. Aggressiveness of Fusarium species and impact of root infection on growth and yield of soybeans. Phytopathology 2013, 103, 822–832. [Google Scholar] [CrossRef]
- Lalošević, M.; Jevtić, R.; Župunski, V.; Maširević, S.; Orbović, B. Virulence structure of the wheat powdery mildew population in Serbia. Agronomy 2022, 12, 45. [Google Scholar] [CrossRef]
- Cacciola, S.O.; Faedda, R.; Sinatra, F.; Agosteo, G.; Schena, L.; Frisullo, S.; Lio, G.M.D.S. Olive anthracnose. J. Plant Pathol. 2012, 94, 29–44. Available online: https://www.jstor.org/stable/45156006 (accessed on 27 July 2023).
- Gang, G.H.; Cho, H.J.; Kim, H.S.; Kwack, Y.B.; Kwak, Y.S. Analysis of fungicide sensitivity and genetic diversity among Colletotrichum species in sweet persimmon. Plant Pathol. J. 2015, 31, 115. [Google Scholar] [CrossRef] [PubMed]
- Da Silva, L.L.; Moreno, H.L.A.; Correia, H.L.N.; Santana, M.F.; de Queiroz, M.V. Colletotrichum: Species complexes, lifestyle, and peculiarities of some sources of genetic variability. Appl. Microbiol. Biot. 2020, 104, 1891–1904. [Google Scholar] [CrossRef]
- Gonçalves, D.C.; Ribeiro, W.R.; Gonçalves, D.C.; Menini, L.; Costa, H. Recent advances and future perspective of essential oils in control Colletotrichum spp.: A sustainable alternative in postharvest treatment of fruits. Food Res. Int. 2021, 150, 110758. [Google Scholar] [CrossRef] [PubMed]
- Méndez-Morán, L.; Reynaga-Peña, C.G.; Springer, P.S.; Ruiz-Herrera, J. Ustilago maydis infection of the nonnatural host Arabidopsis thaliana. Mycology 2005, 95, 480–488. [Google Scholar]
- Lawrence, G.J.; Dodds, P.N.; Ellis, J.G. Rust of flax and linseed caused by Melampsora lini. Mol. Plant Pathol. 2007, 8, 349–364. [Google Scholar] [CrossRef]
- Brauer, V.S.; Rezende, C.P.; Pessoni, A.M.; De Paula, R.G.; Rangappa, K.S.; Nayaka, S.C.; Gupta, V.K.; Almeida, F. Antifungal agents in agriculture: Friends and foes of public health. Biomolecules 2019, 9, 521. [Google Scholar] [CrossRef]
- Lucas, J.A. Chapter One—Fungi, Food Crops, and Biosecurity: Advances and Challenges. In Advances in Food Security and Sustainability; Barling, D., Ed.; Elsevier: Amsterdam, The Netherlands, 2017; Volume 2, pp. 1–40. [Google Scholar] [CrossRef]
- Pretty, J.; Bharucha, Z.P. Integrated pest management for sustainable intensification of agriculture in Asia and Africa. Insects 2015, 6, 152–182. [Google Scholar] [CrossRef]
- Meela, M.M.; Mdee, L.K.; Masoko, P.; Eloff, J.N. Acetone leaf extracts of seven invasive weeds have promising activity against eight important plant fungal pathogens. S. Afr. J. Bot. 2019, 121, 442–446. [Google Scholar] [CrossRef]
- Rampersad, S.N. A rapid colorimetric microtiter bioassay to evaluate fungicide sensitivity among Verticillium dahliae isolates. Plant Dis. 2011, 95, 248–255. [Google Scholar] [CrossRef] [PubMed]
- Chadha, S.; Kale, S.P. Simple fluorescence-based high throughput cell viability assay for filamentous fungi. Lett. Appl. Microbiol. 2015, 61, 238–244. [Google Scholar] [CrossRef]
- Serrano, R.; González-Menéndez, V.; Rodríguez, L.; Martín, J.; Tormo, J.R.; Genilloud, O. Co-culturing of fungal strains against Botrytis cinerea as a model for the induction of chemical diversity and therapeutic agents. Front. Microbiol. 2017, 8, 649. [Google Scholar] [CrossRef]
- Santra, H.K.; Banerjee, D. Natural Products as fungicide and their role in Crop Protection. In Natural Bioactive Products in Sustainable Agriculture; Springer: Singapore, 2020; pp. 131–219. [Google Scholar] [CrossRef]
- Kumar, S.; Singh, A. Biopesticides: Present status and the future prospects. J. Biofertil. Biopestic. 2015, 6, e129. [Google Scholar] [CrossRef]
- Sayyed, R.Z.; Patel, P.R. Biocontrol potential of siderophore producing heavy metal resistant Alcaligenes sp. and Pseudomonas aeruginosa RZS3 vis-à-vis Organophosphorus Fungicide. Indian J. Microbiol. 2011, 51, 266–272. [Google Scholar] [CrossRef] [PubMed]
- González-Menéndez, V.; Asensio, F.; Moreno, C.; de Pedro, N.; Monteiro, M.C.; de la Cruz, M.; Vicente, F.; Bills, G.F.; Reyes, F.; Genilloud, O.; et al. Assessing the effects of adsorptive polymeric resin additions on fungal secondary metabolite chemical diversity. Mycology 2014, 5, 179–191. [Google Scholar] [CrossRef]
- Chen, C.; Long, L.; Zhang, F.; Chen, Q.; Chen, C.; Yu, X.; Liu, Q.; Bao, J.; Long, Z. Antifungal activity, main active components and mechanism of Curcuma longa extract against Fusarium graminearum. PLoS ONE 2018, 13, e0194284. [Google Scholar] [CrossRef]
- Monteiro, M.C.; de La Cruz, M.; Cantizani, J.; Moreno, C.; Tormo, J.R.; Mellado, E.; De Lucas, J.R.; Asensio, F.; Valiante, V.; Brakhage, A.A.; et al. A new approach to drug discovery: High-throughput screening of microbial natural extracts against Aspergillus fumigatus using resazurin. J. Biomol. Screen. 2012, 17, 542–549. [Google Scholar] [CrossRef]
- Vega, B.; Liberti, D.; Harmon, P.F.; Dewdney, M.M. A rapid resazurin-based microtiter assay to evaluate QoI sensitivity for Alternaria alternata isolates and their molecular characterization. Plant Dis. 2012, 96, 1262–1270. [Google Scholar] [CrossRef]
- Santos, D.A.; Hamdan, J.S. Evaluation of broth microdilution antifungal susceptibility testing conditions for Trichophyton rubrum. J. Clin. Microbiol. 2005, 43, 1917–1920. [Google Scholar] [CrossRef] [PubMed]
- De La Cruz, M.; Martín, J.; González-Menéndez, V.; Pérez-Victoria, I.; Moreno, C.; Tormo, J.R.; EL Aouad, N.; Guarro, J.; Vicente, F.; Reyes, F.; et al. Chemical and physical modulation of antibiotic activity in Emericella species. Chem. Biodivers. 2012, 9, 1095–1113. [Google Scholar] [CrossRef] [PubMed]
- Thevissen, K.; Terras, F.R.G.; Broekaert, W. Permeabilization of fungal membranes by plant defensins inhibits fungal growth. Appl. Environ. Microbiol. 1999, 65, 5451–5458. [Google Scholar] [CrossRef] [PubMed]
- Pelloux-Prayer, A.; Priem, B.; Joseleau, J. Kinetic evaluation of conidial germination of Botrytis cinerea by a spectrofluorometric method. Mycol. Res. 1998, 102, 320–322. [Google Scholar] [CrossRef]
- Franche, A.; Imbs, C.; Fayeulle, A.; Merlier, F.; Billamboz, M.; Léonard, E. Zinc-mediated reactions on salicylaldehyde for Botrytis cinerea control. Chin. Chem. Lett. 2020, 31, 706–710. [Google Scholar] [CrossRef]
- Chutrakul, C.; Khaokhajorn, P.; Auncharoen, P.; Boonruengprapa, T.; Mongkolporn, O. The potential of a fluorescent-based approach for bioassay of antifungal agents against chili anthracnose disease in Thailand. Biosci. Biotechnol. Biochem. 2013, 77, 259–265. [Google Scholar] [CrossRef]
- Chutrakul, C.; Boonruangprapa, T.; Suvannakad, R.; Isaka, M.; Sirithunya, P.; Toojinda, T.; Kirtikara, K. Ascherxanthone B from Aschersonia luteola, a new antifungal compound active against rice blast pathogen Magnaporthe grisea. J. Appl. Microbiol. 2009, 107, 1624–1631. [Google Scholar] [CrossRef]
- Alastruey-Izquierdo, A.; Cuenca-Estrella, M.; Monzón, A.; Mellado, E.; Rodríguez-Tudela, J.L. Antifungal susceptibility profile of clinical Fusarium spp. isolates identified by molecular methods. J. Antimicrob. Chemother. 2008, 61, 805–809. [Google Scholar] [CrossRef]
- Gray, K.C.; Palacios, D.S.; Dailey, I.; Endo, M.M.; Uno, B.E.; Wilcock, B.C.; Burke, M.D. Amphotericin primarily kills yeast by simply binding ergosterol. Proc. Natl. Acad. Sci. USA 2012, 109, 2234–2239. [Google Scholar] [CrossRef]
- Fungicide Resistance Action Committee. FRAC Code List ©* 2022: Fungal Control Agents Sorted by Cross-Resistance Pattern and Mode of Action (Including Coding for FRAC Groups on Product Labels). Available online: https://www.frac.info/docs/default-source/publications/frac-code-list/frac-code-list-2022--final.pdf?sfvrsn=b6024e9a_2 (accessed on 1 June 2023).
- Mondal, S.N.; Bhatia, A.; Shilts, T.; Timmer, L.W. Baseline sensitivities of fungal pathogens of fruit and foliage of Citrus to Azoxystrobin, Pyraclostrobin, and Fenbuconazole. Plant Dis. 2005, 89, 1186–1194. [Google Scholar] [CrossRef]
- Piccirillo, G.; Carrieri, R.; Polizzi, G.; Azzaro, A.; Lahoz, E.; Fernández-Ortuño, D.; Vitale, A. In vitro and in vivo activity of QoI fungicides against Colletotrichum gloeosporioides causing fruit anthracnose in Citrus sinensis. Sci. Hortic. 2018, 236, 90–95. [Google Scholar] [CrossRef]
- Grayson, B.T.; Boyd, S.L.; Sampson, A.J.; Drummond, J.N.; Walter, D. Effect of adjuvants on the performance of the new cereal fungicide, metconazole. I glasshouse trials. Pestic. Sci. 1995, 45, 153–160. [Google Scholar] [CrossRef]
- Pirgozliev, S.R.; Edwards, S.G.; Hare, M.C.; Jenkinson, P. Effect of dose rate of Azoxystrobin and Metconazole on the development of Fusarium Head Blight and the accumulation of Deoxynivalenol (DON) in wheat grain. Eur. J. Plant Pathol. 2002, 108, 469–478. [Google Scholar] [CrossRef]
- Song, Y.; Xu, D.; Lu, H.; He, L.; Chen, L.; Shao, J.; Xu, C.; Mu, W.; Liu, F. Baseline sensitivity and efficacy of the sterol biosynthesis inhibitor triflumizole against Botrytis cinerea. Australas. Plant Pathol. 2015, 45, 65–72. [Google Scholar] [CrossRef]
- Angioni, A.; Porcua, L.; Dedola, F. Determination of famoxadone, fenamidone, fenhexamid and iprodione residues in greenhouse tomatoes. Pest. Manag. Sci. 2012, 68, 543–547. [Google Scholar] [CrossRef]
- Zhou, Y.; Xu, J.; Zhu, Y.; Duan, Y.; Zhou, M. Mechanism of action of the benzimidazole fungicide on Fusarium graminearum: Interfering with polymerization of monomeric tubulin but not polymerized microtubule. Phytopathology 2016, 106, 807–813. [Google Scholar] [CrossRef]
- Prakash, O.; Kumar, R.; Parkash, V. Synthesis and antifungal activity of some new 3-hydroxy-2-(1-phenyl-3-aryl-4-pyrazolyl) chromones. Eur. J. Med. Chem. 2008, 43, 435–440. [Google Scholar] [CrossRef]
- Petsikos-Panayotarou, N.; Markellou, E.; Kalamarakis, A.E.; Kyriakopoulou, D.; Malathrakis, N.E. In vitro and in vivo activity of Cyprodinil and Pyrimethanil on Botrytis cinerea isolates resistant to other Botryticides and selection for resistance to Pyrimethanil in a greenhouse population in Greece. Eur. J. Plant Pathol. 2003, 109, 173–182. [Google Scholar] [CrossRef]
- Kim, B.S.; Byung Byung, K.H. Microbial Fungicides in the Control of Plant Diseases. J. Phytopathol. 2007, 155, 641–653. [Google Scholar] [CrossRef]
- Yang, F.; Gritsenko, V.; Futterman, Y.S.; Gao, L.; Zhen, C.; Lu, H.; Jiang, Y.Y.; Bermanb, J. Tunicamycin potentiates antifungal drug tolerance via aneuploidy in Candida albicans. mBio 2021, 12, e02272-21. [Google Scholar] [CrossRef]
- Di, S.; Cang, T.; Liu, Z.; Xie, Y.; Zhao, H.; Qi, P.; Wang, Z.; Xu, H.; Wang, X. Comprehensive evaluation of chiral pydiflumetofen from the perspective of reducing environmental risks. Sci. Total Environ. 2022, 826, 154033. [Google Scholar] [CrossRef] [PubMed]
- Liu, S.; Ma, J.; Jiang, B.; Yang, G.; Guo, M. Functional characterization of MoSdhB in conferring resistance to pydiflumetofen in blast fungus Magnaporthe oryzae. Pest. Manag. Sci. 2022, 78, 4018–4027. [Google Scholar] [CrossRef]
- Amiri, A.; Heath, S.M.; Peres, N.A. Resistance to fluopyram, fluxapyroxad and penthiopyrad in Botrytis cinerea from strawberry. Plant Dis. 2013, 98, 532–539. [Google Scholar] [CrossRef] [PubMed]
- Kim, J.O.; Shin, J.H.; Gumilang, A.; Chung, K.; Choi, K.Y.; Kim, K.S. Effectiveness of different classes of fungicides on Botrytis cinerea causing gray mold on fruit and vegetables. Plan. Pathol. J. 2016, 32, 570–574. [Google Scholar] [CrossRef] [PubMed]
- Ishii, H.; Zhen, F.; Hu, M.; Li, X.; Schnabel, G. Efficacy of SDHI fungicides, including benzovindiflupyr, against Colletotrichum species. Pest. Manag. Sci. 2016, 72, 1844–1853. [Google Scholar] [CrossRef]
- Oliveira, M.S.; Cordova, L.G.; Peres, N.A. Efficacy and baseline sensitivity of Succinate-Dehydrogenase-Inhibitor fungicides for management of Colletotrichum crown rot of strawberry. Plant Dis. 2020, 104, 2860–2865. [Google Scholar] [CrossRef]
- Li, Y.; Sun, S.; Guo, Q.; Ma, L.; Shi, C.; Su, L.; Li, H. In vitro interaction between azoles and cyclosporin A against clinical isolates of Candida albicans determined by the chequerboard method and time-kill curves. J. Antimicrob. Chemother. 2008, 61, 577–585. [Google Scholar] [CrossRef]
- Cordeiro, R.A.; Macedo, R.B.; Teixeira, C.E.C.; Marques, F.J.F.; Bandeira, T.J.P.G.; Moreira, J.L.B.; Brilhante, R.S.N.; Rocha, M.F.G.; Sidrim, J.J.C. The calcineurin inhibitor cyclosporin A exhibits synergism with antifungals against Candida parapsilosis species complex. J. Med. Microbiol. 2014, 63, 936–944. [Google Scholar] [CrossRef]
- Owen, W.J.; Yao, C.; Myung, K.; Kemmitt, G.; Leader, A.; Meyer, K.G.; Bowling, A.J.; Slanec, T.; Kramer, V.J. Biological characterization of fenpicoxamid, a new fungicide with utility in cereals and other crops. Pest. Manag. Sci. 2017, 73, 2005–2016. [Google Scholar] [CrossRef]
- Loiseleur, O. Natural products in the discovery of agrochemicals. Chimia 2017, 71, 810–822. [Google Scholar] [CrossRef]
- Malik, A.K. Determination of the fungicide ferbam in wheat grains after adsorption onto microcrystalline naphthalene. J. AOAC Int. 2000, 83, 971–976. [Google Scholar] [PubMed]
- Rathore, H.S.; Ishratullah, K.; Varshney, C.; Varshney, G.; Mojumdar, S.C. Fungicidal and bactericidal activity of metal diethyldithiocarbamate fungicides. Synthesis and characterization. J. Therm. Anal. Calorim. 2008, 94, 75–81. [Google Scholar] [CrossRef]
- Omura, S. The antibiotic cerulenin, a novel tool for biochemistry as an inhibitor of fatty acid synthesis. Bacteriol. Rev. 1976, 40, 681–697. [Google Scholar] [CrossRef] [PubMed]
- Bills, G.F.; Platas, G.; Gams, W. Conspecificity of the cerulenin and helvolic acid producing Cephalosporium caerulens, and the hypocrealean fungus Sarocladium oryzae. Mycol. Res. 2004, 108, 1291–1300. [Google Scholar] [CrossRef]


| Culture Media | Concentration (conidia/mL) | |||
|---|---|---|---|---|
| B. cinerea | C. acutatum | F. proliferatum | M. grisea | |
| Solid Culture Media | ||||
| CMA | - | - | 2.4 × 10⁷ ± 1.3 | 2.7 × 10⁸ ± 1.0 |
| MEA | 5.9 × 10⁵ ± 1.9 | 1.3 × 10⁶ ± 0.9 | 1.2 × 10⁸ ± 1.0 | 9.3 × 10⁷ ± 1.2 |
| OAT | 3.7 × 10⁷ ± 1.5 | 4.6 × 10⁷ ± 3.4 | 1.9 × 10⁷ ± 0.6 | - |
| PDA | 6.7 × 10⁵ ± 2.9 | 3.3 × 10⁷ ± 1.7 | 1.3 × 10⁸ ± 0.5 | 1.3 × 10⁸ ± 0.8 |
| YM | 8.3 × 10⁵ ± 2.9 | 8.8 × 10⁷ ± 1.7 | 1.4 × 10⁸ ± 0.8 | 1.9 × 10⁸ ± 0.9 |
| Liquid Culture Media | ||||
| SDB | - | 5.3 × 10⁶ ± 3.3 | 9.0 × 10⁷ ± 1.4 | 9.3 × 10⁷ ± 2.3 |
| SMY | - | 7.8 × 10⁷ ± 1.9 | 2.5 × 10⁸ ± 0.4 | 1.9 × 10⁸ ± 1.1 |
| PDB | - | 2.0 × 10⁶ ± 0.4 | 8.7 × 10⁷ ± 1.0 | 9.7 × 10⁷ ± 2.4 |
| GMS | - | 8.7 × 10⁶ ± 2.1 | 8.7 × 10⁷ ± 1.3 | 1.5 × 10⁸ ± 0.6 |
| VME | - | 2.9 × 10⁷ ± 1.3 | 1.4 × 10⁸ ± 0.5 | 2.3 × 10⁸ ± 0.9 |
| Parameters | Solid Medium | Liquid Medium |
|---|---|---|
| Time of incubation | 10–21 days | 24–72 h |
| Volume of inoculum | 200 mL (five Petri plates) | 16 mL (one test tube) |
| Time to obtain conidia solution | 1 h (Scraping + Filtration) | 30 min (Filtration) |
| Concentration of Inoculum | Absorbance | Fluorescence | ||
|---|---|---|---|---|
| S/B | RZ’ | S/B | RZ’ | |
| 5 × 10⁵ conidia/mL | 15.31 | 0.76 | 11.74 | 0.76 |
| 1 × 10⁶ conidia/mL | 37.40 | 0.77 | 23.19 | 0.90 |
| 5 × 10⁶ conidia/mL | 2.33 | <0 | 7.65 | 0.55 |
| Parameters | Botrytis cinerea B05.10 | Colletotrichum acutatum CF-137177 | Fusarium proliferatum CBS 115.97 | Magnaporthe grisea CF-105765 |
|---|---|---|---|---|
| Sporulation condition | OAT plates | SMY tube | SMY tube | VME tube |
| Time for sporulation | 14–28 days | 3 days | 2 days | 3 days |
| Assay medium | RPMI-1640 | RPMI-1640 | RPMI-1640 | RPMI-1640 |
| Concentration of conidia | 1 × 10⁶ conidia/mL | 1 × 10⁶ conidia/mL | 1 × 10⁶ conidia/mL | 1 × 10⁶ conidia/mL |
| Tolerance to DMSO | 2% | 2% | 4% | 2% |
| Growth inhibition assay (absorbance readout) | ||||
| Incubation time | 72 h | 40 h | 20 h | 48 h |
| RZ’ (n = 240 wells) | 0.80 ± 0.05 | 0.75 ± 0.01 | 0.77 ± 0.05 | 0.81 ± 0.03 |
| S/B (n = 240 wells) | 48.95 ± 10.10 | 53.05 ± 5.50 | 57.71 ± 7.04 | 54.21 ± 5.89 |
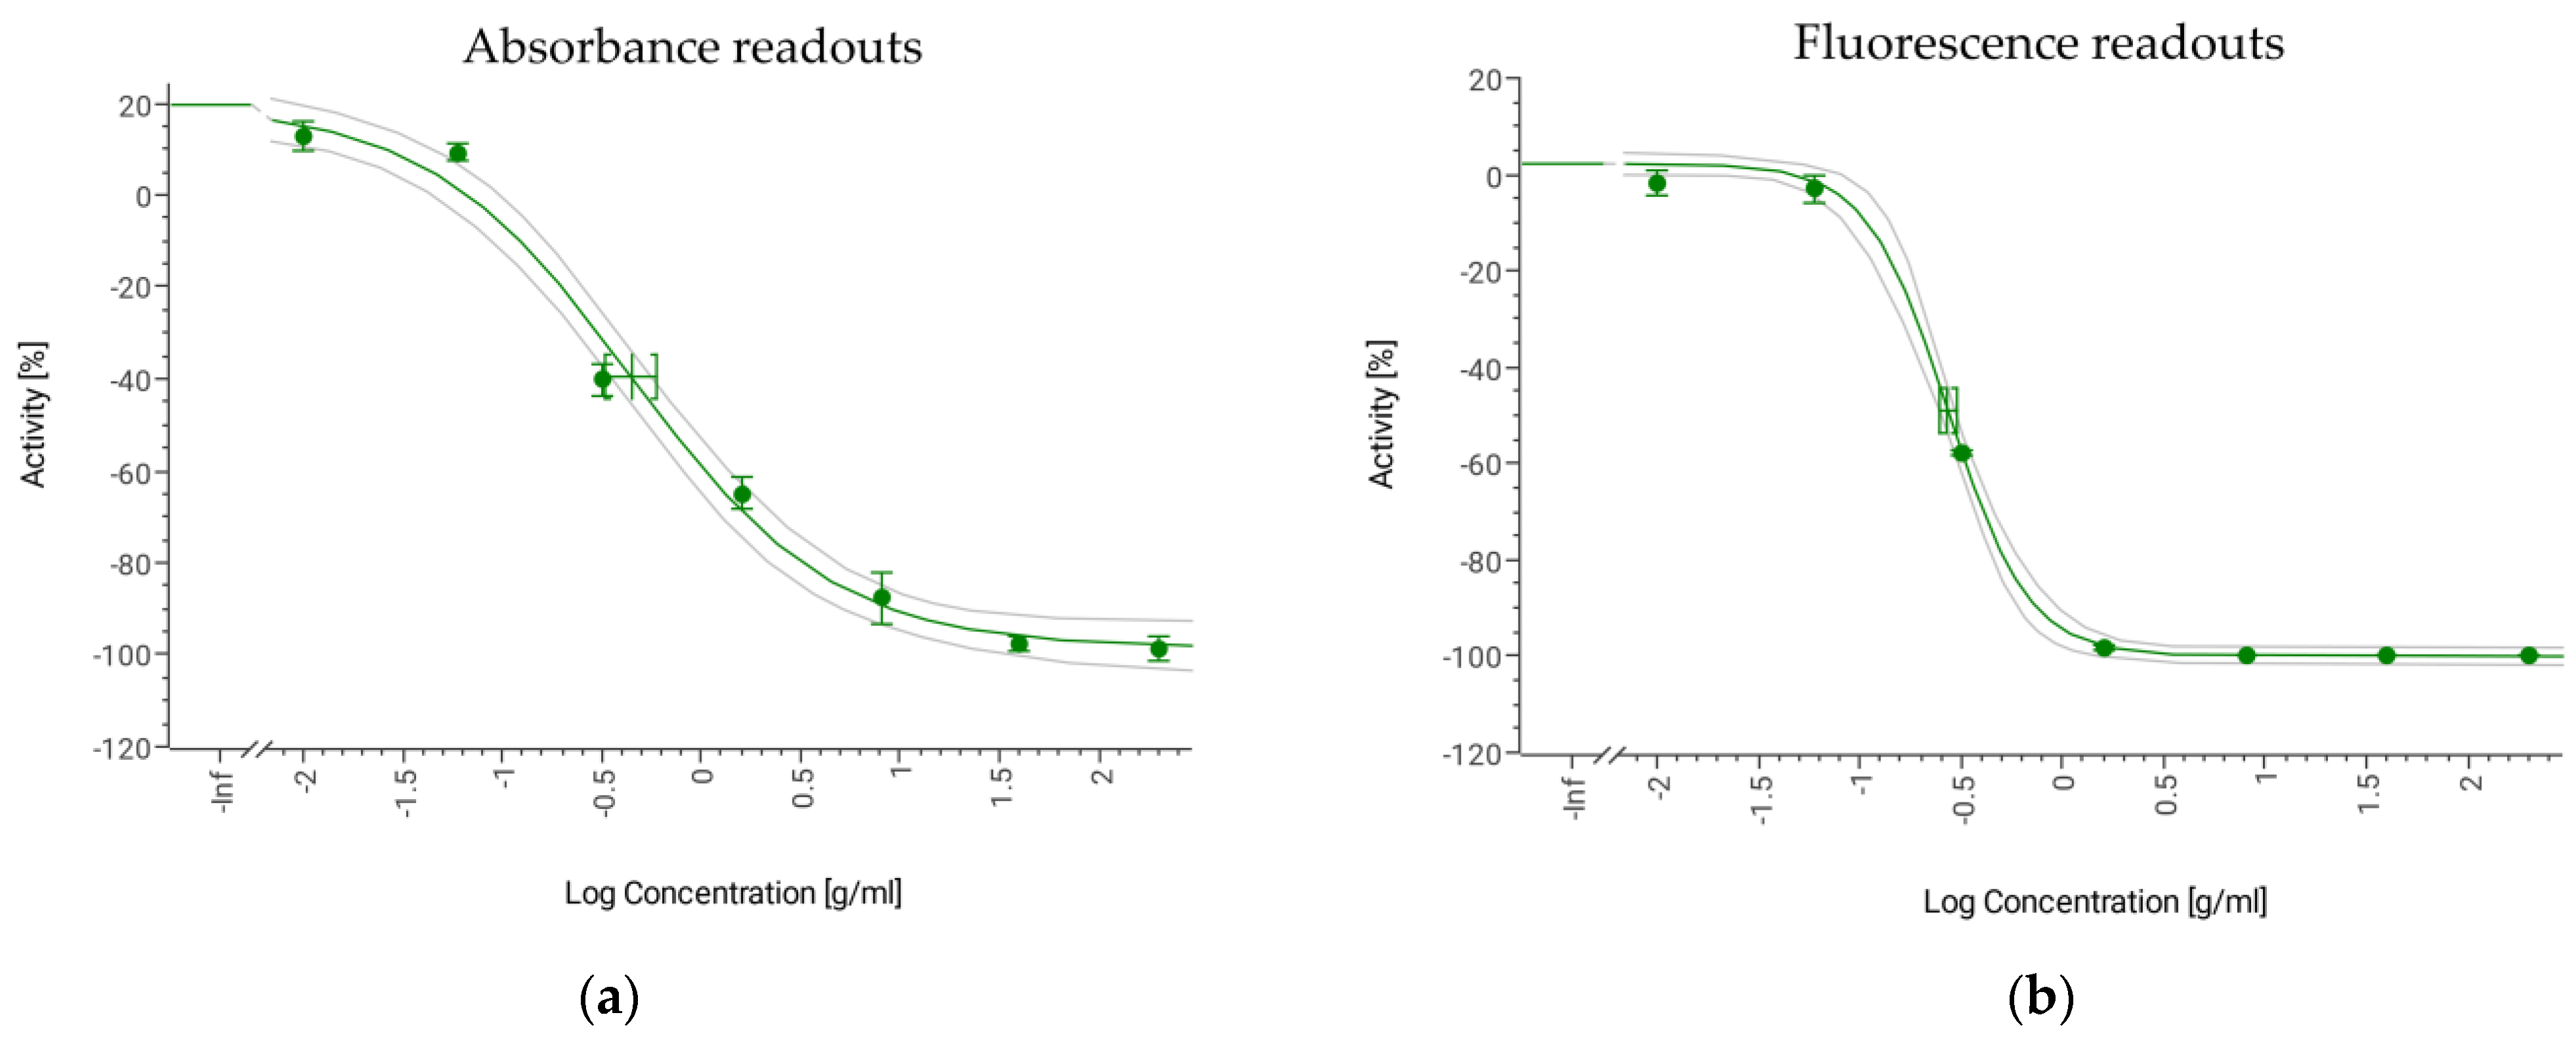
| IC50 AmB (µg/mL) | 0.45 (0.33–0.60) | 1.25 (1.12–1.33) | 6.77 (6.11–7.51) | 4.51 (4.33–4.69) |
| Viability inhibition assay (fluorescence readout) | ||||
| Incubation time (resazurin) | 5–15 min | 3 h | 2 h | 1 h 30 min |
| RZ’ (n = 240 wells) | 0.94 ± 0.03 | 0.91 ± 0.01 | 0.94 ± 0.01 | 0.95 ± 0.01 |
| S/B (n = 240 wells) | 24.98 ± 4.90 | 17.01 ± 1.35 | 17.54 ± 1.76 | 13.62 ± 1.65 |
| IC50 of AmB (µg/mL) | 0.27 (0.25–0.30) | 1.21 (1.19–1.23) | 6.75 (6.41–7.12) | 5.38 (5.30–5.46) |
| Chemical Class | Compound | Mode of Action/ Target Site | Botrytis cinerea | Colletotrichum acutatum | Fusarium proliferatum | Magnaporthe grisea | ||||||||
|---|---|---|---|---|---|---|---|---|---|---|---|---|---|---|
| Agar | Abs | Flu | Agar | Abs | Flu | Agar | Abs | Flu | Agar | Abs | Flu | |||
| MIC | IC50 | IC50 | MIC | IC50 | IC50 | MIC | IC50 | IC50 | MIC | IC50 | IC50 | |||
| Acylalanines | benalaxyl | nucleic acids metabolism/RNA polymerase I | i | i | i | i | i | i | i | i | i | i | i | i |
| metalaxyl | i | i | i | i | i | i | i | i | i | i | i | i | ||
| Anilino- pyrimidines | cyprodinil | protein synthesis | 7.81 | 0.06 (0.05–0.07) | 0.29 (0.24–0.35) | 15.63 | >20 | 14.99 (11.69–19.20) | i | 8.28 (7.12–9.62) | 14.33 (13.88–15.35) | i | 16.02 (13.11–19.57) | >20 |
| Benzimidazoles | benomyl | cytoskeleton and motor proteins/tubulin | 62.5 | 0.06 (0.05–0.07) | 0.06 (0.05–0.06) | 125 | 0.35 (0.33–0.38) | 0.46 (0.43–0.49) | 500 | 0.98 (0.88–1.09) | 0.95 (0.88–1.03) | 1000 | 1.64 (1.51–1.78) | 1.33 (1.29–1.37) |
| thiabendazole | 250 | 0.24 (0.21–0.28) | 0.25 (0.21–0.30) | 62.5 | 10.71 (9.66–11.87) | >20 | 1000 | 2.15 (1.95–2.36) | 1.99 (1.84–2.15) | - | 18.57 (17.86–19.31) | 16.39 (16.04–16.75) | ||
| Cinnamic acid amides | dimethomorph | cell wall biosynthesis/ cellulose synthase | i | i | i | i | i | i | i | i | i | i | i | i |
| Cyano-methylene thiazolidines | flutianil | unknown | i | i | i | i | i | i | i | i | i | i | i | i |
| Cyclic nonribosomal peptides | cyclosporin A | signal transduction | 125 | 1.27 (0.92–1.74) | 2.20 (1.66–2.93 | i | 3.87 (3.198–4.70) | 10.84 (10.27–11.44) | i | i | i | i | i | i |
| Dicarboximide | cycloheximide | protein synthesis | 250 | 8.96 (7.27–11.05) | 4.91 (4.05–5.96) | 250 | 0.57 (0.49–0.66) | 1.67 (1.53–1.82) | 125 | 1.29 (1.07–1.56) | 1.21 (1.11–1.31) | 250 | 7.94 (7.44–8.48) | 5.07 (4.90–5.25) |
| Dithio-carbamates | ferbam | multi-site contact | 250 | 0.30 (0.28–0.32) | 0.37 (0.36–0.38) | 62.5 | 0.24 (0.22–0.25) | 0.66 (0.63–0.70) | 125 | 1.23 (1.08–1.41) | 1.84 (1.75–1.94) | i | 0.45 (0.43–0.47) | 0.28 (0.28–0.29) |
| Ethylamino- thiazolecarboxamide | ethaboxam | cytoskeleton and motor proteins/tubulin | i | i | i | i | i | i | i | i | i | i | i | i |
| Glucopyranosyl antibiotics | validamycin | unknown/trehalase | i | i | i | i | i | i | i | i | i | i | i | i |
| Imidazolone | triflumizole | sterol biosynthesis/ C14-demethylase | 62.5 | <0.04 | <0.04 | 15.63 | <0.04 | <0.04 | 7.81 | 0.26 (0.22–0.32) | 0.28 (0.23–0.35) | 31.25 | 0.05 (0.04–0.06) | <0.04 |
| fenamidone | respiration/complex III: cyt bc1 at Qo site | i | i | i | 500 | 11.33 (10.25–12.51) | >20 | i | i | i | 500 | 9.45 (8.79–10.16) | 1.94 (1.85–2.02) | |
| Macrocyclic | radicicol | histidine kinase/Hsp90 | i | i | i | i | i | i | i | i | i | i | i | i |
| Mandelic acid amides | mandipropamid | cell wall biosynthesis/ cellulose synthase | i | i | i | i | i | i | i | i | i | i | i | i |
| Monocarboxylic acid amide | cerulenin | fatty acid biosynthesis/ b-ketoacyl-acyl carrier protein synthase | i | i | i | i | 6.70 (5.64–7.96) | 11.98 (11.47–12.51) | i | i | i | i | i | i |
| Mycotoxin | cytochalasin B | cell division | i | i | i | i | i | i | i | i | i | i | i | i |
| N-methoxy- (phenylethyl)- pyrazolecarboxamides | pydiflumetofen | respiration/complex II: succinate-dehydrogenase | 15.63 | 0.07 (0.07–0.08) | 0.12 (0.11–0.13) | i | 6.32 (5.32–7.50) | 2.08 (1.89–2.29) | 15.63 | <0.04 | <0.04 | 15.62 | 0.14 (0.11–0.18) | <0.04 |
| Nucleoside | tubercidin | protein synthesis | i | i | i | i | 12.25 (9.69–15.49) | >20 | i | i | i | i | i | i |
| tunicamycin | 125 | 2.62 (1.79–3.84) | 2.55 (2.34–2.77) | 500 | 4.05 (3.55–4.63) | 6.71 (5.26–7.20) | i | i | i | i | i | i | ||
| Phenyl-oxo- ethylthiophene amide | isofetamid | respiration/complex II: succinate-dehydrogenase | 31.25 | 0.16 (0.13–0.19) | 0.40 (0.34–0.45) | i | i | i | i | 14.00 (10.95–17.91) | 19.94 (16.92–23.50) | 62.5 | 1.49 (1.26–1.77) | 0.23 (0.21–0.26) |
| Phenylpyrroles | fludioxonil | signal transduction/ MAP/Histidine Kinase | 62.5 | <0.04 | 0.07 (0.07–0.07) | 31.25 | 0.07 (0.07–0.07) | 0.07 (0.07–0.07) | 31.25 | 0.09 (0.09–0.11) | <0.04 | 125 | 0.22 (0.21–0.24) | 0.09 (0.09–0.09) |
| Picolinamides | fenpicoxamid | respiration/complex III: cyt bc1 at Qi site | 62.5 | 0.07 (0.06–0.08) | 0.43 (0.32–0.57) | 15.63 | i | i | i | i | i | 62.5 | 2.04 (1.61–2.59) | 0.40 (0.39–0.42) |
| Pyridinecarboxamides | boscalid | respiration/complex II: succinate-dehydrogenase | 125 | 0.33 (0.30–0.36) | 0.70 (0.65–0.74) | i | i | i | i | i | i | i | i | i |
| Pyridinyl- ethylbenzamides | fluopyram | 125 | 0.28 (0.25–0.32) | 1.27 (1.17–1.37) | i | i | i | i | 5.77 (4.08–8.15) | 12.24 (10.49–14.28) | i | >20 | 17.28 (16.02–18.64) | |
| Strobirulin | azoxystrobin | respiration/complex III: cyt bc1 at Qo site | 250 | 0.06 (0.06–0.07) | 0.06 (0.05–0.07) | 62.5 | 0.05 (0.04–0.05) | 0.09 (0.09–0.09) | 31.25 | 0.39 (0.32–0.49) | 0.22 (0.19–0.26) | 62.5 | 0.10 (0.09–0.11) | 0.08 (0.07–0.08) |
| mandestrobin | 250 | <0.04 | 0.78 (0.69–0.87) | 250 | 0.12 (0.11–0.13) | 0.08 (0.08–0.09) | 31.25 | 0.12 (0.11–0.13) | 0.04 (0.04–0.05) | 500 | 2.27 (2.07–2.50) | 0.82 (0.79–0.85) | ||
| pyraclostrobin | 31.25 | <0.04 | 0.07 (0.05–0.09) | 3.91 | <0.04 | <0.04 | 7.81 | 0.06 (0.05–0.07) | <0.04 | 1.95 | <0.04 | <0.04 | ||
| trifloxystrobin | 31.25 | 0.88 (0.51–1.50) | 1.99 (1.66–2.40) | 7.81 | 6.41 (5.83–7.05) | 6.43 (6.06–6.81) | 7.81 | 7.23 (6.44–8.12) | 7.79 (6.59–9.21) | 3.90 | 1.83 (1.52–2.20) | 1.59 (1.49–1.70) | ||
| cyproconazole | sterol biosynthesis/ C14-demethylase | 500 | 0.34 (0.27–0.43) | 0.39 (0.35–0.44) | 62.5 | 0.68 (0.61–0.76) | 2.08 (1.93–2.22) | i | 1.76 (1.17–2.64) | 1.58 (1.37–1.81) | i | i | i | |
| Triazoles | difenoconazole | 250 | 0.44 (0.39–0.49) | 0.81 (0.67–0.97) | 250 | 0.16 (0.14–0.17) | 0.61 (0.56–0.67) | 125 | 0.70 (0.52–0.96) | 0.38 (0.32–0.45) | 1000 | 11.89 (11.34–12.47) | 7.78 (7.34–8.25) | |
| fenbuconazole | 500 | 0.20 (0.18–0.22) | 0.43 (0.38–0.49) | i | 0.23 (0.20–0.27) | 0.58 (0.52–0.64) | i | 1.82 (1.41–2.37) | 1.39 (1.15–1.67) | i | i | i | ||
| itraconazole | 62.5 | 0.31 (0.19–0.51) | 0.31 (0.29–0.33) | 62.5 | 0.12 (0.11–0.13) | 0.63 (0.58–0.70) | 62.5 | 0.53 (0.41–0.68) | 0.74 (0.62–0.87) | i | i | i | ||
| mefentrifluconazole | 250 | 0.07 (0.06–0.08) | 0.11 (0.10–0.12) | 62.5 | 0.11 (0.09–0.12) | 0.28 (0.23–0.34) | 1000 | 0.55 (0.42–0.71) | 0.22 (0.20–0.25) | 1000 | i | i | ||
| metconazole | 250 | 0.06 (0.05–0.05) | 0.10 (0.09–0.11) | 62.5 | <0.04 | 0.05 (0.05–0.06) | 31.25 | <0.04 | <0.04 | 500 | 4.15 (3.86–4.47) | 4.16 (3.91–4.41) | ||
| tetraconazole | i | 12.52 (7.73–20.29) | 5.40 (4.96–5.88) | i | 1.30 (0.97–1.75) | 3.16 (2.89–3.46) | i | 8.02 (6.26–10.29) | 9.07 (8.29–9.92) | i | i | i | ||
| flutriafol | i | 11.02 (9.69–12.55) | >20 | i | 6.82 (6.26–7.43) | 6.48 (6.16–6.82) | i | 3.19 (2.79–3.64) | 3.38 (3.09–3.70) | i | i | i | ||
| Valinamide carbamates | iprovalicarb | cell wall biosynthesis/ cellulose synthase | i | i | i | i | i | i | i | i | i | i | i | i |
Disclaimer/Publisher’s Note: The statements, opinions and data contained in all publications are solely those of the individual author(s) and contributor(s) and not of MDPI and/or the editor(s). MDPI and/or the editor(s) disclaim responsibility for any injury to people or property resulting from any ideas, methods, instructions or products referred to in the content. |
© 2023 by the authors. Licensee MDPI, Basel, Switzerland. This article is an open access article distributed under the terms and conditions of the Creative Commons Attribution (CC BY) license (https://creativecommons.org/licenses/by/4.0/).
Share and Cite
Serrano, R.; González-Menéndez, V.; Tormo, J.R.; Genilloud, O. Development and Validation of a HTS Platform for the Discovery of New Antifungal Agents against Four Relevant Fungal Phytopathogens. J. Fungi 2023, 9, 883. https://doi.org/10.3390/jof9090883
Serrano R, González-Menéndez V, Tormo JR, Genilloud O. Development and Validation of a HTS Platform for the Discovery of New Antifungal Agents against Four Relevant Fungal Phytopathogens. Journal of Fungi. 2023; 9(9):883. https://doi.org/10.3390/jof9090883
Chicago/Turabian StyleSerrano, Rachel, Víctor González-Menéndez, José R. Tormo, and Olga Genilloud. 2023. "Development and Validation of a HTS Platform for the Discovery of New Antifungal Agents against Four Relevant Fungal Phytopathogens" Journal of Fungi 9, no. 9: 883. https://doi.org/10.3390/jof9090883
APA StyleSerrano, R., González-Menéndez, V., Tormo, J. R., & Genilloud, O. (2023). Development and Validation of a HTS Platform for the Discovery of New Antifungal Agents against Four Relevant Fungal Phytopathogens. Journal of Fungi, 9(9), 883. https://doi.org/10.3390/jof9090883