Article

Fungi under Modified Atmosphere—The Effects of CO2 Stress on Cell Membranes and Description of New Yeast Stenotrophomyces fumitolerans gen. nov., sp. nov.

1
Institute of Nutritional and Food Science, Food Microbiology and Hygiene, University of Bonn, Friedrich-Hirzebruch-Allee 7, 53115 Bonn, Germany
2
Leibniz Institute DSMZ—German Collection of Microorganisms and Cell Cultures, Department of Bioresources for Bioeconomy and Health Research, Inhoffenstraße 7 B, 38124 Braunschweig, Germany
3
Institute of Nutritional and Food Science, Nutritional Physiology, University of Bonn, Nussallee 9, 53115 Bonn, Germany
4
Aerospace Microbiology Research Group, Institute of Aerospace Medicine, German Aerospace Center, 51147 Cologne, Germany
*
Author to whom correspondence should be addressed.
J. Fungi 2023, 9(10), 1031; https://doi.org/10.3390/jof9101031
Submission received: 26 September 2023 / Revised: 12 October 2023 / Accepted: 14 October 2023 / Published: 19 October 2023
(This article belongs to the Section Environmental and Ecological Interactions of Fungi)

Abstract

:
High levels of carbon dioxide are known to inhibit the growth of microorganisms. A total of twenty strains of filamentous fungi and yeasts were isolated from habitats with enriched carbon dioxide concentration. Most strains were derived from modified atmosphere packed (MAP) food products or mofettes and were cultivated under an atmosphere of 20% CO2 and 80% O2. The influence of CO2 on fungal cell membrane fatty acid profiles was examined in this study. Major changes were the increase in linolenic acid (C18:3 cis 9, 12, 15) and, additionally in most strains, linoleic acid (C18:2 cis 9, 12) with a maximum of 24.8%, at the expense of oleic (C18:1 cis 9), palmitic (C16:0), palmitoleic (C16:1 cis 9) and stearic acid (C18:0). The degree of fatty acid unsaturation increased for all of the strains in the study, which consequently led to lower melting temperatures of the cell membranes after incubation with elevated levels of CO2, indicating fluidization of the membrane and a potential membrane malfunction. Growth was reduced in 18 out of 20 strains in laboratory experiments and a change in pigmentation was observed in several strains. Two of the isolated strains, strain WT5 and strain WR1, were found to represent a hitherto undescribed yeast for which the new genus and species Stenotrophomyces fumitolerans (MB# 849906) is proposed.

1. Introduction

Fungi are indispensable in food science and are not only used as edible mushrooms and in the production process of fermented and baked goods, but for the refinement of important consumer goods, such as for the maturation of cheese and dry-cured meat [1]. In the maturation process of food products, they release secondary metabolites, which subsequently impart characteristic aromas or flavours [1]. On the other hand, several species of filamentous fungi and yeasts are relevant as food-spoilage organisms, which can cause off-odour and off-flavour of the product, and in some cases even result in contamination with mycotoxins [2]. Food products, especially those that are nutrient-rich and have high water content, such as meat, are prone to microbial spoilage due to microbial growth and metabolic activity [3]. Fungi commonly found on food include several yeast species and molds of the genera Saccharomyces, Rhodotorula, Aspergillus, Penicillium, Mucor and Rhizopus and are food spoilage organisms in most of the cases [4,5]. Fungi are ubiquitously distributed and occur in large numbers of up to 10,000 spores in 1 m³ of air [6], which indicates the importance of their role not only in terms of food production, food waste and hygiene, but also in biotechnology, human medicine and plant pathology.
For conservation and for the prevention of microbial growth, food products are packed under modified atmospheres (MA), including high amounts of CO2, depending on the product. For raw red meat, gas mixtures of 20–30% CO2 and 70–80% O2 are commonly used, whereas for white non-processed fish gas mixtures of 30% O2, 40% CO2 and 30% N2 are used [7]. In general, the function of carbon dioxide is mainly the inhibition of microbial growth [7,8]. In the case of fungi, it has also been shown that the production of several mycotoxins, including aflatoxins, patulin and roquefortine C, is greatly decreased by high CO2-containing MA [8,9]. Nevertheless, some food spoilage and plant or human pathogenic microorganisms are able to grow under these conditions, including the fungi Mucor plumbeus, Fusarium oxysporum and members of the genus Byssochlamys [8] and the bacteria Brochothrix thermosphacta, Campylobacter jejuni and members of the Lactobacillales [7,10].
Microorganisms, which can tolerate or even require high-CO2 concentrations, are referred to as capnotolerant or capnophilic organisms, respectively. They can be found in anthropogenic CO2-rich environments, such as MAP food products, as well in natural environments, such as mofettes or geysers [11]. The latter result from volcanic activities releasing CO2 to the surface and thereby create natural unique environments with elevated CO2 levels, where even new fungal species have been discovered [12]. Fungal adaptation mechanisms to such an increased presence of the carbon dioxide stressor are expected to be similar for strains from artificial (MAP) and natural habitats (mofettes), which can only be evaluated through comparison analysis. Not much is known about the cell effect of elevated CO2 concentrations on microorganisms, but it has been suggested to be a complex interaction of several reactions leading to growth reduction of the organisms or even bactericidal and sporicidal effects [13]. Due to its unique property of being lipo- and hydrophilic, carbon dioxide can dissolve in the phospholipid bilayer of the membrane of cells and is supposed to cause the so-called ‘anesthesia effect’, a loss of order by the incorporation of foreign molecules [14].
The lipids of the phospholipid bilayers of fungi include fatty acids, phospholipids, sterols, oxylipins, sphingolipids and glycolipids [15]. In fungi, the most abundant fatty acids in membrane phospholipids, as well as storage triacylglycerols, are palmitic (C16:0) and stearic (C18:0) acids, as well as their unsaturated derivatives palmitoleic (C16:1 cis 9), oleic (C18:1 cis 9), linoleic (C18:2 cis 9, 12) and alpha- or gamma-linolenic (C18:3 cis 9, 12, 15 or C18:3 cis 6, 9, 12) acids [16,17,18]. Polar lipids are therefore an essential part of membranes and fungal polar lipids can account for up to 85% of the total lipid content [16]. The main fungal lipids are phospholipids such as phosphatidylcholine and phosphatidylethanolamine, but also phosphatidylserine, phosphatidylinositol, phosphatidylglycerol and diphosphatidylglycerol, as well as glycolipids [19]. Slightly elevated concentrations of about 560 ppm CO2 (instead of the ambient atmospheric 360 ppm of that time) have been shown to stimulate fungal activity and increase the total biomass [20]. In other studies, slightly increased CO2 levels have led to increased extracellular enzymatic activities and stimulated microbial respiration [21].
In this work, the effect of high CO2-containing MA on several fungal isolates and their membranes was examined. The strains were mainly isolated from MAP food and mofettes and identified based on marker gene sequencing. The strains were furthermore analyzed regarding their fatty acid profile changes towards CO2 and temperature stress. The study also resulted in the isolation of a novel yeast species, which was characterized and formally described in this study.

2. Materials and Methods

2.1. Isolation and Ecology

The majority of the organisms used in this study were isolated from food packed under CO2-enriched atmospheres. Oxygen and carbon dioxide concentrations were measured using an Oxybaby M+ O2/CO2 gas analyzer (WITT-Gasetechnik, Witten, Germany). For the isolation of strains, 10 g of each product were taken and diluted with Ringer’s solution (Merck, Darmstadt, Germany) to a total weight of 100 g. The sample was then homogenized for 60 s and a ten-fold dilution series was prepared. The suspension (0.1 mL) of an appropriate dilution was plated on YMG agar with penicillin and streptomycin (5.0 g glucose, 2.0 g yeast extract, 5.0 g malt extract, 10 g bacteriological agar, 0.04 g penicillin G potassium salt, 0.03 g streptomycin sulfate, ad 500 mL distilled H2O) and incubated at 25 °C. After 4 d, the isolates were picked from the plates.
All strains used in this study are listed in Table 1. Yeast strains WR1, WT2, WT5, WT6 and WT7 were recovered from a vegetarian wrap packed under MA, with remaining oxygen and carbon dioxide concentrations of 0.3% and 28.4%, respectively. Yeast strain HT4 and filamentous fungus strain HR2 were isolated from MAP minced meat, with a remaining atmosphere of 59.4% O2 and 28.0% CO2. Yeast strain LR1 and mold strain LT1 were recovered from MAP salmon, with a remaining atmosphere of 0% O2 and 21.1% CO2. The filamentous fungus strain KR3 was recovered from MAP coffee powder, with a remaining atmosphere of 0.8% O2 and 81.2% CO2.
In search of natural environments with elevated CO2 levels, water samples were taken from mofettes, located at lake Laacher See, Germany (coordinates: 50°24′51.3″ N, 7°17′08.9″ E). A ten-fold dilution series was prepared and YMG agar was inoculated with the suspension (0.1 mL) of an appropriate dilution and incubated at 10 °C and 25 °C to isolate mesophilic fungi that grow at colder and ambient temperatures. Colonies were picked after 4 d of incubation. Yeast strains M3 and M12, as well as filamentous fungi M1, M2, M4 and M6, were isolated from this source and analyzed in this study.
Strains Penicillium rubens IF2SW-F4 and Penicillium rubens DSM 1075 were taken from the culture collection of the Aerospace Microbiology Research Group, German Aerospace Center (DLR). Strain IF2SW-F4 was originally isolated from a surface inside the International Space Station (ISS) during the NASA JPL Microbial Tracking studies [23]. DSM 1075, the corresponding type strain, was used as a reference in this study. CO2 levels on the ISS can be more than 20 times higher than in the earth’s atmosphere (0.03% at the time of publication), ranging from 0.3 to 0.7% [24]. For humans, these conditions can already have a medical impact in terms of increasingly reported headaches [25].
Filamentous fungi strains TS1 and TS2 were airborne and isolated from TSA (tryptic soy agar; Merck, Germany) and were included as reference strains from environments with non-elevated CO2 concentrations.
All strains listed above are yeasts and filamentous ascomycetes. Other taxa were not isolated from these samples.

2.2. Cultivation and Modified Atmosphere Packaging of Strains

Spore suspensions of all strains listed above were stored at −80 °C using Cryobank (Mast Group, Bootle, UK). For all subsequent experiments, the fungi were cultivated on YE agar (10.0 g glucose, 2.5 g yeast extract, 10 g bacteriological agar, 500 mL distilled H2O) or broth. All strains tested positive for growth at temperatures of 10 and 25 °C.
Growth under MA was assessed by placing inoculated YE agar Petri dishes or 50 mL inoculated YE broth in tissue culture flasks (Sarstedt, Nümbrecht Germany) in a polypropylene tray (ES-Plastic, Hutthurm, Germany), which was sealed with polyethylene foil (Südpack, Ochsenhausen, Germany) by a Multivac T200 traysealer (Multivac, Wolfertschwenden, Germany). A common gas composition for meat products, consisting of 80% O2 and 20% CO2, was used for all strains. The trays were incubated at 10 °C, to simulate the conditions of food storage, for the time span of four weeks, after which the growth was visually evaluated, and by measuring the optical density or glucose concentration in the media. In case the growth of each strain was sufficient (utilization of the glucose or an optical density above 0.1), biological triplicates were incubated under MAP for all subsequent experiments on agar for 14 days (yeasts) and in broth (filamentous fungi) until the remaining glucose concentration was approximately 25 mg/L (filamentous fungi). Concerning the yeasts, controls exposed to normal atmosphere and MAP samples were incubated at 10 °C for 14 days and at 25 °C for 3 days in order to distinguish CO2-induced effects on the membrane from temperature-related effects. In contrast, controls and MAP samples of the filamentous fungi were incubated at 10 °C, as well as samples at an elevated temperature of 25 °C and were harvested at growth phases as similar as possible by harvesting at 25 mg/L glucose. The gas compositions were immediately measured before harvesting. Trays with non-inoculated YE and trays without plates were also packed under MAP and incubated like the samples in order to determine how the gas composition differs due to CO2 diffusing into the agar and other factors changing the gas composition. The pH values of non-inoculated agar stored under MAP and the controls were measured after incubation.

2.3. Phylogenetic Analyses

The genomic DNA of the strains was extracted with a Qiagen DNeasy Blood and Tissue Kit (Qiagen, Hilden, Germany) and the supplementary protocol for yeasts using the enzyme lyticase or using a MasterPure Yeast DNA Purification kit (Lucigen, Biosearch Technologies, Hoddesdon, UK). The extraction was performed according to the instructions in the protocols, with an incubation time of 90 min after adding proteinase K using the Qiagen DNeasy Blood and Tissue Kit.
For the amplification of the 28S rRNA gene region or ITS region, the primer sets used were NL-1F (5′-GCATATCAATAAGCGGAGGAAAAG-3′) and NL-4R (5′-GGTCCGTGTTTCAAGACGG-3′) [26] for the sequencing of the D1/D2 region at the 5′ end of the large subunit 28S rRNA gene and ITS-1 (5′-TCCGTAGGTGAACCTGCGG-3′) and ITS-4 (5′-TCCTCCGCTTATTGATATGC-3′) for sequencing of the ITS region [27]. The PCR conditions were as follows: initial denaturation at 94 °C for 2 min; 36 cycles of denaturation at 94 °C for 0.5 min, annealing at 52 °C for 1 min, elongation at 72 °C for 1 min; final extension at 72 °C for 10 min, followed by a cooling phase at 4 °C for the 28S rRNA gene sequence and initial denaturation at 95 °C for 2 min; 35 cycles of denaturation at 95 °C for 0.3 min, annealing at 52 °C for 0.5 min, elongation at 72 °C for 1.5 min; final extension at 72 °C for 10 min, followed by a cooling phase at 4 °C for the ITS gene sequence. The PCR products were Sanger sequenced by Seqlab (Göttingen, Germany). Sequences were manually checked and edited with Chromas software (Version 2.6.6, Technelysium, South Brisbane, Australia). Partial sequences of other genes, namely ribosomal 18S (SSU) rRNA, TEF1 (translation EF-1KA nucleotide sequence) and RPB2 (RNA polymerase II subunit nucleotide sequence), were used for phylogenetic analyses of strain WT5. Amplification and sequencing of the 18S rRNA, RPB2 and TEF1 genes were performed with the following primer pairs: NS1 and NS8, RPB2-7cR and RPB2-5F, YTEF-1G and YTEF-6G, respectively [28,29,30,31]. Nucleotide sequences were assembled with Sequencher software (Version 5.4.6, GeneCodes Inc., Ann Arbor, MI, USA).
The gene sequences were compared with publicly available sequences from GenBank using BLAST version 2.12.0 (Basic local alignment search tool, National Centre for Biotechnological Information, Bethesda, MD, USA; [32]) and the MycoID (www.mycobank.org, accessed on 26 September 2023) database. Models and environmental samples were excluded in the search. The results of the sequencing and BLAST search are shown in Table 1.
For strain WT5, nucleotide sequence alignments were aligned in the dataset previously used by Kachalkin et al. [33] in the description and placement of Zygotorulaspora dagestanica using the online version of the MAFFT algorithm [34]. Phylogenetic relationships in the concatenated alignment of the five loci were inferred by the Maximum-Likelihood (ML) method with RAxML GUI 2.0 [35] with 100 thorough bootstrap replicates. A model test tool implemented in the software was used to determine the best substitution model for each partition, the general time reversible model GTR + G + I (SSU and LSU), the Kimura model K80 + G (5.8S rRNA gene) and transition models TIM2 (RPB2) and TIM3 (TEF1). Single-gene best ML trees were combined into a single file and analyzed with Splitstree 4.10 [36] using the ConsensusNetwork (threshold 0.1; edges weight sum of nodes) algorithm. The approach has been previously used to visualize and delimit closely related species in the Papiliotrema flavescens species complex [37] and species in the family Saccharomycetaceae [38]. The dataset for the multigene phylogenetic tree consisted of 48 taxa and that for the phylogenetic network was reduced to 46 taxa for the phylogenetic tree analysis to include taxa for which all sequences of the five gene regions were available. The alignment included representatives of the family Saccharomycetaceae, the WGD clade (the clade characterized by the whole-genome duplication) in the whole-genome analysis of ascomycetous yeasts by Shen et al. [39], as well as outgroup taxa from the families Debaryomycetaceae, Phaffomycetaceae and Pichiaceae. The resulting alignment consisted of 3597 characters: 1654 in the nearly complete 18S rRNA gene (SSU), 584 in D1/D2 domains of the 26S/28S rRNA gene (LSU), 160 in 5.8S rRNA gene, 448 in TEF1 and 751 in RPB2.

2.4. Fatty Acid Analysis

For the analysis of fungal fatty acids, the samples were prepared in the form of fatty acid methyl esters [40] from 40 mg of yeast cell material grown on agar plates or from 20 mg of lyophilized fungal cell material. The methyl esters were chromatographically separated via the GC-MSD system 8890 (Agilent Technologies, Santa Clara, CA, USA) with a 5% phenyl methyl silicone capillary column (0.25 mm by 30 m) and identified as previously described [41]. Samples that contained both the oleic (C18:1 cis 9) and linolenic acid (C18:3 cis 9, 12, 15) were additionally analyzed using a GC 2010 plus system (Shimadzu, Duisburg, Germany) with a flame ionization detector [42] and a Phenomenex ZX-WaxPlus column (0.25 mm by 30 m) to discriminate these two compounds. After relatively quantifying the samples, the degree of unsaturation (DU) within the fatty acid profiles was calculated using Formula 1. The analyzed fatty acids include data sets from growth at 10 °C with MAP treatment (20% CO2, 80% O2), controls with growth at 10 °C without MA and growth at 25 °C in regular atmosphere. All fatty acid profiles are listed in Table 2 (yeasts) and Table 3 (filamentous fungi), alongside the calculated average melting temperature (WAMT) of each organisms’ fatty acid profile and the DU. WAMT values were calculated according to Seel (2018) [43].
Formula (1): Formula for calculating the degree of unsaturation (DU) within the extracted fatty acids extracted from the fungal strains.
D U = 1 × % m o n o e n e s 100 + 2 × % d i e n e s 100 + 3 × % t r i e n e s 100

2.5. Physiology and Chemotaxonomy of Strains WT5 and WR1

Growth tests for strains WT5 and WR1 were performed in liquid media according to the methods described by Kurtzman et al. [44]. A Microscope Nikon ECLIPSE Ni-E equipped with phase-contrast and digital interference optics and a digital camera DS-Ri2 were used for microscopy. Polar lipid patterns of membrane lipids were extracted and analyzed for the strains WT5 and WR1 using two-dimensional thin-layer chromatography, as described previously [45]. For polar lipid extraction, the yeasts were cultivated in YE broth until the solution reached an optical density of 1.0 ± 0.2 at 625 nm. Furthermore, the fatty acids of the two yeast strains were extracted and analyzed as described above. The results are displayed in Table 2.

3. Results

3.1. Growth Assessment

The growth of all strains used in this study decreased under MAP, except for the two yeast strains Candida sake HT4 and P. fermentans WT2, which grew as well as in the control cultures under normal atmosphere. A general observation in light of consistency was that the yeast appearance on the CO2-incubated plates was generally more mucous than that of the controls. The mycelial clumps in liquid culture were observed to be smaller and denser under MA in most of the cases. Furthermore, in terms of pigmentation, differences were noticed between cultures grown under elevated CO2 concentrations and controls. Untypical orange to pink pigmentation was observed in the CO2 samples of C. sake HT4, P. fermentans WT2, strains WT5 and WR1, as well as Candida oleophila WT7, while the controls were generally white to beige in color. In filamentous fungi, the most apparent pigmentation change was noted in P. rubens DSM 1075, which developed a pink color under CO2 (from originally white), and Penicillium griseofulvum HR2, P. rubens IF2SW-F4, Penicillium tardochrysogenum TS1 and Penicillium griseofulvum TS2, which equally changed from a white and beige to a yellowish to orange color. The formation of exudates, which has been observed in P. rubens IF2SW-F4, P. griseofulvum HR2 and especially P. glandicola M6 under normal atmospheres on solid medium, was strongly reduced under elevated CO2 conditions.
The pH value of the agar was lowered due to carbonic acid formation after MAP, leading to a decrease from 7.0 ± 0.1 under normal atmosphere at 10 °C to a pH of 6.1 ± 0.1 under increased CO2 levels.

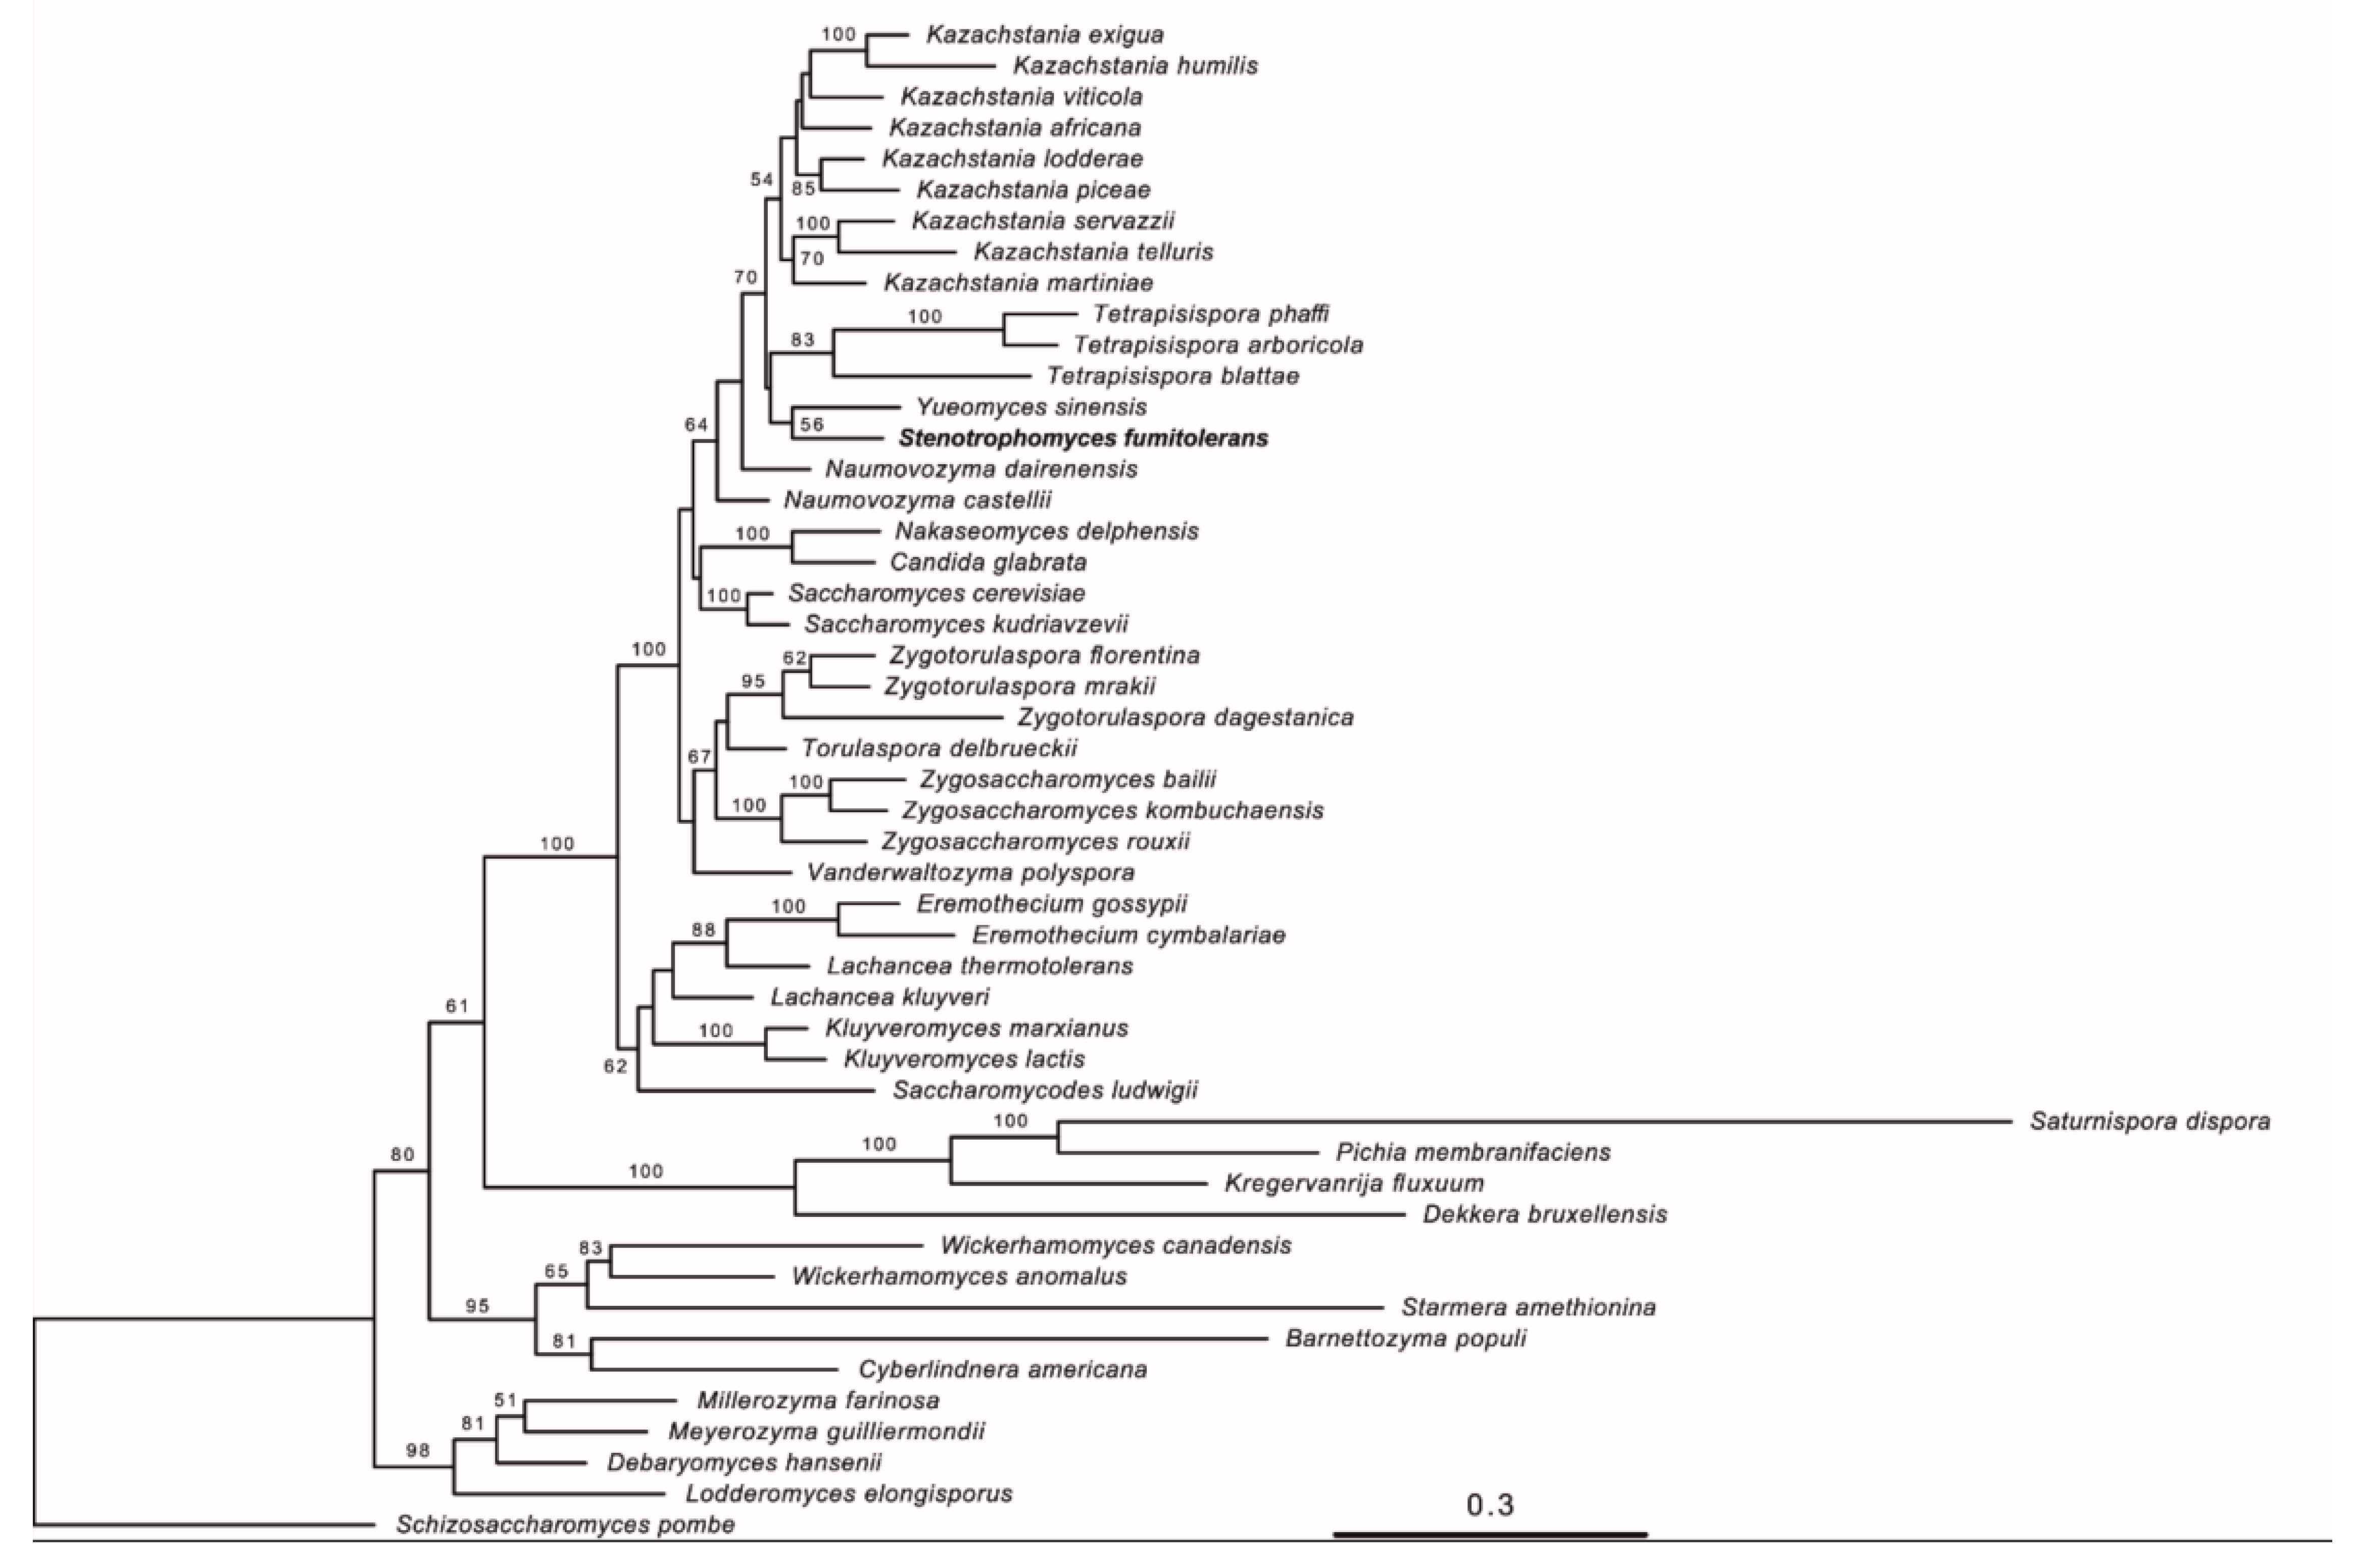
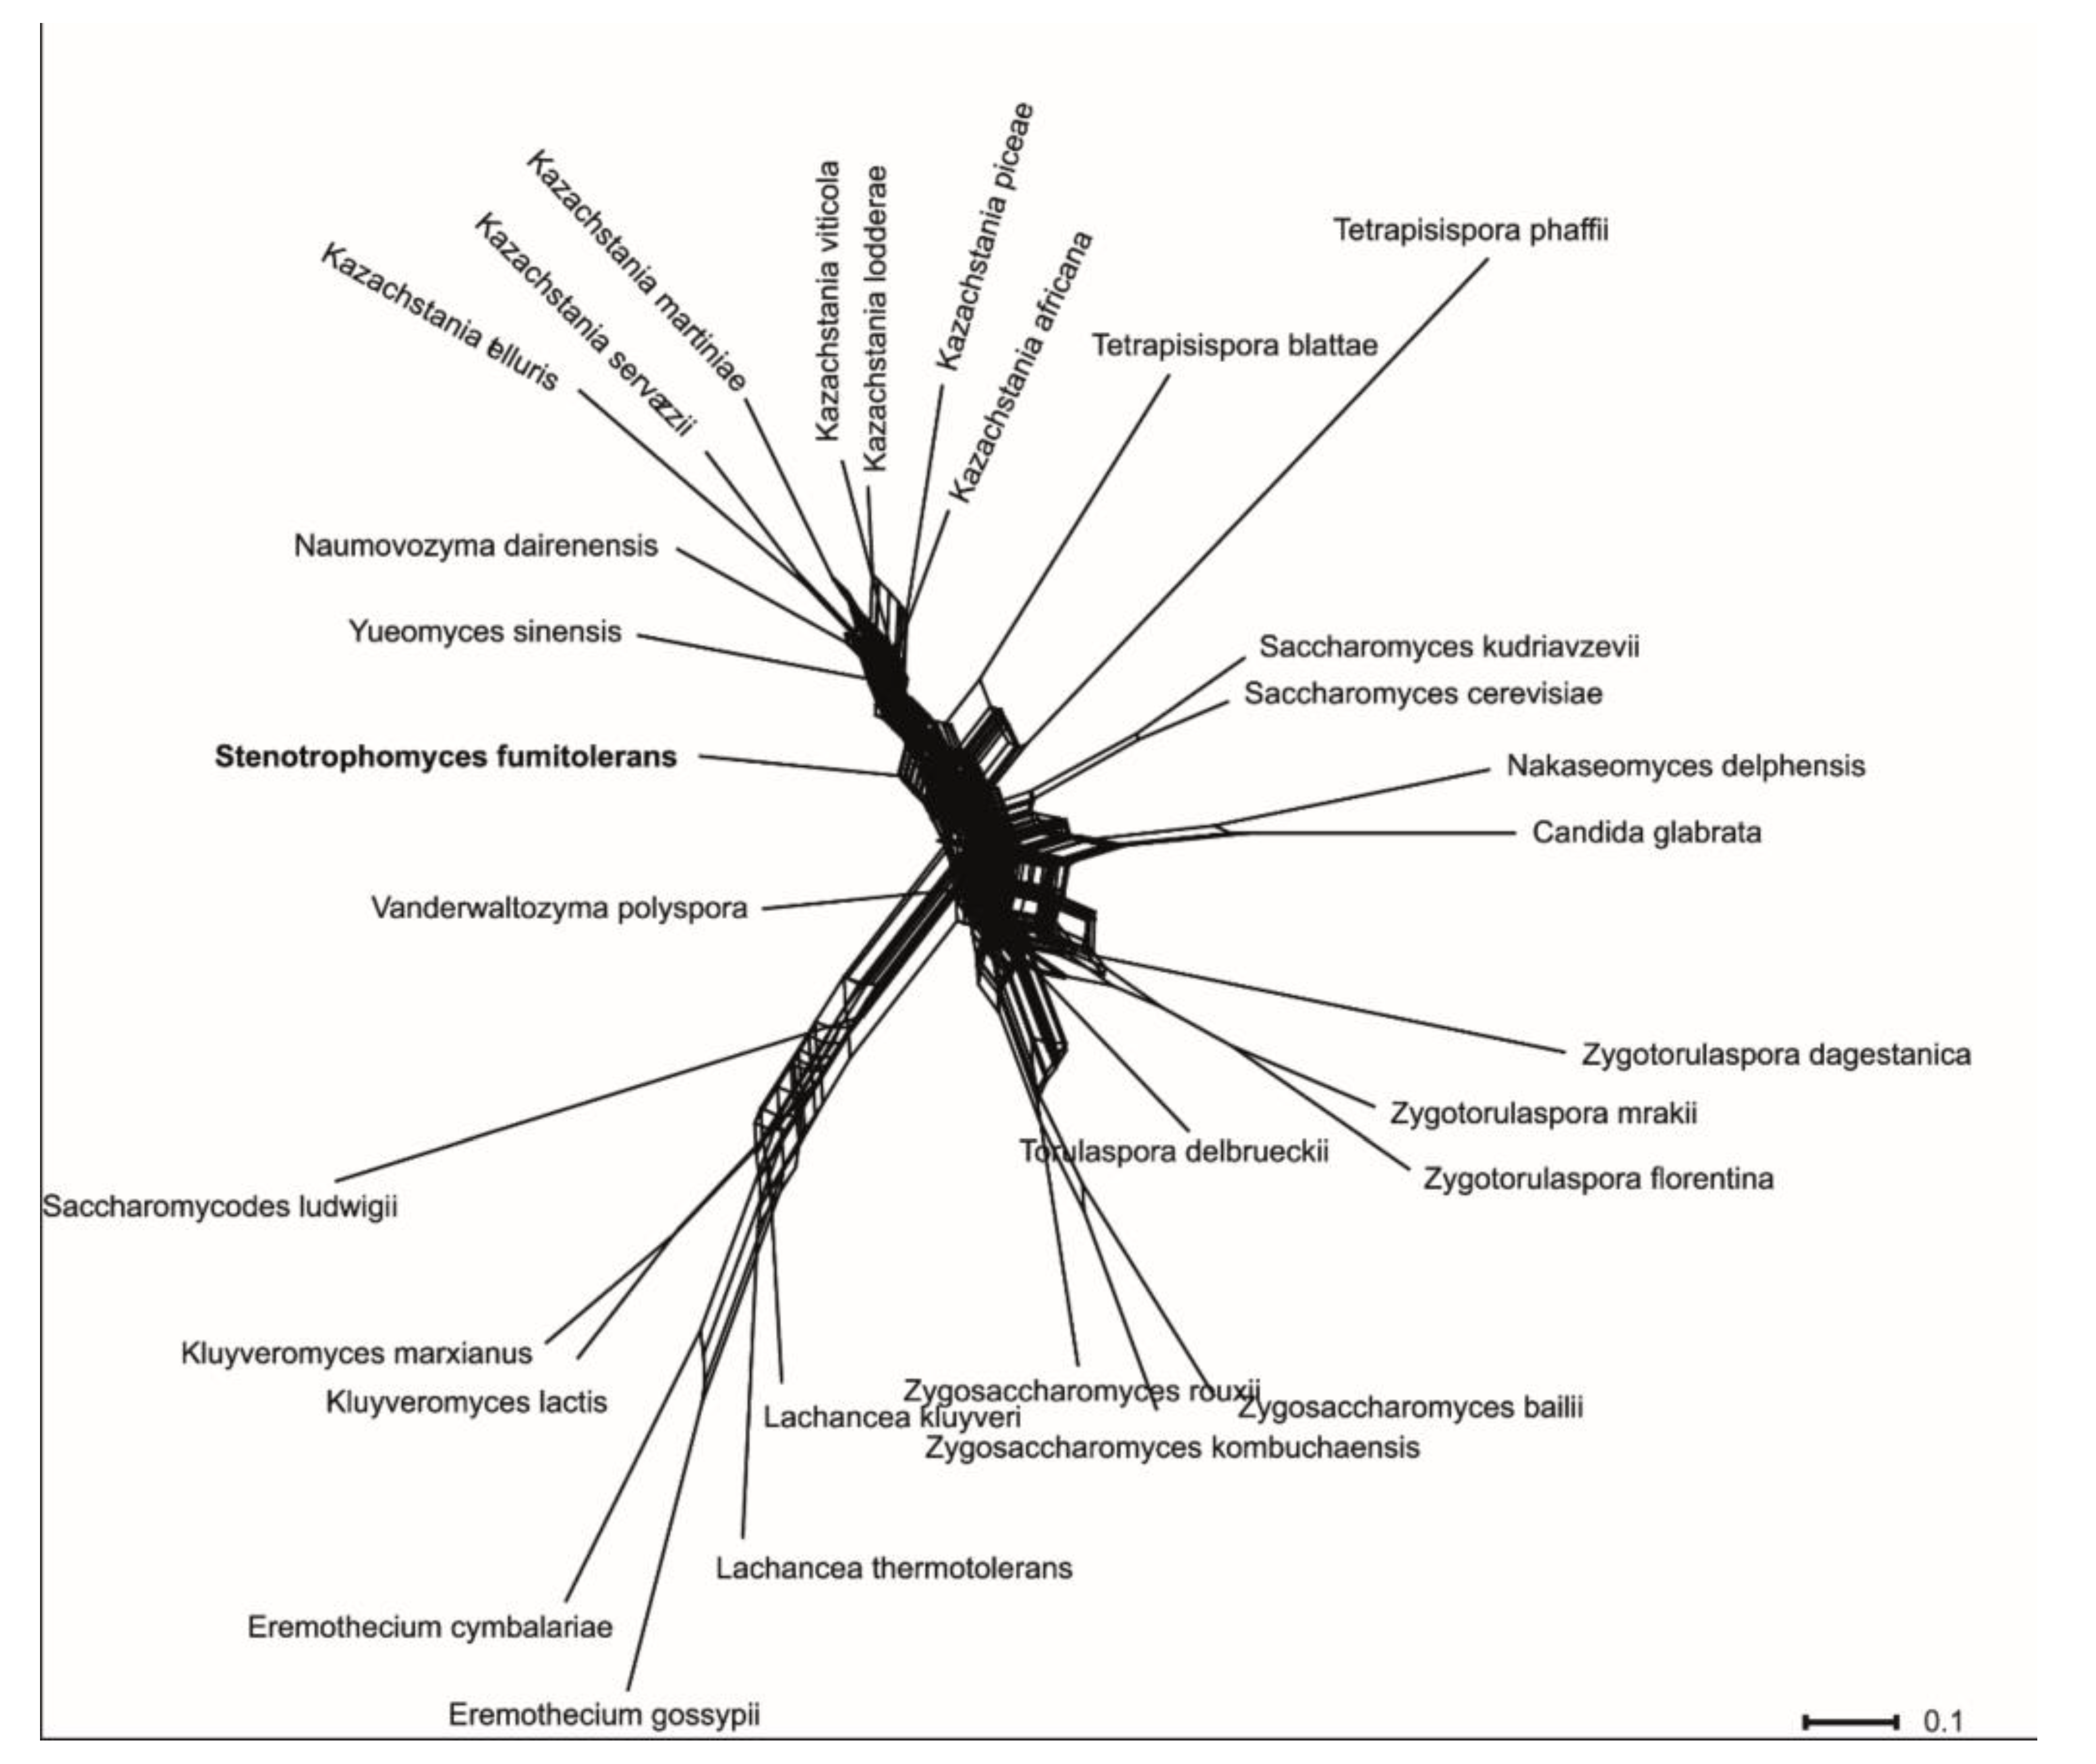
3.2. Phylogenetic Analyses

The multi-locus phylogenetic analysis located the yeast strain WT5 in a well-supported (bootstrap value of 100% for the ML tree) clade composed of genera Kazachstania, Naumovozyma, Saccharomyces, Nakaseomyces, Yueomyces, Tetrapisispora, Torulaspora, Zygotorulaspora, Zygosaccharomyces and Vanderwaltozyma (Figure 1). The sub-clade containing genera Kazachstania, Yueomyces, Tetrapisispora and the novel yeast received moderate (bootstrap value of 70% for the ML tree) support in the analysis. The phylogenetic analysis was consistent with previous analyses by Kachalkin et al. [33] and Shen et al. [39]. The potential new yeast species was placed in the phylogenetic tree close to the genera Tetrapisispora and Yueomyces, although the support for the placement was weak (Figure 1). The main clade of the genus Tetrapisispora received very good (ML: 100%) support and Tetrapisispora blattae clustered as the next species with good (ML: 83%) support. The phylogenomic analysis by Shen et al. [39] demonstrated the polyphyly of the genus Tetrapisispora and the placement of the species Tetrapisispora blattae close to Yueomyces sinensis. In the same analysis, Vanderwaltozyma polyspora was clustered with other Tetrapisispora species.
The network analyses revealed a complex structure of the clade and showed discrepancies between single-gene datasets (Figure 2). In agreement with previous results, the genus Kazachstania displayed high genetic heterogeneity and shared ancestry with Naumovozyma (see also [39]). Compared to other genera, Tetrapisispora blattae was rather distant from the type species of the genus Tetrapisispora phaffii, corroborating the results of the previous phylogenomic study [39]. The strain WT5 was placed in the network between Yueomyces sinensis and Vanderwaltozyma polyspora. Taking into consideration relative position and distances between taxa in the phylogenetic tree and network analyses and the phylogenomic analysis of Shen et al. [39], it is very unlikely that the novel yeast species will build a good phylogenetic cluster either with Tetrapisispora phaffii, Tetrapisispora blattae, Yueomyces sinensis or Vanderwaltozyma polyspora. The new yeast is as distant from the aforementioned taxa as the members of different genera comprising the WGD clade [39].

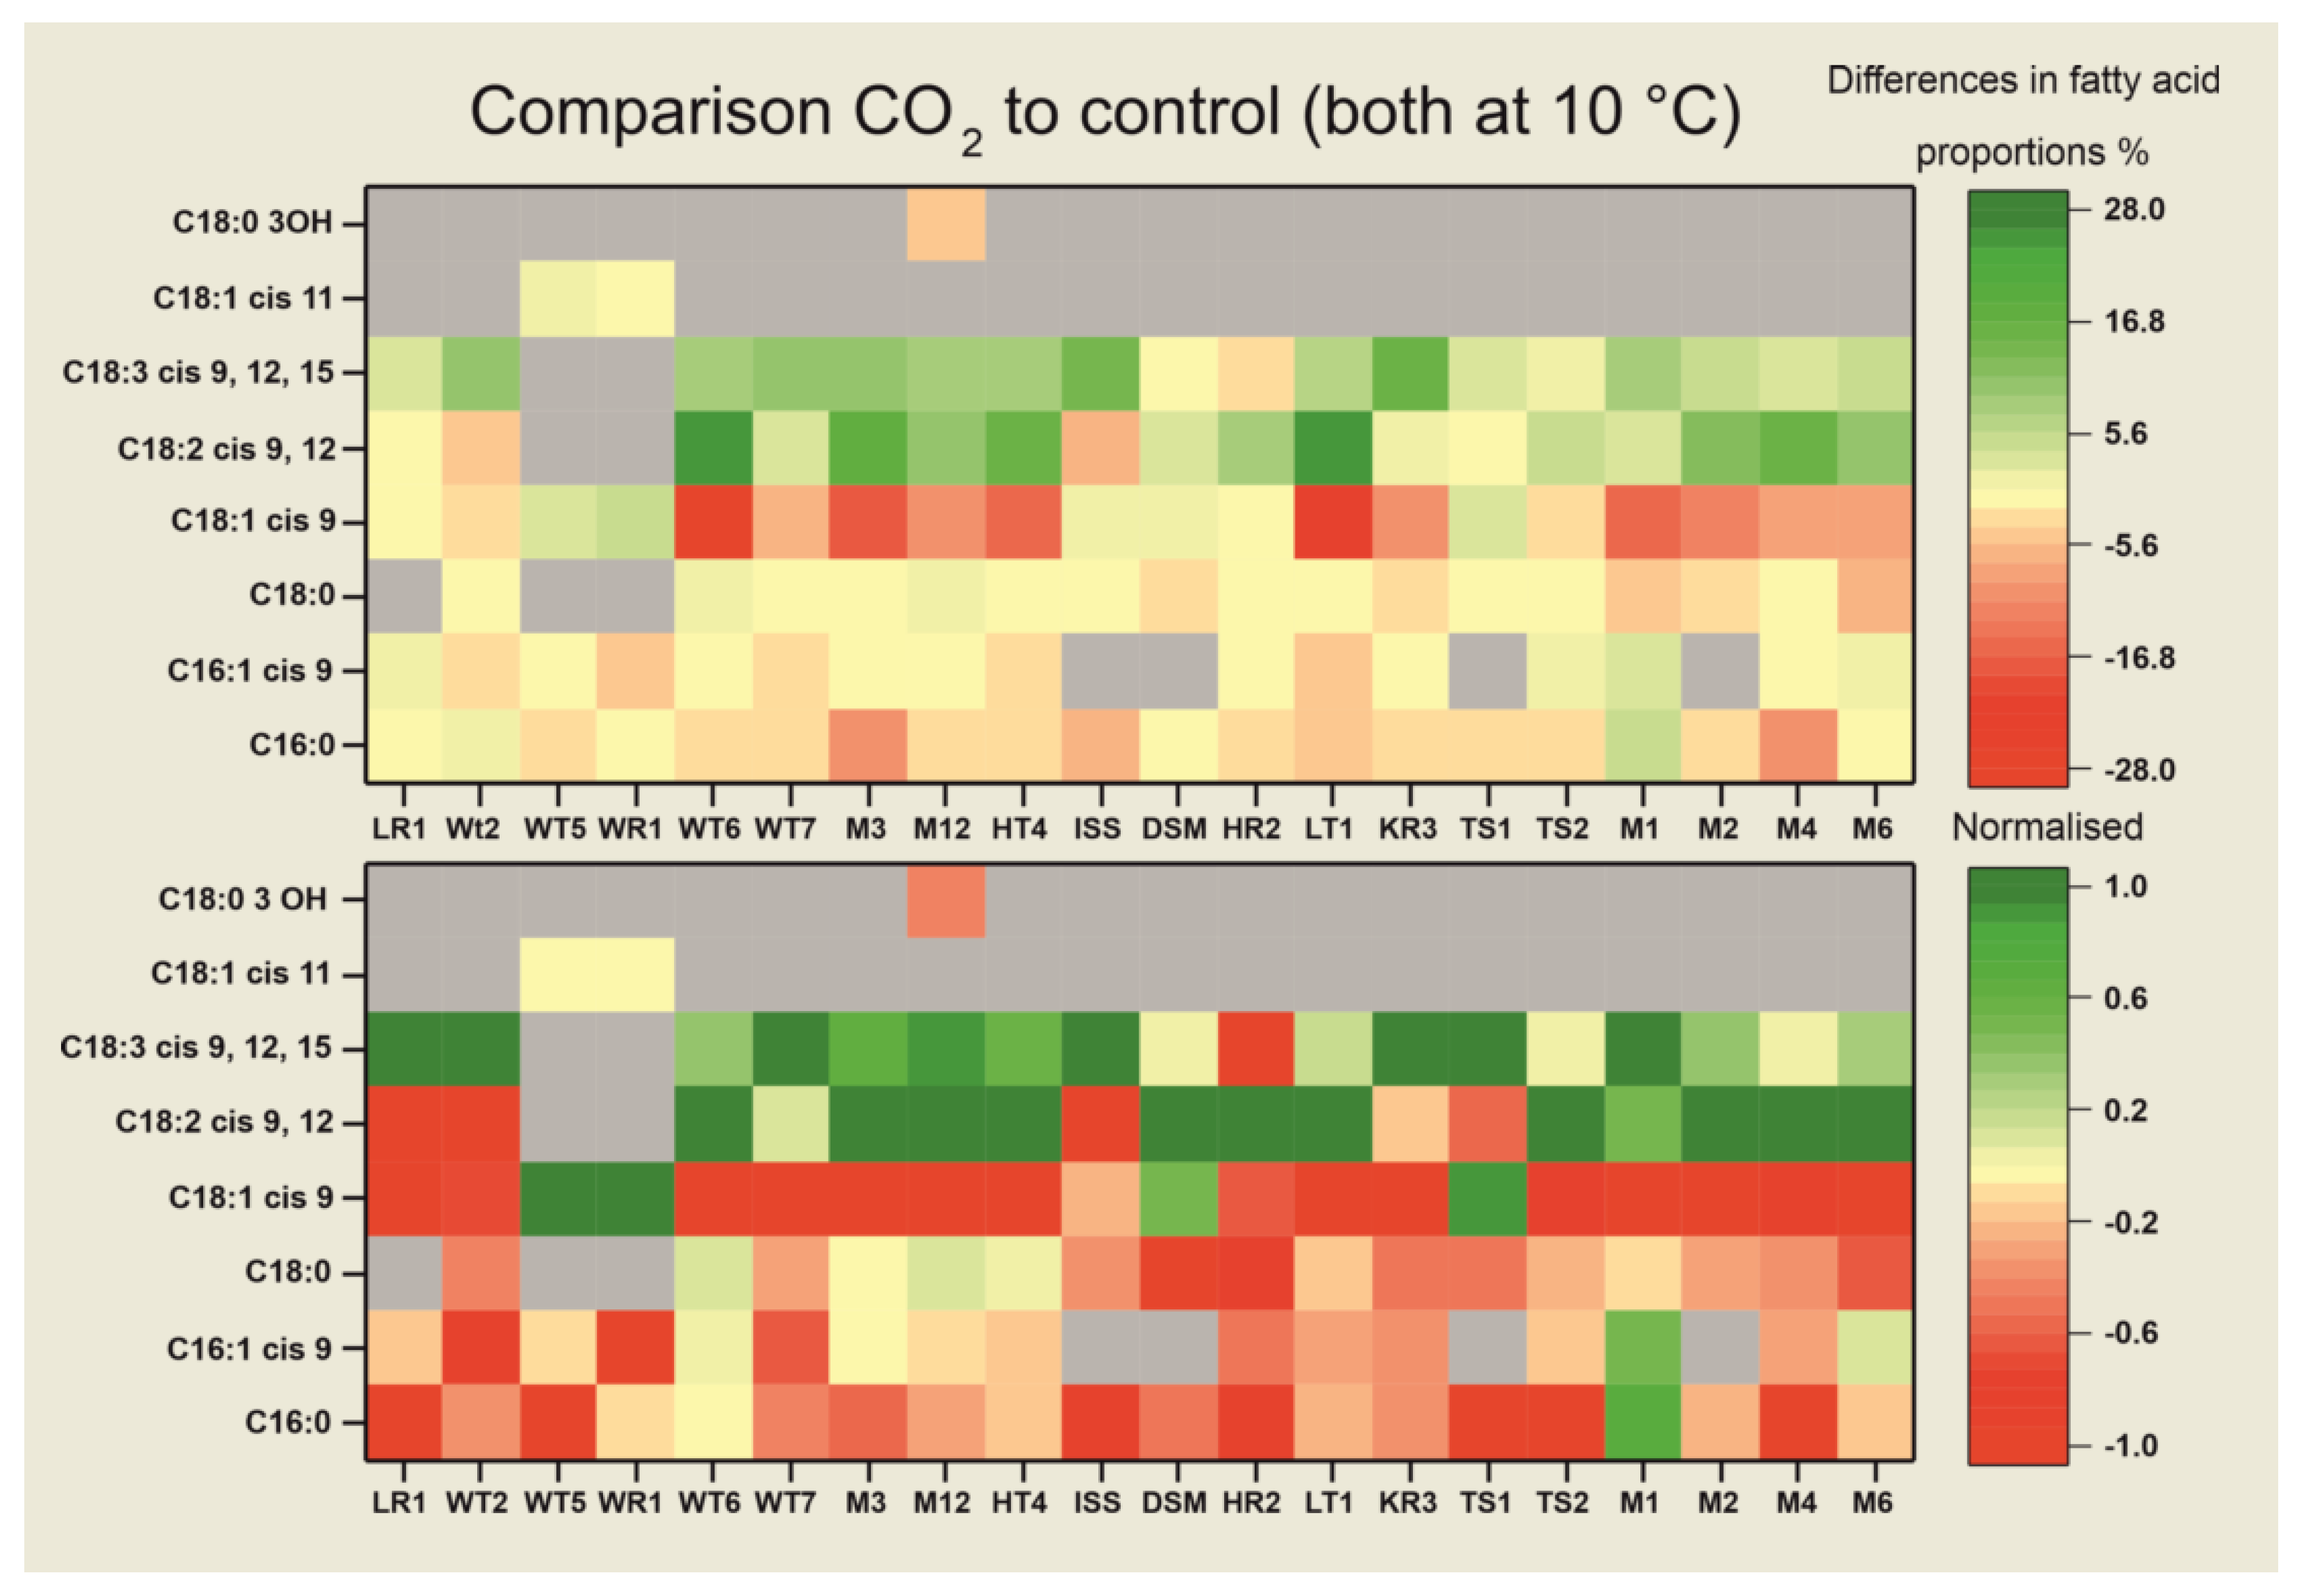
3.3. Fatty Acid Compositions

The fatty acid composition of the fungi analyzed in this work mainly consisted of palmitic and stearic acids, as well as their unsaturated derivatives. Stenotrophomyces fumitolerans WT5 and WR1 both lacked polyunsaturated linoleic and linolenic acids. R. oryzae M1 was the only species with γ- instead of α-linolenic acid, which has been reported to be a characteristic of Zygomycetes [46]. Figure 3 displays the differences between the MAP-treated samples and the controls (at 10 °C, with natural atmospheric composition) as a heatmap. The WAMT values of the CO2-treated samples were lower in comparison to the controls in every case–except for S. fumitolerans WR1–meaning that the organisms increasingly synthesize fatty acids with lower melting temperatures, which fluidizes the membranes. This is mainly due to the elevated DU, which was increased for all samples treated with increased CO2 levels. The effect of carbon dioxide on the WAMT values and the DU was much higher than the effect from the temperature shift from 25 to 10 °C.
As can be seen in the upper graph of Figure 3, Apiotrichum gracile WT6, Didymella corylicola LT1, Rhodotorula alborubescens M3 and C. sake HT4 show the strongest adaptation to CO2-enriched atmosphere at 10 °C incubation temperature in terms of changed fatty acid incorporation. Changes in the WAMT values and proportions of fatty acids are displayed in Table 2 and Table 3. The organisms Candida zeylanoides LR1, P. rubens DSM 1075 and S. fumitolerans WR1, on the other hand, do not show any significant changes (p > 0.05). Moreover, S. fumitolerans WT5, P. tardochrysogenum TS1 and P. griseofulvum TS2 only have one significant change (p < 0.05), namely a slightly decreased proportion of C16:0 under increased CO2 concentrations. In the lower graph, displaying the normalized values, it is noticeable that under CO2 the proportion of C18:3 cis 9, 12, 15 (or C18:3 cis 6, 9, 12 in the case of R. oryzae M1) is increased in almost all species or remains the same, whereas it is only decreased in P. griseofulvum HR2. The same applies for C18:2 cis 9, 12, which is increased in most species, but decreased in C. zeylanoides LR1, P. fermentans WT2, P. rubens IF2SW-F4, N. tetraspora KR3 and P. tardochrysogenum TS1. Furthermore, most species have a decreased content of C18:1 cis 9 under elevated CO2 levels, except for S. fumitolerans WT5 and WR1, where it increased as the only unsaturated fatty acid present, which was also observed for P. rubens DSM1075 and P. tardochrysogenum TS1. The contents of C16:0, C16:1 cis 9 and C18:0 remained the same or were reduced under CO2, except for R. oryzae M1, where C16:0 and C16:1 cis 9 increased under CO2.
As for the changes in fatty acids after incubation at increased temperatures of 25 °C, the total DU is lower, compared to the strains cultivated at 10 °C with carbon dioxide treatment and to the controls. This consequently led to an elevated WAMT value for those samples (Table 2 and Table 3). The most significant changes occur in A. gracile WT6, P. rubens DSM1075, P. glandicola M6, Alternaria sp. M4 and D. prosopidis LT1. The main differences between the fatty acids of fungi grown at 10 °C and at 25 °C are the decrease in linolenic acid and the increase in linoleic acid at 25 °C. Moreover, the content of the palmitoleic acid is decreased, particularly in yeasts. The contents of oleic and palmitic acid, on the other hand, are highest at the elevated temperature and lowest at CO2 treatment.

3.4. Taxonomy of Novel Yeast Species

The sequence analyses of strains WT5 and WR1 revealed that these strains represent a new species. Physiologically, the new yeast species is characterized by a narrow spectrum of utilized carbon and nitrogen compounds and shares this similarity with members of the genus Tetrapisispora and Yueomyces, with Yueomyces sinensis being the only known species of the genus. The new species ferments and assimilates glucose and galactose, and can additionally grow on trehalose (and also ferments it) and glycerol, which makes it a potential food spoilage microorganism. The new yeast shares these physiological properties with Tetrapisispora namnaonensis and differs from this species in the ability to grow in the presence of 50% glucose (negative for T. namnaonensis) and 10% NaCl (negative for strains WT5 and WR1). The yeast is homothallic and produces unconjugated autogamic or pedogamic persistent asci; it does not produce true hyphae. The neighboring genera Tetrapisispora, Yueomyces and Vanderwaltozyma are characterized by a remarkable diversity of morphological features of sexual reproduction (the formation of asci and ascospore numbers). Neither growth characteristics nor sexual reproduction can be used to convincingly support the placement of this yeast in either of these genera. Taking into account the position of the new yeast in multi-locus phylogenetic analyses, the physiological profile and culture characteristics, we decided to propose a new genus for these yeast strains rather than to place them in any of the already existing genera. We advocate that it is better to propose a new genus to accommodate this single-species lineage than to substantially increase phylogenetic heterogeneity of the neighboring genera, be that Tetrapisispora, Yueomyces or Vanderwaltozyma.
The polar lipid pattern consisted of phosphatidylethanolamine, dimethyl-phosphatidylethanolamine, phosphatidylcholine and phosphatidylinositol. The fatty acid profiles of strains WT5 and WR1 were similar under all conditions, including MAP treatment and different incubation temperatures. At 25 °C, the main fatty acids of these organisms consisted of C16:1 cis 9 (65.5 to 66.4%), C18:1 cis 9 (17.2 to 18.2%) and C16:0 (9.3 to 10.5%). At 10 °C the amount of C16:1 cis 9 was increased to 74.5 to 79.7%, whereas both C18:1 fatty acids were lowered. Exposition to elevated amounts of CO2 did not have a strong effect on the fatty acid profile in contrast to the temperature change. Polyunsaturated fatty acids were missing, which was only described for a few other members of the family Saccharomycetaceae, such as Saccharomyces cerevisiae [47], as well as for other yeast genera such as Hanseniaspora and Schizosaccharomyces [48].
The strains WT5 and WR1 were deposited at the DSMZ (Deutsche Sammlung von Mikroorganismen und Zellkulturen) under the strain numbers DSM 113852 and DSM 113853, respectively.

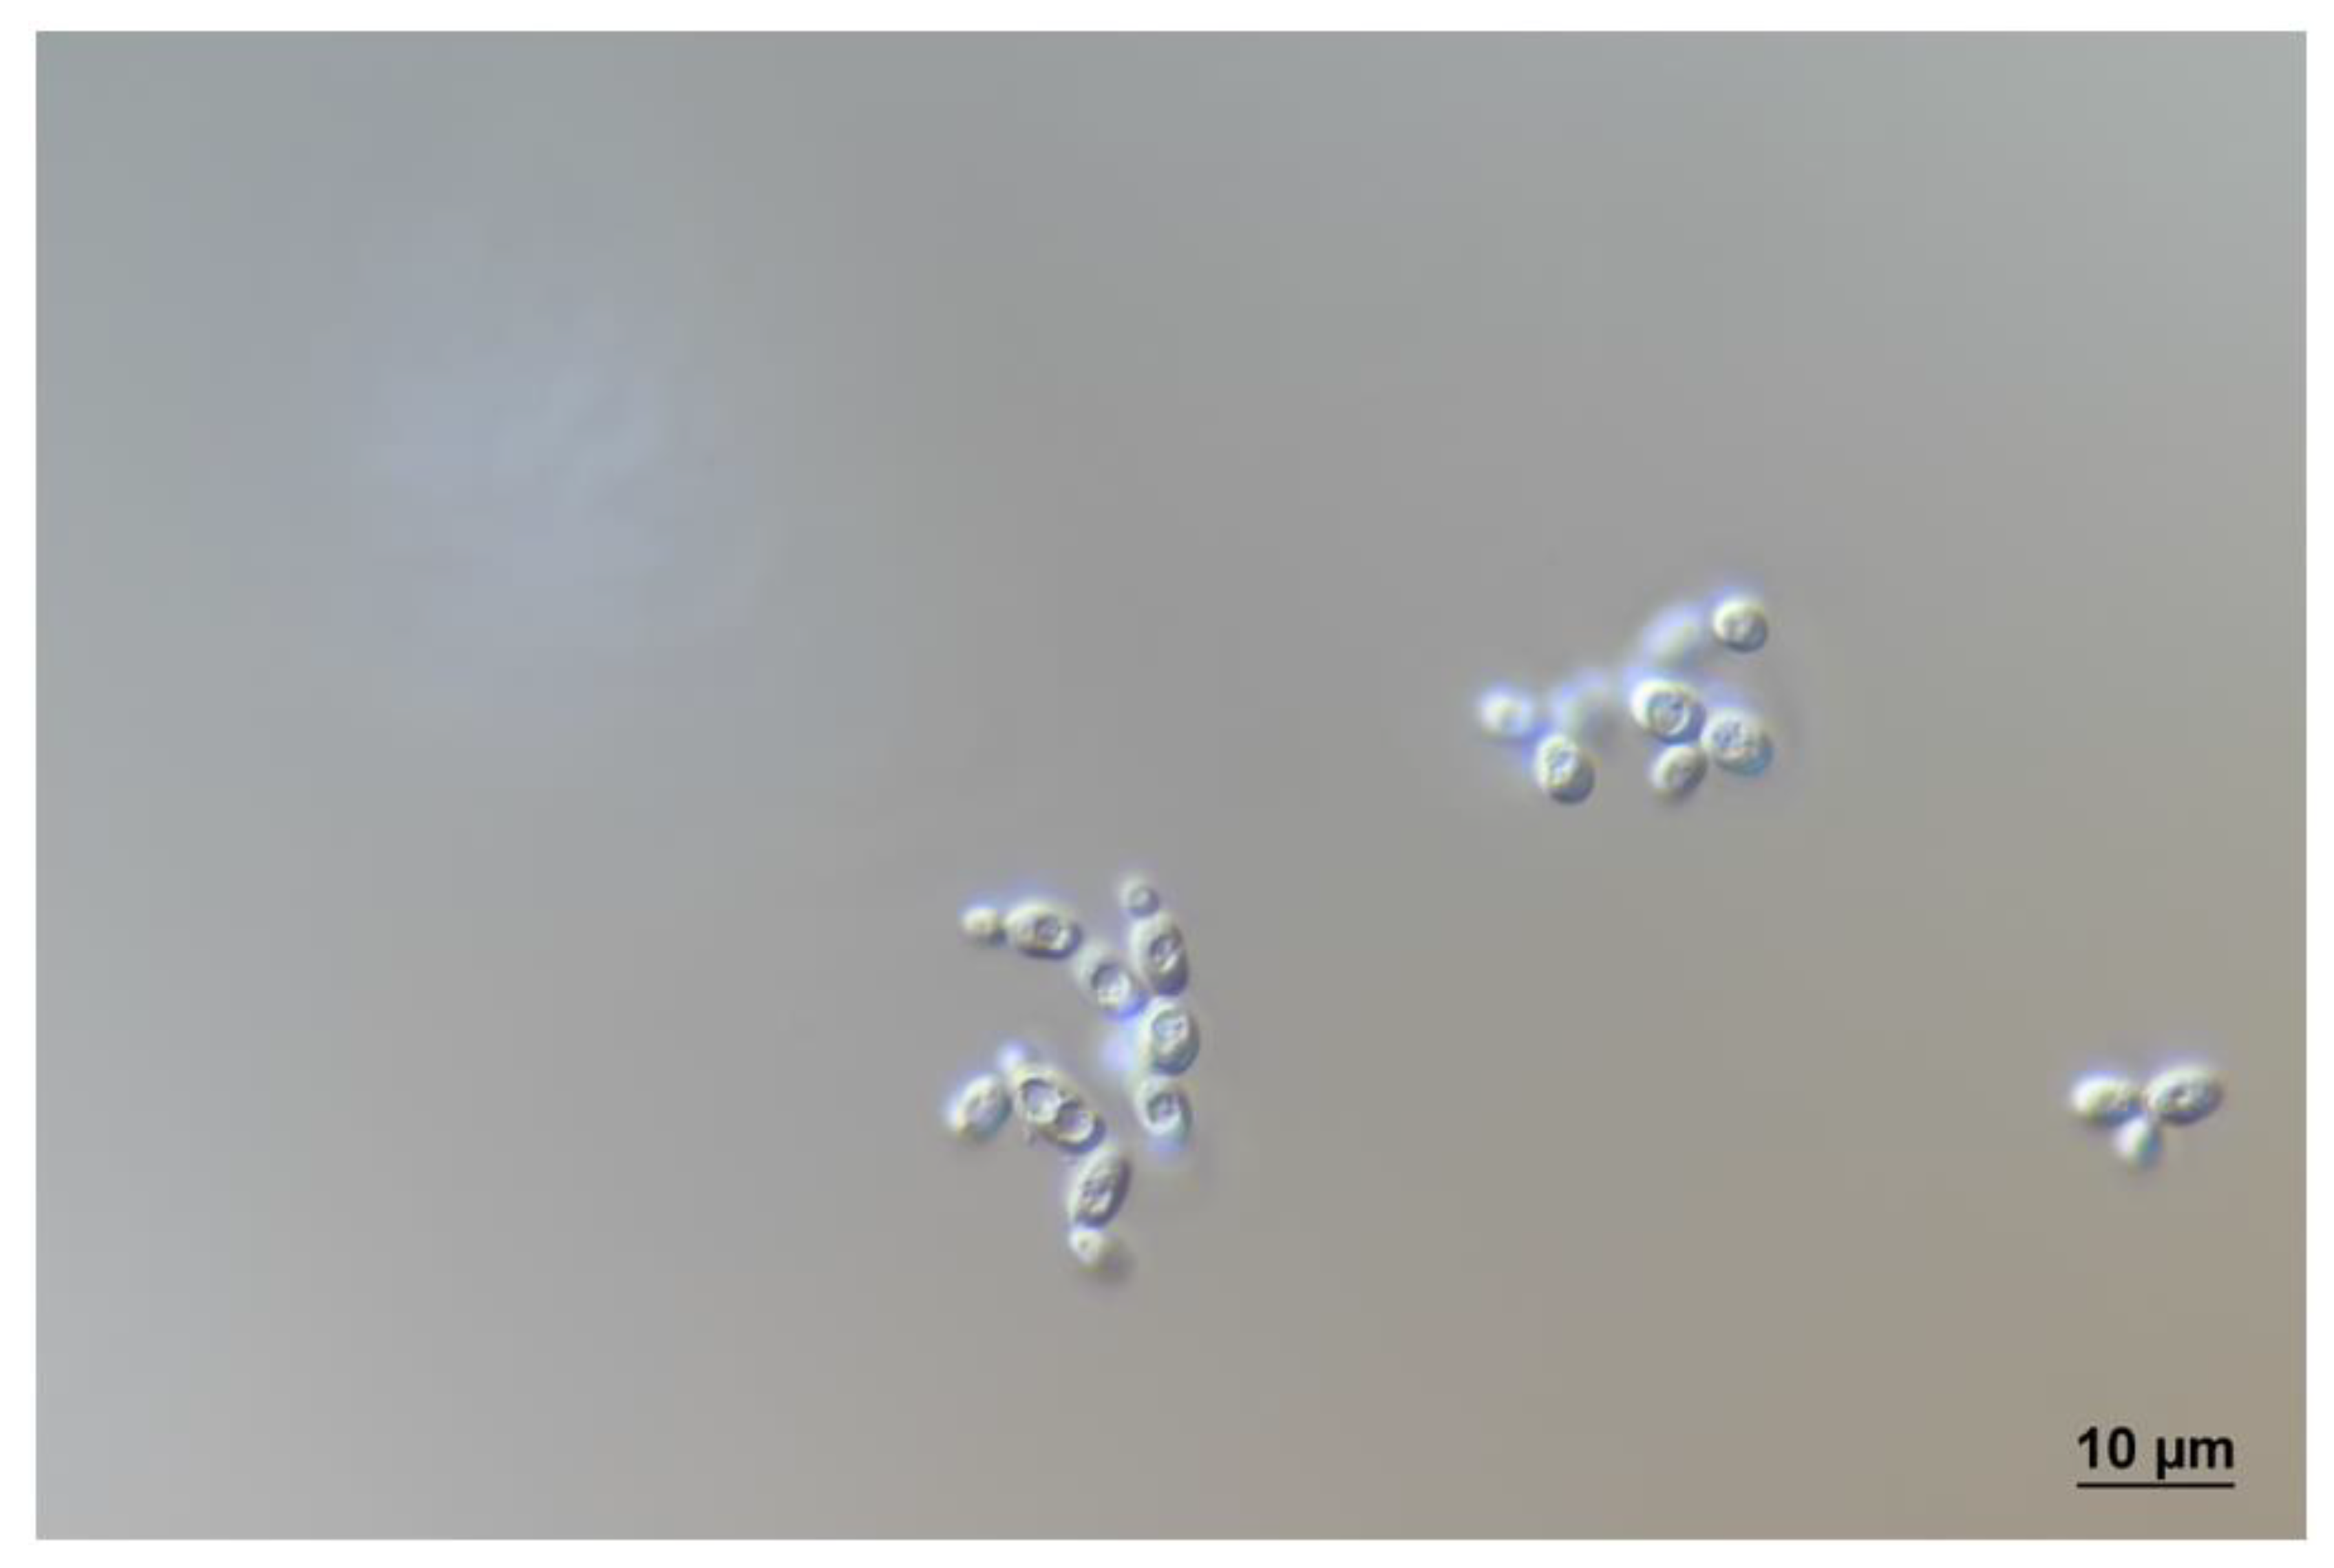
3.5. Description of Stenotrophomyces fumitolerans Gen. Nov., Sp. Nov.

Stenotrophomyces, D. Heidler von Heilborn, J. Reinmüller, A. Yurkov, P. Stehle, R. Möller, A. Lipski, gen. nov. MB# 849905
Ethymology: The genus name refers to the narrow assimilation spectrum of carbon sources.
Description: Cells are ellipsoid, ovoid or elongate and reproduce by multilateral budding. Asci with one or two spherical ascospores. Narrow assimilation spectrum of carbon sources. Glucose and galactose are fermented. Growth in vitamin-free medium. No starch-like substance is produced. Urea hydrolysis and the Diazonium blue B reaction are negative.
Type species: Stenotrophomyces fumitolerans
Stenotrophomyces fumitolerans, D. Heidler von Heilborn, J. Reinmüller, A. Yurkov, P. Stehle, R. Möller, A. Lipski, sp. nov. MB# 849906
Ethymology: The species name refers to the ability of the species to tolerate CO2-rich environments.
On Glucose Peptone Yeast Extract Agar (GPYA) and 5% malt extract agar (MEA), after 7 days at 22 °C, the streak is cream-colored, butyrous and smooth, with an entire margin. The profile is flat. Cells are ovoid to ellipsoid, 2.5–6.0 × 2.0–4.0 μm, singly occur and in pairs (Figure 4). Pseudohyphae and true hyphae are not formed on GPYA, MEA, potato dextrose agar or corn meal agar. Growth on minimal medium without amino acids. Vegetative reproduction is by multilateral budding.
Ascospores are produced by both strains on GPYA, MEA and on minimal medium without amino acids after 7–14 days at 22 °C (Figure 4). Asci are persistent, often unconjugated or arise following conjugation between a cell and its bud. One or two spheroid (diameter of 2.5–3.0 μm) ascospores are formed per ascus.
Fermentation of d-glucose, d-galactose and trehalose is positive. Glucose, d-galactose, trehalose and glycerol are assimilated. No growth occurs on l-sorbose, d-glucosamine, d-ribose, d-xylose, l-arabinose, d-arabinose, sucrose, maltose, methyl α-d-glucoside, cellobiose, salicin, melibiose, lactose, raffinose, melezitose, inulin, soluble starch, erythritol, ribitol, l-arabinitol, d-glucitol, d-mannitol, galactitol, myo-inositol, 2-keto-d-gluconate, 5-keto-d-gluconate, d-gluconate, d-glucoronate, d-galacturonate, dl-lactic acid, succinic acid, citric acid, methanol or ethanol. Nitrogen compounds: ammonium sulfate is assimilated, but not potassium nitrate, sodium nitrite, ethylamine, l-lysine, cadaverine, creatine, creatinine, glucosamine, imidazole or d-tryptophan. Growth in the presence of 5% (w/v) NaCl and 50% (w/v) glucose is positive. Weak growth in the presence of 8% (w/v) NaCl, and no growth in the presence of 10% (w/v) NaCl and 60% (w/v) glucose. Growth in vitamin-free medium positive. No starch-like substance is produced. Urea hydrolysis and the Diazonium blue B reaction are negative. Maximum growth temperature is 28 °C. The minimum growth temperature is 2 °C.
The holotype, strain WT5, was isolated from a vegetarian wrap in June 2020 in Bonn (Germany). It is preserved in a metabolically inactive state in the German Collection of Microorganisms and Cell Cultures, Braunschweig, Germany, under the number DSM 113852. The isotype is preserved in a metabolically inactive state in the CBS culture collection of the Westerdijk Fungal Biodiversity Institute (Utrecht, the Netherlands) under the number CBS 18379 and in the HAMBI microbial culture collection, Helsinki, Finland, under the number HAMBI 3777.
Other strains studied: paratype WR1 (DSM 113853, HAMBI 3776) from the same source.

4. Discussion

Elevated concentrations of carbon dioxide cause a reduction in microbial and, in particular, fungal growth, which is technically used in MAP within the food industry [7,8]. The inhibition mechanism is not fully understood yet, but it is believed to be a complex interaction of several effects, including membrane-, ion- and pH-related effects [13]. These, for example, comprise a disorder of the phospholipids within the cell membrane caused by the CO2 molecules [49], as well as a decrease in extra- and intracellular pH, leading to an inhibition of microbial growth and elevated energy consumption to maintain pH homeostasis [13,50]. Due to its ability to solve in water and fat [51], it is very likely that the inhibition mechanism of carbon dioxide includes the phospholipid bilayer of the membrane as a target. This can be assessed by analyzing the fatty acid composition. We assumed that CO2 stress would lead to a fluidization of the membrane to which the organisms react by incorporation of fatty acids with a higher melting temperature, leading to a solidification of the membrane and an increase of the WAMT. Other fat-soluble stressors have already been found to have an impact on the polar lipid and fatty acid compositions of microorganisms by disturbing the lipid layer, such as the amphiphilic ethanol [52]. It was shown in S. cerevisiae that its ethanol tolerance is highly dependent on the oleic acid content [53].
We found that carbon dioxide stress resulted in a significant elevation of the DU of fatty acids in yeasts and filamentous fungi, mainly due to the increased incorporation of linolenic acid. The WAMT did slightly decrease, meaning that no solidification of the membrane was observed, but a fluidization of the membrane. On the contrary, increased temperatures of 25 °C led to an increase of the WAMT and a decrease in the DU, indicating a solidification of the membrane in order to adapt to the elevated temperature.
In this study, several strains from natural habitats (mofettes), carbon dioxide including MA-packed food, the ISS and airborne fungi as controls were used to study commonly used adaptation mechanisms to elevated CO2 levels. In addition to the elevated carbon dioxide levels, temperature adjustments were tested as comparative parameters, where fatty acid modifications served as a reference to assess membrane fluidization effects. We found that an MA of 80% O2 and 20% CO2 led to reduced fungal biomass production, reduced sporulation and reduced exudate formation on agar compared to the controls grown under normal atmosphere. The mycelial clumps often formed in liquid cultures were smaller and denser under MA. This could be due to the growth-inhibitory effects of CO2. In a study by Fairclough et al., 20% CO2 MA fungistatically acted and negatively affected the growth of Penicillium roqueforti and the pigmentation of immature conidiospores; the effects were reversible and the pigmentation returned in the normal atmosphere [54]. The same effects of altered coloration have been observed in the present study. An MA consisting of 80% CO2 and 20% O2 has been reported to exert lethal effects after incubation for 60 days on Xeromyces bisporus and Eurotium chevalieri [55], but we did not observe any lethal effects in our experiments, which were performed with lower CO2 concentrations.
We have demonstrated that artificial atmospheres with elevated CO2 levels induce changes in the fungal fatty acid profiles. The most pronounced changes in the majority of fungi used were the higher proportions of linolenic and linoleic acids and the decreased levels of oleic acid. Consequently, these effects were displayed by the DU in the total fatty acid content, which was increased in all strains. Because of the rather low melting temperatures of the polyunsaturated fatty acids, the WAMT values were lower under elevated CO2, indicating fluidization of the membrane. The strains did not respond to the presumed fluidizing effect of the CO2 by solidification of their membrane through increasing the WAMT. We assume that the physiological reaction observed may be one reason, in these concentrations, for the non-lethal but growth-limiting effect of carbon dioxide. Literature on the effects of high concentrations of CO2 on microbial fatty acids, especially on fungal fatty acids, is scarce. However, the high degree of unsaturation under CO2, which was observed in this work, is consistent with the results for S. cerevisiae by Castelli et al. [56]. The group found that elevated CO2 concentrations, as well as elevated HCO3- concentrations, lead to a higher degree of unsaturation in fatty acids and that with increasing CO2 concentrations, regardless of the pH value, the total amount of fatty acids and lipids increases.
In contrast, meat-spoilage bacteria and green algae showed a decreased unsaturation degree due to the incorporation of mainly saturated fatty acids under 30% CO2 and 70% O2 in bacteria [57] and under 2% CO2 in algae [58]. For the green algae, a total increase in fatty acids in high CO2-treated cells was observed as well [58]. Available studies were mostly performed with very few isolates and did not cover a reasonable range of taxa. It has been furthermore suggested that the observed inhibitory effects of CO2 may also depend on other factors, such as the incubation temperature, growth medium, water activity and pH value [59].
The exact functions of specific fatty acids in fungi have not been fully elucidated yet. Linoleic acid and its derivatives have been shown to increase conidial development in Aspergillus and asexual spore production, and might act as signaling molecules modulating fungal sporulation [60]. The chemical mechanism underlying the effect is the formation of oxylipins from linoleic acids or their derivatives, by the incorporation of molecular oxygen with the help of oxygenases. The enzyme activities of stearoyl-CoA Δ9 and oleoyl-CoA Δ12 desaturases have been studied in dependence of the growth stage and temperature in Yarrowia lipolytica [61]. At 10 °C, the maximum activity of stearoyl-CoA desaturase was half of that at 25 °C, while the oleoyl-CoA desaturase activity showed the opposite trend, which is consistent with the observed higher unsaturation at lower temperatures. In the proposed main pathway of oleic and linoleic acids in Y. lipolytica, linoleic acid is synthesized by the Δ12 desaturase from oleic acid on phosphatidylcholine as a carrier, while oleic acid has been formed from 18:0-CoA by the Δ9 desaturase and then by acyl exchange onto phosphatidylcholine [61].
Concerning effects on human nutrition, polyunsaturated fatty acids have been reported to have a positive impact, including cholesterol-lowering effects, leading to a reduced risk of cardiovascular diseases [62]. If the DU in yeasts and fungi is increased after incubation in a CO2-containing MA or after CO2 treatment in general, this modification of the fungal lipid profile could be used in perspective when cultivating edible fungi to increase their nutritional value.
The temperature-dependent adaptation mechanisms through the change of fatty acid compositions have been found to vary between different fungal species [63] and are of interest for this study in terms of comparing membrane adaptations to temperature shifts with those to increased CO2 concentrations. The adaptation strategy, referred to as homeoviscous adaptation, was initially reported for the bacterium Escherichia coli, which favored fatty acids with higher melting points when incubated at higher temperatures in order to maintain membrane fluidity [64]. This strategy was also observed in 14 out of the 20 organisms investigated in the present study, the WAMT values of which were lower when incubated at a temperature of 10 °C, mainly due to the increased amount of linolenic acid and decreased concentration of palmitic acid. Cold stress adaptation is reportedly achieved by an increased DU and a decrease in the average chain length of fatty acids [65] by the induction of fatty acid desaturases and dehydrases, which decrease the proportion of saturated fatty acids, and (less frequently) decrease the chain length [66]. Similar observations were made for the fungus Pleurotus ostreatus, where lowered temperatures of 12 °C resulted in an increase in fatty acid unsaturation in comparison to the controls at 27 °C, mainly by an increase in linoleic acid [16]. In the present work, the temperature change from 25 °C to 10 °C caused similar changes, namely the increased ratio of polyunsaturated to monounsaturated fatty acids. Therefore, organisms that are better adapted to cold environments have been shown to produce a higher proportion of unsaturated lipids that result in lower WAMT values–an effect that was furthermore described for the amphiphilic ethanol [53], and which we unexpectedly observed for carbon dioxide stress in this study as well. Initially, we assumed that fungi would respond to high levels of membrane-soluble CO2, similar to their heat adaptation, by solidification of the membrane. Some organisms showed similar fatty acid profiles when grown under elevated CO2 and under normal atmosphere at 25 °C, including A. gracile WT6 and D. corylicola LT1, both of which showed strong adaptation to elevated CO2 and to the elevated temperature compared to the controls at 10 °C.
We found that the increase in temperature, which results in an increased WAMT for the majority of strains, does not have the same adaptation effect on fatty acid compositions as the effect of compounds that solve in water and in lipids, such as carbon dioxide, which we used in our study, or ethanol, as described in [53].
In addition, similar adaptation mechanisms were found irrespective of the origin of the strains, including mofettes, MAP food products, the ISS, with elevated CO2 concentrations, or the airborne strains with regular atmospheric CO2 exposition. This indicates that the increase in the unsaturation of fatty acids is a general response of yeasts and filamentous fungi to carbon-dioxide-induced stress and is different from the stress-response induced by increased temperatures.
The isolation of different strains from environments with elevated CO2 concentrations furthermore resulted in the discovery of a new yeast genus and species proposed as Stenotrophomyces fumitolerans gen. nov., sp. nov. Investigating such extreme environments and the adapted organisms could be of great importance concerning new opportunities in biotechnology, such as pigments, enzymes or secondary metabolites [67]. In the case of MA-packed food, these organisms can also play an important role as potential food spoilage organisms, especially when they grow at low temperatures, such as Stenotrophomyces fumitolerans WT5, which demonstrates growth down to 2 °C. As mentioned above, the production of polyunsaturated fatty acids in fungi under carbon dioxide-rich conditions might be used to improve the nutritional value of food products.

Supplementary Materials

The following supporting information can be downloaded at: https://www.mdpi.com/article/10.3390/jof9101031/s1, Table S1: List of the novel species Stenotrophomyces fumitolerans WT5, the representatives of the family Saccharomycetaceae and outgroup taxa from families Debaryomycetaceae, Phaffomycetaceae, and Pichiaceae used for multi-locus phylogenetic analysis. Type strains were used for the analysis.

Author Contributions

Conceptualization, D.H.v.H. and A.L.; methodology, D.H.v.H., J.R. and A.Y.; software, D.H.v.H. and A.Y.; investigation, D.H.v.H. and J.R.; resources, D.H.v.H., J.R., A.Y., P.S. and R.M.; writing—original draft preparation, D.H.v.H.; writing—review and editing, D.H.v.H., J.R., A.Y., R.M., P.S. and A.L.; supervision, A.L.; project administration, A.L. All authors have read and agreed to the published version of the manuscript.

Funding

This work was supported by the Open Access Publication Fund of the University of Bonn. R.M. was supported by the DLR grant FuE-Projekt “ISS LIFE” (Programm RF-FuW, Teilprogramm 475).

Institutional Review Board Statement

Not applicable.

Data Availability Statement

The datasets generated during and/or analyzed during the current study are provided in this manuscript.

Acknowledgments

We thank Kasthuri Venkateswaran (NASA Jet Propulsion Laboratory, California Institute of Technology, Pasadena, CA, USA) cordially for providing the Penicillium rubens IF2SW-F4 strain. We thank Judith Kreyenschmidt and her Cold Chain Management group (Institute of Animal Sciences, University of Bonn, Bonn, Germany) for the opportunity to use the traysealer. For technical support, including the analysis of fatty acids, we thank Christel Bierschbach and Nico Henschel (Nutritional Physiology group, Institute of Nutritional and Food Science, University of Bonn, Bonn, Germany). We would also like to thank Aharon Oren (Hebrew University of Jerusalem, Jerusalem, Israel) for his advice regarding the nomenclature of the species name.

Conflicts of Interest

The authors declare no conflict of interest.

Abbreviations

DLR: German Aerospace Center; DSMZ, Deutsche Sammlung von Mikroorganismen und Zellkulturen; DU, degree of unsaturation; ISS, International Space Station; MA, Modified Atmosphere; MAP, Modified Atmosphere Packaging/packed; ML, Maximum-Likelihood; ppm, parts per million; WAMT, weighted average melting temperature.

References

  1. Ropars, J.; Giraud, T. Convergence in domesticated fungi used for cheese and dry-cured meat maturation: Beneficial traits, genomic mechanisms, and degeneration. Curr. Opin. Microbiol. 2022, 70, 102236. [Google Scholar] [CrossRef]
  2. Kure, C.F.; Skaar, I. The fungal problem in cheese industry. Curr. Opin. Food Sci. 2019, 29, 14–19. [Google Scholar] [CrossRef]
  3. Lambert, A.D.; Smith, J.P.; Dodds, K.L. Shelf life extension and microbiological safety of fresh meat—A review. Food Microbiol. 1991, 8, 267–297. [Google Scholar] [CrossRef]
  4. Kurtzman, C.P. Identification of food and beverage spoilage yeasts from DNA sequence analyses. Int. J. Food Microbiol. 2015, 213, 71–78. [Google Scholar] [CrossRef]
  5. Pitt, J.I.; Hocking, A.D. Fungi and Food Spoilage; Springer International Publishing: Cham, Switzerland, 2022. [Google Scholar]
  6. Fröhlich-Nowoisky, J.; Pickersgill, D.A.; Després, V.R.; Pöschl, U. High diversity of fungi in air particulate matter. Proc. Natl. Acad. Sci. USA 2009, 106, 12814–12819. [Google Scholar] [CrossRef]
  7. Mullan, M.; McDowell, D. Modified Atmosphere Packaging. In Food and Beverage Packaging Technology; Coles, R., Kirwan, M., Eds.; Wiley-Blackwell: Oxford, UK, 2011; pp. 263–294. [Google Scholar]
  8. Taniwaki, M.H.; Hocking, A.D.; Pitt, J.I.; Fleet, G.H. Growth and mycotoxin production by food spoilage fungi under high carbon dioxide and low oxygen atmospheres. Int. J. Food Microbiol. 2009, 132, 100–108. [Google Scholar] [CrossRef]
  9. Taniwaki, M.; Hocking, A.; Pitt, J.; Fleet, G. Growth of fungi and mycotoxin production on cheese under modified atmospheres. Int. J. Food Microbiol. 2001, 68, 125–133. [Google Scholar] [CrossRef]
  10. Gonzalez-Fandos, E.; Maya, N.; Martínez-Laorden, A.; Perez-Arnedo, I. Efficacy of Lactic Acid and Modified Atmosphere Packaging against Campylobacter jejuni on Chicken during Refrigerated Storage. Foods 2020, 9, 109. [Google Scholar] [CrossRef]
  11. Santillan, E.-F.U.; Shanahan, T.M.; Omelon, C.R.; Major, J.R.; Bennett, P.C. Isolation and characterization of a CO2-tolerant Lactobacillus strain from Crystal Geyser, Utah, U.S.A. Front. Earth Sci. 2015, 3, 41. [Google Scholar] [CrossRef]
  12. Šibanc, N.; Zalar, P.; Schroers, H.-J.; Zajc, J.; Pontes, A.; Sampaio, J.P.; Maček, I. Occultifur mephitis f.a., sp. nov. and other yeast species from hypoxic and elevated CO2 mofette environments. Int. J. Syst. Evol. Microbiol. 2018, 68, 2285–2298. [Google Scholar] [CrossRef]
  13. Garcia-Gonzalez, L.; Geeraerd, A.H.; Spilimbergo, S.; Elst, K.; Van Ginneken, L.; Debevere, J.; Van Impe, J.; Devlieghere, F. High pressure carbon dioxide inactivation of microorganisms in foods: The past, the present and the future. Int. J. Food Microbiol. 2007, 117, 1–28. [Google Scholar] [CrossRef]
  14. Isenschmid, A.; Marison, I.W.; von Stockar, U. The influence of pressure and temperature of compressed CO2 on the survival of yeast cells. J. Biotechnol. 1995, 39, 229–237. [Google Scholar] [CrossRef]
  15. Beccaccioli, M.; Reverberi, M.; Scala, V. Fungal lipids: Biosynthesis and signalling during plant-pathogen interaction. Front. Biosci. (Landmark Ed) 2019, 24, 172–185. [Google Scholar] [CrossRef]
  16. Pedneault, K.; Angers, P.; Avis, T.J.; Gosselin, A.; Tweddell, R.J. Fatty acid profiles of polar and non-polar lipids of Pleurotus ostreatus and P. cornucopiae var. ‘citrino-pileatus’ grown at different temperatures. Mycol. Res. 2007, 111 Pt 10, 1228–1234. [Google Scholar] [CrossRef]
  17. Suutari, M. Effect of growth temperature on lipid fatty acids of four fungi (Aspergillus niger, Neurospora crassa, Penicillium chrysogenum, and Trichoderma reesei). Arch. Microbiol. 1995, 164, 212–216. [Google Scholar] [CrossRef]
  18. Sumner, J.L.; Morgan, E.D.; Evans, H.C. The effect of growth temperature on the fatty acid composition of fungi in the order Mucorales. Can. J. Microbiol. 1969, 15, 515–520. [Google Scholar] [CrossRef] [PubMed]
  19. Weete, J.D. Lipid Biochemistry of Fungi and Other Organisms; Springer: Boston, MA, USA, 1980. [Google Scholar]
  20. Phillips, R.L.; Zak, D.R.; Holmes, W.E.; White, D.C. Microbial community composition and function beneath temperate trees exposed to elevated atmospheric carbon dioxide and ozone. Oecologia 2002, 131, 236–244. [Google Scholar] [CrossRef] [PubMed]
  21. Lipson, D.A.; Wilson, R.F.; Oechel, W.C. Effects of elevated atmospheric CO2 on soil microbial biomass, activity, and diversity in a chaparral ecosystem. Appl. Environ. Microbiol. 2005, 71, 8573–8580. [Google Scholar] [CrossRef] [PubMed]
  22. Wang, L.; Groenewald, M.; Wang, Q.-M.; Boekhout, T. Reclassification of Saccharomycodes sinensis, Proposal of Yueomyces sinensis gen. nov., comb. nov. within Saccharomycetaceae (Saccharomycetales, Saccharomycotina). PLoS ONE 2015, 10, e0136987. [Google Scholar] [CrossRef]
  23. Simpson, A.C.; Urbaniak, C.; Bateh, J.R.; Singh, N.K.; Wood, J.M.; Debieu, M.; O’hara, N.B.; Houbraken, J.; Mason, C.E.; Venkateswaran, K. Draft Genome Sequences of Fungi Isolated from the International Space Station during the Microbial Tracking-2 Experiment. Microbiol. Resour. Announc. 2021, 10, e0075121. [Google Scholar] [CrossRef]
  24. James, J.T. The Headache of Carbon Dioxide Exposures; SAE Technical Paper Series; SAE International: Warrendale, PA, USA, 2007. [Google Scholar] [CrossRef]
  25. Law, J.; Van Baalen, M.; Foy, M.; Mason, S.S.; Mendez, C.; Wear, M.L.; Meyers, V.E.; Alexander, D. Relationship between carbon dioxide levels and reported headaches on the international space station. J. Occup. Environ. Med. 2014, 56, 477–483. [Google Scholar] [CrossRef] [PubMed]
  26. Kwiatkowski, N.P.; Babiker, W.M.; Merz, W.G.; Carroll, K.C.; Zhang, S.X. Evaluation of nucleic acid sequencing of the D1/D2 region of the large subunit of the 28S rDNA and the internal transcribed spacer region using SmartGene IDNS corrected software for identification of filamentous fungi in a clinical laboratory. J. Mol. Diagn. 2012, 14, 393–401. [Google Scholar] [CrossRef] [PubMed]
  27. White, T.J.; Bruns, T.; Lee, S.; Taylor, J. Amplification and direct sequencing of fungal ribosomal RNA genes for phylogenetics. In PCR Protocols; Elsevier: Amsterdam, The Netherlands, 1990; pp. 315–322. [Google Scholar]
  28. Kurtzman, C.P.; Robnett, C.J. Phylogenetic relationships among yeasts of the ‘Saccharomyces complex’ determined from multigene sequence analyses. FEMS Yeast Res. 2003, 3, 417–432. [Google Scholar] [CrossRef] [PubMed]
  29. Liu, Y.J.; Whelen, S.; Hall, B.D. Phylogenetic relationships among ascomycetes: Evidence from an RNA polymerse II subunit. Mol. Biol. Evol. 1999, 16, 1799–1808. [Google Scholar] [CrossRef]
  30. Matheny, P.B.; Liu, Y.J.; Ammirati, J.F.; Hall, B.D. Using RPB1 sequences to improve phylogenetic inference among mushrooms (Inocybe, Agaricales). Am. J. Bot. 2002, 89, 688–698. [Google Scholar] [CrossRef] [PubMed]
  31. Rehner, S.A.; Buckley, E. A Beauveria phylogeny inferred from nuclear ITS and EF1-alpha sequences: Evidence for cryptic diversification and links to Cordyceps teleomorphs. Mycologia 2005, 97, 84–98. [Google Scholar] [CrossRef] [PubMed]
  32. Altschul, S.F.; Gish, W.; Miller, W.; Myers, E.W.; Lipman, D.J. Basic local alignment search tool. J. Mol. Biol. 1990, 215, 403–410. [Google Scholar] [CrossRef]
  33. Kachalkin, A.V.; Abdullabekova, D.A.; Magomedova, E.S.; Yurkov, A.M. Zygotorulaspora dagestanica sp. nov., a novel ascomycetous yeast species associated with the Georgian honeysuckle (Lonicera iberica M. Bieb.). Int. J. Syst. Evol. Microbiol. 2021, 71, 004785. [Google Scholar] [CrossRef]
  34. Katoh, K.; Rozewicki, J.; Yamada, K.D. MAFFT online service: Multiple sequence alignment, interactive sequence choice and visualization. Brief. Bioinform. 2019, 20, 1160–1166. [Google Scholar] [CrossRef]
  35. Edler, D.; Klein, J.; Antonelli, A.; Silvestro, D. raxmlGUI 2.0: A graphical interface and toolkit for phylogenetic analyses using RAxML. Methods Ecol. Evol. 2021, 12, 373–377. [Google Scholar] [CrossRef]
  36. Huson, D.H.; Bryant, D. Application of phylogenetic networks in evolutionary studies. Mol. Biol. Evol. 2006, 23, 254–267. [Google Scholar] [CrossRef] [PubMed]
  37. Yurkov, A.; Guerreiro, M.A.; Sharma, L.; Carvalho, C.; Fonseca, Á. Multigene assessment of the species boundaries and sexual status of the basidiomycetous yeasts Cryptococcus flavescens and C. terrestris (Tremellales). PLoS ONE 2015, 10, e0120400. [Google Scholar] [CrossRef]
  38. Wu, Q.; James, S.A.; Roberts, I.N.; Moulton, V.; Huber, K.T. Exploring contradictory phylogenetic relationships in yeasts. FEMS Yeast Res. 2008, 8, 641–650. [Google Scholar] [CrossRef] [PubMed]
  39. Shen, X.-X.; Opulente, D.A.; Kominek, J.; Zhou, X.; Steenwyk, J.L.; Buh, K.V.; Haase, M.A.; Wisecaver, J.H.; Wang, M.; Doering, D.T.; et al. Tempo and Mode of Genome Evolution in the Budding Yeast Subphylum. Cell 2018, 175, 1533–1545.e20. [Google Scholar] [CrossRef] [PubMed]
  40. Sasser, M. Identification of Bacteria by Gas Chromatography of Cellular Fatty Acids; Technical Note 101; MIDI-Inc.: Newark, DE, USA, 1990. [Google Scholar]
  41. Lipski, A.; Altendorf, K. Identification of Heterotrophic Bacteria Isolated from Ammonia-supplied Experimental Biofilters. Syst. Appl. Microbiol. 1997, 20, 448–457. [Google Scholar] [CrossRef]
  42. van Lent, D.M.; Egert, S.; Wolfsgruber, S.; Kleineidam, L.; Weinhold, L.; Wagner-Thelen, H.; Maier, W.; Jessen, F.; Ramirez, A.; Schmid, M.; et al. Eicosapentaenoic Acid Is Associated with Decreased Incidence of Alzheimer’s Dementia in the Oldest Old. Nutrients 2021, 13, 461. [Google Scholar] [CrossRef]
  43. Seel, W.; Flegler, A.; Zunabovic-Pichler, M.; Lipski, A. Increased Isoprenoid Quinone Concentration Modulates Membrane Fluidity in Listeria monocytogenes at Low Growth Temperatures. J. Bacteriol. 2018, 200. [Google Scholar] [CrossRef] [PubMed]
  44. Kurtzman, C.P.; Fell, J.W.; Boekhout, T.; Robert, V. Methods for Isolation, Phenotypic Characterization and Maintenance of Yeasts. In The Yeasts; Elsevier: Amsterdam, The Netherlands, 2011; pp. 87–110. [Google Scholar]
  45. von Heilborn, D.H.; Reinmüller, J.; Hölzl, G.; Meier-Kolthoff, J.P.; Woehle, C.; Marek, M.; Hüttel, B.; Lipski, A. Sphingomonas aliaeris sp. nov., a new species isolated from pork steak packed under modified atmosphere. Int. J. Syst. Evol. Microbiol. 2021, 71, 004973. [Google Scholar] [CrossRef]
  46. Lösel, D.M. Lipids in the Structure and Function of Fungal Membranes; Springer: Berlin/Heidelberg, Germany, 1990; pp. 119–133. [Google Scholar] [CrossRef]
  47. Timke, M.; Wang-Lieu, N.Q.; Altendorf, K.; Lipski, A. Identity, beer spoiling and biofilm forming potential of yeasts from beer bottling plant associated biofilms. Antonie Van Leeuwenhoek 2008, 93, 151–161. [Google Scholar] [CrossRef]
  48. Loureiro, V. The prevalence and control of spoilage yeasts in foods and beverages. Trends Food Sci. Technol. 1999, 10, 356–365. [Google Scholar] [CrossRef]
  49. Jones, R.P.; Greenfield, P.F. Effect of carbon dioxide on yeast growth and fermentation. Enzym. Microb. Technol. 1982, 4, 210–223. [Google Scholar] [CrossRef]
  50. Hutkins, R.W.; Nannen, N.L. pH Homeostasis in Lactic Acid Bacteria. J. Dairy Sci. 1993, 76, 2354–2365. [Google Scholar] [CrossRef]
  51. Münch, M.; Guillard, V.; Gaucel, S.; Destercke, S.; Thévenot, J.; Buche, P. Composition-based statistical model for predicting CO2 solubility in modified atmosphere packaging application. J. Food Eng. 2023, 340, 111283. [Google Scholar] [CrossRef]
  52. Tesnière, C. Importance and role of lipids in wine yeast fermentation. Appl. Microbiol. Biotechnol. 2019, 103, 8293–8300. [Google Scholar] [CrossRef] [PubMed]
  53. You, K.M.; Rosenfield, C.-L.; Knipple, D.C. Ethanol tolerance in the yeast Saccharomyces cerevisiae is dependent on cellular oleic acid content. Appl. Environ. Microbiol. 2003, 69, 1499–1503. [Google Scholar] [CrossRef] [PubMed]
  54. Fairclough, A.C.; Cliffe, D.E.; Knapper, S. Factors affecting Penicillium roquefortii (Penicillium glaucum) in internally mould ripened cheeses: Implications for pre-packed blue cheeses. Int. J. Food Sci. Technol. 2011, 46, 1586–1590. [Google Scholar] [CrossRef]
  55. Taniwaki, M.H.; Hocking, A.D.; Pitt, J.I.; Fleet, G.H. Growth and mycotoxin production by fungi in atmospheres containing 80% carbon dioxide and 20% oxygen. Int. J. Food Microbiol. 2010, 143, 218–225. [Google Scholar] [CrossRef] [PubMed]
  56. Castelli, A.; Littarru, G.P.; Barbaresi, G. Effect of pH and CO2 concentration changes on lipids and fatty acids of Saccharomyces cerevisiae. Arch. Mikrobiol. 1969, 66, 34–39. [Google Scholar] [CrossRef] [PubMed]
  57. Kolbeck, S.; Kienberger, H.; Kleigrewe, K.; Hilgarth, M.; Vogel, R.F. Effect of high levels of CO2 and O2 on membrane fatty acid profile and membrane physiology of meat spoilage bacteria. Eur. Food Res. Technol. 2021, 247, 999–1011. [Google Scholar] [CrossRef]
  58. Tsuzuki, M.; Ohnuma, E.; Sato, N.; Takaku, T.; Kawaguchi, A. Effects of CO(2) Concentration during Growth on Fatty Acid Composition in Microalgae. Plant Physiol. 1990, 93, 851–856. [Google Scholar] [CrossRef]
  59. Farber, J.M. Microbiological Aspects of Modified-Atmosphere Packaging Technology—A Review 1. J. Food Prot. 1991, 54, 58–70. [Google Scholar] [CrossRef] [PubMed]
  60. Calvo, A.M.; Hinze, L.L.; Gardner, H.W.; Keller, N.P. Sporogenic effect of polyunsaturated fatty acids on development of Aspergillus spp. Appl. Environ. Microbiol. 1999, 65, 3668–3673. [Google Scholar] [CrossRef] [PubMed]
  61. Ferrante, G.; Kates, M. Pathways for desaturation of oleoyl chains in Candida lipolytica. Can. J. Biochem. Cell Biol. 1983, 61, 1191–1196. [Google Scholar] [CrossRef] [PubMed]
  62. Kris-Etherton, P.M.; Hecker, K.D.; Binkoski, A.E. Polyunsaturated Fatty Acids and Cardiovascular Health. Nut. Rev. 2004, 62, 414–426. [Google Scholar] [CrossRef] [PubMed]
  63. Stahl, P.D.; Klug, M.J. Characterization and differentiation of filamentous fungi based on Fatty Acid composition. Appl. Environ. Microbiol. 1996, 62, 4136–4146. [Google Scholar] [CrossRef] [PubMed]
  64. Sinensky, M. Homeoviscous adaptation—A homeostatic process that regulates the viscosity of membrane lipids in Escherichia coli. Proc. Natl. Acad. Sci. USA 1974, 71, 522–525. [Google Scholar] [CrossRef]
  65. Krell, T. Cellular Ecophysiology of Microbe: Hydrocarbon and Lipid Interactions; Springer: Berlin/Heidelberg, Germany, 2018; p. 381. [Google Scholar] [CrossRef]
  66. Al-Fageeh, M.B.; Smales, C.M. Control and regulation of the cellular responses to cold shock: The responses in yeast and mammalian systems. Biochem. J. 2006, 397, 247–259. [Google Scholar] [CrossRef]
  67. Buzzini, P.; Turchetti, B.; Yurkov, A. Extremophilic yeasts: The toughest yeasts around? Yeast 2018, 35, 487–497. [Google Scholar] [CrossRef]
Figure 1. Maximum likelihood tree of Stenotrophomyces fumitolerans WT5 sp. nov. and related species and genera of the family Saccharomycetaceae with outgroup taxa from families Debaryomycetaceae, Phaffomycetaceae and Pichiaceae obtained from the combined analysis of SSU, 5.8S rRNA, LSU, TEF1 and RPB2 genes. The tree is rooted with sequences of Schizosaccharomyces pombe. The numbers provided on branches are frequencies (>50%) with which a given branch appeared in 100 through bootstrap replications. The scale bars indicate the numbers of expected substitutions accumulated per site. Accession numbers of nucleotide sequences are provided in Supplementary Table S1.
Jof 09 01031 g001
Figure 2. Consensus network obtained from the combined analyses of single-gene maximum likelihood trees of SSU, 5.8S rRNA, LSU, TEF1 and RPB2 alignments. The scale indicates mean distance obtained from the analysis of single-gene trees. Accession numbers of nucleotide sequences are provided in Supplementary Table S1.
Jof 09 01031 g002
Figure 3. Comparison of averaged changes in total fatty acid compositions of MAP-treated samples at 10 °C to the controls at 10 °C. Increases in fatty acid contents of MAP-treated samples compared to the controls are highlighted in green, while decreases are highlighted in red with the intensity of the color correlating to the extent of the difference. In the lower graph, differences in the fatty acid contents are normalized in order to individually display changes for each sample. When a fatty acid is not detected in a sample or the content is below <1%, it is not included, and is therefore displayed in grey. The organisms are mentioned by their strain designations. “DSM” resembles the strain DSM 1075, and “ISS” resembles the strain IF2SW-F4.
Jof 09 01031 g003
Figure 4. Stenotrophomyces fumitolerans WT5 cells and asci on minimal medium after 7 days at 22 °C obtained with DIC optic.
Jof 09 01031 g004
Table 1. Isolation source and identification of the different fungal strains using ITS and/or 28S rRNA gene regions according to GenBank. Sequences of isolates were only compared to type strain sequences. Models and environmental samples were excluded. All strains were sequenced during this project, with the exception of the two strains IF2SW-F4 and DSM 1075.
SourceStrainSpecies According to NCBI BLASTSequence Similarity with Closely-Related Type StrainSequence Accession No.
Vegetarian wrapWR1Torulaspora globosa96.9% ‡ (KY109865.1)OQ255941
WT2Pichia fermentans99.8% ‡ (MK394169.1)OQ255937
WT5Vanderwaltozyma verrucispora89.0% * (NR_137559.1)OQ255923
Torulaspora globosa96.9% ‡ (KY109865.1)OQ255942
Further accession numbers for SSU-ITS-LSU fragment, RPB2 and TEF1-OQ708375, OQ715316, OR661267
WT6Apiotrichum gracile99.8% ‡ (KY106124.1)OQ255938
WT7Candida oleophila99.6% ‡ (NG_060820.1)OQ255939
Minced MeatHR2Penicillium griseofulvum99.8% * (MH854925.1)OQ255924
Penicillium dipodomyus †100% ‡ (MH874450.1)OQ255931
HT4Candida sake100% ‡ (KY106745.1)OQ255932
SalmonLR1Candida zeylanoides100% ‡ (NG_060834.1)OQ255933
LT1Didymella corylicola100% ‡ (MN954290.1)OQ255934
CoffeeKR3Neurospora tetraspora98.9% ‡ (NG_068996.1)OQ255940
AirborneTS1Penicillium tardochrysogenum100% * (MH865983.1)OQ255929
Penicillium dipodomyus100% ‡ (MH874450.1)OQ255935
TS2Penicillium griseofulvum99.8% * (MH854925.1)OQ255930
Penicillium tardochrysogenum100% ‡ (NG_070021.1)OQ255936
MofettesM1Rhizopus oryzae100% * (DQ641279.1)OQ255925
M2Cladosporium subuliforme100% * (MH864124.1)OQ255922
M3Rhodotorula alborubescens99.6% * (NR_153197.1)OQ255926
M4Alternaria alstroemeriae100% * (NR_163686.1)OQ255927
M6Penicillium glandicola100% * (MH860946.1)OQ255928
M12Rhodotorula babjevae99.4% * (NR_077096.1)OQ504373
International Space Station (ISS)IF2SW-F4Penicillium rubens100.0% (MT558923.1)JACSPE000000000
Cantaloupe melonDSM 1075Penicillium rubens100% * (NR_111815.1)PKG00000000,
as published before [22]
* ITS nucleotide sequence; ‡ LSU nucleotide sequence; † Additionally shares 100% sequence similarity with other strains.
Table 2. Fatty acid composition of the examined yeasts under elevated CO2 levels (20% CO2) at 10 °C, and under normal atmospheres at 10 °C and 25 °C. The values represent the average of three biological replicates (n = 3) and the standard deviation in % of the total area of all fatty acids in the sample. WAMT resembles the weighted average melting temperature of the membrane in °C. DU shows the degree of unsaturation. nd, fatty acids not detected in the replicates.
OrganismsGrowth atC14:0C16:0C16:1 cis 9C18:0C18:1
cis 9
C18:2
cis 9, 12
C18:3
cis 9, 12, 15
C18:1
cis 11
C18:0 3OHWAMT (°C)DU
Candida zeylanoides LR110 °C, CO2 10.4 ± 0.58.9 ± 1.8<138.7 ± 3.124.8 ± 1.917.3 ± 2.6nd 7.7 ± 0.21.49
10 °C<111.5 ± 1.58.4 ± 2.139.6 ± 3.125.8 ± 0.514.7 ± 4.0nd8.7 ± <0.11.44
25 °C 15.1 ± 0.64.5 ± 0.341.3 ± 1.727.0 ±0.312.0 ± 1.3 11.5 ± 0.11.36
Pichia fermentans WT210 °C, CO2 11.4 ± 1.619.8 ± 1.70.5 ± 0.222.9 ± 2.122.9 ± 1.322.4 ± 0.4nd 6.4 ± 0.71.56
10 °C<111.1 ± 0.923.1 ± 0.41.0 ± 0.124.9 ± 1.227.1 ± 1.012.8 ± 0.5nd7.6 ± 0.51.41
25 °C 14.8 ± 0.415.7 ± 1.62.2 ± 0.321.4 ± 1.335.6 ± 0.210.3 ± 0.3 9.9 ± 0.61.39
Stenotrophomyces fumitolerans WT510 °C, CO2 5.6 ± 0.774.2 ± 2.6<116.4 ± 2.0ndnd3.8 ± 0.7 7.0 ± 0.70.94
10 °C<18.3 ± 0.374.5 ± 0.813.5 ± 0.33.8 ± 0.7nd8.4 ± 0.20.92
25 °C 9.3 ± 1.565.5 ± 3.318.2 ± 1.97.0 ± 1.0 10.0 ± 1.00.91
Stenotrophomyces fumitolerans WR110 °C, CO2 8.6 ± 0.575.6 ± 0.1<113.1 ± 0.2ndnd2.7 ± 0.3 8.3 ± 0.30.91
10 °C<19.0 ± 0.579.7 ± 4.69.2 ± 3.52.9 ± 0.8nd8.2 ± 0.20.91
25 °C 10.5 ± 0.466.4 ± 1.217.2 ± 1.05.9 ± 0.4 10.4 ± 0.40.89
Apiotrichum gracile WT610 °C, CO2 16.2 ± 1.01.4 ± 0.32.4 ± 2.819.6 ± 1.047.2 ± 4.214.0 ± 1.7nd 8.7 ± 2.31.57
10 °C<119.1 ± 1.82.3 ± 0.42.3 ± 0.447.5 ± 3.022.9 ± 3.05.9 ± 1.4nd17.2 ± 2.01.13
25 °C 20.8 ± 1.10.8 ± 0.33.9 ± 1.224.0 ± 1.746.4 ± 2.84.2 ± 3.9 14.9 ± 0.61.30
Candida oleophila WT710 °C, CO2 12.4 ± 0.512.4 ± 1.10.3 ± 0.135.6 ± 0.419.1 ± 0.920.1 ± 0.3nd 8.9 ± 0.31.37
10 °C<114.3 ± 0.515.7 ± 1.00.8 ± 0.141.9 ± 3.816.8 ± 1.310.3 ± 2.7nd12.6 ± 1.11.22
25 °C 14.7 ± 0.41.8 ± 0.13.7 ± 0.347.8 ± 0.723.7 ± 0.48.2 ± 0.8 15.2 ± 0.61.22
Candida sake HT410 °C, CO2 11.1 ± 0.511.5 ± 2.70.7 ± 0.334.0 ± 8.828.7 ± 6.814.0 ± 4.5nd 8.2 ± 0.21.45
10 °C<114.3 ± 1.214.7 ± 0.11.1 ± 0.150.5 ± 3.413.7 ± 3.15.8 ± 1.6nd14.6 ± 1.61.10
25 °C 12.3 ± 0.710.5 ± 0.21.5 ± 0.348.0 ± 4.623.0 ± 3.14.7 ± 1.3 12.8 ± 0.81.19
Rhodotorula alborubescens M310 °C, CO2 10.4 ± 0.50.9 ± 0.11.9 ± 0.128.5 ± 0.839.1 ± 1.119.2 ± 0.4nd 6.4 ± 0.41.65
10 °C<120.4 ± 1.31.4 ± 0.22.4 ± 0.546.8 ± 2.320.9 ± 2.18.1 ± 1.4nd17.9 ± 1.51.14
25 °C 18.1 ± 0.50.4 ± 0.14.0 ± 0.254.3 ± 0.817.6 ± 0.65.6 ± 0.4 19.0 ± 0.31.06
Rhodotorula babjevae M1210 °C, CO21.0 ± <0.113.7 ± 0.32.1 ± 0.21.4 ± 0.225.8 ± 0.925.6 ± 0.218.9 ± 0.3 11.5 ± 0.519.2 ± 0.41.70
10 °C1.0 ± 0.2 16.9 ± 0.93.2 ± 0.51.0 ± 0.436.5 ± 2.815.5 ± 0.89.6 ± 2.3nd16.1 ± 1.328.7 ± 0.81.48
25 °C1.1 ± 0.117.7 ± 1.21.2 ± 0.11.7 ± 0.239.0 ± 3.320.2 ± 2.910.3 ± 1.9 8.5 ± 0.522.1 ± 1.71.38
Table 3. Fatty acid composition of the examined filamentous fungi under elevated CO2 levels (20% CO2) at 10 °C, and under normal atmospheres at 10 °C and 25 °C. The values represent the average of three biological replicates (n = 3; except for M2 10 °C, where n = 2) and the standard deviation in % of the total area of all fatty acids in the sample. WAMT resembles the weighted average melting temperature of the membrane in °C. DU shows the degree of unsaturation. * R. oryzae M1 has C18:3 cis 6, 9, 12 instead of C18:3 cis 9, 12, 15.
OrganismsGrowth atC16:0C16:1 cis 9C18:0C18:1
cis 9
C18:2
cis 9, 12
C18:3
cis 9, 12, 15
WAMT (°C)DU
Penicillium rubens IF2SW-F410 °C, CO28.8 ± 0.5 6.5 ± 1.011.1 ± 1.743.7 ± 3.830.0 ± 4.84.7 ± 0.21.89
10 °C14.9 ± 0.6<17.2 ± 1.410.2 ± 1.251.0 ± 2.716.7 ± 0.610.0 ± 1.71.64
25 °C16.1 ± 1.1 3.6 ± 0.98.7 ± 0.560.0 ± 2.711.6 ± 1.08.0 ± 1.31.63
Penicillium rubens DSM 107510 °C, CO28.9 ± 0.4 6.8 ± 2.94.2 ± 2.247.3 ± 4.632.8 ± 4.53.6 ± 1.41.97
10 °C10.6 ± 1.3<110.1 ± 2.92.7 ± 0.944.5 ± 6.233.0 ± 5.66.8 ± 1.5 1.91
25 °C16.0 ± 1.6 4.0 ± 0.63.5 ± 0.561.5 ± 5.215.1 ± 3.27.0 ± 1.61.72
Penicillium griseofulvum HR210 °C, CO210.5 ± 1.21.6 ± 0.52.3 ± 1.16.9 ± 1.064.2 ± 3.314.5 ± 2.32.7 ± 1.81.80
10 °C13.0 ± 0.41.6 ± 0.34.2 ± 0.88.0 ± 0.955.7 ± 3.317.5 ± 2.26.0 ± 0.51.74
25 °C14.8 ± 0.90.8 ± 0.12.9 ± 0.38.0 ± 0.470.2 ± 2.23.4 ± 1.16.8 ± 0.81.59
Didymella corylicola LT110 °C, CO214.8 ± 2.33.9 ± 0.71.5 ± 0.212.9 ± 2.258.6 ± 2.38.4 ± 2.66.8 ± 2.21.59
10 °C18.8 ± 1.58.1 ± 2.23.0 ± 1.033.8 ± 3.933.8 ± 5.02.5 ± 0.515.5 ± 2.01.17
25 °C14.4 ± 1.81.0 ± 0.62.8 ± 0.120.7 ± 5.457.9 ± 6.53.2 ± 1.59.1 ± 2.41.47
Neurospora tetraspora KR310 °C, CO210.2 ± 1.81.5 ± 1.01.5 ± 0.45.8 ± 0.654.3 ±2.426.8 ± 3.51.1 ± 1.71.96
10 °C12.1 ± 1.33.2 ± 0.84.7 ± 1.815.5 ± 3.253.2 ± 1.611.2 ± 1.37.7 ± 1.61.59
25 °C15.0 ± 1.21.5 ± 0.18.0 ± 2.825.7 ± 3.045.0 ± 3.14.8 ± 2.214.4 ± 2.11.32
Penicillium tardochrysogenum TS110 °C, CO211.0 ± 1.1<14.5 ± 0.413.4 ± 1.542.5 ± 4.228.5 ± 6.55.4 ± 1.11.84
10 °C13.8 ± 0.95.8 ± 0.910.7 ± 1.344.0 ± 2.625.6 ± 3.37.9 ± 0.41.76
25 °C15.0 ± 0.42.5 ± 0.423.3 ± 3.050.4 ± 6.98.8 ± 3.39.4 ± 0.91.50
Penicillium griseofulvum TS210 °C, CO210.3 ± 0.81.7 ± 0.92.5 ± 1.16.2 ± 1.464.6 ± 4.814.7 ± 2.32.6 ± 1.51.81
10 °C12.9 ± 0.61.6 ± 0.42.6 ± 0.88.1 ± 0.860.8 ± 3.514.0 ± 4.24.9 ± 0.61.73
25 °C14.6 ± 1.00.8 ± 0.13.0 ± 0.68.6 ± 0.770.2 ± 3.02.7 ± 0.96.9 ± 1.21.58
Rhizopus oryzae M1 *10 °C, CO225.5 ± 4.48.0 ± 2.92.1 ± 0.335.1 ± 4.111.6 ± 2.017.7 ± 4.819.2 ± 4.01.19
10 °C20.3 ± 0.45.0 ± 1.06.5 ± 2.550.4 ± 1.68.8 ± 2.49.0 ± 2.022.0 ± 2.31.00
25 °C22.0 ± 3.50.9 ± 0.46.1 ± 1.142.1 ± 1.519.4 ± 1.59.5 ± 1.420.9 ± 2.81.10
Cladosporium subuliforme M210 °C, CO220.6 ± 2.2<12.4 ± 0.416.2 ± 0.949.9 ± 2.110.9 ± 0.811.7 ± 1.51.49
10 °C22.8 ±1.65.4 ± 2.828.2 ± 0.237.3 ± 0.16.3 ± 0.818.1 ± 1.01.22
25 °C29.1 ± 2.48.4 ± 1.833.7 ± 0.827.9 ± 4.00.9 ± 0.226.1 ± 2.70.92
Alternaria alstroemeriae M410 °C, CO214.6 ± 1.50.9 ± <0.15.0 ± 1.08.3 ± 1.663.7 ± 1.37.5 ± 2.08.2 ± 1.71.59
10 °C24.1 ± 1.31.3 ± <0.16.2 ± 1.116.9 ± 0.647.6 ± 3.24.0 ± 0.217.5 ± 1.91.25
25 °C22.3 ± 2.21.5 ± 0.16.2 ± 0.633.9 ± 2.335.8 ± 0.60.3 ± <0.120.0 ± 1.61.08
Penicillium glandicola M6CO212.0 ± 0.72.8 ± 0.32.4 ± 0.47.7 ± 1.361.3 ± 2.013.9 ± 2.74.1 ± 0.61.75
10 °C12.9 ± 0.61.2 ± 0.18.3 ± 0.217.0 ± 1.750.6 ± 0.910.0 ± 2.511.2 ± 0.81.49
25 °C16.4 ± 1.41.4 ± 0.16.9 ± 1.436.7 ± 2.137.3 ± 1.51.4 ± 0.516.9 ± 1.81.17
Disclaimer/Publisher’s Note: The statements, opinions and data contained in all publications are solely those of the individual author(s) and contributor(s) and not of MDPI and/or the editor(s). MDPI and/or the editor(s) disclaim responsibility for any injury to people or property resulting from any ideas, methods, instructions or products referred to in the content.

