Article

Development of a Method for Detecting and Estimating Moniliophthora roreri Spore Loads Based on Spore Traps and qPCR

by
Diana L. Jiménez-Zapata
1,2,
Manuela Quiroga-Pérez
1,2,
Manuela Quiroz-Yepes
1,3,
Alejandro Marulanda-Tobón
1,3,
Javier C. Álvarez
1,2,* and
Sandra Mosquera-López
1,2
1
Division of Natural Systems and Sustainability, School of Applied Sciences and Engineering, EAFIT University, Medellín 050021, Colombia
2
CIBIOP Research Group, School of Applied Sciences and Engineering, EAFIT University, Medellín 050021, Colombia
3
GEMA Research Group, School of Applied Sciences and Engineering, EAFIT University, Medellín 050021, Colombia
*
Author to whom correspondence should be addressed.
J. Fungi 2023, 9(1), 47; https://doi.org/10.3390/jof9010047
Submission received: 19 September 2022 / Revised: 19 December 2022 / Accepted: 26 December 2022 / Published: 28 December 2022

Abstract

:
Frosty pod rot, caused by Moniliophthora roreri, is the most damaging disease of cacao in Latin America and, to better comprehend its epidemiology, we must understand its dissemination and proliferation. However, we do not know how M. roreri spores loads fluctuate in time and space due to the lack of a reliable technique to quantify M. roreri spores in the fields. Therefore, we developed a method that relies on spore traps and qPCR to detect and quantify M. roreri spore loads. This study demonstrated that the qPCR protocol can detect down to 0.025 ng of M. roreri DNA and quantify between 0.006 ng and 60 ng. Moreover, it demonstrated that qPCR protocol can detect and quantify DNA extracted from spore suspension and spore traps containing at least 2.9 × 10⁴ M. roreri spores. However, the variability of the estimates for spore samples was high. Finally, we described a spore-trap device designed to carry spore traps in the field. The qPCR protocol and spore-trap device here developed will help in the understanding of the M. roreri dissemination patterns since they can be used to assess the environmental loads of M. roreri spore in cacao fields.

1. Introduction

Frosty pod rot (FPR), caused by the basidiomycete Moniliophthora roreri, is the most prevalent and severe cacao disease in Latin America [1]. This disease causes production losses between 16% and 100% depending on the growing region and agronomic factors [1,2,3]. In Colombia, the production losses derived from FPR are close to 40% but can be 100% in some plantations [4]. FPR exclusively affects the cacao pods, beginning as chlorotic spots on the pod’s exterior, which turn dark brown as the disease progress. In severe diseases, brown spots grow and cover the pods’ surface. Then, pods turn white and powdery as M. roreri mycelia and spores become visible [2,5]. Spore-covered pods can carry about seven billion spores, each capable of initiating a new infection. Understanding how M. roreri spores disseminate is critical for the pathogen’s epidemiology and designing control strategies to mitigate FPR losses [6].
Only a handful of M. roreri studies have evaluated the spore dissemination in the field or the environmental spore loads, and their results are mostly inconclusive [2,5,6,7,8,9]. Still, we have gained some insights. The literature shows that M. roreri environmental spore loads vary in time and space and that climatic variables influence them at different scales [3,5,6,8]. On a small scale, mist, wind, and rain are critical since they move M. roreri spores away from the inoculum source (i.e., sporulated pod) [10]. Multiple evaluations have shown that FPR incidences and M. roreri spore loads decrease as they move away from the inoculum source until they plateau and remain at low levels [5,7]. These low levels of spore loads are critical for M. roreri disease cycle since they constitute a background inoculum, always present in cacao plantations and ready to initiate an FPR infection [4,5,7]. The distance from the inoculum source at which M. roreri spore loads plateau is unclear. Some studies suggest that spores can travel more than one kilometer without reaching this plateau, while others indicate distances below 375 m [4,5,7]. It is also unknown whether the spore loads will eventually drop to zero at farther distances.
Inconsistencies are also found in studies addressing the M. roreri spore dissemination and environmental spore loads at larger scales. For example, two studies evaluating the daily spore load variation found that the highest concentration of M. roreri spores occurred around noon [5,8], while another found that it occurred at night [11]. On a larger temporal scale, some studies have found that dry months with relatively high temperatures (close to 30 °C) favor the long-distance spread of the pathogen and relate to increased spore loads in the environment [2,5,8,9,11]. However, this association was weak since it was supported by noisy data [5,8].
The inconsistencies in the M. roreri literature regarding spore dissemination and environmental spore loads might come from the use of outdated methods. Half of the evaluations are nearly three decades old [5,7,8], and most used spore traps and microscopy to collect, identify and quantify spores [5,8,11]. This approach might be appropriate for some fungal pathogens [12]. However, M. roreri spores have variable shapes and sizes due to their conidiogenetic process [11,13]. Therefore, using microscopy to identify and quantify them can lead to errors. An alternative to microscopy is to grow spores in spore traps in culture media and quantify colonies [14]. M. roreri colonies can take several weeks to develop and there is no culture media specific to M. roreri. Therefore, growing trapped spores in culture media is also not feasible for M. roreri since it is time consuming and colonies can be overgrown by other fungi in the environmental samples [15].
Quantitative PCR (qPCR) is a fast and reliable alternative to microscopy and colony culture. Several studies have successfully coupled spore traps with qPCR to analyze the environmental spore loads of several plant pathogens [16,17,18,19], but none have used it for M. roreri. This study aimed to develop a technique coupling spore traps with qPCR for detecting and quantifying M. roreri spores. Such a technique could facilitate future studies evaluating the environmental M. roreri spore loads in cacao plantations. During this study, we developed a qPCR protocol specific to M. roreri, which was validated following the MIQE Guidelines [20]. Then, we used this protocol to detect and quantify M. roreri spores in suspensions and spore traps. Finally, we describe a spore trap device designed for carrying the spore traps in the cacao fields. The qPCR protocol and spore trap device here develop are useful for the understanding of the M. roreri epidemiology since they will be used in further evaluations to asses the M. roreri spore loads in cacao plantations with FPR prevalence.

2. Material and Methods

2.1. Fungal Strains and Cultures

The M. roreri strains used in this study were isolated from cocoa pods with late FPR symptoms collected from commercial farms in representative cacao-growing regions in Colombia (Table S1). Specifically, we hit the symptomatic pods over ×0.5 potato dextrose agar PDA (OXOID, Cheshire, UK) plates supplemented with kanamycin (Thermo Fisher Scientific, Boston, MA, USA) at 50 μg/mL to release M. roreri spores. Plates were incubated at 30 °C for three days. Single-germinated spores were transferred to plates containing malt extract agar (MEA) (OXOID, Cheshire, UK) using a needle and a stereomicroscope Discovery V12 (Zeiss, Germany). Then, they were incubated at 30 °C for nearly one month (the time required by the colonies to grow and sporulate). Spores were washed off MEA plates with sterile 20% glycerol (Thermo Fisher Scientific, Boston, MA, USA) and stored at −80 °C as 20% glycerol stocks until needed.
We attempted to isolate Moniliophthora perniciosa from cacao branches with witches’ broom symptoms and fungal signs without success. Therefore, the M. perniciosa DNA was extracted from a basidiocarp collected from one of the commercial farms sampled for M. roreri isolations (Table S1). The remaining fungal strains used in these evaluations came from the EAFIT University culture collection, where they were also kept at −80 °C as 20% glycerol stocks (Table S1).
Fungal strains were activated at 30 °C in MEA plates and grown in Sabouraud broth cultures (Merck, NJ, USA) for 48 h at 200 rpm and 30 °C to produce mycelia for DNA extractions. The M. roreri MR2 strain was grown at 30 °C in MEA plates until sporulation to obtain M. roreri spores. Spores were washed off the MEA cultures with 0.05% tween 80 (Merk, NJ, USA) and their concentration was adjusted using a Neubauer chamber (Boeco, Germany) as required. The resulting spore suspensions were used for DNA extraction from spore suspensions and to inoculate spore traps.
The identity of the fungal strains and M. perniciosa DNA were confirmed by analysis of partial regions of the internal transcribed spacer (ITS) of the ribosomal DNA. The ITS fragments were PCR amplified with the ITS1 and ITS4 primers [21] (see PCR amplification). The PCR products were Sanger sequenced using the same primers (ITS1 and ITS4). Sequences were processed, and the taxonomic identity was assigned using the Basic Local Alignment Search Tool (BLAST) and the NCBI database in the platform Geneious Prime (version 2020.2.4, New Zealand) (https://www.geneious.com accessed on 1 December 2022).

2.2. DNA Extractions

We used two DNA extraction methodologies, one for extracting DNA from mycelia, and the other from spore suspensions, spore traps, and M. perniciosa basidiocarp. For the former, the mycelium was harvested from the Sabouraud broth cultures and homogenized using liquid nitrogen, a mortar, and a pestle. Then, the DNeasy PowerSoil kit (Qiagen, Germany) was used to extract DNA from the homogenized mycelium, following the manufacturer’s instructions. For the latter, a modified protocol published elsewhere was implemented [22]. For spores suspensions, 1 mL of M. roreri spore suspension containing 2.9 × 10⁶, 2.9 × 10⁵, or 2.9 × 10⁴ spores per ml was placed in 50-mL falcon tubes and centrifugated at 4500 rpm for 10 min to collect the spores. For M. roreri spores in spore traps, 1 mL of the same spore suspension was spread on spore traps, consisting of 2.5 cm × 6.5 cm sections of crystal-clear adhesive tape (Tesa, Switzerland) attached to microscopy slides with the sticky side facing outwards (Figure S1). Spore traps were air-dried, cut into 0.7 cm × 0.7 cm pieces to facilitate DNA extraction, and placed in 50-mL falcon tubes. For M. perniciosa basidiocarp, 100 mg of fresh-weight tissue was placed in 50 mL falcon tubes. Ballotini beads of 4- and 2-mm diameter (~3 mL) were added to the tubes, and samples were mechanically disrupted six times for 30 s using a vortex (Labnet S0200 Model VX-200 Vortex Mixer) at maximum speed, with submersion in liquid nitrogen between disruption cycles to avoid DNA degradation.
Five mL of lysis buffer, containing 100 mM Tris pH 8.0 (PanReac, Castellar del Vallès, Spain), 3 M sodium chloride (NaCl) (ProtoKimica, Bogotá, Colombia), 3% (P/V) cetrimonium bromide (CTAB) (Amresco, OH, USA), 20 mM EDTA (PanReac), 1% (P/V) polyvinylpyrrolidone (PVP-40, molecular weight 40,000) (Amresco, OH, USA) and 1% (V/V) β-mercaptoethanol (Amresco, OH, USA), were added to the disrupted samples. Then, they were incubated at 65 °C for 1 h. During this incubation, samples went through disruption cycles of 10 s every 10 min to facilitate spore lysis. An equal volume of chloroform: isoamyl alcohol (24:1) (Sigma-Aldrich, MO, USA) was added and mixed by inversion. Samples were centrifuged for 10 min at 5000 g, and the DNA in the upper aqueous phase was transferred to new 50-mL falcon tubes. Here, ×0.1 volumes of 3 M sodium acetate pH 5.2 (Amresco, OH, USA) and ×0.66 volumes of cold isopropanol (ITW Reagents, IL, USA) were added and mixed by inversion. Tubes were incubated at ×20 °C overnight, and the DNA was precipitated by centrifugation at 15,000× g for 10 min. The DNA pellets were washed twice with 3 mL of 70% ethanol (Sigma-Aldrich, MO, USA) and air-dried. Then, they were resuspended in 50 µL of TE buffer (Bio Basic, Markham, ON, Canada) containing 0.05 mg/mL of RNase A (Thermo Fisher Scientific, Boston, MA, USA) and incubated at 37 °C for 30 min. The RNase A was deactivated at 65 °C for five min, and the DNA suspensions were kept at −20 °C until needed.
The DNA concentration and quality were assessed using a NanoDrop 2000 (Thermo Fisher Scientific spectrophotometer, USA). The DNA integrity was evaluated by electrophoresis using five µL of the extracted DNA in agarose (Amresco, OH, USA) gels at 1%. Gels were run for 90 min at 70 V and visualized using an Enduro GDS gel visualizer (Labnet, NJ, USA). The DNA concentration was adjusted to 3 ng per µL to maintain consistency in the evaluations unless otherwise stated.

2.3. PCR Amplification

Primers in these evaluations targeted ITS regions of the ribosomal DNA, including generic ITS1 and ITS4 primers [23] and M. roreri-specific Mr_ITSF and Mr_ITSR primers (Table S2). For designing the Mr_ITSF and Mr_ITSR primers, we identified ITS regions conserved in M. roreri but no other fungi from the GeneBank, including the close relative M. perniciosa (Table S2). The alignment and primer design used the global alignment with free end gaps and the primer design functionalities of the Geneious prime application (version 2020.2.3). For conventional PCR amplification, 2 µL of the extracted DNA were used in 20 μL reactions of EconoTaq PLUS (Lucigen, WI, USA) with the generic (ITS1 and ITS4) or the specific (Mr_ITSF and Mr_ITSR) primers at 0.5 mM. Thirty-four amplification cycles were carried out in a BIO-RAD T100 Thermal Cycler (Bio-Rad, CA, USA) with an annealing temperature of 57 °C and an extension time of 1 min. The remaining conditions followed the manufacturer’s specifications. The PCR products were visually inspected by loading five µL of the amplification products into agarose gels at 1.2% that were run and visualized as before.

2.4. qPCR Optimization

To establish the best quantitative PCR (qPCR) conditions, we performed two preliminary evaluations, one assessing varying annealing temperatures and another primers concentrations. In these evaluations, the qPCR reactions consisted of 2 µL of the extracted DNA in 10 μL reactions of Universal IT SYBR Green supermix (Bio-Rad, CA, USA) with the Mr_ITSF and Mr_ITSR primers. The evaluations were repeated twice using DNA extracted from the mycelia of M. roreri strains MR1 and MR2 and three technical replicates per sample (Table S1). Three replicates of M. perniciosa basidiocarp DNA and H2O were also included as negative and non-template controls.
The primers’ concentration was set at 0.25 mM for the first evaluation assessing annealing temperatures. The amplification used the CFX96 real-time system (Bio-Rad, CA, USA) with a PCR program consisting of a denaturing step of 3 min at 98 °C followed by 33 cycles of 30 sec at 98 °C, 30 s at annealing temperatures ranging between 55 °C and 64 °C (Table S3), and 15 sec at 77 °C. The DNA was quantified at the end of each cycle, and dissociation curves followed the last cycle following the manufacturer’s specifications. The second evaluation assessing primers concentrations included concentrations between 0.2 mM and 0.4 mM (Table S3). These evaluations used the same qPCR reaction and amplifications program, but the annealing temperature was set at 62 °C, considering the results of the first evaluation.
For both evaluations, the mean and standard deviation (SD) of the cycle thresholds (Ct) were calculated considering the three technical replicates of the two repetitions (n = 6). Differences between Cts means were evaluated using anova followed by a Tukey’s range test with the anova and emmeans functions of the R libraries stats (version 4.0.4) and emmeans (version 1.8.0) [24,25]. As for the PCR products, qPCR products were visually inspected in agarose gels at 1.2%. Dissociation curves were also considered. A qPCR reaction was considered only when they had a single band in the gels and single-peak dissociation curves.

2.5. qPCR Characterization and Validation

The reactions and amplifications for the qPCR characterization and validation used primer concentrations of 0.3 mM and 37 cycles with an annealing temperature of 62 °C, considering the results of the qPCR optimization. The remaining factors were kept the same unless otherwise stated, including the two repetitions using three technical replicates per evaluation, which were analyzed as before, and including negative (M. perniciosa DNA) and non-template (H2O) controls. To assess the specificity of the qPCR, we used 6 ng (2 µL at 3 ng/µL) of DNA extracted from the mycelia of M. roreri and non-M. roreri strains and M. perniciosa basidiocarp (Table S1).
The qPCR efficiency was calculated using a standard-curve analysis [20,26]. Specifically, Ct values were estimated for serial dilutions (×1/10n) of the DNA extracted from the mycelia of M. roreri strain MR2 with concentrations between 0.0003 and 30 ng per μL. A linear model was used to correlate Ct values with the logarithm with base ten (log10) of the DNA concentrations, assuring that the model had no deviation from linearity, homogeneity of variance, or normality by visual inspection. The model estimates were used to determine the qPCR efficiency according to Equation (1).
E = ( 10 1 m 1 ) × 100
E denotes the qPCR efficiency, and m is the slope of the linear model [20,26]. These analyses used the function lm of R library stat (version 4.0.4) [23], and the results were visualized using the stat_poly_line and stat_poly_eq functions of the R library ggpmisc (version 0.0.5) and the R library ggplot2 (version 3.3.3) [27]. This evaluation was also repeated twice but used ten technical replicates per sample instead of three. Negative and non-template controls were also included in each qPCR. The dilution with 0.0003 ng of DNA per μL was excluded from the analysis since it was below the linear dynamic range of the qPCR [20,26].
The qPCR’s 95% detection limit (LOD) was calculated using the logit approach [26]. Specifically, the probability of detecting M. roreri in a sample containing M. roreri DNA, i.e., a true positive, was estimated for the same serial dilutions used for the qPCR efficiency estimation (DNA ng/μL between 0.0003 and 30). For this evaluation, a positive qPCR reaction was defined as a qPCR reaction yielding a Ct of at least 30 cycles since non-template and negative controls had Cts over 33. The probabilities of a true positive were fitted into a general linearized model (GLM) using the Logit link function, the binomial error family, and the log10 of the DNA ng (DNA ng between 0.0006 and 60) as the predictor. The GLM was used to estimate the ng of DNA associated with the probability of obtaining a true result 95% of the time (i.e., 95% LOD). This analysis used the GLM and predict functions of the R library stat (version 4.0.4) and the R library ggplot2 (version 3.3.3) for visualization [24,27].
To assess whether the qPCR could detect and quantify DNA from M. roreri spores, we extracted DNA from spore suspensions and spore traps containing 2.9 × 10⁶, 2.9 × 10⁵, and 2.9 × 10⁴ spores. The extracted DNA was used in qPCR reactions as before. In this case, the evaluations were repeated two times (i.e., two qPCR runs), including three biological replicates each with two technical replicates per sample (Table S1). These evaluations also included replicates of serial dilutions (×1/10n) of the DNA extracted from the mycelia of M. roreri strain MR2 with concentrations between 30 and 0.003 ng per μL, as standard curve, and replicates of M. perniciosa basidiocarp DNA and H2O as negative and non-template controls. The Cts of the serial dilutions of strain MR2 were linearly correlated with the log10 of the DNA concentrations. Then, the resulting linear model was used to estimate the DNA ng in the spore suspension and spore trap samples [28]. Then, DNA ng estimates were used to assess the inter and intra-qPCR run variability. This analysis used the lm and predict functions of the R library stat (version 4.0.4) [24].

2.6. Spore Trap Device

All the components of the spore traps devices were acquired from commercial sellers and assembled by the Investigación en Electromagnetismo Aplicado group of the EAFIT University. They included: (1) an Arduino UNO R3 system, (2) an AVR microcontroller, (3) a commercial IP67-ABS box (18 cm × 8 cm × 7 cm), (4) an L298N H-bridge motor driver, a 12 V DC 60 rpm geared motor, a Solar-Powered Systems CN3065, (5) a LiPo 3.7 V 6000 mAh battery, (6) a 1 W 5.5 V Seeed monocrystalline solar panel (170 mA), (7) a DS3231 real-time clock (RTC), (8) an I2C bidirectional bus, (9) SHT31 Sensirion temperature and humidity sensor, (10) an I2C bidirectional bus, and (11) an DM3AT micro-SD connector. The blades carrying the spore traps were custom-made by additive manufacturing using a 3D printer and polylactic acid.

3. Results

The initial step for developing a qPCR protocol specific to M. roreri was to design a pair of M. roreri-specific primers. We decided to focus on the ITS region of the ribosomal DNA, as sequences for this region are the most abundant for M. roreri and closely related fungi. Sequence alignment of fungal ITS revealed potential primer-binding sites that distinguished between M. roreri and other fungi, including the close relative M. perniciosa. Therefore, a pair of primers (Mr_ITSF and Mr_ITSR) was designed to target these regions. Several single-nucleotide polymorphisms (SNPs) were found between M. roreri and fungi from different genera in these primer-binding sites, but only a few between M. roreri and M. perniciosa. Despite their lower SNP number, the Mr_ITSF and Mr_ITSR primers likely distinguished between both Moniliophthora species since SNPs were located towards the primers’ 3′-end (Figure S2). Therefore, we decided to continue with this primers pair.
As expected, Mr_ITSF and Mr_ITSR primers distinguished M. roreri from other fungi, including M. perniciosa, in the conventional PCR assay. While the generic primers (ITS1 and ITS4) amplified nearly 550 bp ITS segments in all evaluated fungi (Figure S3, lanes 2–10), the Mr_ITSF and Mr_ITSR primers amplified about 120 bp ITS fragments only from M. roreri strains MR1 and MR2 (Figure S3, lanes 12–20). Therefore, we proceeded with the qPCR evaluations and the optimization of the qPCR conditions. In qPCR, Mr_ITSF and Mr_ITSR primers behaved best at concentrations of 0.3 mM and with an annealing temperature of 62 °C. Among the temperatures and concentrations evaluated, these conditions yielded the lowest Cts for the DNA suspensions of M. roreri strains MR1 and MR2 while yielding Cts above 33 for the non-template and negative controls (Table S2). They also generated a single peak around 80 °C in the dissociation curves (Figure S4A) and a single band in the agarose gel (Figure S4B). Considering the above, we decided to characterize and validate the M. roreri qPCR using the Mr_ITSF and Mr_ITSR primers at 0.3 mM, an annealing temperature of 62 °C, and 37 amplification cycles.

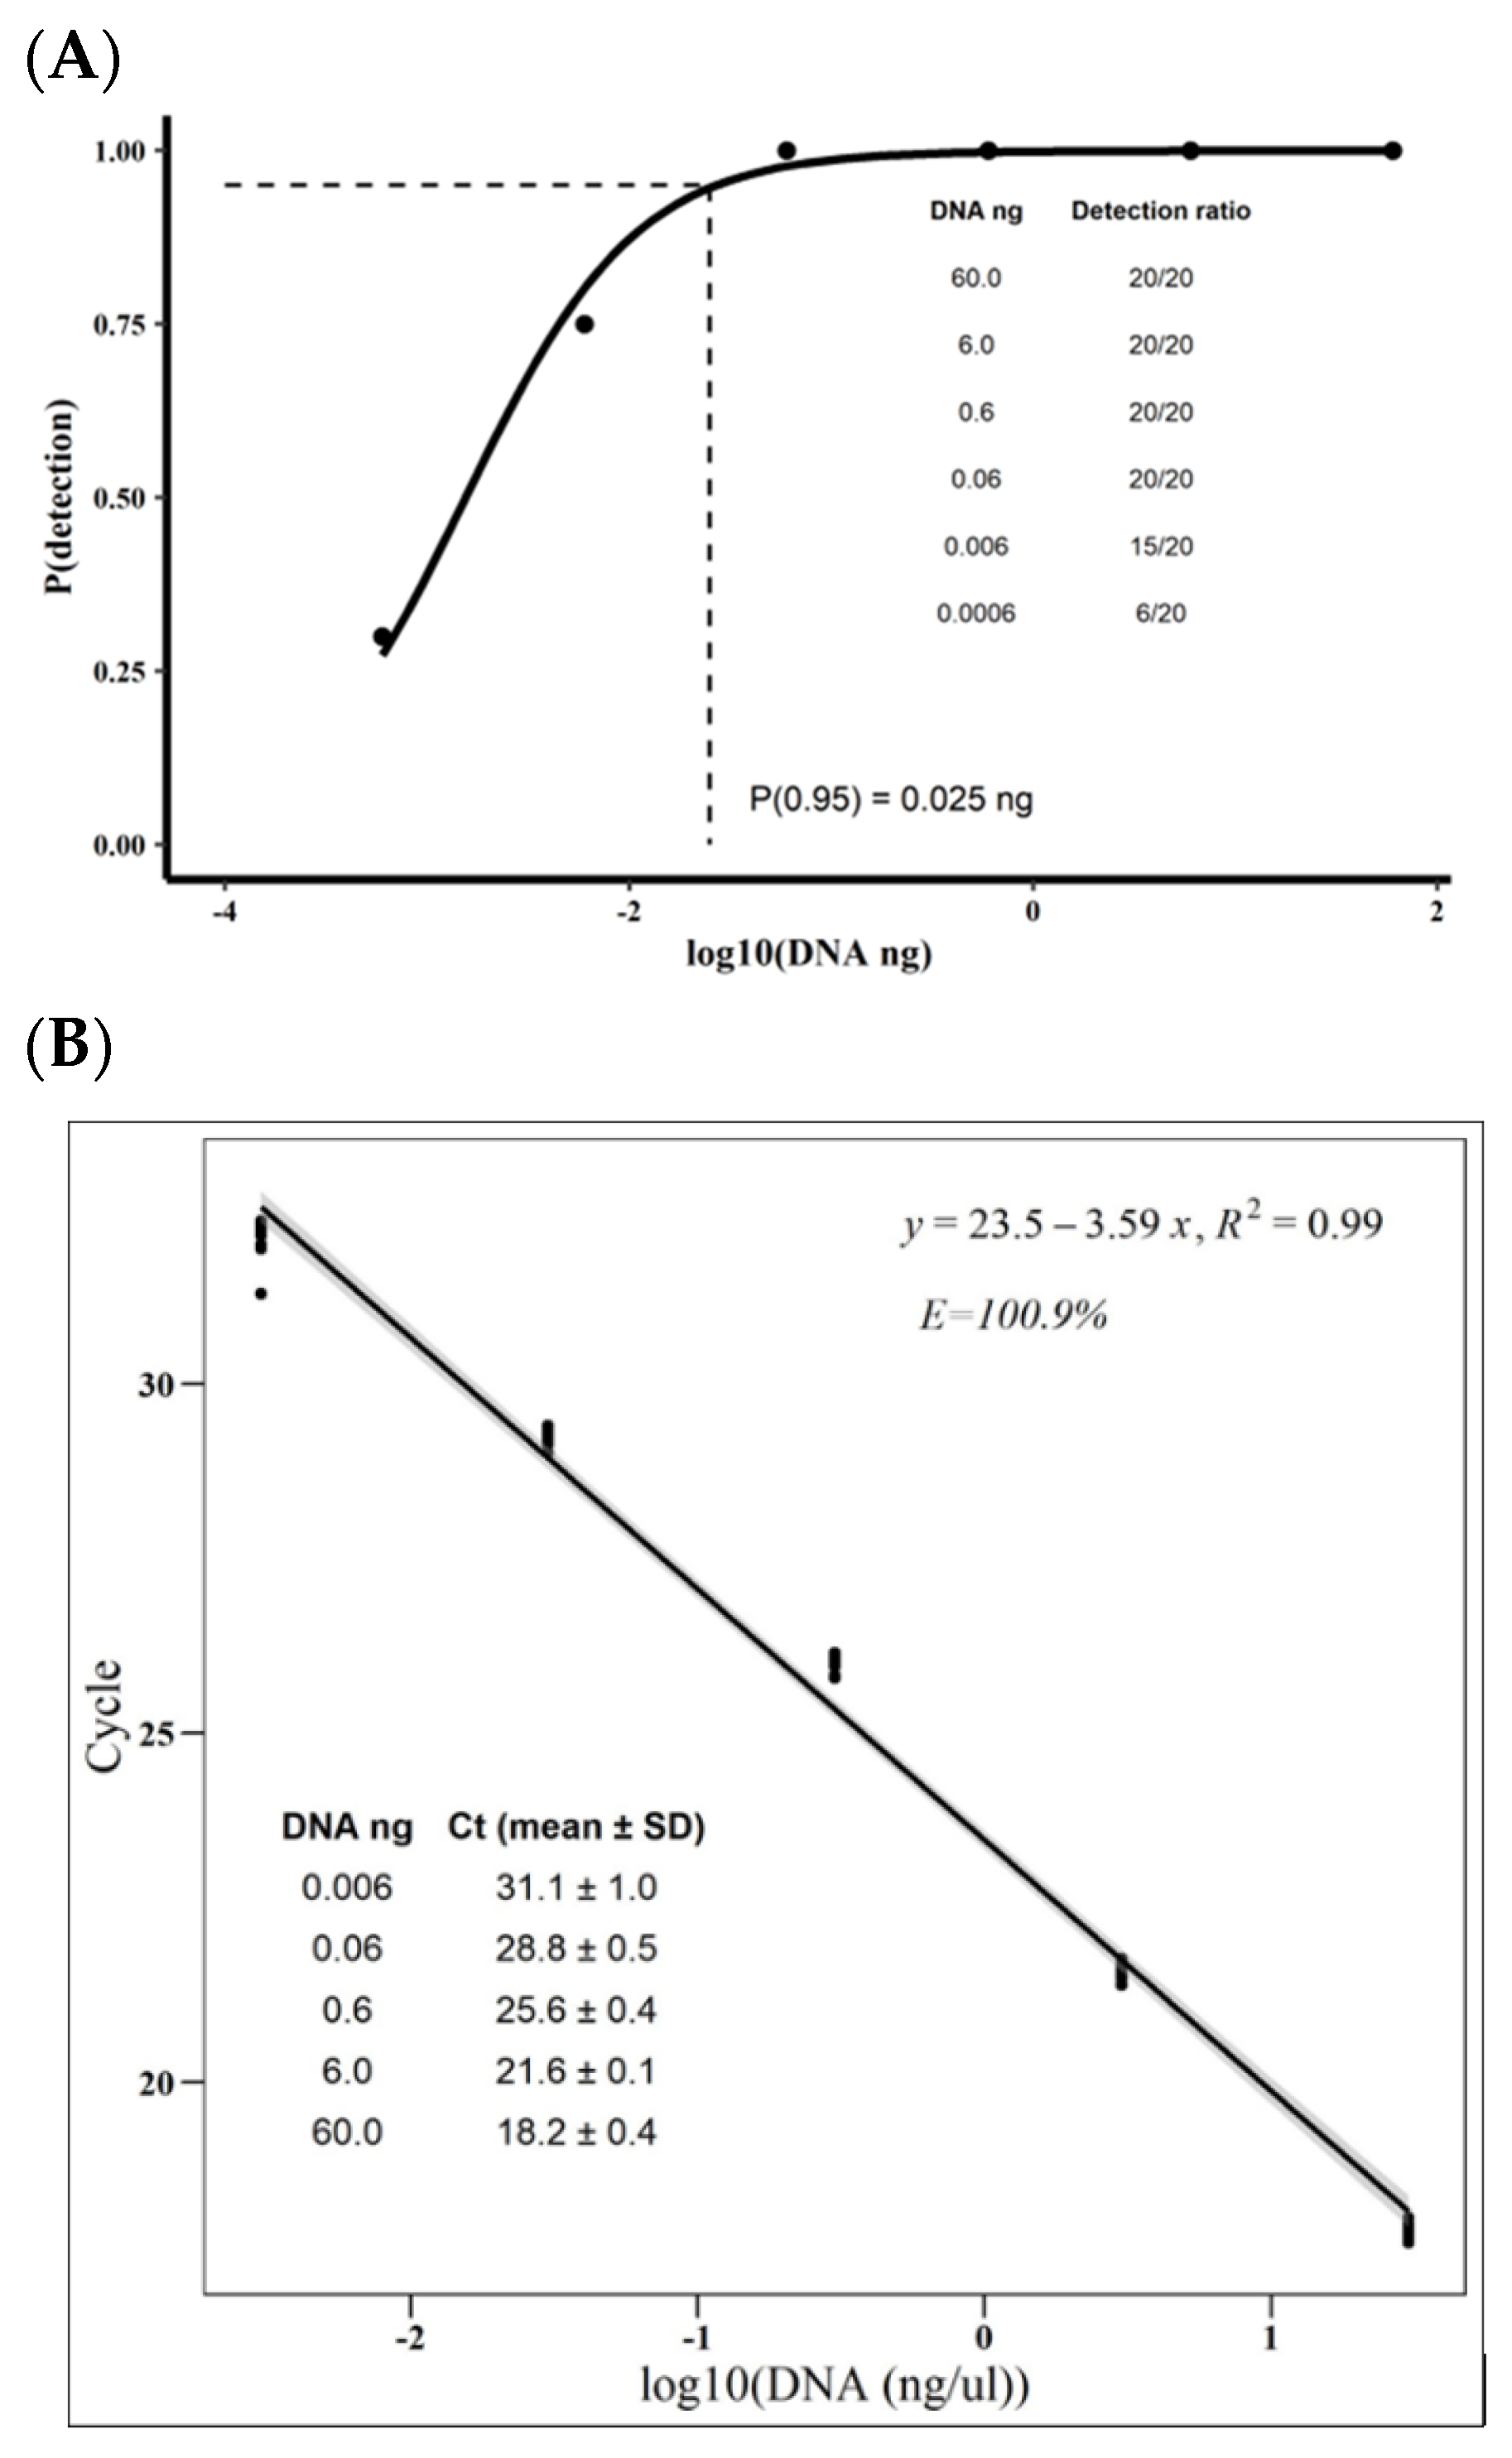
3.1. Moniliophthora roreri qPCR’s Specificity, Efficiency, Limit of Detection, and Presicion

The diversity of M. roreri in Colombia is high, and at least five populations have been identified [29,30]. To evaluate whether the qPCR could differentiate different M. roreri strains from other fungi, we used the DNA of M. roreri isolates from representative cacao-growing regions in Colombia. Ct varied widely between M. roreri isolates (nearly 9 cycles, from 15 to 24 cycles) (Table 1). This variation was unexpected since the qPCR reactions used comparable DNA amounts (6 ng). Despite the variation, the qPCR differentiated the M. roreri isolates from other fungi since all of them had higher Cts (>32 cycles, p-value < 0.05) (Table 1). Furthermore, strong 120 bp-bands were evident in the agarose gels only for the qPCR reactions of the M. roreri isolates (Figure S5). These results indicate that the qPCR can detect M. roreri isolates from several Colombian cacao-growing regions and distinguish them from other fungi, at least among the evaluated fungi.
Considering that the sensitivity and accuracy of the qPCR depend on the amount of the target in the qPCR reactions [20], we assessed the qPCR using different amounts of DNA of M. roreri strain MR2. We decided to use strain MR2 since it was among those with the higher Cts in the specificity evaluations (Table 1). The probability of the qPCR detecting M. roreri DNA (true positive) formed a sigmoid curve against the log10 of DNA ng, with the probability being 1 for over 0.06 ng of M. roreri DNA and closer to 0 as the ng of DNA dropped (Figure 1A). According to the glm correlating qPCR-detection probability with the log10 of the M. roreri DNA (Table S4), the qPCR’s 95% limit of detection (95% LOD) was 0.025 ng of M. roreri DNA (Figure 1 A), indicating that the qPCR should accurately detect M. roreri at least 95% of the time in samples with at least 0.025 ng of M. roreri DNA. The qPCR could detect fewer ng of DNA, but the risk of a false negative increased as the amount of DNA decreased. For example, the qPCR detected M. roreri DNA in 75% of the samples with 0.006 ng of M. roreri DNA. In contrast, it detected M. roreri DNA only in 30% of the samples containing 0.0006 ng of M. roreri DNA.
Regarding the accuracy and precision, the qPCR’s linearity range was between 0.006 and 60 ng of DNA, as indicated by the correlation between Ct values and the log10 of the serial dilutions of M. roreri DNA (R2: 0.98). In the linearity range, the Ct values lowered around 3.3 cycles for each ×10 increase in the DNA load, indicating a qPCR efficiency (E) of 100.9% (Figure 1B). DNA amounts below this range (0.0006 ng) compromised the lm fitting and the qPCR efficiency (R2: 0.96 and E: 115.4%) (Figure S6), showing that the reliability of the technique drops below this range. Consequently, the Ct variability was most pronounced at the lower limit of the qPCR linearity range (0.006 ng of DNA). For example, while 0.006 ng of DNA had a mean Ct of 31.1 with a standard deviation (SD) of 1, 0.6 had a mean Ct of 25.6 and an SD of 0.4 (Figure 1B).
The qPCR properly and consistently estimated the ng of M. roreri DNA in samples with amounts of DNA within the linearity range. The estimates for suspensions containing 6 and 0.6 ng of M. roreri DNA were 6.51 ± 0.27 ng and 0.80 ± 0.11 ng, showing coefficients of variation (CV) between and within qPCR runs below 14% (Table 2).

3.2. Moniliophthora roreri Spores Quantification

All of the above showed that the qPCR reliably detected at least 0.025 ng M. roreri DNA and could accurately quantify ng of M. roreri DNA between 0.006 and 60 ng. Now, we wondered if the qPCR was sensitive enough to detect and quantify DNA from M. roreri spore samples. For this purpose, we modified a previously published protocol [22] to extract DNA from spore suspension and spore traps containing 2.9 × 10⁶, 2.9 × 10⁵, and 2.9 × 10⁴ M. roreri spores. Spore suspensions with 2.9 × 10⁶ and 2.9 × 10⁵ spores yield 7.5 ± 3.9 (CV = 52.0%) and 1.13 ± 0.24 (CV = 21.2%) μg of total DNA. On the other hand, spore traps with 2.9 × 10⁶ spores yield 0.13 ± 0.01 ug (CV = 7.7%) of total DNA, nearly ×1/58 lower than that of spore suspensions with the same spore load. The amount of DNA extracted from the remaining samples, including spore suspensions with 2.9 × 10⁴ spores, was too low to be quantified by NanoDrop. The results above showed that our protocol successfully extracted DNA from M. roreri spores in suspension and spore traps. However, the extraction was less efficient for spores in the spore traps and the yield was low for the samples with low spore loads.
Regarding the detection and quantification of DNA from M. roreri spore samples, all the estimates were above the 0.025 ng 95% LOD and within the 0.006 ng and 60 ng linear range of the qPCR. The exception was the estimates of spore suspensions with 2.9 × 10⁶ spores which were above the linearity range (Table 2). As expected, the estimated ng of DNA decreased with the spore loads and was higher (nearly ×10) for spore suspension than for spore traps. Overall, the estimates for spore suspensions with 2.9 × 10⁶, 2.9 × 10⁵, and 2.9 × 10⁴ spores were 81.83 ± 25.27, 10.9 ± 3.76, 0.56 ± 0.06 ng of estimated DNA compared with 8.36 ± 3.55, 0.35 ± 0.20, 0.07 ± 0.04 ng of estimated DNA for spore traps with the same spore loads (Table 2). Nonetheless, these estimates had a high variability compared with DNA suspensions, with the variation between the biological replicates in the same qPCR run (within-qPCR run CV) being particularly high. While the within-qPCR run CVs varied from 12% to 173% (vs. <13% for the DNA suspension estimates), the between-qPCR runs CVs from 10% to 57% (vs. <14% for the DNA suspension estimates) (Table 2). Despite this variation, these results showed that the qPCR can detect and quantify DNA from M. roreri spores in suspensions and spore traps. However, its variability must be considered when evaluating the M. roreri spore loads in the cacao fields.

3.3. Spore Trap Devices

This study aimed to develop a technique to evaluate the M. roreri spore loads in commercial cacao plantations. Therefore, we developed a homemade-spore-trap device to carry the spore traps for field evaluations. The spore-trap devices consist of an Arduino UNO R3 system with an AVR microcontroller encapsulated in a commercial IP67-ABS box of 18 cm × 8 cm × 7 cm. The Arduino UNO system has an L298N H-bridge motor driver connected to a PWM output, which controls a 12 V DC 60 rpm geared motor moving 20 cm-long blades carrying the spore traps (Figure S1). The spore-trap devices are powered by a Solar-Powered Systems CN3065 which is connected to a LiPo 3.7 V 6000 mAh battery and a 1 W 5.5 V Seeed monocrystalline solar panel (170 mA). Furthermore, they have a DS3231 real-time clock (RTC) coupled to the Arduino UNO R3 communicating via an I2C bidirectional bus. For collecting environmental data, the devices have SHT31 Sensirion temperature and humidity sensors attached to the I2C bidirectional bus. The data collected are stored in a 32 GB Sandisk memory connected to a DM3AT micro-SD connector and can be downloaded to a computer for its analysis.
The present study did not include the assessment of M. roreri spore loads in the fields. However, the spore-trap device can be used for this purpose since it was custom-made to carry the same spore traps used in the Moniliophthora roreri spores quantification. Further evaluations must validate the spore trap device in the cacao plantations

4. Discussion

Coupling spore traps with pathogen-specific qPCR is a reliable method for detecting and quantifying spores of fungal plant pathogens in the field [16,17,18,19] and could be useful for assessing the M. roreri spore loads in cacao plantations. Therefore, we developed a qPCR protocol to detect and quantify M. roreri DNA. According to our estimations, this method can distinguish M. roreri from other fungi and detect down to 0.025 ng of M. roreri DNA (95% LOD). It can also reliably quantify between 0.006 ng and 60 ng of M. roreri DNA.
While developing a qPCR protocol for detecting and quantifying spores of fungal plant pathogens, the specificity is crucial since air-born spores of several fungi, including plant pathogenic and non-pathogenic fungi, populate the crops environment [16,26,31,32]. Our qPCR protocol was successful in distinguishing M. roreri from other fungi, including its close relative, M. perniciosa [4]. Distinguishing between the Moniliophthora species is critical since M. perniciosa is also a cacao pathogen responsible for the Witches’ broom [33]. In Colombia, Witches’ broom (WBD) is a disease secondary to FPR, as its derived losses are lower [4]. However, in other countries such as Brazil, where FPR was only recently introduced, WBD is more relevant than FPR [3]. Failing to distinguish between M. roreri and M. perniciosa can lead to false positives and an overestimation of the M. roreri spore load.
Besides being specific, a method for assessing spore loads of plant pathogenic fungi must be sensitive and precise since spore loads are low in the field, meaning it must have low LOD and CV [26]. The 0.025 ng 95% LOD of our method suggests that it can reliably detect spore loads of at least 1.2 × 10⁴ spores, supposing mononucleated spores with a single ITS copy and a genome size close to 50 Mb [31,32]. However, the number of spores is probably lower since fungi have several copies of ribosomal DNA (between 14 and 1442 copies) [34], therefore ITS. The number of ribosomal DNA copies in M. roreri is unknown since, to our knowledge, there are no studies have addressed this issue. However, the LOD of our qPCR protocol is in line with similar evaluations in other systems [32,35].
Regarding the precision, the qPCR protocol yielded consistent estimates from M. roreri DNA suspensions (between and within qPCR runs CV close below 14%). However, the estimates for DNA extracted from M. roreri spores in suspension and spore traps were more variable (CV between 12% and 173%). The higher CVs for spore samples compared with DNA suspension are likely derived from the complexity of the biological sample. Extracting DNA from fungal spores is not trivial, especially from spore traps [26,28]. We used a modified protocol for extracting DNA from M. roreri spore samples trying to overcome some of the difficulties associated with the complexity of the samples [22], and despite being able to extract DNA from the spores, the yields varied from one sample to another and from one experiment to another. Despite the variation, the DNA estimates for most roreri spore samples were above the 95% LOD and within the linear range of the qPCR, meaning that our methods can detect and measure the DNA from spore suspension and spore traps containing at least 2.9 × 10⁴ M. roreri spores. Therefore, it could be used to assess the M. roreri spore loads in cacao plantations. However, the variability of the method must be considered and can be reduced by increasing the sample size.
We designed a spore-trap device to carry the spore traps, but this device still requires validation. Therefore, further evaluations must validate the spore trap device and the qPCR protocol in cacao plantations. We expect our method (coupling the spore trap device and the qPCR protocol) to be sensitive enough to assess the M. roreri spore loads in the field since evaluations using similar methods in other systems have reported between 1.0 and 1.0 × 10⁵ spores or DNA copies per m3 of air [18,19,36]. To our knowledge, no comparable analyses have been conducted for M. roreri in cacao fields. However, an older study using passive spore traps and microscopy detected between 30 and 144 M. roreri spores per cm2 of spore trap in an 8-h evaluation period [5]. These values are lower than those in our evaluations (i.e., 2.9 × 10⁴ M. roreri spores), and it is hard to predict if the sensitivity of our method will be enough to detect the M. roreri spore loads in the cacao plantations due to the methodology differences.
Even though our study was limited to laboratory evaluations, we consider that our method has great potential for estimating natural M. roreri spore loads in cacao crops. Following some validation, future work can use the spore-trap device and the M. roreri-specific qPCR protocol to estimate environmental M. roreri spore loads and evaluate how they are affected by the environment since the spore-trap device records climatic variables.

Supplementary Materials

The following supporting information can be downloaded at: https://www.mdpi.com/article/10.3390/jof9010047/s1; Figure S1. Spore-trap device developed for assessing the Moniliophthora roreri spore load in cacao plantations. (A) shows a picture of the device with a spore trap by itself and in the blade (detail). (B) is a block diagram showing the main components of the spore-trap device; Figure S2. Sequence alignment of the ITS sequences of the Moniliophthora roreri strains MR2 (OM056946) and MCA2954 (Genbank DQ222927) and Moniliophthora perniciosa strain COAD2616 (Genbank MK785158) and basidiocarp (Genbank OM056947) showing the binding sites of the Mr_ITSF and Mr_ITSR primers; Figure S3. Agarose gel showing the PCR products for the ITS fragments of Moniliophthora roreri and other fungi amplified with the ITS1 and ITSR4 (Lanes: 1–10) and the Mr_ITSF and Mr_ITSR primers (Lanes: 11–20). Lanes 1 and 11: 100 bp ladder. Lanes 2 and 12: M. roreri strain MR1. Lanes 3 and 13: M. roreri strain MR2. Lanes 4 and 14: M. perniciosa basidiocarp. Lanes 5 and 15: Diaporthe sp. EAFIT-F0056. Lanes 6 and 16: Alternaria sp. EAFIT-F0059. Lanes 7 and 17: Colletotrichum sp. EAFIT-F0066. Lanes 8 and 18: Pleurotus sp. Lanes 9 and 19: Ganoderma sp. Lanes 10 and 20: Non-template control; Figure S4. Representative images showing the dissociation curves (A) and agarose gel with the amplification products (B) of the qPCR targeting the ITS of Moniliophthora roreri with the Mr_ITSF and Mr_ITSR primers. The curves and gel belong to one of the experiments assessing different primers concentrations. In B, Lane 1: 100 bp ladder. Lane 2–5: 0.2 mM and 0.2 mM; Lane 6–9: 0.3 mM and 0.3 mM; and Lane 10–13: 0.4 mM and 0.3 mM (Mr_ITSF and Mr_ITSR primers concentration, respectively). Also, Lanes 2, 6, and 10: M. roreri strain MR1; Lanes 3, 7, and 11: M. roreri strain MR2; Lanes 4, 8, and 12: M. perniciosa basidiocarp; Lanes 5, 9, and 13: Non-template control; Figure S5. Agarose gel showing the qPCR products of the ITS fragments of Moniliophthora roreri and other fungi amplified with the Mr_ITSF and Mr_ITSR primers. Lanes 1 and 12: 100 bp ladder. Lanes 2: M. roreri strain MR1. Lane 3: M. roreri strain MR2. Lane 4: M. perniciosa basidiocarp. Lane 5: Pleurotus sp. Lane 6: Ganoderma sp. Lane 7: Alternaria sp. EAFIT-F0059. Lane 8: Diaporthe sp. EAFIT-F0056. Lane 9: Colletotrichum sp. EAFIT-F0066. Lane 10: M. roreri strain MR30. Lane 11: M. roreri strain MR33. Lane 13: M. roreri strain MR28. Lane 14: M. roreri strain MR48. Lane 15: M. roreri strain MR38. Lane 16: M. roreri strain MR98. Lane 17: M. roreri strain MR68. Lane 18: M. roreri strain MR108. Lane 19: M. roreri strain MR124. Lane 20: M. roreri strain MR126. Lane 21: M. roreri strain MR136. Lanes 22: Non-template control; Figure S6. Correlation between the qPCR threshold cycle (Ct) and the logarithm with base 10 (log10) of serial dilutions (×1/10n) of the DNA extracted from the mycelia of M. roreri strain MR2 with concentrations between 30 and 0.0003 ng per μL were evaluated in two separated qPCR, each containing ten technical replicates per dilution. Non-template (H2O) and negative (M. perniciosa basidiocarp DNA) controls were included in every qPCR. A) shows the correlation between the qPCR threshold cycle (Ct) and the log10 of the DNA concentration of the M. roreri serial dilutions. The points (n = 20 per log10 of DNA concentration) represent each sample. The line and the gray area represent the prediction and standard error of the linear model (lm), respectively; Table S1. Fungal strains used in this study; Table S2. Primers and fungal ITS sequences used in this study; Table S3. qPCR results for the evaluations assessing melting different temperatures and primers concentrations; Table S4. Estimates for the general linearized model (glm) with the logit function and the binomial family error correlating thedetection probability of the qPCR with the logarithm with base 10 (log10) of Moniliophthora roreri DNA in serial dilutions.

Author Contributions

Conceptualization, J.C.Á. and S.M.-L.; Methodology, J.C.Á. and S.M.-L.; Formal Analysis, D.L.J.-Z. and S.M.-L.; Investigation, D.L.J.-Z., M.Q.-P., M.Q.-Y., A.M.-T., J.C.Á. and S.M.-L.; Resources, J.C.Á.; Data Curation, D.L.J.-Z. and S.M.-L.; Writing—Original Draft Preparation, S.M.-L.; Writing—Review & Editing, D.L.J.-Z., S.M.-L. and J.C.Á.; Supervision, A.M.-T., J.C.Á. and S.M.-L.; Project Administration, J.C.Á.; Funding Acquisition, J.C.Á. All authors have read and agreed to the published version of the manuscript.

Funding

This work was supported by EAFIT University (Grant No. 954-000005, Tecnologías Convergentes de Cacao), Colombian Ministry of Science, Technology, and Innovation (MINCIENCIAS) through a postdoctoral grant (code 848-2019).

Institutional Review Board Statement

The study was conducted in accordance with the Declaration of Helsinki, and approved by the Institutional Review Board (or Ethics Committee) o EAFIT University (protocol code 082019 and date of approval of 19 August 2019).

Informed Consent Statement

Not applicable.

Data Availability Statement

The authors declare that the data supporting the findings of this study are available within the article.

Acknowledgments

The authors are thankful for the financial support of this project from the EAFIT University, MINCIENCIAS and the Colombian National Government Scholarship (Ser Pilo Paga). Casa Luker Company, for allowing us access to their farms where did the field experiment and for providing us with the cacao samples, as well as to Eng. Juan Pablo Gil for helping us in the field experiment.

Conflicts of Interest

The authors declare this research was conducted without any commercial or financial relationships that could be construed as a potential conflict of interest.

References

  1. Evans, H.C.; Holmes, K.A.; Phillips, W.; Wilkinson, M.J. What’s in a Name: Crinipellis, the Final Resting Place for the Frosty Pod Rot Pathogen of Cocoa? Mycologist 2002, 16, 148–152. [Google Scholar] [CrossRef]
  2. Leandro-Muñoz, M.E.; Tixier, P.; Germon, A.; Rakotobe, V.; Phillips-Mora, W.; Maximova, S.; Avelino, J. Effects of Microclimatic Variables on the Symptoms and Signs Onset of Moniliophthora roreri, Causal Agent of Moniliophthora Pod Rot in Cacao. PLoS ONE 2017, 12, e0184638. [Google Scholar] [CrossRef] [PubMed] [Green Version]
  3. Jiménez, D.L.; Alvarez, J.C.; Mosquera, S. Frosty Pod Rot: A Major Threat to Cacao Plantations on the Move. Trop. Plant Pathol. 2021, 47, 187–200. [Google Scholar] [CrossRef]
  4. Jaimes, Y.; Aranzazu, F. Manejo De Las Enfermedades Del Cacao (Theobroma cacao L.) En Colombia, Con Énfasis En Monilia (Moniliophthora roreri); Corporacion Colombiana de Investigacion Agropecuaria—Corpoica: Bogotá, Colombia, 2010; ISBN 978-958-740-034-2. [Google Scholar]
  5. Ram, A. Biology, Epidemiology and Control of Moniliasis (Moniliophthora Roreri) of Cacao. Ph.D. Thesis, Imperial College of Science and Technology, University of London, London, UK, 1989. [Google Scholar]
  6. Torres de la Cruz, H. Temporal Progress and Integrated Management of Frosty Pod Rot (Moniliophthora Roreri) of Cocoa in Tabasco, Mexico. J. Plant Pathol. 2011, 93, 31–36. [Google Scholar]
  7. Merchán Vargas, V.M. Avances de la Investigación de la Moniliasis del Cacao en Colombia; El Cacaotero Colombiano; Federación Nacional de Cacaoteros—FEDECACAO: Bogotá, Colombia, 1981; pp. 26–41. [Google Scholar]
  8. Meléndez, L. Microambiente, Cantidad de Esporas en el Aire e Incidencia del Hongo Miniliopthora roreri (Cif & Par). Evans et al. Bajo Tres Sistemas de Manejo de Sombra Leguminosas en Cacao (Theobroma cacao); Tesis de Maestria; CATIE: Turrialba, Costa Rica, 1993. [Google Scholar]
  9. Ortega Andrade, S.; Páez, G.T.; Feria, T.P.; Muñoz, J. Climate change and the risk of spread of the fungus from the high mortality of Theobroma cocoa in Latin America. Neotrop. Biodivers. 2017, 3, 30–40. [Google Scholar] [CrossRef]
  10. Sánchez Mora, F.D.; Garcés Fiallos, F.R. Moniliophthora roreri (Cif y Par) Evans et al. in the crop of cocoa. Sci. Agropecu. 2012, 3, 249–258. [Google Scholar] [CrossRef]
  11. Leandro-Muñoz, M. Efecto de los Factores Macro y Microclimáticas y las Características Productivas del Cacao Sobre la Epidemiología de la Moniliasis; CATIE: Turrialba, Costa Rica, 2011. [Google Scholar]
  12. Zhang, Z.; Zhu, Z.; Ma, Z.; Li, H. A Molecular Mechanism of Azoxystrobin Resistance in Penicillium digitatum UV Mutants and a PCR-Based Assay for Detection of Azoxystrobin-Resistant Strains in Packing- or Store-House Isolates. Int. J. Food Microbiol. 2009, 131, 157–161. [Google Scholar] [CrossRef]
  13. Díaz-Valderrama, J.R.; Aime, M.C. The Cacao Pathogen Moniliophthora roreri (Marasmiaceae) Produces Rhexolytic Thallic Conidia and Their Size Is Influenced by Nuclear Condition. Mycoscience 2016, 57, 208–216. [Google Scholar] [CrossRef] [Green Version]
  14. Úrbez-Torres, J.R.; Battany, M.; Bettiga, L.J.; Gispert, C.; McGourty, G.; Roncoroni, J.; Smith, R.J.; Verdegaal, P.; Gubler, W.D. Botryosphaeriaceae Species Spore-Trapping Studies in California Vineyards. Plant Dis. 2010, 94, 717–724. [Google Scholar] [CrossRef] [Green Version]
  15. Bailey, B.A.; Ali, S.S.; Strem, M.D.; Meinhardt, L.W. Morphological Variants of Moniliophthora roreri on Artificial Media and the Biotroph/Necrotroph Shift. Fungal Biol. 2018, 122, 701–716. [Google Scholar] [CrossRef]
  16. Schweigkofler, W.; O’Donnell, K.; Garbelotto, M. Detection and Quantification of Airborne Conidia of Fusarium circinatum, the Causal Agent of Pine Pitch Canker, from Two California Sites by Using a Real-Time PCR Approach Combined with a Simple Spore Trapping Method. Appl. Environ. Microbiol. 2004, 70, 3512–3520. [Google Scholar] [CrossRef]
  17. Quesada, T.; Hughes, J.; Smith, K.; Shin, K.; James, P.; Smith, J. A Low-Cost Spore Trap Allows Collection and Real-Time PCR Quantification of Airborne Fusarium circinatum Spores. Forests 2018, 9, 586. [Google Scholar] [CrossRef] [Green Version]
  18. Dvořák, M.; Janoš, P.; Botella, L.; Rotková, G.; Zas, R. Spore Dispersal Patterns of Fusarium circinatum on an Infested Monterey Pine Forest in North-Western Spain. Forests 2017, 8, 432. [Google Scholar] [CrossRef] [Green Version]
  19. Chandelier, A.; Helson, M.; Dvorak, M.; Gischer, F. Detection and Quantification of Airborne Inoculum of Hymenoscyphus pseudoalbidus Using Real-Time PCR Assays. Plant Pathol. 2014, 63, 1296–1305. [Google Scholar] [CrossRef]
  20. Bustin, S.A.; Benes, V.; Garson, J.A.; Hellemans, J.; Huggett, J.; Kubista, M.; Mueller, R.; Nolan, T.; Pfaffl, M.W.; Shipley, G.L.; et al. The MIQE Guidelines: Minimum Information for Publication of Quantitative Real-Time PCR Experiments. Clin. Chem. 2009, 55, 611–622. [Google Scholar] [CrossRef] [Green Version]
  21. White, T.J. Amplification and Direct Sequencing of Fungal Ribosomal RNA Genes for Phylogenetics. In PCR Protocols, a Guide to Methods and Applications; Academic Press: San Francisco, CA, USA, 1990; pp. 315–322. [Google Scholar]
  22. Inglis, P.W.; Pappas, M.d.C.R.; Resende, L.V.; Grattapaglia, D. Fast and Inexpensive Protocols for Consistent Extraction of High Quality DNA and RNA from Challenging Plant and Fungal Samples for High-Throughput SNP Genotyping and Sequencing Applications. PLoS ONE 2018, 13, e0206085. [Google Scholar] [CrossRef]
  23. Raja, H.A.; Miller, A.N.; Pearce, C.J.; Oberlies, N.H. Fungal Identification Using Molecular Tools: A Primer for the Natural Products Research Community. J. Nat. Prod. 2017, 80, 756–770. [Google Scholar] [CrossRef]
  24. R Development Core Team. Language and Environment for Statistical Computing: Reference Index; R Foundation for Statistical Computing: Vienna, Austria, 2021; ISBN 978-3-900051-07-5. [Google Scholar]
  25. Lenth, R.V. Emmeans: Estimated Marginal Means, Aka Least-Squares Means. R Package Version 2022, 1, 3. [Google Scholar]
  26. Kralik, P.; Ricchi, M. A Basic Guide to Real Time PCR in Microbial Diagnostics: Definitions, Parameters, and Everything. Front. Microbiol. 2017, 8, 108. [Google Scholar] [CrossRef] [Green Version]
  27. Wickham, H. Ggplot2: Elegant Graphics for Data Analysis; Springer: New York, NY, USA, 2016; ISBN 978-3-319-24277-4. [Google Scholar]
  28. Ruijter, J.M.; Barnewall, R.J.; Marsh, I.B.; Szentirmay, A.N.; Quinn, J.C.; van Houdt, R.; Gunst, Q.D.; van den Hoff, M.J.B. Efficiency Correction Is Required for Accurate Quantitative PCR Analysis and Reporting. Clin. Chem. 2021, 67, 829–842. [Google Scholar] [CrossRef]
  29. Ali, S.S.; Shao, J.; Strem, M.D.; Phillips-Mora, W.; Zhang, D.; Meinhardt, L.W.; Bailey, B.A. Combination of RNAseq and SNP Nanofluidic Array Reveals the Center of Genetic Diversity of Cacao Pathogen Moniliophthora roreri in the Upper Magdalena Valley of Colombia and Its Clonality. Front. Microbiol. 2015, 6, 850. [Google Scholar] [CrossRef] [PubMed] [Green Version]
  30. Phillips-Mora, W.; Aime, M.C.; Wilkinson, M.J. Biodiversity and Biogeography of the Cacao (Theobroma Cacao) Pathogen Moniliophthora roreri in Tropical America. Plant Pathol. 2007, 56, 911–922. [Google Scholar] [CrossRef]
  31. Nicolaisen, M.; West, J.S.; Sapkota, R.; Canning, G.G.M.; Schoen, C.; Justesen, A.F. Fungal Communities Including Plant Pathogens in Near Surface Air Are Similar across Northwestern Europe. Front. Microbiol. 2017, 8, 1729. [Google Scholar] [CrossRef] [PubMed]
  32. Abdullah, A.S.; Turo, C.; Moffat, C.S.; Lopez-Ruiz, F.J.; Gibberd, M.R.; Hamblin, J.; Zerihun, A. Real-Time PCR for Diagnosing and Quantifying Co-Infection by Two Globally Distributed Fungal Pathogens of Wheat. Front. Plant Sci. 2018, 9, 1086. [Google Scholar] [CrossRef]
  33. Bailey, B.A.; Meinhardt, L.W. (Eds.) Cacao Diseases: A History of Old Enemies and New Encounters; Springer: Cham, Switzerland; Heidelberg, Germany; New York, NY, USA, 2016; ISBN 978-3-319-24787-8. [Google Scholar]
  34. Lofgren, L.A.; Uehling, J.K.; Branco, S.; Bruns, T.D.; Martin, F.; Kennedy, P.G. Genome-Based Estimates of Fungal RDNA Copy Number Variation across Phylogenetic Scales and Ecological Lifestyles. Mol. Ecol. 2019, 28, 721–730. [Google Scholar] [CrossRef]
  35. Klosterman, S.J.; Anchieta, A.; McRoberts, N.; Koike, S.T.; Subbarao, K.V.; Voglmayr, H.; Choi, Y.-J.; Thines, M.; Martin, F.N. Coupling Spore Traps and Quantitative PCR Assays for Detection of the Downy Mildew Pathogens of Spinach (Peronospora Effusa) and Beet (P. Schachtii). Phytopathology 2014, 104, 1349–1359. [Google Scholar] [CrossRef] [Green Version]
  36. Kennedy, R.; Wakeham, A.J.; Byrne, K.G.; Meyer, U.M.; Dewey, F.M. A New Method To Monitor Airborne Inoculum of the Fungal Plant Pathogens Mycosphaerella brassicicola and Botrytis cinerea. Appl. Environ. Microbiol. 2000, 66, 2996–3003. [Google Scholar] [CrossRef]
Figure 1. Limit of detection (LOD) and efficiency of the Moniliophthora roreri qPCR. Then, 2 μL of serial dilutions (×1/10n) of the DNA extracted from the mycelia of M. roreri strain MR2 with concentrations between 30 and 0.0003 ng per μL were evaluated in two separated qPCR, each containing ten technical replicates per dilution. Non-template (H2O) and negative (M. perniciosa basidiocarp DNA) controls were included in every qPCR. (A) shows the correlation between the probability of detecting the M. roreri DNA (i.e., return a positive qPCR) and the log10 of DNA amount in the serial dilutions (between 60 and 0.0006 ng). The points represent the probability of the M. roreri DNA dilutions to return a positive qPCR, defined as a qPCR reaction with a Ct below 30. The solid line represents the prediction of the general linearize model (GLM) with the logit function and the binomial family error (Table S4). The dashed line represents the qPCR’s 95% detection limit. (B) shows the correlation between the qPCR threshold cycle (Ct) and the logarithm with base 10 (log10) of the DNA concentration of the M. roreri serial dilutions. The points (n = 20 per log10 of DNA concentration) represent each sample. The line and the gray area represent the prediction and standard error of the linear model (lm), respectively.
Jof 09 00047 g001
Table 1. qPCR results for the evaluations assessing the specificity of the qPCR, including Moniliophthora roreri strains originated from several cacao regions in Colombia and other fungi.
Strain aFungiCt
(Mean ± SD) b
Tukey Grouping cIsolation Site
MR 124Moniliophthora roreri15.9 ± 0.3iNecoclí, Antioquia
MR12616.6 ± 0.5hiNecoclí, Antioquia
MR6816.8 ± 0.1hiPalestina, Caldas
MR116.8 ± 0.3hiBarrancabermeja, Santander
MR13417.0 ± 0.1hOrito, Putumayo
MR9818.2 ± 0.1gVillanueva, Casanare
MR3818.8 ± 0.2fgBarrancabermeja, Santander
MR13619.8 ± 0.2efOrito, Putumayo
MR3319.8 ± 0.1efSan José del Nus, Antioquia
MR10819.8 ± 0.3efRivera, Huila
MR3019.9 ± 0.3eSan José del Nus, Antioquia
MR2821.1 ± 0.2dSan José del Nus, Antioquia
MR221.1 ± 0.5dBarrancabermeja, Santander
MR4823.1 ± 0.1cPaz de Ariporo, Casanare
EAFIT-F0059Alternaria argyroxiphii32.3 ± 0.8b--
--Pleurotus sp. 32.8 ± 0.4ab--
N.A.Moniliophthora perniciosa33 ± 0.3abBarrancabermeja, Santander
--Ganoderma sp. 33.3 ± 0.2ab--
EAFIT-F0056Diaporthe phaseolorum33.3 ± 0.5ab--
EAFIT-F0066Colletotrichum siamense33.8 ± 0.5a--
N.A.H2O33.8 ± 0.2a--
a Strain name acording to the universidad EAFIT culture collection; --, not avaliable; N.A., not aplicable. b Ct, qPCR threshold cycle; SD, standard deviation (n:6). c Same letters mean statistical grouping according to the Tukey test, 95% confidence leve (p-value < 0.05).
Table 2. qPCR estimates and within and between qPCR runs coefficients of variance for the Moniliophthora roreri DNA in suspension and extracted from M. roreri spores in suspension and spore-traps.
qPCR RunLoadWithin qPCR RunBetween qPCR Runs
Estimated DNA ng (Mean ± SD) aCV bEstimated DNA ng (Mean ± SD) cCV d
DNA suspension
16 ng6.32 ± 0.590.096.51 ±0.270.04
2 6.7 ± 0.840.13
10.6 ng0.72 ± 0.080.110.80 ± 0.110.14
2 0.87 ± 0.020.02
Spore suspensions
12.9 × 10⁶ spores99.7 ± 11.680.1281.83 ± 25.270.31
2 63.96 ± 28.620.45
12.9 × 10⁵ spores13.56 ± 3.620.2710.9 ± 3.760.34
2 8.25 ± 7.920.96
12.9 × 10⁴ spores0.52 ± 0.781.50.56 ± 0.060.1
2 0.6 ± 0.811.35
Spore traps
12.9 × 10⁶ spores10.87 ± 6.510.68.36 ± 3.550.42
2 5.86 ± 6.641.13
12.9 × 10⁵ spores0.49 ± 0.621.260.35 ± 0.200.57
2 0.21 ± 0.160.78
12.9 × 10⁴ spores0.1 ± 0.161.730.07 ± 0.040.56
2 0.04 ± 0.010.14
No-template control (H2O)
1--0 ± 0--0 ± 0--
2--0 ± 0--
Negative Control (M. pernisiosa DNA)
1--0 ± 0--0 ± 0--
2--0 ± 0--
a Mean and SD, the standard deviation for the estimates of the biological replicates of each qPCR runs (n:3). b CV, Coeficient of variance (SD/mean) for the estimates of the biological replicates of each qPCR runs. c Mean and SD, the standard deviation for the estimates of the qPCR runs (n:2). d CV, Coefficient of variance (SD/mean) for the estimates of the biological replicates of each qPCR runs.
Disclaimer/Publisher’s Note: The statements, opinions and data contained in all publications are solely those of the individual author(s) and contributor(s) and not of MDPI and/or the editor(s). MDPI and/or the editor(s) disclaim responsibility for any injury to people or property resulting from any ideas, methods, instructions or products referred to in the content.

