Article

Genetic Characterization of Puccinia striiformis f. sp. tritici Populations from Different Wheat Cultivars Using Simple Sequence Repeats

1
Department of Plant Protection, College of Horticulture and Plant Protection, Henan University of Science and Technology, Luoyang 471000, China
2
Department of Plant Pathology, College of Plant Protection, China Agricultural University, Beijing 100193, China
3
College of Agriculture, Xinjiang Agricultural University, Urumqi 830052, China
4
Shandong Provincial University Laboratory for Protected Horticulture, Shandong Facility Horticulture Bioengineering Research Center, Weifang University of Science and Technology, Weifang 262700, China
*
Author to whom correspondence should be addressed.
J. Fungi 2022, 8(7), 705; https://doi.org/10.3390/jof8070705
Submission received: 20 May 2022 / Revised: 12 June 2022 / Accepted: 30 June 2022 / Published: 3 July 2022

Abstract

:
Stripe rust, caused by Puccinia striiformis f. sp. tritici (Pst), is one of the most important fungal diseases affecting wheat (Triticum aestivum L.) worldwide. In this study, the genetic diversity and population structure of Pst isolates were analyzed using 15 microsatellite markers. Isolates were collected from five wheat cultivars with different levels of resistance from Yanting county and Fucheng district, Mianyang city, Sichuan province, China. The aim of this study was to investigate whether Pst populations are differentiated by wheat genotype or geographic origin. Seventy-six multilocus genotypes (MLGs) were identified from all 289 single uredinial isolates. In general, the genotypic diversity of Pst populations from five wheat cultivars in Fucheng was higher than that in Yanting. In addition, the genetic diversity was highest in the Pst populations from Mianmai 367, a cultivar considered to be highly resistant. The unweighted pair group method with arithmetic mean (UPGMA) phylogenetic tree, Bayesian clustering analysis, and minimum spanning network for the MLGs revealed two major genetic clusters based on geographical location. Greater differentiation was observed between the populations from the two sampling locations than between the populations from different hosts in the same location. The results suggest that geographic and environmental differences could partially explain the genetic differentiation of Pst more than wheat genotype. This study provides novel insight into the interactions between Pst populations and their hosts. The results could be helpful in designing more effective management strategies for stripe rust in wheat production.

1. Introduction

Stripe rust, caused by Puccinia striiformis f. sp. tritici (Pst), is one of the most important fungal diseases affecting wheat (Triticum aestivum L.) worldwide [1,2], especially in areas with cool and wet weather conditions [3]. China is one of the countries most affected by stripe rust epidemics. Since the 1950s, China has experienced five devastating wheat stripe rust epidemics (1950, 1964, 1990, 2002, and 2017), across areas of more than 5.5 million Hm2 each. These resulted in total yield losses of up to 13.8 million metric tons [4,5].
In agricultural production systems, different disease management practices are used to control wheat stripe rust, including fungicides and genetic resistance. As an alternative to the use of fungicides, developing and growing resistant cultivars is considered a more economical and environmentally sound approach for the control of stripe rust [2,6]. Hence, planting resistant cultivars is recommended. However, resistant cultivars apply significant selection pressure to the pathogen, causing rapid shifts in pathotypes. Consequently, these changes in the Pst pathogen usually lead to cultivars that previously possessed resistance against a single major gene becoming susceptible within a few years [7,8]. Therefore, it is essential to understand how plant pathogen populations respond to the deployment of host resistance for the effective use of plant resistance and sustainable disease management.
Studies on population genetics have enabled plant pathologists to gain a better understanding of the genetic structure of pathogen populations, as well as the evolutionary processes that shape pathogen populations [9,10]. The structure and diversity of Pst populations have traditionally been elucidated using avirulence/virulence analyses. In China, since the 1940s, the identification of stripe rust races has been conducted based on the avirulence or virulence responses of isolates inoculated on host cultivars or genotypes [11]. More recently, information on the virulence and pathotype structure of the Pst populations in China have been analyzed on a regular basis [12,13,14]. There are 34 CYR races and 35 pathotypes of Pst that have been described in China using the current set of wheat differentials [5,12]. These studies allowed for an appreciation of the pathogenic population characteristics and provided the basis for the anticipatory breeding of cultivars with the optimum resistance level [11,15]. However, the ability of this method to detect the genetic structure and diversity of Pst populations, which mediate the virulence of the pathogen, is limited. To understand the genetic structure and diversity of Pst populations, as well as the evolutionary processes that shape pathogen populations, reliable molecular evidence is needed [16].
Historically, numerous DNA-based tools have been applied in population studies of Pst, such as amplified fragment length polymorphisms (AFLPs) [17,18,19,20] and simple sequence repeats (SSRs) [11,21,22,23,24]. These genetic studies of Pst populations have focused on the differences and correlations of Pst populations over time (different years and epidemic periods) and space (oversummering areas, overwintering areas and spring epidemic areas). Thus, the studies have revealed the origin, sources of inoculum, routes of introduction, migration pathways, and reproductive biology of Pst. Recently, several studies have examined the effect of wheat cultivars on population structure of Pst [25,26].
In agricultural systems, host genotype and diversity can affect pathogen population genetic diversity and structure [9,25,26]. Zhan et al. [25] used SSR markers to reveal significant differences in the genetic diversity among Pst populations from 19 cultivars of wheat. The genetic diversity was highest in a population found in Tian 863-13, a highly resistant wheat cultivar. In contrast, the genetic diversity was lowest in a population found in Huixianhong, a highly susceptible cultivar. Recently, Chu et al. [26] studied the effects of wheat cultivar mixtures on the population genetic structure of Pst. Their results showed that Pst genotypic diversities from resistant cultivars may be higher than or as low as those from susceptible cultivars, but the frequency of the Pst dominant genetic group from the highly susceptible cultivar was generally higher than those from resistant cultivars.
How plant pathogen populations and their genetic structures respond to the deployment of host resistance is still poorly understood. This knowledge is important for the effective use of plant resistance and sustainable disease management. [9,27]. In this study, the aim was to investigate the potential effect of cultural practices, such as planting resistant cultivars, on the genetic structures and diversity of pathogen populations using a widely used and approved set of SSR markers.

2. Materials and Methods

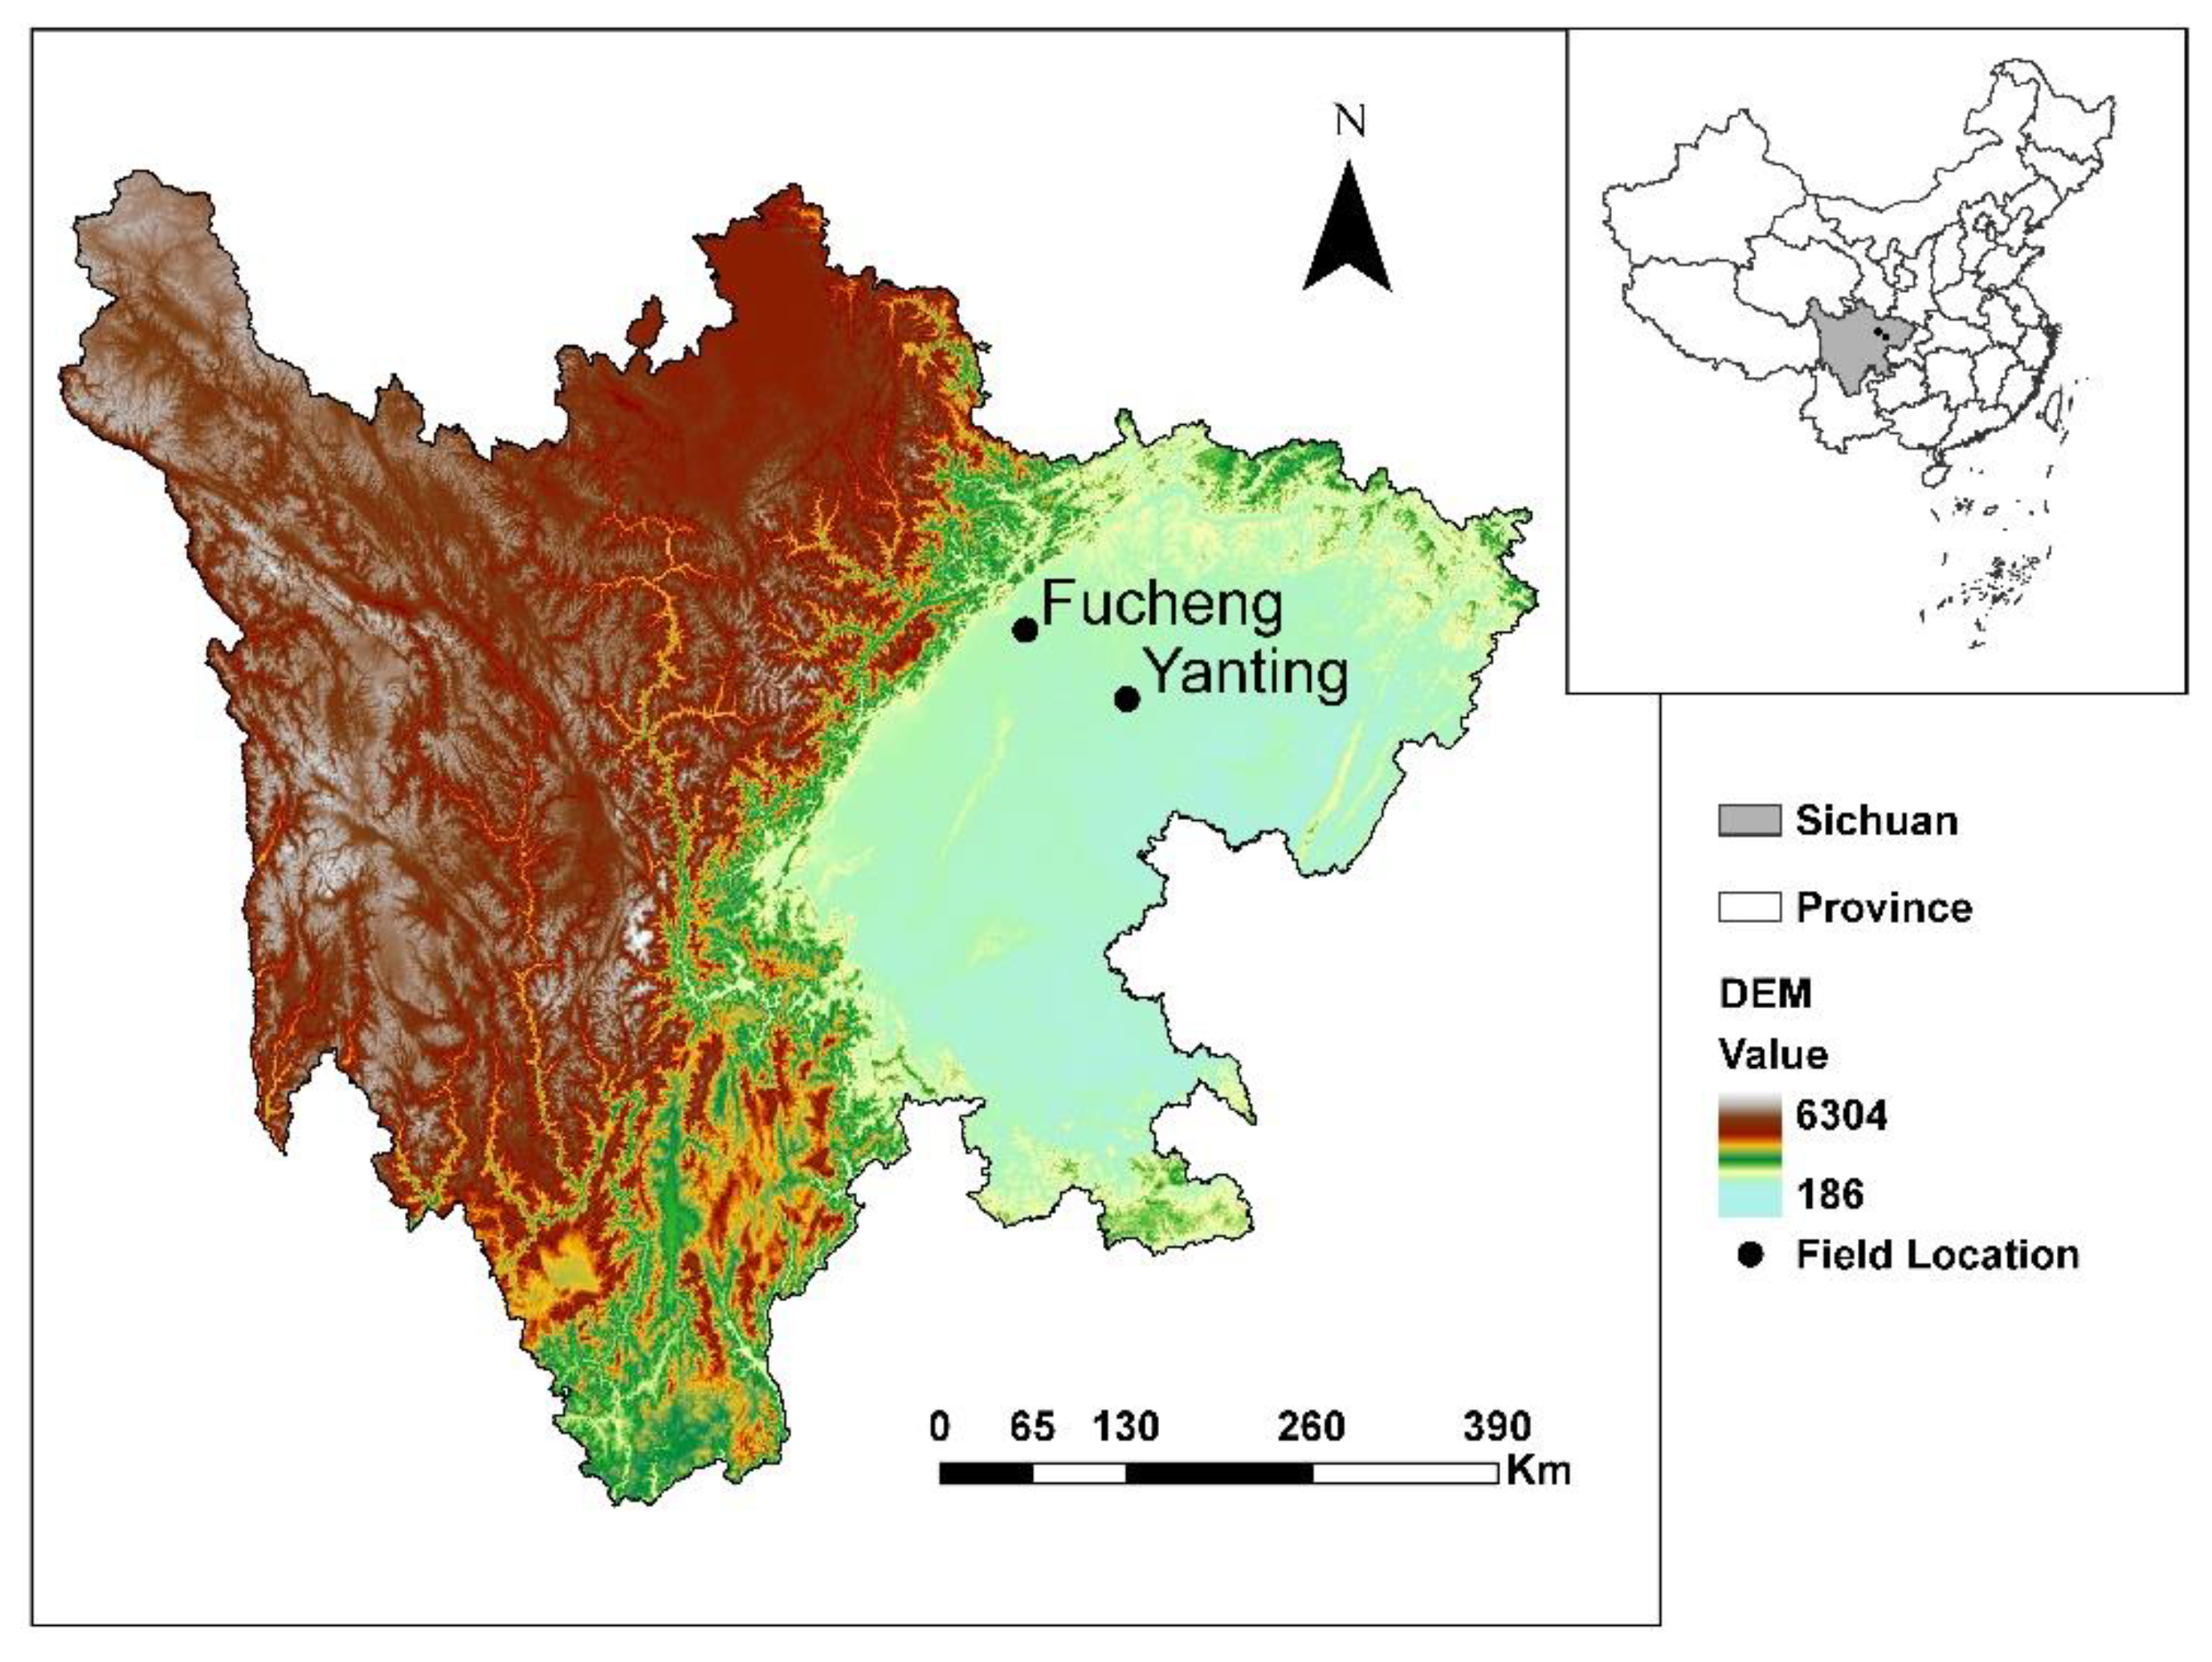
2.1. Field Experiment and Disease Assessment Sampling

The experiments were conducted in Yanting county (31°13′ N, 105°45′ E) and Fucheng district (31°34′ N, 104°42′ E), Mianyang city, Sichuan province, in the 2014–2015 growing season (Figure 1) with a natural infection. At these locations, the stripe rust can overwinter in infected leaf tissue and the disease can even progress slowly during winter due to the warm climate and the high humidity and rainfall. The overwintering inoculums can initiate epidemics in these areas during spring [28].
At each site, five wheat cultivars, namely Mingxian 169 (MX), Xiaoyan 22 (XY), Zhengmai 9023 (ZM), Xikemai 4 (XK), and Mianmai 367 (MM), were planted in the experimental fields in a randomized block design (RBD) with three replications on 3 November 2014. Each plot was 5 m long and 6 m wide. Plots were separated by 0.5 m. The fields in Yanting (Yt) and Fucheng (Fc) consisted of 15 plots each. In mid-March 2015, the disease incidence and severity were evaluated at each experimental site during the period of occurrence of the stripe rust. In the fields, five subplots (approximately 30 × 30 cm) were randomly selected from each plot. In each subplot, 100 leaves were randomly sampled to assess disease incidence and severity. Disease incidence and severity were measured using the Rules for Monitoring and Forecasting Wheat Stripe Rust (Puccinia striiformis West.) (GB/T 15795-2011). The disease index (DI) was calculated as:
D I = I × S ¯ × 100
where I is the disease incidence and S ¯ is the average disease severity. The average disease severity was calculated as:
S ¯ = ( S i × l i ) L × 100
where L is the total number of diseased leaves and Si and li are the disease severity and the number of diseased leaves with disease severity in percentages of 1%, 5%, 10%, 20%, 40%, 60%, 80% or 100%.
Infection types (ITs) were visually scored on a 0–4 scale, as described by Chen et al. [11]. IT scores of 0–2 were considered as resistant and 3–4 were considered as susceptible.
The evaluation of wheat cultivars for resistance to Pst followed the Rules for Resistance Evaluation of Wheat to Diseases and Insect Pests—Part 1: Rule for Resistance Evaluation of Wheat to Yellow Rust (NY/T 1443.1-2007).
Wheat leaves naturally infected by Pst were collected from experimental plots in Yanting and Fucheng after disease assessment on the same day. Approximately 60 leaves were obtained from each wheat cultivar and were considered as a population at each experimental site. The leaf samples were packaged in an absorbent paper bag and kept in a desiccator at 4 °C for later use.

2.2. Isolation and Reproduction of Isolates

Isolates were purified and multiplied from the collected samples by inoculating single pustules separately on 10-day-old seedlings of universally susceptible Mingxian 169, as previously described by Liang et al. [29]. Inoculated seedlings were transferred into a dew chamber under dark conditions at 10 to 14 °C for 24 h. The seedlings were then placed in an artificial climate chamber with a 14 h photoperiod at 10 to 14 °C. After approximately 15 days, urediniospores were harvested from the lesions and then reinoculated as described above in order to further increase the number of urediniospores. The urediniospores were harvested from inoculated leaves, transferred into a clean tube, and stored at −80 °C for DNA extraction.

2.3. DNA Extraction and SSRs

The DNA of each isolate was extracted using a modified cetyltrimethylammonium bromide (CTAB) protocol, as described by Wang et al. [30]. The concentration and purity of the genomic DNA was ascertained twice using a NanoDrop 2000® UV-Vis Spectrophotometer (Thermo Fisher Scientific, Waltham, MA, USA). The DNA concentration was adjusted to 100 ng/μL by adding distilled water for use in the PCR amplification.
Fifteen pairs of Pst SSR primers were screened for useful markers. Among the 15 primers, RJ3, RJ13, and RJ21 were developed by Enjalbert et al. [21]; CPS08, CPS09, CPS10, CPS13, CPS27, and CPS34 were developed by Chen et al. [11]; RJ3N and RJ13N were developed by Bahri et al. [22]; PstP03, PstP06, and PstP29 were developed by Cheng et al. [31]; and WSR85 was described by Zhan et al. [32]. These primers were synthesized by Beijing Tsingke Biotech Co., Ltd. (Beijing, China). The forward primers were fluorescently 5′-labeled.
PCR was conducted with a volume of 10 μL, which included 1.0 μL of DNA (100 ng/μL), 0.5 μL of each primer (10 mM), 1.0 μL of 10 × reaction buffer (Mg2+ free), 0.8 μL of Mg2+ (25 mM), 1.0 μL of dNTP (2.5 mM), 0.1 µL of Taq DNA polymerase (5 U/µL), and 5.1 μL of ddH2O. The reaction programs were set at 94 °C for 4 min; followed by 35 cycles of 30 s at 94 °C, 30 s at 52 °C, and 1 min at 72 °C, with a final extension at 72 °C for 10 min in a thermal cycler.
The final PCR products were separated and visualized using an ABI3730XL automatic DNA sequencer (Applied Biosystems) by Beijing Tsingke Biotech Co., Ltd. The lengths of the SSR amplicons were scored using GeneMarker software (Version 2.20; SoftGenetics, LLC., State College, PA, USA) and compared to a GS500 (35–500 bp) internal standard [33]. Since Pst is a dikaryotic fungus at the uredinial stage, each isolate was scored for two alleles to determine whether each SSR locus was homozygous or heterozygous using GeneMarker.

2.4. Population Genetic Analysis

All Pst isolates were defined as different populations according to the geographic locality or host cultivar. Locus-based statistics were calculated using GenAlEx software [34] and included the number of alleles (Na) and number of effective alleles (Ne). The R package poppr 2.2.0 [35] was used to determine the number of multilocus genotypes (MLGs) and expected MLGs (eMLGs), the Shannon–Wiener index H [36], the genotypic evenness E5 [37,38], and the Nei’s unbiased gene diversity Hexp [39]. Multilocus genotypes were identified based on the alleles for each of the 15 SSR loci. Isolates with identical allele pattern across the 15 SSR loci were considered as the same MLGs. The expected MLG (eMLG) considers the sample size and is equivalent to the genotypic richness of a population [37]. The number of eMLGs was estimated based on rarefaction curves using 1000 bootstrapped samples [37]. Genotypic evenness, which determines the distribution of MLGs within a population, was calculated using the index E5 [37,38]. E5 ranges from 0 to 1, with 0 indicating that the population is dominated by a single MLG and 1 indicating that all genotypes occur with the same frequency.
In order to determine the degree of clonality and the potential for recombination in the population, linkage disequilibrium was measured by the standardized index of association (rbarD) [40] using the package poppr [35]. Departure from the null hypothesis (no linkage disequilibrium, rbarD = 0) was assessed by permuting alleles between individuals independently for each locus (999 permutations). If the observed rbarD value was located outside the distribution of the randomized dataset at p < 0.001, the population was considered clonal [40].
To infer between-population relationships, the R package poppr was used to calculate the Nei’s distances between populations using the clone-corrected data and build the phylogenetic tree using the unweighted pair group method with arithmetic mean (UPGMA) [41]. Population genetic structure was investigated with model-based Bayesian clustering carried out in STRUCTURE v 2.3.4 [42]. The data were analyzed using the admixture model, and the cluster numbers (K) were evaluated from 1 to 10. For each K, we performed 10 independent runs with 500,000 iterations per run and a burn-in period of 100,000. The optimal K value was estimated using the method described by Evanno et al. [43] with STRUCTURE Harvester [44].
To test for differentiation between Pst isolates from different host populations, pairwise FST values were estimated, and significance levels were tested with 999 permutations using GenAlEx software [34]. An analysis of molecular variance (AMOVA) [45] was also used to estimate the genetic differentiation between regions, among all populations, among all individuals included, and within individuals in the present study. The AMOVA was performed using GenAlEx software [34].
To test evolutionary relationships between genotypes, microsatellite-based genetic distances were calculated using the Bruvo genetic distance [46]. A minimum spanning network (MSN) was created using the MSN function of poppr [35] based on Bruvo’s distances.

2.5. Statistical Analysis

The analysis of variance (ANOVA) of the obtained data was performed with the software package SPSS v. 20.0 (IBMCorp., Armonk, NY, USA). The least significant difference (LSD) at a 5% level of significance was used to compare the treatment means (disease index of stripe rust among wheat cultivars).

3. Results

3.1. Occurrence of Pst in Sampling Locations

To evaluate the levels of resistance to Pst of the five wheat cultivars, the occurrence and severity of the stripe rust were surveyed before sampling in mid-March 2015. Results revealed that the disease index of stripe rust varied significantly among the five wheat cultivars, both in Yanting and Fucheng (Table 1). The highest disease index levels were recorded for the Mingxian 169 cultivar in both sites, whereas Mianmai 367 and Xikemai 4 displayed the lowest disease index levels in Yanting and Fucheng, respectively (Table 1). According to the infection types and disease index for the tested wheat cultivars (Table 1), Mianmai 367 and Xikemai 4 could be characterized as having high levels of resistance to Pst, and Zhengmai 9023 and Xiaoyan 22 were considered as having moderate levels of resistance to Pst. In contrast, the wheat cultivar Mingxian 169 was a highly susceptible cultivar.

3.2. Analysis of Genetic Diversity in Pst Populations

A total of 289 Pst isolates were obtained from the five wheat cultivars grown in Yanting and Fucheng (Table 2). Microsatellite analysis of all the Pst isolates resulted in 34 alleles amplified by 15 SSR primer pairs (Table S1). The number of observed alleles per locus ranged from 2 to 3, with an average of 2.07 alleles/locus (Table S1 and Table 2).
In total, 76 MLGs were identified from all 289 Pst isolates (Table 2 and Figure 2). In Yanting, 45 MLGs were identified from 156 examined Pst isolates (Table 2). Among the 45 MLGs, MLG76 was the most abundant in all populations, with a frequency of 52.56%, and it was also the only MLG detected across all host populations (Figure 2). In Fucheng, 40 MLGs were identified from 133 examined Pst isolates (Table 2). The most common MLG was MLG20, which was assigned to 32 of the 133 isolates (Figure 2). MLG20 isolates were detected in four populations, but not in FcMM (Figure 2). The second most common MLG was MLG9, which was associated with 26 isolates, mostly (74%) from the FcMM population (Figure 2). Among all the host populations, a higher genotypic richness was observed for Mianmai 367 and Xikemai 4 when equal sample sizes were considered (estimated as the number of eMLGs) (Table 2).
In general, the genotypic diversity of the Pst populations from the five wheat cultivars in Fucheng was higher than the host cultivars from Yanting (H: 2.94 vs. 2.39), and the E5 was also higher (0.46 vs. 0.25) (Table 2). In Fucheng, the Shannon–Wiener index (H) ranged from 1.48 for FcZM to 2.04 for FcMM (Table 2). In Yanting, YtMM had the highest Shannon–Wiener index (H) (1.94), followed by YtXK (1.84), YtXY (1.69), YtMX (1.67), and YtZM (1.50) (Table 2). The gene diversity estimated from Nei’s (1978) genetic diversity index (Hexp) also revealed that the Fucheng population was more diverse than the Yanting population (Hexp: 0.30 vs. 0.24) at the region level (Table 2). In Yanting, YtMM had a higher gene diversity (Hexp = 0.305) than other populations (Table 1). Similarly, in Fucheng, FcMM had a higher gene diversity (Hexp = 0.309) than the other populations (Table 2).

3.3. Recombination Test

The hypothesis of random mating within Pst populations was tested using the standardized index of association rbarD, with 999 permutations of the genotyping dataset. For each host population from Yanting and Fucheng, and the overall population, the hypothesis of no linkage among markers was rejected (p < 0.001) (Table 2), supporting a clonal mode of reproduction for Pst populations.

3.4. Phylogenetic Relationship and Population Structure

The analysis of genetic relationships among populations using UPGMA based on Nei’s genetic distance showed that all Pst populations could be divided into two major clusters by sampling location (Figure 3). Cluster 1 contained FcMX, FcMM, FcXY, FcXK, and FcZM. Cluster 2 was comprised of YtMX, YtMM, YtXY, YtXK, and YtZM (Figure 3). A similar clustering pattern was obtained by STRUCTURE analyses. Applying STRUCTURE, the optimal number of clusters (ΔK) calculated for Bayesian modeling was K = 2 (Figure 4). At K = 2, ΔK reached a peak (Figure 4), and all the populations were separated into two different clusters: the first cluster comprised five host populations from Yanting, and the other consisted of the remaining five host populations from Fucheng (Figure 4).

3.5. Genetic Differentiation within and between Populations

The AMOVA of microsatellite genotype data showed that 25.24% of the total genetic variation was attributed to genetic differences between localities, 4.48% to the differences among populations (p = 0.001), 9.20% to the differences among individuals (p = 0.001), and 61.08% to the differences within individuals (p = 0.001; Table 3).
Pairwise comparison (FST) between collections of Pst from five different wheat cultivars also showed low levels of genetic differentiation between collections from the same location (Yanting or Fucheng; Table 4). At Yanting, significant differences were detected only between YtMX and YtZM (p = 0.001; Table 4). At Fucheng, in pairwise comparisons of FcMM with the other populations (except FcXY), the population differentiation was significant in all cases (p = 0.001; Table 4). In addition, pairwise comparisons between FcMX and FcXY showed a significant FST value (Table 4).

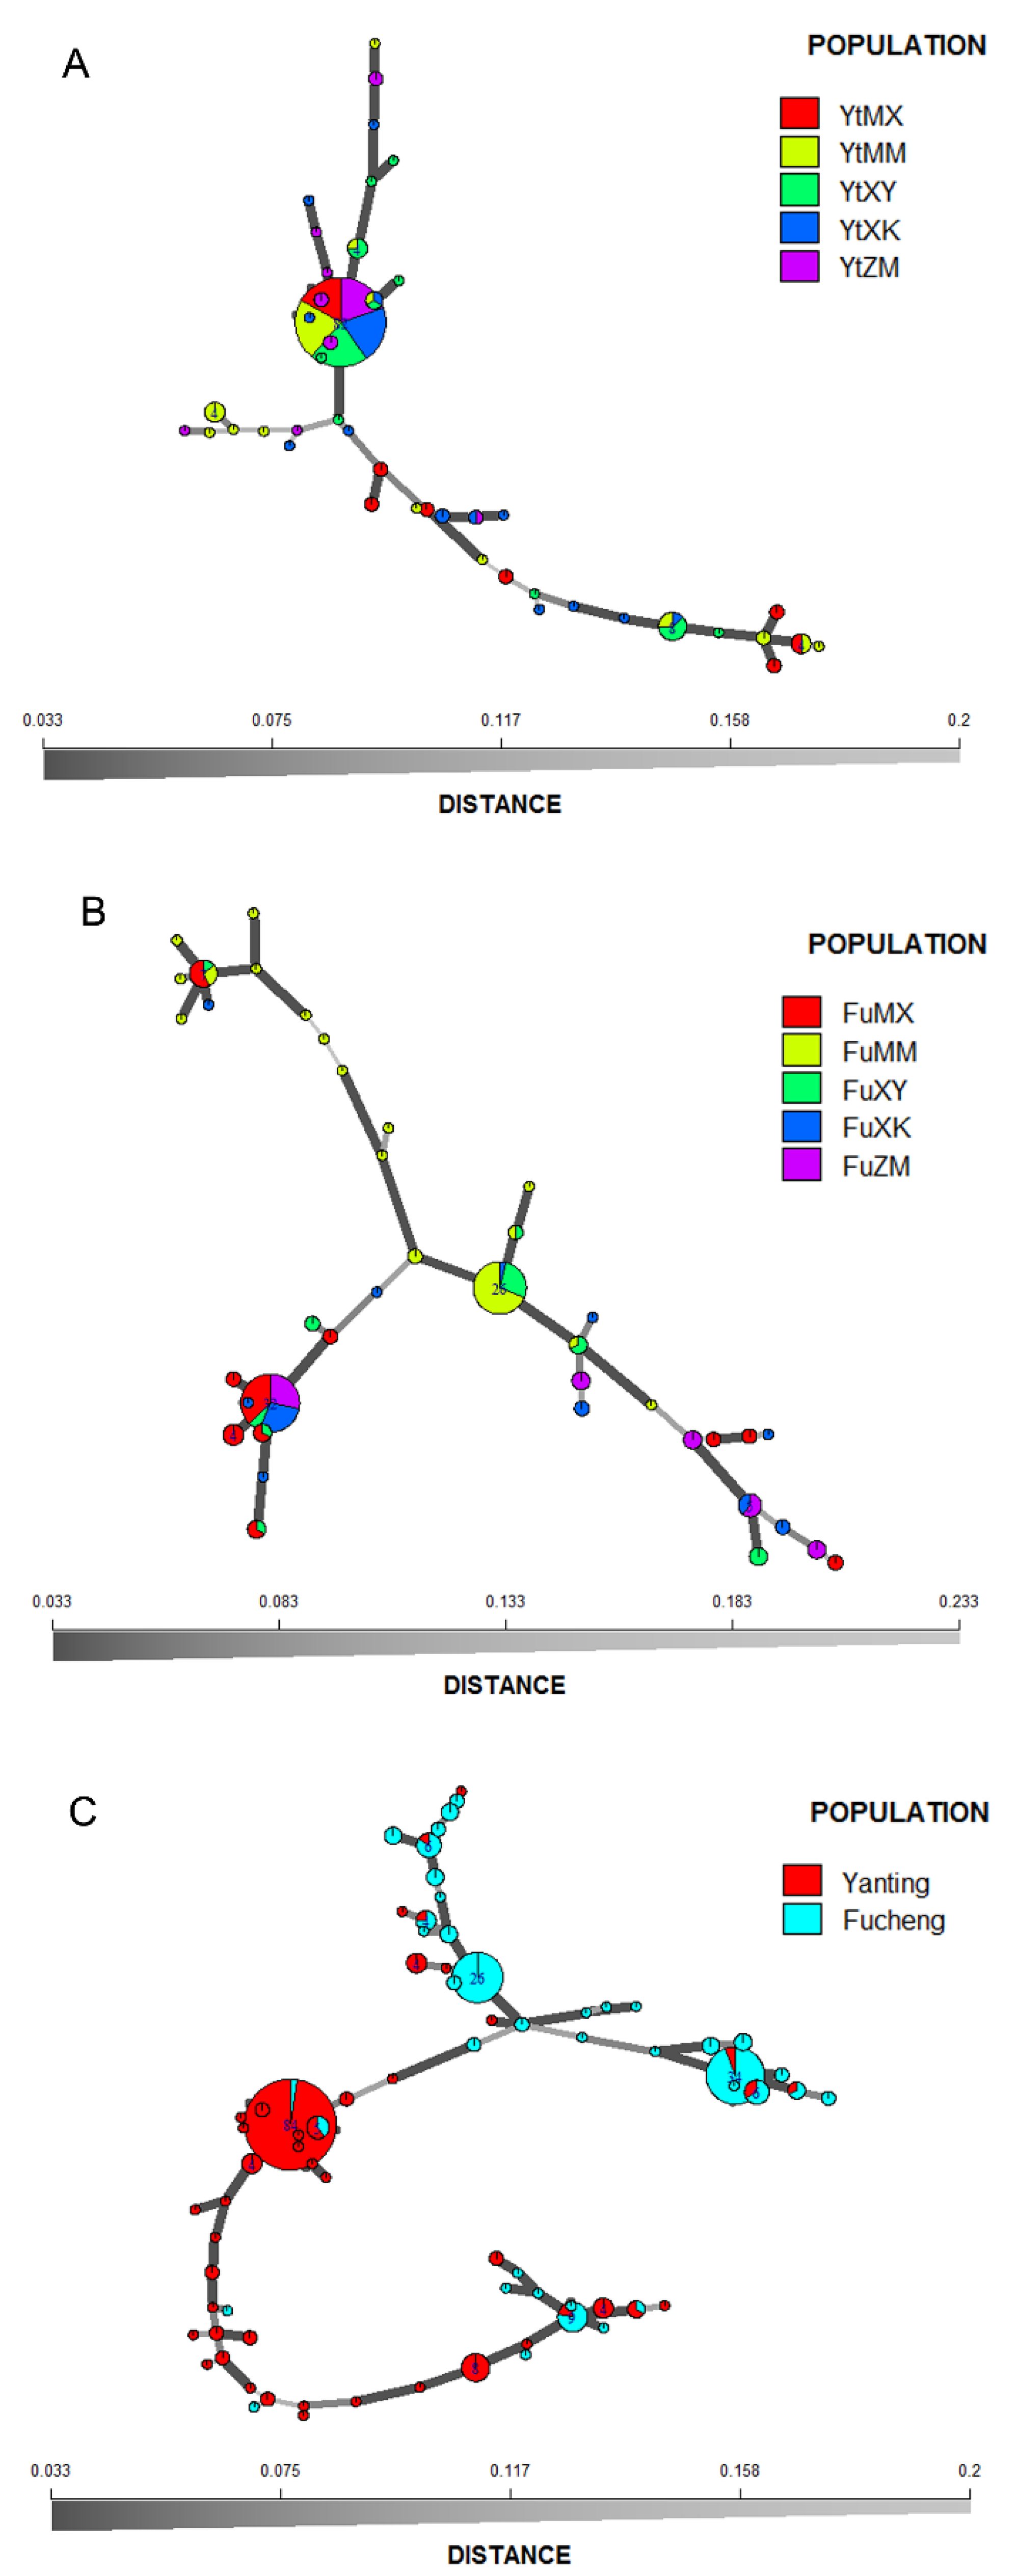
3.6. Minimum Spanning Network for the MLGs

The minimum spanning networks based on Bruvo’s distance were used to visualize relatedness among MLGs. The distribution of MLGs (Figure 5A,B), in agreement with AMOVA and the other analyses, suggested that wheat cultivars had little impact on the genetic affiliation of the isolates (Figure 5A,B). Isolates did not cluster by wheat cultivar. In addition, the minimum spanning networks showed that six and eight MLGs were shared across different host populations in the Yanting and Fucheng isolates, respectively. Geographic structuring for Pst isolates was visible in the minimum spanning network, and most of the isolates of Pst from the same sampling site produced relatively compact networks (Figure 5C).

4. Discussion

Analyses of population genetic structure can provide insights into the potential for pathogen evolution in agrosystems, including the ability to adapt to resistant cultivars and fungicide applications [9]. In this study, the genetic structures of 289 Pst isolates collected from five wheat cultivars were analyzed at the population level. Our results demonstrate that all Pst populations could be divided into two major clusters according to sampling location in STRUCTURE analysis (Figure 4). In addition, the UPGMA dendrogram based on Nei’s distances grouped all Pst isolates into two geographic clusters with bootstrap support of 100 (Figure 3). An MSN further showed the division of genetic groups based on geographic locations (Figure 5C). The AMOVA also showed that 25.24% of the total genetic variation was attributed to genetic differences between locations (Table 3). These results were consistent with previous findings obtained by Jaimes et al. [47], indicating that the genetic structure was driven by geographic origin and not by host genotype.
The genetic diversity of the Pst population in Fucheng was higher than in Yanting. Yanting and Fucheng are located in the Sichuan Basin, where the pathogen can overwinter but not oversummer due to the heat [4]. In previous studies, Sichuan Basin was found to receive exogenous oversummering inoculum from source areas where Pst can survive year-round, such as northwestern Sichuan and Gansu [19,20]. The genetic diversity of Pst in the oversummering regions has been shown to be much higher than in other regions [23]. Fucheng was closer to oversummering regions than Yanting (Figure 1).
In the study, interestingly, the results indicated that Pst populations that originated from Mianmai 367 with a relatively high level of resistance were more genotypically diverse (eMLG and H) than the other populations, and they were also more diverse according to gene diversity (Hexp) (Table 2). The most likely explanation for this is that competition among pathogen strains for limited host resources had a significant effect on the genetic diversity of the pathogen. In agroecosystems, host population resistance is a key determinant of pathogen population and genetic structure, with plant resistance genes determining whether a pathogen is capable of infecting a given host genotype [48]. In addition, competition plays a key role in the emergence of new strains and populations of plant pathogens when plants are infected simultaneously by different pathogen genotypes [26]. Previous work has revealed that pathogen aggressiveness (greater spore production and transmission potential), mediated by among-pathotype competition, is favored over virulence in susceptible host populations. In contrast, the ability to infect multiple host genotypes (greater virulence) is favored in resistant host populations [49]. More genetically diverse pathogens have been shown to maintain a higher diversity of virulence [9,50]. The results of the present study suggest that, at the population level, a trade-off between virulence and aggressiveness when Pst infected highly resistant wheat cultivars is likely to have caused the higher genetic diversity observed.
When the reproductive mode was investigated, it was not possible to find evidence of recombination between genetically distinct individuals in the Pst populations originating from different wheat cultivars in Yanting and Fucheng. However, in previous studies [19,23], Pst populations from Sichuan Basin had rbarD values that were not significantly different from zero, indicating a lack of linkage disequilibrium. Indeed, recent studies have confirmed the possibility of recombination in Pst populations [18]. Additionally, the Pst sexual stage has been observed with barberry (Berberis spp.) as an alternate host [51], and a very low level of Pst sexual reproduction has been reported to have occurred in China [52].

5. Conclusions

In this study, we analyzed the population genetics of Pst from five different wheat cultivars in two different geographic locations. Significant differences in genetic diversity among Pst populations from different wheat cultivars were detected, whereas wheat cultivars did not significantly shape the population structure of the Pst populations. With the genetic characterization of Pst populations from different wheat cultivars in mind, framing control strategies should be emphasized for developing cultivars with non-specific and durable resistance that are effective against Pst.

Supplementary Materials

The following supporting information can be downloaded at: https://www.mdpi.com/article/10.3390/jof8070705/s1, Table S1: Information on simple sequence repeat (SSR) primers used in this study.

Author Contributions

Conceptualization, S.W.; methodology, S.W. and C.W.; investigation, S.W. and Q.L.; software, C.G., Q.S., and F.G.; writing—original draft preparation, S.W. and C.G.; writing—review and editing, Z.M.; funding acquisition, Z.M. and S.W. All authors have read and agreed to the published version of the manuscript.

Funding

This research was funded by the National Key Research and Development Program of China (2021YFD1401000) and the Start-up Foundation of Scientific Research for PhD of Henan University of Science and Technology (13480059).

Institutional Review Board Statement

Not applicable.

Informed Consent Statement

Not applicable.

Data Availability Statement

Not applicable.

Conflicts of Interest

The authors declare no conflict of interest.

References

  1. Beddow, J.M.; Pardey, P.G.; Chai, Y.; Hurley, T.M.; Kriticos, D.J.; Braun, H.J.; Park, R.F.; Cuddy, W.S.; Yonow, T. Research investment implications of shifts in the global geography of wheat stripe rust. Nat. Plants 2015, 1, 15132. [Google Scholar] [CrossRef] [PubMed]
  2. Chen, X.M. Pathogens which threaten food security: Puccinia striiformis, the wheat stripe rust pathogen. Food Secur. 2020, 12, 239–251. [Google Scholar] [CrossRef]
  3. Chen, W.; Wellings, C.; Chen, X.; Kang, Z.; Liu, T. Wheat stripe (yellow) rust caused by Puccinia striiformis f. sp. tritici. Mol. Plant Pathol. 2014, 15, 433–446. [Google Scholar] [CrossRef] [PubMed]
  4. Li, Z.Q.; Zeng, S.M. Wheat Rusts in China; China Agriculture Press: Beijing, China, 2002. [Google Scholar]
  5. Ma, Z.H. Researches and control of wheat stripe rust in China. J. Plant Prot. 2018, 45, 1–6. [Google Scholar]
  6. Omara, R.I.; Shahin, A.A.; Ahmed, S.M.; Mostafa, Y.S.; Alamri, S.A.; Hashem, M.; Elsharkawy, M.M. Wheat resistance to stripe and leaf rusts conferred by introgression of slowrusting resistance genes. J. Fungi 2021, 7, 622. [Google Scholar] [CrossRef]
  7. Wellings, C.R.; Boyd, L.A.; Chen, X.M. Resistance to stripe rust in wheat: Pathogen biology driving resistance breeding. In Disease Resistance in Wheat; Sharma, I., Ed.; CAB International: London, UK, 2012; pp. 63–83. [Google Scholar]
  8. Ellis, J.G.; Lagudah, E.S.; Spielmeyer, W.; Dodds, P.N. The past, present and future of breeding rust resistant wheat. Front. Plant Sci. 2014, 5, 641. [Google Scholar] [CrossRef] [PubMed] [Green Version]
  9. McDonald, B.A.; Linde, C. Pathogen population genetics, evolutionary potential, and durable resistance. Annu. Rev. Phytopathol. 2002, 40, 349–379. [Google Scholar] [CrossRef] [PubMed] [Green Version]
  10. Grünwald, N.J.; Everhart, S.E.; Knaus, B.J.; Kamvar, Z.N. Best practices for population genetic analyses. Phytopathology 2017, 107, 1000–1010. [Google Scholar] [CrossRef] [PubMed] [Green Version]
  11. Fang, C.T. Physiologic specialization of Puccinia glumarum Erikss. and Henn. in China. Phytopathology 1944, 34, 1020–1024. [Google Scholar]
  12. Chen, C.Q.; Zheng, W.M.; Buchenauer, H.; Huang, L.L.; Lu, N.H.; Kang, Z.S. Isolation of microsatellite loci from expressed sequence tag library of Puccinia striiformis f. sp. tritici. Mol. Ecol. Resour. 2009, 9, 236–238. [Google Scholar] [CrossRef]
  13. Wan, A.; Zhao, Z.; Chen, X.; He, Z.; Jin, S.; Jia, Q.; Yao, G.; Yang, J.; Wang, B.; Li, G.; et al. Wheat stripe rust epidemic and virulence of Puccinia striiformis f. sp. tritici in China in 2002. Plant Dis. 2004, 88, 896–904. [Google Scholar] [CrossRef] [PubMed] [Green Version]
  14. Gad, M.A.A.; Li, H.X.; Alam, M.A.; Sajjad, M.; Li, M.J. Geographical distribution and virulence phenotypes of Puccinia striiformis f. sp. tritici from wheat in Yunnan, China. Scienceasia 2019, 45, 572–580. [Google Scholar] [CrossRef] [Green Version]
  15. Gangwar, O.P.; Kumar, S.; Bhardwaj, S.C.; Prasad, P.; Kashyap, P.L.; Khan, H.; Singh, G.P.; Savadi, S. Virulence and molecular diversity among Puccinia striiformis f. sp. tritici pathotypes identified in India between 2015 and 2019. Crop Prot. 2021, 148, 105717. [Google Scholar] [CrossRef]
  16. Linde, C.C. Population genetic analyses of plant pathogens: New challenges and opportunities. Australas. Plant Pathol. 2010, 39, 23–28. [Google Scholar] [CrossRef]
  17. Enjalbert, J.; Duan, X.; Leconte, M.; Hovmøller, M.S.; De Vallavieille-Pope, C. Genetic evidence of local adaptation of wheat yellow rust (Puccinia striiformis f. sp. tritici) within France. Mol. Ecol. 2005, 14, 2065–2073. [Google Scholar] [CrossRef]
  18. Mboup, M.; Leconte, M.; Gautier, A.; Wan, A.M.; Chen, W.; de Vallavieille-Pope, C.; Enjalbert, J. Evidence of genetic recombination in wheat yellow rust populations of a Chinese oversummering area. Fungal Genet. Biol. 2009, 46, 299–307. [Google Scholar] [CrossRef]
  19. Liang, J.; Liu, X.; Li, Y.; Wan, Q.; Ma, Z.; Luo, Y. Population genetic structure and the migration of Puccinia striiformis f. sp. tritici between the Gansu and Sichuan Basin populations of China. Phytopathology 2016, 106, 192–201. [Google Scholar] [CrossRef] [Green Version]
  20. Liang, J.; Liu, X.; Tsui, C.; Ma, Z.; Luo, Y. Genetic structure and asymmetric migration of wheat stripe rust pathogen in western epidemic areas of China. Phytopathology 2021, 111, 1252–1260. [Google Scholar] [CrossRef]
  21. Enjalbert, J.; Duan, X.; Giraud, T.; Vautrin, D.; De Vallavieille-Pope, C.; Solignac, M. Isolation of twelve microsatellite loci, using an enrichment protocol, in the phytopathogenic fungus Puccinia striiformis f. sp. tritici. Mol. Ecol. Notes 2002, 2, 563–565. [Google Scholar] [CrossRef]
  22. Bahri, B.; Leconte, M.; de Vallavieille-Pope, C.; Enjalbert, J. Isolation of ten microsatellite loci in an EST library of the phytopathogenic fungus Puccinia striiformis f. sp. tritici. Conserv. Genet. 2009, 10, 1425–1428. [Google Scholar] [CrossRef]
  23. Hu, X.; Ma, L.; Liu, T.; Wang, C.; Peng, Y.; Pu, Q.; Xu, X. Population genetic analysis of Puccinia striiformis f. sp. tritici suggests two distinct populations in Tibet and the other regions of China. Plant Dis. 2017, 101, 288–296. [Google Scholar] [CrossRef] [PubMed] [Green Version]
  24. Liu, T.; Bai, Q.; Wang, M.; Li, Y.; Wan, A.; See, D.R.; Xia, C.; Chen, X. Genotyping Puccinia striiformis f. sp. tritici isolates with SSR and SP-SNP markers reveals dynamics of the wheat stripe rust pathogen in the United States from 1968 to 2009 and identifies avirulence-associated markers. Phytopathology 2021, 111, 1828–1839. [Google Scholar] [CrossRef]
  25. Zhan, G.; Zhuang, H.; Wang, F.; Wei, G.; Huang, L.; Kang, Z. Population genetic diversity of Puccinia striiformis f. sp. tritici on different wheat varieties in Tianshui, Gansu Province. World J. Microbiol. Biotechnol. 2013, 29, 173–181. [Google Scholar] [CrossRef]
  26. Chu, B.; Yuan, K.; Wang, C.; Yang, L.; Jiang, B.; Gu, Y.; Ma, Z. Effects of wheat cultivar mixtures on population genetic structure of puccinia striiformis f. sp. tritici. PhytoFrontiers 2021, 1, 339–353. [Google Scholar] [CrossRef]
  27. Kamvar, Z.N.; Amaradasa, B.S.; Jhala, R.; McCoy, S.; Steadman, J.R.; Everhart, S.E. Population structure and phenotypic variation of Sclerotinia sclerotiorum from dry bean (Phaseolus vulgaris) in the United States. PeerJ 2017, 5, e4152. [Google Scholar] [CrossRef] [PubMed] [Green Version]
  28. Zeng, S.M.; Luo, Y. Long-distance spread and interregional epidemics of wheat stripe rust in China. Plant Dis. 2006, 90, 980–988. [Google Scholar] [CrossRef] [Green Version]
  29. Liang, J.; Wan, Q.; Luo, Y.; Ma, Z. Population genetic structures of Puccinia striiformis in Ningxia and Gansu provinces of China. Plant Dis. 2013, 97, 501–509. [Google Scholar] [CrossRef] [Green Version]
  30. Wang, S.; Chu, B.; Liu, Q.; Luo, Y.; Ma, Z. Development of a sequence-characterized amplified region marker using inter-simple sequence repeats for detection of Puccinia striiformis f. sp. tritici. J. Phytopathol. 2017, 165, 442–447. [Google Scholar] [CrossRef]
  31. Cheng, P.; Chen, X.; Xu, L.; See, D. Development and characterization of expressed sequence tag-derived microsatellite markers for the wheat stripe rust fungus Puccinia striiformis f. sp. tritici. Mol. Ecol. Resour. 2012, 12, 779–781. [Google Scholar]
  32. Zhan, G.M.; Wang, F.P.; Luo, H.Y.; Jiang, S.C.; Zheng, W.M.; Huang, L.L.; Kang, Z.S. Screening for simple sequence repeat markers in Puccinia striiformis tritici based on genomic sequence. J. Zhejiang Univ. Sci. B 2015, 16, 727–732. [Google Scholar] [CrossRef] [Green Version]
  33. Holland, M.M.; Parson, W. GeneMarker® HID: A reliable software tool for the analysis of forensic STR data. J. Forensic Sci. 2011, 56, 29–35. [Google Scholar] [CrossRef] [PubMed]
  34. Peakall, R.; Smouse, P.E. GenAlEx 6.5: Genetic analysis in Excel. Population genetic software for teaching and research—An update. Bioinformatics 2012, 28, 2537–2539. [Google Scholar] [CrossRef] [PubMed] [Green Version]
  35. Kamvar, Z.N.; Tabima, J.F.; Grünwald, N.J. Poppr: An R package for genetic analysis of populations with clonal, partially clonal, and/or sexual reproduction. PeerJ 2014, 2, e281. [Google Scholar] [CrossRef] [PubMed] [Green Version]
  36. Shannon, C.E. A mathematical theory of communication. Bell Syst. Tech. J. 1948, 27, 379–423. [Google Scholar] [CrossRef] [Green Version]
  37. Grünwald, N.J.; Goodwin, S.B.; Milgroom, M.G.; Fry, W.E. Analysis of genotypic diversity data for populations of microorganisms. Phytopathology 2003, 93, 738–746. [Google Scholar] [CrossRef] [Green Version]
  38. Ludwig, J.A.; Reynolds, J.F. Statistical Ecology: A Primer on Methods and Computing; John Wiley and Sons: New York, NY, USA, 1988. [Google Scholar]
  39. Nei, M. Estimation of average heterozygosity and genetic distance from a small number of individuals. Genetics 1978, 89, 583–590. [Google Scholar] [CrossRef]
  40. Agapow, P.M.; Burt, A. Indices of multilocus linkage disequilibrium. Mol. Ecol. Notes 2001, 1, 101–102. [Google Scholar] [CrossRef]
  41. Nei, M.; Tajima, F.; Tateno, Y. Accuracy of estimated phylogenetic trees from molecular data. II. Gene frequency data. J. Mol. Evol. 1983, 19, 153–170. [Google Scholar] [CrossRef]
  42. Pritchard, J.K.; Stephens, M.; Donnelly, P. Inference of population structure using multilocus genotype data. Genetics 2000, 155, 945–959. [Google Scholar] [CrossRef]
  43. Evanno, G.; Regnaut, S.; Goudet, J. Detecting the number of clusters of individuals using the software STRUCTURE: A simulation study. Mol. Ecol. 2005, 14, 2611–2620. [Google Scholar] [CrossRef] [Green Version]
  44. Earl, D.A.; von Holdt, B.M. STRUCTURE HARVESTER: A website and program for visualizing STRUCTURE output and implementing the Evanno method. Conserv. Genet. Resour. 2012, 4, 359–361. [Google Scholar] [CrossRef]
  45. Excoffier, L.; Smouse, P.E.; Quattro, J.M. Analysis of molecular variance inferred from metric distances among DNA haplotypes: Application to human mitochondrial DNA restriction data. Genetics 1992, 131, 479–491. [Google Scholar] [CrossRef] [PubMed]
  46. Bruvo, R.; Michiels, N.K.; D’Souza, T.G.; Schulenburg, H. A simple method for the calculation of microsatellite genotype distances irrespective of ploidy level. Mol. Ecol. 2004, 13, 2101–2106. [Google Scholar] [CrossRef] [PubMed]
  47. Jaimes, Y.; Gonzalez, C.; Rojas, J.; Rivera, J.J.; Cilas, C.; Argout, X. Population structure of Moniliophthora perniciosa in the main cacao producing departments of Colombia. Plant Dis. 2022, 106, 1492–1501. [Google Scholar] [CrossRef] [PubMed]
  48. Tollenaere, C.; Susi, H.; Laine, A.L. Evolutionary and epidemiological implications of multiple infection in plants. Trends Plant Sci. 2016, 21, 80–90. [Google Scholar] [CrossRef] [PubMed]
  49. Thrall, P.H.; Burdon, J.J. Evolution of virulence in a plant host-pathogen metapopulation. Science 2003, 299, 1735–1737. [Google Scholar] [CrossRef] [PubMed] [Green Version]
  50. Thrall, P.H.; Laine, A.L.; Ravensdale, M.; Nemri, A.; Dodds, P.N.; Barrett, L.G.; Burdon, J.J. Rapid genetic change underpins antagonistic coevolution in a natural host-pathogen metapopulation. Ecol. Lett. 2012, 15, 425–435. [Google Scholar] [CrossRef] [Green Version]
  51. Jin, Y.; Szabo, L.J.; Carson, M. Century-old mystery of Puccinia striiformis life history solved with the identification of Berberis as an alternate host. Phytopathology 2010, 100, 432–435. [Google Scholar] [CrossRef] [Green Version]
  52. Zhao, J.; Wang, M.; Chen, X.; Kang, Z. Role of Alternate hosts in epidemiology and pathogen variation of cereal rusts. Annu. Rev. Phytopathol. 2016, 54, 207–228. [Google Scholar] [CrossRef]
Figure 1. Locations of experimental plots from which isolates of Puccinia striiformis f. sp. tritici were collected from five wheat cultivars in Yanting and Fucheng, Sichuan province, China. Map shapefile and DEM data were downloaded from https://www.resdc.cn (accessed on 19 May 2022).
Jof 08 00705 g001
Figure 2. Number of isolates with different multilocus SSR genotypes detected in Puccinia striiformis f. sp. tritici populations from five wheat cultivars in Yanting and Fucheng.
Jof 08 00705 g002
Figure 3. Relationships among Puccinia striiformis f. sp. tritici populations from five wheat cultivars in Yanting and Fucheng. The dendrogram was constructed using the unweighted pair group method with arithmetic mean based on Nei’s genetic distance. Numbers at branch points indicate the percent occurrence of the cluster to the right of the branch in 1000 bootstrapped dendrograms (node values greater than 50% are shown).
Jof 08 00705 g003
Figure 4. Population genetic structure of Puccinia striiformis f. sp. tritici analyzed in STRUCTURE v 2.3.4. (A) Comparison of ΔK values for acquisition of the optimal K-value from STRUCTURE harvester. (B) Population structure of 289 Puccinia striiformis f. sp. tritici isolates collected from five wheat cultivars in Yanting and Fucheng inferred using a Bayesian clustering algorithm implemented in STRUCTURE v 2.3.4. Each individual isolate is represented by a vertical line partitioned into shaded segments corresponding to the isolate’s estimated mean membership coefficient in K = 2 genetic clusters. Membership coefficients were estimated from 10 replicate runs for each K. Vertical black lines separate isolates sampled from different hosts and each host is labeled below.
Jof 08 00705 g004
Figure 5. Minimum spanning networks (MSNs) showing the multilocus genotypes (MLGs) of Puccinia striiformis f. sp. tritici from five wheat cultivars in Yanting (A) and Fucheng (B), respectively, as well as all MLGs from both Yanting and Fucheng (C). Each multilocus genotype is represented by one node sized in proportion to its frequency in the populations. The black-to-grey scale bar shows Bruvo’s genetic distance between MLGs; the further the genetic distances, the lighter the color and thinner the line.
Jof 08 00705 g005
Table 1. The infection type and disease index for five wheat cultivars in the field.
No.CultivarsInfection Types (ITs)Disease Index (DI) ± SE
YantingFucheng
1Mingxian 169423.30 ± 2.17 a22.74 ± 5.58 a
2Mianmai 3671–31.35 ± 0.19 c5.08 ± 0.94 c
3Xikemai 41–31.61 ± 0.34 c1.59 ± 0.47 d
4Xiaoyan 222–45.65 ± 0.80 b15.41 ± 2.70 b
5Zhengmai 90232–34.38 ± 0.60 bc5.34 ± 0.41 c
Note: Different lowercase letters indicate a significant difference at p = 0.05.
Table 2. Genetic diversity and multilocus linkage disequilibrium of Puccinia striiformis f. sp. tritici populations collected from five wheat cultivars in Yanting and Fucheng.
LocationHost
(Cultivar Names)
Population
Code
nNaNeMLGeMLGHE5HexprbarD
YantingMingxian 169 YtMX282.07 ± 0.121.44 ± 0.0887.48 ± 0.631.670.580.280.65 *
Mianmai 367 YtMM372.20 ± 0.111.48 ± 0.08149.22 ± 1.351.940.470.310.47 *
Xikemai 4 YtXK312.20 ± 0.111.32 ± 0.05149.62 ± 1.311.840.410.230.48 *
Xiaoyan 22 YtXY332.00 ± 0.101.32 ± 0.04117.79 ± 1.221.690.520.240.76 *
Zhengmai 9023YtZM271.80 ± 0.151.10 ± 0.0397.52 ± 0.931.500.480.080.32 *
Yanting 1562.05 ± 0.051.33 ± 0.03459.64 ± 0.932.390.250.240.52 *
FuchengMingxian 169 FcMX342.20 ± 0.111.51 ± 0.11108.82 ± 0.872.040.700.300.46 *
Mianmai 367 FcMM362.13 ± 0.101.50 ± 0.101710.40 ± 1.462.060.400.31 0.70 *
Xikemai 4FcXK222.20 ± 0.151.44 ± 0.111110.35 ± 0.642.000.600.260.30 *
Xiaoyan 22FcXY202.20 ± 0.111.45 ± 0.1499.00 ± 0.001.940.740.260.32 *
Zhengmai 9023 FcZM211.73 ± 0.151.43 ± 0.1355.00 ± 0.001.480.820.240.25 *
Fucheng1332.09 ± 0.061.47 ± 0.054011.95 ± 1.862.940.460.30 0.32 *
Total2892.07 ± 0.041.40 ± 0.037612.11± 1.973.200.340.320.31 *
Note: n, number of individuals; Na, number of alleles; Ne, effective number of alleles; MLG, number of multilocus genotypes (MLGs) observed; eMLG, the number of expected MLGs at the smallest sample size based on rarefaction with standard error (SE); H, Shannon–Wiener index of MLG diversity; E5, evenness; Hexp, Nei’s unbiased gene diversity; rbarD, the standardized index of association; *, estimates significant at p = 0.001.
Table 3. Analysis of molecular variance (AMOVA) for Puccinia striiformis f. sp. tritici populations collected from five wheat cultivars in Yanting and Fucheng.
Sourced.f.SSPV (%)p
Among geographical locations1206.7725.24%0.001
Among host populations873.174.48%0.001
Among individuals279603.699.20%0.001
Within individuals289480.5061.08%0.001
Note: d.f., degrees of freedom; SS, sum of squared observations; PV (%), percentage of total variance. p values are based on 999 permutations.
Table 4. Pairwise FST differentiation between collections of Puccinia striiformis f. sp. tritici from different wheat cultivars in Yanting and Fucheng.
YantingFucheng
YtMXYtMMYtXYYtXKYtZMFcMXFcMMFcXYFcXKFcZM
YtMX
YtMM0.009
YtXY0.0010.018
YtXK0.0070.0050.000
YtZM0.114 *0.091 0.066 0.044
FcMX0.220 *0.180 *0.278 *0.232 *0.402 *
FcMM0.328 *0.245 *0.372 *0.345 *0.478 *0.169 *
FcXY0.313 *0.222 *0.366 *0.320 *0.504 *0.086 *0.032
FcXK0.246 *0.176 *0.302 *0.244 *0.429 *0.0170.134 *0.033
FcZM0.233 *0.152 *0.283 *0.221 *0.400 *0.0520.134 *0.0360.000
Note: FST, value below diagonal; *, significance level p = 0.001; p values are based on 999 permutations; negative FST estimates were converted to zero. The five wheat cultivars were Mingxian 169 (MX), Xiaoyan 22 (XY), Zhengmai 9023 (ZM), Mianmai 367 (MM), and Xikemai 4 (XK).
Publisher’s Note: MDPI stays neutral with regard to jurisdictional claims in published maps and institutional affiliations.

