Abstract
Phytophthora infections are followed by histological alterations, physiological and metabolomic adjustments in the host but very few studies contemplate these changes simultaneously. Fagus sylvatica seedlings were inoculated with A1 and A2 mating types of the heterothallic P. ×cambivora and with the homothallic P. plurivora to identify plant physiological and metabolomic changes accompanying microscope observations of the colonization process one, two and three weeks after inoculation. Phytophthora plurivora-infected plants died at a faster pace than those inoculated with P. ×cambivora and showed higher mortality than P. ×cambivora A1-infected plants. Phytophthora ×cambivora A1 and A2 caused similar progression and total rate of mortality. Most differences in the physiological parameters between inoculated and non-inoculated plants were detected two weeks after inoculation. Alterations in primary and secondary metabolites in roots and leaves were demonstrated for all the inoculated plants two and three weeks after inoculation. The results indicate that P. plurivora is more aggressive to Fagus sylvatica seedlings than both mating types of P. ×cambivora while P. ×cambivora A1 showed a slower infection mode than P. ×cambivora A2 and led to minor plant metabolomic adjustments.
1. Introduction
Phytophthora species are serious pathogens of forest trees worldwide, causing a variety of disease symptoms and huge ecological and economical losses [1]. In Europe, typical examples of devastating Phytophthora epidemics of forest ecosystems are oak decline caused by P. cinnamomi Rands, P. quercina Jung and other species [1,2,3,4,5], beech decline caused by P. plurivora Jung and Burgess and P. ×cambivora Petri (Buisman) and other species [1,6,7,8,9], and alder dieback caused by species from the P. ×alni complex [1,10,11,12,13]. The biggest risk for the health and stability of European forests is the introduction of non-native pathogenic Phytophthora species from other continents into previously uninfected forest ecosystems via the planting of infested nursery stock [1,14].
One of the most widespread and economically and ecologically most important tree species in temperate regions of Europe is the European beech (Fagus sylvatica L.). However, this tree species is highly susceptible to Phytophthora infections and an extensive decline has been observed since the mid-1990s in natural forests, planted forests, parks and amenity trees [1,6,8,9]. Phytophthora ×cambivora and P. plurivora seem to be the most aggressive and most common Phytophthora spp. associated with declining beech, attacking fine and woody roots, the bark at the collar and along stems and branches, and shoots [1,6,9,15,16,17,18,19,20,21]. Phytophthora ×cambivora, previously known as P. cambivora and one of the causal agents of ink disease of chestnut [1,8,22], was recently redescribed as an allopolyploid hybrid species within Phytophthora Clade 7a which most likely originated from East Asia [17]. It has a heterothallic mating system (i.e. sexual reproduction only when the two compatibility (=mating) types A1 and A2 co-occur) and high intraspecific variability. It is commonly found as an invasive pathogen in the Americas and Europe. In the Americas the mating types of P. ×cambivora show regional differences in predominance. For instance, in Oregon, the A1 mating type is more frequently isolated from natural and semi-natural ecosystems than the A2 mating type [23,24], while in Argentina and Chile only the A2 type was isolated from soil samples collected under Austrocedrus chilensis and F. sylvatica trees, respectively [25,26]. In European natural ecosystems the A2 mating type of P. ×cambivora is apparently more widespread than the A1 mating type [17,19,21]. However, most studies did not specify the mating type. In pathogenicity trials with golden chinquapin (Chrysolepis chrysophylla) in both natural forests and in a greenhouse in Oregon, both mating types showed similar aggressiveness in terms of mortality and bark lesion area [23]. In other pathogenicity trials which tested either the A1 [24,27] or the A2 mating type of P. ×cambivora [17,21,28] bark lesions on stems and roots and root rot developed on different hosts. At a global scale there is a lack of pathogenicity tests comparing aggressiveness of both mating types of P. ×cambivora, or other heterothallic Phytophthora species in general, to native woody plants. This raises the question whether both mating types of P. ×cambivora are posing a similar threat to European tree species. The exotic invasive P. plurivora is also commonly associated with declining European beech forests [1,8,9,29] and demonstrated high aggressiveness to beech in pathogenicity tests [15,30,31]. It is a homothallic species within phylogenetic Clade 2c, also known as the ‘P. citricola species complex’, which most likely originated in southeast and east Asia [32,33].
On various host plant species the physiological effects of Phytophthora inoculations have been demonstrated including significant reductions in CO2 assimilation, stomatal conductance and chlorophyll fluorescence [34,35,36]. Only a few studies examined and showed changes in spectral reflectance at greenhouse [37] and field assays [38]. Physiological alterations in early infection stages include reduced photosynthetic rates which can be accompanied by simultaneous or subsequent hydraulic failures [39]. The study of metabolomics is also a powerful tool that provides deeper insights into the intra- and extracellular interactions of plant cells. Several studies have shown that numerous metabolites can discriminate Phytophthora-infected and non-infected plants [40,41]. However, there are no studies that combine both approaches, metabolomics and physiological assessments which could advance our understanding of pathogenesis. The objectives of this work were to (i) compare the aggressiveness of the A1 and A2 mating types of P. ×cambivora and P. plurivora on F. sylvatica seedlings, and (ii) assess the plant physiological and metabolomic alterations caused by the infections.
2. Materials and Methods
2.1. Plant Material
Five months-old F. sylvatica seedlings grown from stratified seeds were used in the pathogenicity trial. Seeds were collected from a F. sylvatica seed plantation located in Jizerské Hory region in the north of Czech Republic. Seedlings were grown in 12 cell-seed trays containing perlite as substrate and placed in an airconditioned greenhouse at 20–22 °C with a light regime of 16 h light and 8 h darkness. The volume of each cell in the tray was approximately 220 cm3. Each tray was placed in a plastic box and randomly distributed in the greenhouse. Two months prior to the inoculation, plants were fertilized with granules of a NPK fertilizer (Osmocote, ICL, Ipswich, UK).
2.2. Inoculation
Four replicates of 12-cell trays per P. ×cambivora isolate with 10–11 F. sylvatica seedlings were used. Plants were inoculated in July 2019 with each two different isolates of the A1 and A2 mating types of P. ×cambivora, respectively. In addition, two replicates of 12-cell trays (in total 22 seedlings) were inoculated with an isolate of P. plurivora as a comparison. Five replicates of 12-cell trays with 10–11 F. sylvatica seedlings per tray were used as non-infested control. The isolates for this study were sourced from the Phytophthora Research Centre culture collection: TJ29 (P. ×cambivora A2 isolate from F. sylvatica in Slovakia), TJ197 (P. ×cambivora A2 neotype isolate CBS 141218 from Quercus pubescens in Italy), TJ30 and TJ543 (P. ×cambivora A1 isolates from F. sylvatica in Germany and Belgium, respectively) and TJ71 (P. plurivora extype isolate CBS 124093 from F. sylvatica in Germany). All isolates were collected by T. Jung except for the isolate TJ543 which was isolated (under the code Resi 75) by Anne Chandelier.
The isolates were subcultured onto clarified V8-juice agar media (V8A), prepared with 100 mL/L of clarified vegetable juice (Pfanner Gmbh, Lauterach, Austria); 2 g/L of CaCO3; 18 g/L of agar (Sigma Group a.s., Lutín, Czech Republic); and 900 mL/L of distilled water. All isolates were incubated at 22–25 °C in the dark. Then mycelial agar squares of ca. 1.5 × 1.5 cm were cut with a sterilized scalpel from the margins of 6–8-day-old cultures of the respective Phytophthora isolates. The agar plugs were immersed in sterile 90 mm Petri dishes filled with distilled water (Figure 1a). Within the first six hours the water was changed twice and then the plugs were placed in sterilized 0.7 L glass jars. The beech seedlings were gently extracted from the cells (Figure 1b) and inoculated by immersion of their bare root systems in the jars containing 0.5 L of distilled water and five mycelial agar plugs of the respective Phytophthora isolates (Figure 1c,d). After 48 h of incubation (Figure 1e), the seedlings were potted again (Figure 1f) in the cell trays within the plastic boxes containing 2 L of distilled water and 15 agar plugs of the respective Phytophthora isolate. Before the inoculations, the sporangia production of all isolates on the plugs was confirmed under the light microscope at ×80 magnification. To check the ability of the plugs to sporulate, rebaitings were performed using young Quercus suber and F. sylvatica leaves as baits [6]. After 48 h the flooding water was removed, and normal drainage resumed. During the whole duration of the trial, the plants were incubated at 20 °C in an air-conditioned greenhouse.
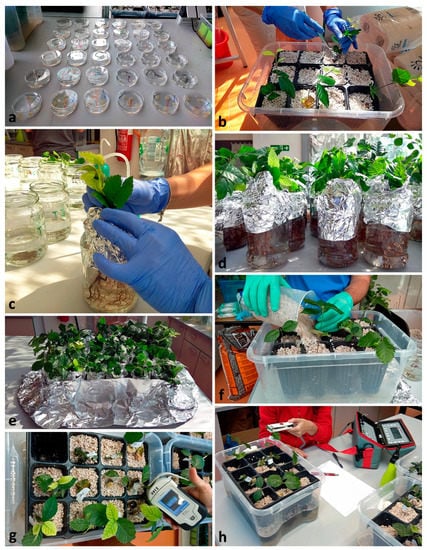
Figure 1.
Methodology of the pathogenicity trial; (a) stimulation of Phytophthora sporangia production by flooding agar discs with active mycelium in distilled water; (b) extraction of Fagus sylvatica seedlings from the cell-trays; (c) immersion of the root tips into a jar containing distilled water and Phytophthora agar plugs with sporangia; (d,e) jars with the four Fagus sylvatica -Phytophthora isolate combinations plus the non-inoculated control subjected to 48 h of immersion; (f) Fagus sylvatica seedlings placed back to the cell trays; (g) weekly spectral reflectance assessments using a PolyPen; (h) weekly stomatal conductance measurements using a portable porometer.
2.3. Sampling for Microscopic Studies
One, two and three weeks after the inoculation, each 2–3 plants per F. sylvatica-Phytophthora isolate combination and control were removed from the pots and the perlite gently washed out from the roots. Roots were surface-dried on sterile filter paper and kitchen towels, and a photo documentation was created (Figure 2a–h). Five to eight lateral root and taproot segments per plant were harvested and placed on a glass slide. Each root segment was then examined under the light microscope (Motic®®, Wetzlar, Germany) at ×40, ×100, and ×400 magnifications to determine the presence of hyphae and spores of P. ×cambivora and P. plurivora on the root surface and inside the root tissue. Roots of control plants were also examined.
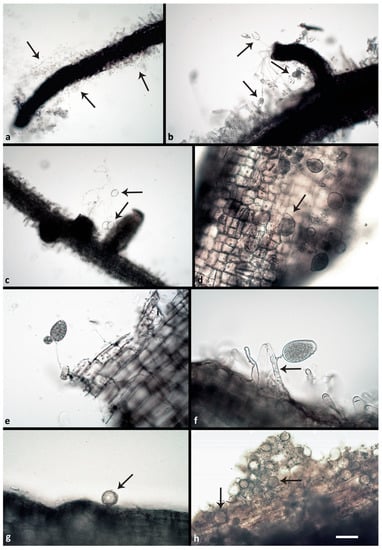
Figure 2.
Phytophthora structures formed on the surface or inside of Fagus sylvatica fine roots two and three weeks post inoculation (p.i.) with Phytophthora zoospores: (a) zoospores and zoospore cysts of P. ×cambivora A2 (arrows) 2 weeks p.i.; (b) sporangia of P. ×cambivora A2 (arrows) emerging 2 weeks p.i. from an infected lateral root; one of them showing nested proliferation; (c) empty ovoid sporangia of P. plurivora (arrows) after zoospore release, emerging 2 weeks p.i. from an infected fine root; (d) numerous semipapillate and bipapillate (arrow) sporangia of P. plurivora formed 3 weeks p.i. on an infected fine root; (e) nonpapillate ovoid sporangium of P. ×cambivora A1 with external proliferation emerging 3 weeks p.i. from an infected fine root; (f): nonpapillate ovoid sporangium of P. ×cambivora A2 emerging 3 weeks p.i. from a root hair infected with a hypha (arrow); (g) globose oogonium, containing an oospore, of P. plurivora (arrow) formed on the surface of an infected fine root 2 weeks p.i.; (h) numerous immature oogonia of P. plurivora (arrows) produced inside an infected fine root 3 weeks p.i.
At the end of the experiment after 3 weeks, additional root fragments were sampled from surviving plants and subjected to scanning electron microscopy. Root segments sampled from both tap roots and root collar were fixed overnight in FAA solution (formaldehyde: glacial acetic acid: ethanol, 1: 1: 18 v/v/v) at 4 °C. Free-hand transverse sections were dehydrated in ethanol and acetone, and dried in liquid CO2 using a Leica EM CPD030 critical point drier (Leica Microsystems, Wetzlar, Germany). Root sections were mounted on specimen stubs, sputter-coated with gold in the Sputter Coater K650X (Quorum Technologies, Ashford, UK) under argon atmosphere, and examined by high-vacuum scanning electron microscopy using a JEOL JSM-6390 instrument (JEOL, Tokyo, Japan) operating at the range of 15 to 20 kV.
2.4. Re-Isolation of Phytophthora spp.
Simultaneously with the sampling for microscopic assessments one, two and three weeks after the inoculation, 10–15 necrotic root samples were taken from each 2–3 plants per F. sylvatica-Phytophthora isolate combination and the control and plated onto selective PARPNH agar [2] to confirm the presence of the inoculated Phytophthora species and, hence, fulfilling Koch’s postulates. Hyphae growing from plated root fragments were subcultured onto V8A and incubated at 20 °C in the dark. Classical morphological species identification at ×400 magnification under a light microscope was performed according to [29,32].
2.5. Physiological Measurements
A minimum subset of six plants per F. sylvatica-Phytophthora isolate combination was randomly selected for the physiological measurements (Figure 1g,h). Starting from the plant apex two to six fully expanded leaves were used for the physiological measurements, with readings recorded from the adaxial leaf surface. Measurements were taken one, two and three weeks after inoculation. Leaf stomatal conductance (gs) measurements were taken with a portable porometer (AT porometer AP4, Delta-t devices, Burwell, Cambridge, UK) from 12:00 to 15:30. Steady-state maximum quantum yield of photosystem II (Fv/Fm) and leaf reflectance were measured using FluorPen FP100 and PolyPen RP 400 UVIS instruments, respectively (Photon Systems Instruments, Brno, Czech Republic) from 9:00 to 11:30. Four reflectance-based physiological indices that are based on chlorophyll and carotenoids absorption features were determined from the PolyPen dataset: the Normalized Difference Vegetation Index (NDVI) = (R780-R630)/(R780 + R630), [42], the Photochemical Reflectance Index (PRI) = (R531 − R570)/(R531 + R570) [43], the Structure Intensive Pigment Index (SIPI) = (R790 − R450)/(R790 + R650) [43] and Carotenoid Reflectance Index (CRI1) = 1/R510 − 1/R550 [44], where R refers to reflectance and subscript indicates the wavelength in nanometers.
2.6. Metabolomic Analyses
A total of six plants from the P. plurivora inoculation treatment and 12 plants from the P. ×cambivora inoculation and control treatments were collected for the metabolomics analysis 2 and 3 weeks after inoculation. Plants were gently removed from their cells and leaf and fine root samples were collected, immediately frozen, and kept at −80 °C until further processing. After homogenization, approximately 0.1 g of fresh weight were extracted using the methanol/ether/water method, as described previously [45]. Briefly, 1 mL of methanol/methyl tert-butyl ether/water (1:3:1) was added to each sample, which were then kept at 4 °C for 30 min under gentle shaking. Afterwards, 0.5 mL of methanol/water (1:3) were added and the samples were centrifuged to allow phase-separation. The apolar phase was collected and 30 µL were aliquoted for the metabolomic analysis.
For sample derivatization, aliquots of the apolar phase were vacuum-dried, 20 µL of 40 mg/mL methoxyaminhydrochloride (dissolved in pyridine) were added, and samples were incubated for 90 min at 30 °C. Then, 80 µL of MSTFA were added and samples were incubated for further 30 min at 37 °C. Lastly, samples were centrifuged and around 50 µL were transferred into glass inserts prior to injection in the GC-MS. Derivatized samples were injected in a Thermo-Fisher Q Exactive GC Orbitrap GC-MS for untargeted full scan profiling. The resulting chromatograms were processed using Thermo TraceFinder software, with which peak retention times and ion masses were compared to those covered in Mainlib and GC-Orbotrap Metabolomics libraries. The areas of those peaks with positive identification (score ≥75 and ΔRI <5%) were compared to the equivalent peaks in control samples in order to visualize the changes in plant metabolome following Phytophthora infection. A minimum of six independent biological replicates were performed per time and isolate/mating type.
2.7. Data Analysis
2.7.1. Mortality
Survival curves describing the relationship between the mortality rate and time after the infection were computed using the Kaplan–Meier method implemented in the R package survival [46]. Differences in the survival curves between the plants infested with the corresponding mating types/species and between the plants infested with the corresponding mating types/isolates and the non-infested plants were analyzed by means of log-rank test with a correction for multiple testing using the R package survminer [47]. The differences in mortality rates at the end of the experiment (3 weeks after the inoculation) between the plants inoculated with the different mating types, species and isolates of Phytophthora and between the plants inoculated with the different mating types, species and isolates of Phytophthora and the non-infected plants were tested using the generalized linear model with the binomial family and subsequent likelihood ratio test using standard R functions [48] from the package stats.
2.7.2. Physiology
All statistical analyses related to physiological parameters and mortality were performed in R 3.6.3 [48]. All tests were carried out at the significance level α = 0.05. Due to the lack of significant differences in mortality and in most physiological parameters between isolates within the same species and within the same mating type (Figure S1), all plants inoculated with the same mating type of P. ×cambivora were considered as one treatment. Plants that were found dead and could therefore not be measured 3 weeks after the inoculation were excluded from the dataset.
Differences in the leaf conductance, maximum quantum yield of photosystem II and spectral reflectance indices between the mating types/individual isolates and non-infected plants were analyzed by means of generalized linear models (GLM) and follow-up likelihood ratio tests (LRT) using standard R functions from the package stats. Multiple comparisons were conducted via the R package multcomp [49] using the HC3 estimator accounting for heterogeneous variances implemented in the R package sandwich [50,51,52].
2.7.3. Metabolomic Profiling
The metabolomic differences between treatments were analyzed by means of log-normal generalized linear models followed by the likelihood ratio test and multiple comparisons as described above. Heatmaps were constructed using the R package ComplexHeatmap [53]. Values displayed in the heatmaps are log base 2 of the ratio between the peak metabolite areas of the tested samples and the respective reference groups.
2.7.4. Visualization
The figures accompanying all the above-mentioned analyses were created with R packages ggplot [54] and survminer [47] and Inkscape 0.92 [55].
3. Results
3.1. Viability of Isolates and Light and Scanning Electron Microscopy Observations
All respective Phytophthora isolates could be successfully reisolated from all plated root pieces. Furthermore, all isolates were successfully re-isolated from leaf baits floating in the water during the flooding period. One week after the inoculation (post inoculation = p.i.), zoospore cysts were abundantly observed on the root surfaces (Figure 2a), while sporangia were rare and scattered. Numerous cysts were germinating with germ tubes that penetrated the fine root epidermis. Two weeks p.i., microscopic observations of the roots revealed abundant production of sporangia and zoospores by the A2 mating type of P. ×cambivora (Figure 2b), and by P. plurivora (Figure 2c). Sporangia were produced on sporangiophores emerging from the surface of roots and fine root tips (Figure 2b,c), and even on the surface of fine root hairs, after the previous formation of appressoria-like structures (Figure 2a). Phytophthora plurivora had formed immature oogonia on the root surface (Figure 2g) and inside the tissue of lateral roots. However, on the surface of roots inoculated with the A1 mating type of P. ×cambivora, only cysts and hyphae could be observed. After 3 weeks the number of sporangia and germinating cysts on the roots of P. plurivora-infected plants had increased (Figure 2d). Moreover, the A1 mating type isolates of P. ×cambivora produced sporangia on the surface of taproots (Figure 2e) and lateral roots. The A2 mating type of P. ×cambivora also formed sporangia on the surface of fine root hairs (Figure 2f). Numerous oogonia of P. plurivora were observed inside necrotic root tissue (Figure 2h). After 3 weeks control plants had only healthy roots (Figure 3a) without the presence of any Phytophthora structures on the surface. In contrast, most taproots and lateral fine roots inoculated three weeks before with zoospores of the three Phytophthora species and mating types, respectively, were necrotic (Figure 3b–d). Examination of root fragments under the scanning electron microscope at the end of the experiment also showed the colonization of root tissues by all Phytophthora isolates. Phytophthora hyphae were found predominantly in taproots and at a lower density also in the root collar. In both root regions, hyphae had penetrated through the root cortex and colonized the internal root tissues by intracellular growth in the secondary xylem vessels and in parenchyma cells using the pits to spread between cells (Figure 4a,c–h). Control roots contained no hyphae (Figure 4b).
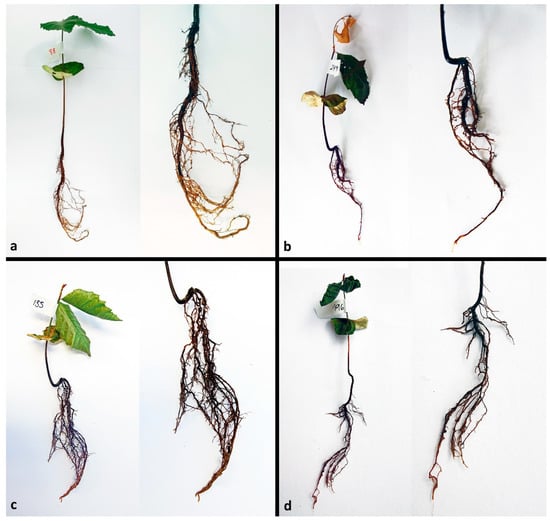
Figure 3.
Representative Fagus sylvatica seedlings and their root systems three weeks after inoculation with Phytophthora zoospores; (a) non-inoculated control plant with healthy leaves and healthy root system with bright yellowish lateral roots and taproot; (b) wilting dying plant inoculated with P. plurivora; the taproot and most lateral roots are dark-brown and necrotic; (c) wilting plant inoculated with P. ×cambivora A1; the taproot and most lateral roots are dark-brown and necrotic; (d) wilting plant inoculated with P. ×cambivora A2; the taproot and most lateral roots are dark-brown and necrotic.
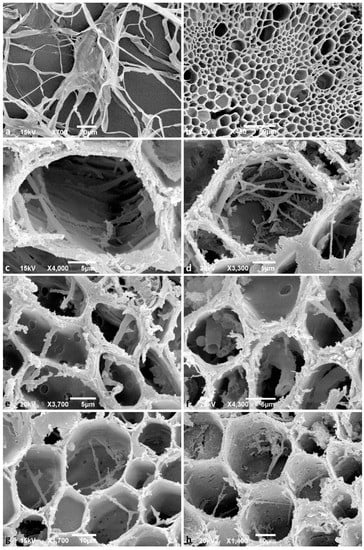
Figure 4.
Scanning electron microscopy images. (a) Hyphae of Phytophthora ×cambivora A2 isolate TJ197 growing on V8-agar medium; scale bar = 20 μm; (b–h) cross-sections of Fagus sylvatica fine roots three weeks after inoculation with Phytophthora zoospores; (b) taproot of non-inoculated healthy control plant without any hyphae; scale bar = 50 μm; (c) hyphae of P. ×cambivora A1 isolate TJ30, spreading through a secondary xylem vessel of a taproot; scale bar = 5 μm; (d) hyphae of P. ×cambivora A1 isolate TJ543 in a parenchyma cell of the secondary xylem in a tap root; scale bar = 5 μm; (e) hyphae of P. ×cambivora A2 isolate TJ29 spreading via pits through parenchyma cells of the secondary xylem in a tap root; scale bar = 5 μm; (f) tubular thick hyphae of P. ×cambivora A2 isolate TJ197 inside parenchyma cells of the secondary xylem in a tap root; scale bar = 5 μm; (g) thinner hyphae of P. plurivora, isolate TJ71 spreading via pits through parenchyma cells of the secondary xylem in a tap root; scale bar = 10 μm; (h) hyphae of P. plurivora isolate TJ71 spreading via pits through parenchyma cells at the root collar; scale bar = 10 μm.
3.2. Survival Analysis
Fagus sylvatica seedlings inoculated with P. plurivora were dying significantly faster than those inoculated with both mating types of P. ×cambivora (log-rank test, A1: p ≤ 0.01, A2: p ≤ 0.05) and control plants (log-rank test, p ≤ 0.001) (Figure 5A). The mortality was significantly higher and progressed faster for plants inoculated with either mating type of P. ×cambivora compared to control plants (A1: p ≤ 0.01, A2: p ≤ 0.001). The relationship between mortality rate and time after the inoculation did not differ significantly between the two mating types of P. ×cambivora, i.e., the mortality progressed at a similar pace. At the end of the experiment, the mortality rate of all inoculated plants was significantly higher compared to the control (Figure 5B; GLM + multiple comparison test, P. ×cambivora A1: p ≤ 0.05, P. ×cambivora A2: p ≤ 0.01, P. plurivora: p ≤ 0.001). Plants infected with P. ×cambivora A1 showed similar mortality rate (33%) as the plants infected with P. ×cambivora A2 (37%). There was a significant difference in mortality rate between P. ×cambivora A1 (33%) and P. plurivora-infected plants (62%) (GLM + multiple comparison test, p ≤ 0.05) and there was not a significant difference between P. ×cambivora A2 (37%) and P. plurivora-infected plants (62%) (GLM + multiple comparison test, p > 0.05).
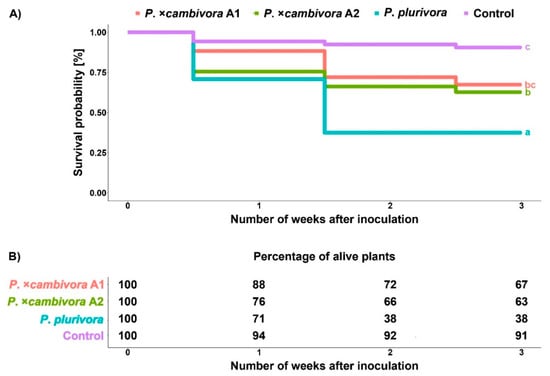
Figure 5.
Mortality: (A) Survival probabilities of Fagus sylvatica seedlings three weeks after inoculation with Phytophthora plurivora and the A1 and A2 mating types of Phytophthora × cambivora and non-infected control plants using the Kaplan–Meier test; (B) percentage of living plants one, two and three weeks after inoculation.
3.3. Physiological Measurements
One-week p.i. Phytophthora-infected plants did not differ in any physiological parameter from control plants (GLM + multiple comparison test, p ≥ 0.05). However, two weeks after inoculation the P. plurivora-infected plants showed significantly lower values of all tested spectral reflectance indices and significantly lower value of Fv/Fm compared to control plants (Figure 6; GLM + multiple comparison test, NDVI: p ≤ 0.001, PRI: p ≤ 0.001, SIPI: p ≤ 0.01, CRI1: p ≤ 0.01, Fv/Fm: p ≤ 0.001). The plants inoculated with P. ×cambivora A1 showed significantly lower gs compared to control plants (Figure 6; GLM + multiple comparison test, p ≤ 0.05). Compared with the control, the plants inoculated with P. ×cambivora A2 showed a significantly lower value of the spectral reflectance index PRI (GLM + multiple comparison test, p ≤ 0.01), Fv/Fm (GLM + multiple comparison test, p ≤ 0.01) and gs (GLM + multiple comparison test, p ≤ 0.01) (Figure 6). Phytophthora plurivora-infected plants showed significantly lower values of NDVI, PRI, SIPI, CRI1 and Fv/Fm compared to P. ×cambivora A1-infected plants (GLM + multiple comparison test, NDVI: p ≤ 0.001, PRI: p ≤ 0.001, SIPI: p ≤ 0.001, CRI1: p ≤ 0.001, Fv/Fm: p ≤ 0.001) and significantly lower values of PRI and Fv/Fm compared to P. ×cambivora A2-infected plants (GLM + multiple comparison test, PRI: p ≤ 0.001, Fv/Fm: p ≤ 0.001). The two mating types of P. ×cambivora did not differ from each other in any of the analyzed physiological parameters. Within P. ×cambivora A1, the isolates TJ30 and TJ543 showed similar effects on plants compared to control plants, except that TJ30 triggered a lower gs after two weeks. Likewise, within P. ×cambivora A2 isolates TJ29 and TJ197 produced similar effects except for Fv/Fm, being lower in plants inoculated with TJ197 than in control plants after two weeks.
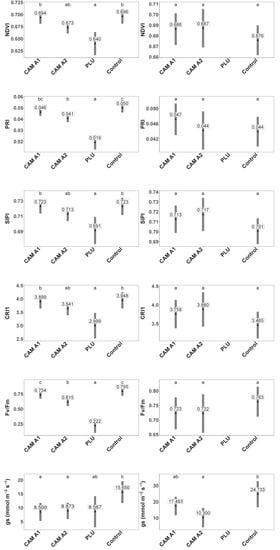
Figure 6.
Mean physiological values of Fagus sylvatica seedlings infected with Phytophthora plurivora and the A1 and A2 mating types of Phytophthora ×cambivora and of non-infected control seedlings: Mean values of spectral reflectance calculated with the Normalized Difference Vegetation Index (NDVI), the Photochemical Reflectance Index (PRI), Structure Intensive Pigment Index (SIPI) and the Carotenoid Reflectance Index (CRI1), mean values of chlorophyll fluorescence expressed as maximum quantum yield of photosystem II and stomatal conductance values (gs) of the seedlings two and three weeks after inoculation. Different letters indicate statistical differences at significance level α = 0.05.
Three weeks p.i., the mortality of P. plurivora-infected plants was already so high that there were not enough plants to carry out physiological measurements. The other isolates did not differ significantly between each other in any of the tested parameters with the only exception of the significantly lower value of gs in P. ×cambivora A2-infected plants compared to the control (GLM + multiple comparison test, p ≤ 0.01). Within P. ×cambivora A1, both isolates resulted in a similar physiological status of plants. The same was observed in the plants inoculated with either of the isolates of P. ×cambivora A2.
3.4. Root and Leaf Metabolomic Profiling
In general, the metabolomic profiling revealed that the concentration of most identified metabolites in the roots of inoculated plants drastically decreased already two weeks after inoculation compared to control plants, regardless of the Phytophthora species and mating type (Figure 7). There was a significant decrease in the total amino acid concentration and total organic acid concentration in the roots of all inoculated plants 2 weeks p.i., which became even more pronounced after 3 weeks. In addition, the total sugar content was significantly lower in the roots of P. plurivora-infected plants compared to the control 2 weeks p.i., and in all inoculation treatments 3 weeks p.i. In particular, both the concentration and the relative abundance of sucrose were significantly decreased in all infected plants (Table S1). Interestingly, the concentration and relative abundance of sugar alcohols, i.e. D-glucitol, glycerol and L-arabitol, was not decreased in infected plants, and in some cases, it was even significantly higher than in roots of control plants. However, 3 weeks p.i. the differences to the controls were less pronounced and, in the case of D-glucitol, the concentration was significantly lower in infected plants. As an exception to the general trend observed in roots, L-5-Oxoproline increased significantly in plants inoculated with the A1 mating type of P. ×cambivora compared to control plants 3 weeks p.i. (GLM + multiple comparison test, p ≤ 0.01).
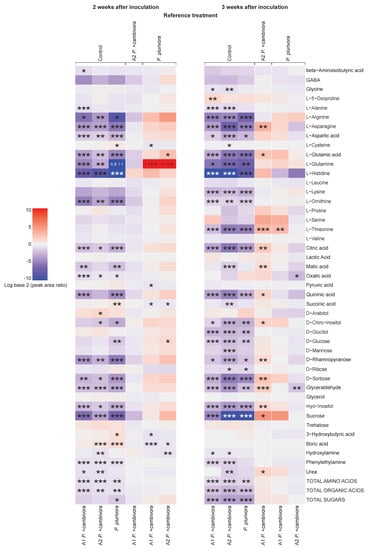
Figure 7.
Heat map of primary and secondary metabolites identified in the roots of Fagus sylvatica seedlings inoculated with Phytophthora plurivora and the A1 and A2 mating types of Phytophthora ×cambivora. Different levels of concentration to control plants are depicted by different colors and their intensities (higher—red, lower—blue). Summaries of general metabolite groups (amino acids, organic acids, sugars) are shown next to each heatmap column. Statistical levels of significance: * = p ≤ 0.05, ** = p ≤ 0.01, *** = p ≤ 0.001.
In the leaves, less pronounced differences were observed between infected and control plants, with an overall increase in metabolite concentrations in Phytophthora-infected plants (Figure 8). In particular, a significantly higher total sugar content was found in the leaves of all infected plants compared to control plants 2 weeks p.i. and in P. ×cambivora A2-infected plants also 3 weeks p.i. (Table S1). Differences in the metabolomic profiles of the infected plants between both mating types of P. ×cambivora and between both Phytophthora species were more obvious 3 weeks p.i. than 2 weeks p.i. and more pronounced in the leaves than in the roots. Two weeks p.i. the leaves of P. ×cambivora A1-infected plants displayed a significantly lower concentration of total organic acids compared to plants infected with P. ×cambivora A2 (GLM + multiple comparison test, p ≤ 0.05), and a significantly lower total sugar content compared to P. plurivora-infected plants (GLM + multiple comparison test, p ≤ 0.05). Leaves from plants infected with P. ×cambivora A2 showed a significantly higher total organic acid content than leaves from P. plurivora-infected plants (GLM + multiple comparison test, p ≤ 0.05) 2 weeks after the inoculation. Three weeks p.i. the leaves of P. ×cambivora A1-infected plants had a significantly lower concentration of total amino acids compared to plants infected with P. ×cambivora A2 (GLM + multiple comparison test, p ≤ 0.001) or P. plurivora (GLM + multiple comparison test, p ≤ 0.001).
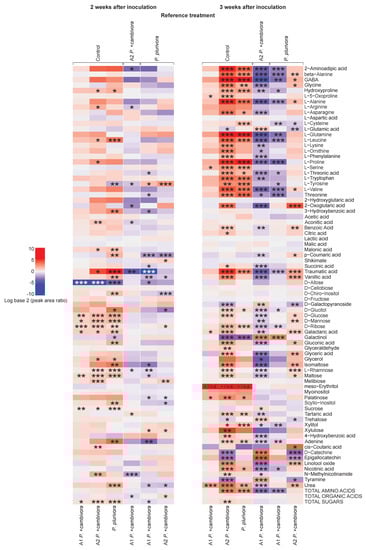
Figure 8.
Heat map of primary and secondary metabolites identified in the leaves of Fagus sylvatica seedlings inoculated with Phytophthora plurivora and the A1 and A2 mating types of Phytophthora ×cambivora. Different levels of concentration to control plants are depicted by different colors and their intensities (higher—red, lower—blue). Summary of general metabolite groups (amino acids, organic acids, sugars) are shown next to each heatmap columns. Statistical levels of significance: * = p ≤ 0.05, ** = p ≤ 0.01, *** = p ≤ 0.001.
The level of L-proline, a well-known stress marker, was significantly increased in leaves of P. ×cambivora A2-infected plants compared to control plants 2 and 3 weeks p.i. (GLM + multiple comparison test, p ≤ 0.05 and p ≤ 0.001, respectively). Furthermore, P. plurivora-infected plants showed significantly higher leaf levels of this compound compared to control plants three weeks p.i. (GLM + multiple comparison test; p ≤ 0.001). In contrast, in leaves of plants infected with P. ×cambivora A1, L-proline levels did not differ significantly from the control and were significantly lower compared to plants infected with P. ×cambivora A2 (GLM + multiple comparison test; p ≤ 0.001) and P. plurivora (GLM + multiple comparison test; p ≤ 0.001) three weeks after inoculation.
Traumatic acid, a secondary metabolite related to plant physical damage, was significantly increased in leaves of plants infected with P. ×cambivora A2 and P. plurivora compared to control leaves both two (GLM + multiple comparison test: P. ×cambivora A2, p ≤ 0.05; P. plurivora, p ≤ 0.001) and three weeks p.i. (GLM + multiple comparison test: P. ×cambivora A2, p ≤ 0.001; P. plurivora, p ≤ 0.001). At both time points the concentration of traumatic acid was significantly lower in the leaves of plants infected with P. ×cambivora A1 compared to P. ×cambivora A2 (GLM + multiple comparison test: 2 weeks p.i., p ≤ 0.01; 3 weeks p.i., p ≤ 0.001) and P. plurivora (GLM + multiple comparison test: 2 weeks p.i., p ≤ 0.001; 3 weeks p.i., p ≤ 0.001). Three weeks after inoculation, traumatic acid was significantly higher in leaves of plants infected with P. ×cambivora A2 than in leaves of plants infected with P. plurivora (GLM + multiple comparison test; p ≤ 0.001). Overall, the biggest metabolic changes observed in leaves two and three weeks p.i. corresponded to P. plurivora and P. ×cambivora A2, respectively, while P. ×cambivora A1 showed the least differences compared to the controls at both time points.
4. Discussion
The present study compared the effects of infections by P. plurivora and the A1 and A2 mating types of P. ×cambivora on F. sylvatica seedlings. To our knowledge, this is the first time that plants inoculated with Phytophthora pathogens were assessed simultaneously at physiological and metabolomic levels at different time points. Previous pathogenicity tests on one-year-old seedlings of F. sylvatica have shown within 3–5 months high aggressiveness of both pathogens, with P. ×cambivora causing on average 84–100% root rot and 20–90% mortality [15,17] and with P. plurivora (referred to as P. citricola) causing 88–90% root rot and 80–90% mortality [15,30,31]. Interestingly, in this pathogenicity trial despite causing similar mortality rates after 3 weeks, the two mating types of P. ×cambivora showed behavioral differences. Compared to the A2 type, the A1 type had a delayed sporangia production at the surfaces of the infected roots, which resulted in a later inoculum build-up, and was most likely responsible for the lower mortality rate one week after inoculation compared to the A2 mating type. The A1 mating type of P. ×cambivora also had weaker effects on the maximum efficiency of PSII after two weeks and on the metabolomic profile of leaves and to a lesser extent of roots three weeks after inoculation compared to the A2 mating type. In addition, the physiological responses (except stomatal conductance) and the metabolite concentration in roots of plants infected with P. ×cambivora A1 did not differ from control plants. In contrast, seedlings infected with P. ×cambivora A2 showed significant differences compared to the control in terms of PRI, maximum efficiency of PSII, stomatal conductance and metabolomics of roots, especially three weeks after inoculation, and metabolomics of leaves demonstrating subtle differences between the A1 and A2 mating types. Phytophthora plurivora was causing the fastest and highest mortality rates followed by P. ×cambivora A2 and P. ×cambivora A1. However, physiological reactions of P. plurivora-infected plants were not more pronounced than for P. ×cambivora A2. Similarly, differences in the metabolomic profiles of roots between plants infected with P. plurivora and plants infected with both mating types of P. ×cambivora were not noticeable. Only in leaves, the concentration of several metabolites in P. plurivora-infected plants differed statistically from P. ×cambivora A1 and A2. It is expected that if sampling for metabolomics would have been performed one week after the inoculation, the metabolomic profiles of P. plurivora-infected plants would have shown higher differences compared to plants infected by P. ×cambivora A1 and A2, especially in roots. However, two weeks after inoculation all infected plants had already developed the characteristic metabolomic adjustment mechanisms as a consequence of the Phytophthora attacks and no significant differences were observed between the more aggressive beech pathogen P. plurivora and P. ×cambivora.
There are different approaches to assess the physiological status of a plant, one of them being the calculation of spectral reflectance indices, which are complementary indicators of the status of the photosynthetic pigments (chlorophyll, xanthophyll and carotenoids) [56]. Lower values of the spectral reflectance indices of inoculated plants observed in our trial after two weeks are in agreement with other studies on different diseases such as Verticillium wilt on Capsicum annuum, Laurel wilt caused by Raffaelea lauricola on Persea americana or Cercospora disease on Beta vulgaris ssp. vulgaris, all showing a relationship between pathogen infections and a decrease of spectral indices [57,58,59]. In addition, [38] observed reduced reflectance indices of native Australian plants (i.e. Banksia serrata, Dianella revoluta, Eucalyptus piperita and Lomandra longifolia) infected with P. cinnamomi, but these differences only became significant 64 days after inoculation. In our study, the PRI index of P. ×cambivora A2-infected F. sylvatica seedlings and the NDVI, PRI, SIPI and CRI1 of P. plurivora-infected seedlings were already reduced two weeks after inoculation demonstrating that several spectral reflectance indices can be used for the early detection of root infections in certain pathosystems. However, infections by the A1 mating type of P. ×cambivora did not result in the decrease of any spectral reflectance indices. Whether other spectral indices, which consider different wavelength ranges, would show alterations in plants affected by P. ×cambivora A1, hence, enabling the detection of this pathogen, remains unknown and would require further research.
Together with changes in spectral indices, a decrease in maximum efficiency of PSII (Fv/Fm) was also among the first detectable physiological responses to Phytophthora infections in this trial. Low values of Fv/Fm are considered signs of stress and were detectable two weeks after inoculation with these pathogens, being especially obvious in P. plurivora-infected plants which displayed a sharp dropping of values. Similar responses were also reported in other studies of Phytophthora-infested plants [35,39,60]. Furthermore, alterations in Fv/Fm caused changes in photosynthetic pigment composition as demonstrated by the values of the applied spectral indices (related to chlorophyll and carotenoids), which showed the most severe decrease in P. plurivora-infected plants compared to the control group. A decrease in Fv/Fm can also imply disturbances in the photosystem II electron transport chain, with negative consequences for photosynthetic performance (i.e., photoinhibition) [39]. However, due to the lack of data related to net photosynthesis the occurrence of photoinhibition could not be proven in our trial. Noteworthy, other authors observed similar reductions in maximal efficiency of PSII in one-year-old Quercus ilex seedlings infected by P. cinnamomi but only 30- and 90-days post-inoculation [61]. Similarly, a trial on Persea americana rootstocks inoculated with P. cinnamomi also showed later differences in Fv/Fm relative to control in some infected rootstock varieties [36]. In contrast to these studies, maximal photochemical efficiency of PSII could be used as an early indicator of stress caused by the root infections in the present study. Moreover, the lower Fv/Fm in P. plurivora and in P. ×cambivora A2-infected plants were accompanied by a decrease in the stomatal conductance after two weeks or in case of P. ×cambivora A2 after three weeks. In addition, reduced stomatal conductance was observed for P. ×cambivora A1 two weeks after inoculation. This stomatal closure can be related to the increase in sugar concentration in the leaves of plants infected with these pathogens, as observed in P. cinnamomi-inoculated chestnut plants [62] and can also be associated with the root necroses. A high concentration of sugars in leaves, particularly glucose and sucrose, has negative impacts on photochemical quenching by the inhibition of the Calvin cycle [63], which indirectly influences stomatal regulations. Results from underbark inoculation trials of Alnus glutinosa with P. ×alni, indicated that stomatal closure was not a consequence of reduced water potentials and hydraulic conductance but resulted from photosynthesis inhibition due to leaf starch accumulation since the translocation of assimilates to the root through the pathogen-infected necrotic phloem tissue was severely reduced [64]. In the present study, the decrease of both the concentration and relative abundance of sucrose in the roots of infected plants supports this hypothesis, as sucrose is the main form of transported carbohydrate [65]. If the decrease in carbon assimilation is strong enough, it can lead to the absorption of more radiation than can be thermally dissipated, and the production of reactive oxygen species, damaging the PSII as a consequence [66]. Moreover, the observed root rot in the Phytophthora-infected plants might have decreased water uptake and transport contributing to the observed stomatal limitations, especially in the third week when the root destruction was already very advanced, and mortality was high. However, several authors point out the involvement of other mechanisms such as a hypersensitive response (HR) [39], hormone signals [67,68] and either a chemical signaling or a higher internal CO2 concentration in the stomatal regulation [69] associated with root necrosis. It is likely that there is not a single general model which explains all physiological adjustments and we might expect different regulation mechanisms depending on the specific Phytophthora-host pathosystem. Furthermore, different experimental conditions could cause a different range of possible responses [70].
Metabolomics revealed alterations in both primary and secondary metabolites of F. sylvatica seedlings caused by Phytophthora infections. The deterioration of fine roots due to pathogen attacks is often accompanied by damage of cell membranes and the subsequent leakage of cell contents into the rhizosphere [71], in accordance with the significant decrease in most identified metabolites in the present trial. Furthermore, the pathogen certainly contributes to the decrease of metabolites, particularly sugars, by consuming them. Interestingly, leaves and roots showed an opposite response, with the leaves having an overall increase and the roots showing a decrease in the concentration of most metabolites. During the first hours of an infection, pathogens are usually able to hijack the host’s metabolism, modulating the transport of carbon and nitrogen resources towards the infected areas [72,73]. However, as the infection progresses the plant deploys countermeasures, which include not only the synthesis of protective metabolites [74], but also restrictions in the transport of photoassimilates towards the pathogen [75]. Therefore, the interpretation of metabolomics data in infected plants is complex, as it is difficult to determine whether the observed changes are a consequence of the attacking pathogen or the defensive actions of the host plant [73]. The decrease in the root metabolite pool observed in F. sylvatica seedlings was most likely a consequence of the combined action of both the pathogen, feeding on the plant’s primary metabolites [76], and the host, limiting the transport of photoassimilates from the shoot in order to starve the pathogen as demonstrated here by the increase of sugar contents in the leaves. Therefore, in agreement with [77], the most affected metabolic pathways in the present study were related to amino acid and sugar metabolism, and to the TCA cycle.
Contrary to the overall decrease in metabolite concentration in roots of infected plants, two weeks after inoculation the concentration of several sugar alcohols, namely D-glucitol, glycerol and L-arabitol, was found to be either higher or, at least equal, to control plants and their relative abundance was higher. This may suggest that infected plants were favoring the synthesis or transport of these compounds, which can serve as osmoprotectans [78], over the other metabolites that were severely depressed as a reaction to the Phytophthora-caused root rot. However, certain sugar alcohols like L-arabitol have also been suggested to possess ROS-scavenging properties [79,80]. Therefore, it is possible that the relative increase in these compounds is not caused by the host, but by the pathogen attempting to fight the host’s defense mechanisms that rely on hypersensitive responses. This would be a role similar to that already established for mannitol, which is commonly associated with filamentous pathogen attack mechanisms [81].
Similarly, L-5-Oxoproline concentration increased in the roots of plants inoculated with P. ×cambivora A1 three weeks after inoculation. This could have been a reaction against the Phytophthora-root rot, since L-5-Oxoproline has been suggested to be a compatible solute with a role in osmoprotection [82]. Alternatively, this increase in L-5-Oxoproline, a product of glutathione degradation [83], could also indicate the increase in glutathione turnaround. Glutathione is a secondary metabolite with a demonstrated role as a response against Phytophthora infections [84]. In either case, the increase in L-5-Oxoproline seems to be indicative of a plant defense response. Interestingly, plants infected with P. ×cambivora A1 showed a higher survival rate than those infected with P. plurivora and, to a lesser extent, P. ×cambivora A2.
In accordance with the results obtained from the physiological measurements, the metabolome of plants infected with P. ×cambivora A1 was also less affected compared to plants infected with P. plurivora and P. ×cambivora A2. One of the most interesting leaf metabolites was traumatic acid which showed higher concentrations in the leaves of plants infected with P. ×cambivora A2 and P. plurivora but did not increase after inoculation with P. ×cambivora A1. As it is commonly associated with biotic and abiotic stresses, in particular those involving physical damages [85,86], higher traumatic acid levels might indicate higher aggressiveness of P. ×cambivora A2 and P. plurivora. Similarly, concentrations of L-proline, a universal stress-related compound [87], also increased in the leaves of plants infected with P. ×cambivora A2 and P. plurivora. indicating increased stress resulting from the root infections [62].
5. Conclusions
The homothallic pathogen P. plurivora was more aggressive to young F. sylvatica plants than the A1 and A2 mating types of P. ×cambivora causing faster mortality. However, in terms of physiological and metabolomic responses, P. plurivora-infected plants did not differ from P. ×cambivora A2-infected plants. Apparently, aggressive pathogens with fast colonization of host tissues such as P. plurivora would require physiological and metabolomic measurements at shorter time intervals to detect differences. The A1 and A2 mating types of P. ×cambivora caused similar mortality rates. However, P. ×cambivora A2 had significantly stronger effects on the metabolome than P. ×cambivora A1 which might indicate behavioral differences between both mating types resulting in subtle differences in the beech seedlings adjustments. Moreover, P. ×cambivora A1 showed delayed sporulation on the infected roots with sporangia produced mainly in the third week of the trial. More research is needed to determine differences in the aggressiveness of the A1 and A2 mating types of P. ×cambivora, including a larger range of strains and, therefore, of genotypic diversity.
Supplementary Materials
The following supporting information can be downloaded at: https://www.mdpi.com/article/10.3390/jof8030298/s1, Figure S1: Mean physiological values of Fagus sylvatica seedlings infected with the isolate TJ 71 of P. plurivora, the isolates TJ30 and TJ543 of A1 mating type of P. ×cambivora and the isolates TJ29 and TJ197 of A2 mating type of P. ×cambivora and of non-infected control seedlings: Mean values of spectral reflectance calculated with the Normalized Difference Vegetation Index (NDVI), the Photochemical Reflectance Index (PRI), Structure Intensive Pigment Index (SIPI) and the Carotenoid Reflectance Index (CRI1), mean values of chlorophyll fluorescence expressed as maximum quantum yield of photosystem II and stomatal conductance values (gs) of the seedlings two and three weeks after inoculation.; Table S1: Relative abundance (%) of total amino acids, total organic acids, total sugars, and selected metabolites in the leaves and roots of Fagus sylvatica plants infected with P. plurivora and the A1 and A2 mating types of P. ×cambivora and of non-infected control seedlings 2 and 3 weeks after inoculation.
Author Contributions
Conceptualization: T.C., I.M. and T.J.; data curation: T.C., I.M., I.S.-F. and T.K.; formal analysis: T.C., I.S.-F., T.K. and R.R.; funding acquisition: I.M., T.C., T.J. and J.Ď.; investigation: T.C., I.M., I.S.-F., T.K., R.P., T.M., A.B., H.Ď., L.B.D., M.T., D.M., V.R., M.K. and J.Ď.; methodology: T.C., I.M., T.J., I.S.-F., T.K. and J.Ď.; writing—original draft: T.C., T.J., I.S.-F., I.M. and T.K. All authors have read and agreed to the published version of the manuscript.
Funding
This work was funded by the Internal Grant Agency (IGA) of Mendel University in Brno (IGA number LDF_TP_2019013, name of the project: Histopathological and physiological characteristics of tree species infected with the pathogen of the genus Phytophthora) and by the project Phytophthora Research Centre Reg. No. CZ.02.1.01/0.0/0.0/15_003/0000453, co-financed by the European Regional Development Fund. This work was also supported by funding from the Slovak scientific grant agency VEGA (1/0450/19).
Institutional Review Board Statement
Not applicable.
Informed Consent Statement
Not applicable.
Data Availability Statement
The data presented in this study are available on request from the corresponding author.
Acknowledgments
We thank Jindřiška Hrubá and Iveta Hrubá for much appreciated administrative support.
Conflicts of Interest
These authors declare no conflict of interest.
References
- Jung, T.; Pérez-Sierra, A.; Durán, A.; Jung, M.H.; Balci, Y.; Scanu, B. Canker and decline diseases caused by soil- and airborne Phytophthora species in forests and woodlands. Persoonia 2018, 40, 182–220. [Google Scholar] [CrossRef] [PubMed] [Green Version]
- Jung, T.; Blaschke, H.; Neumann, P. Isolation, identification and pathogenicity of Phytophthora species from declining oak stands. Eur. J. For. Pathol. 1996, 26, 253–272. [Google Scholar] [CrossRef]
- Jung, T. Phytophthora quercina sp. nov., causing root rot of European oaks. Mycol. Res. 1999, 103, 785–798. [Google Scholar] [CrossRef]
- Jung, T.; Blaschke, H.; Oßwald, W. Involvement of soilborne Phytophthora Species in Central European oak decline and the effect of site factors on the disease. Plant Pathol. 2000, 49, 706–718. [Google Scholar] [CrossRef]
- Vettraino, A.M.; Barzanti, G.P.; Bianco, M.C.; Ragazzi, A.; Capretti, P.; Paoletti, E.; Luisi, N.; Anselmi, N.; Vannini, A. Occurrence of Phytophthora species in oak stands in Italy and their association with declining oak trees. For. Pathol. 2002, 32, 19–28. [Google Scholar] [CrossRef]
- Jung, T. Beech decline in Central Europe driven by the interaction between Phytophthora infections and climatic extremes. For. Pathol. 2009, 39, 73–94. [Google Scholar] [CrossRef]
- Weiland, J.E.; Nelson, A.H.; Hudler, G.W. Aggressiveness of Phytophthora cactorum, P. citricola I, and P. plurivora from European beech. Plant Dis. 2010, 94, 1009–1014. [Google Scholar] [CrossRef] [Green Version]
- Jung, T.; Vettraino, A.M.; Cech, T.L.; Vannini, A. The Impact of invasive Phytophthora species on European forests. In Phytophthora: A Global Perspective; Lamour, K., Ed.; CABI: Wallingford, UK, 2013; pp. 146–158. [Google Scholar]
- Corcobado, T.; Cech, T.L.; Brandstetter, M.; Daxer, A.; Hüttler, C.; Kudláček, T.; Jung, M.H.; Jung, T. Decline of European Beech in Austria: Involvement of Phytophthora spp. and contributing biotic and abiotic factors. Forests 2020, 11, 895. [Google Scholar] [CrossRef]
- Gibbs, J.; Lipscombe, M.; Peace, A. The impact of Phytophthora disease on riparian populations of Common alder (Alnus glutinosa) in Southern Britain. Eur. J. For. Pathol. 1999, 29, 39–50. [Google Scholar] [CrossRef]
- Streito, J.C.; Legrand, P.; Tabary, F.; Jarnouen De Villartay, G. Phytophthora disease of alder (Alnus glutinosa) in France: Investigations between 1995 and 1999. For. Pathol. 2002, 32, 179–191. [Google Scholar] [CrossRef]
- Brasier, C.M.; Kirk, S.A.; Delcan, J.; Cooke, D.E.L.; Jung, T.; Man In’t Veld, W.A. Phytophthora alni sp. nov. and its variants: Designation of emerging heteroploid hybrid pathogens spreading on Alnus trees. Mycol. Res. 2004, 108, 1172–1184. [Google Scholar] [CrossRef]
- Jung, T.; Blaschke, M. Phytophthora root and collar rot of alders in Bavaria: Distribution, modes of spread and possible management strategies. Plant Pathol. 2004, 53, 197–208. [Google Scholar] [CrossRef]
- Jung, T.; Orlikowski, L.; Henricot, B.; Abad-Campos, P.; Aday, A.G.; Aguín Casal, O.; Bakonyi, J.; Cacciola, S.O.; Cech, T.; Chavarriaga, D.; et al. Widespread Phytophthora infestations in European nurseries put forest, semi-natural and horticultural ecosystems at high risk of Phytophthora diseases. For. Pathol. 2016, 46, 134–163. [Google Scholar] [CrossRef] [Green Version]
- Jung, T.; Nechwatal, J.; Cooke, D.E.L.; Hartmann, G.; Blaschke, M.; Oßwald, W.F.; Duncan, J.M.; Delatour, C. Phytophthora pseudosyringae sp. nov., a new species causing root and collar rot of deciduous tree species in Europe. Mycol. Res. 2003, 107, 772–789. [Google Scholar] [CrossRef]
- Jung, T.; Hudler, G.W.; Jensen-Tracy, S.L.; Griffiths, H.M.; Fleischmann, F.; Osswald, W. Involvement of Phytophthora species in the decline of European beech in Europe and the USA. Mycologist 2005, 19, 159–166. [Google Scholar] [CrossRef]
- Jung, T.; Jung, M.H.; Scanu, B.; Seress, D.; Kovács, G.M.; Maia, C.; Pérez-Sierra, A.; Chang, T.T.; Chandelier, A.; Heungens, K.; et al. Six new Phytophthora species from ITS Clade 7a including two sexually functional heterothallic hybrid species detected in natural ecosystems in Taiwan. Persoonia 2017, 38, 100–135. [Google Scholar] [CrossRef] [Green Version]
- Jung, T.; La Spada, F.; Pane, A.; Aloi, F.; Evoli, M.; Jung, M.H.; Scanu, B.; Faedda, R.; Rizza, C.; Puglisi, I.; et al. Diversity and distribution of Phytophthora Species in protected natural areas in Sicily. Forests 2019, 10, 259. [Google Scholar] [CrossRef] [Green Version]
- Schmitz, S.; Zini, J.; Chandelier, A. Involvement of Phytophthora species in the decline of beech (Fagus sylvatica) in the southern part of Belgium. In Phytophthoras in Forests and Natural Ecosystems: Fourth Meeting of the International Union of Forest Research Organizations (IUFRO) Working Party S07.02.09; Goheen, E., Frankel, S., Eds.; USDA Forest Service, Pacific Southwest Research Station: Albany, CA, USA, 2009; p. 320. [Google Scholar]
- Nechwatal, J.; Hahn, J.; Schönborn, A.; Schmitz, G. A twig blight of understorey European beech (Fagus sylvatica) caused by soilborne Phytophthora spp. For. Pathol. 2011, 41, 493–500. [Google Scholar] [CrossRef]
- Telfer, K.H.; Brurberg, M.B.; Herrero, M.L.; Stensvand, A.; Talgø, V. Phytophthora cambivora found on beech in Norway. For. Pathol. 2015, 45, 415–425. [Google Scholar] [CrossRef]
- Vettraino, A.M.; Morel, O.; Perlerou, C.; Robin, C.; Diamandis, S.; Vannini, A. Occurrence and distribution of Phytophthora Species in European chestnut stands, and their association with Ink disease and crown decline. Eur. J. Plant Pathol. 2005, 111, 169–180. [Google Scholar] [CrossRef]
- Saavedra, A.; Hansen, E.M.; Goheen, D.J. Phytophthora cambivora in Oregon and its pathogenicity to Chrysolepis Chrysophylla. For. Pathol. 2007, 37, 409–419. [Google Scholar] [CrossRef]
- Reeser, P.; Sutton, W.; Hansen, E. Phytophthora species associated with stem cankers on tanoak in Southwestern Oregon. In Proceedings of the Sudden Oak Death Third Science Symposium; Frankel, S.J., Kliejunas, J.T., Palmieri, K.M., Eds.; Gen. Tech. Rep. PSW-GTR-214; US Department of Agriculture, Forest Service, Pacific Southwest Research Station: Albany, CA, USA, 2008; pp. 227–229. [Google Scholar]
- Greslebin, A.G.; Hansen, E.M.; Winton, L.M.; Rajchenberg, M. Phytophthora species from declining Austrocedrus chilensis forests in Patagonia, Argentina. Mycologia 2005, 97, 218–228. [Google Scholar] [CrossRef] [PubMed]
- Jung, T.; Durán, A.; Sanfuentes von Stowasser, E.; Schena, L.; Mosca, S.; Fajardo, S.; González, M.; Navarro Ortega, A.D.; Bakonyi, J.; Seress, D.; et al. Diversity of Phytophthora species in Valdivian rainforests and association with severe dieback symptoms. For. Pathol. 2018, 48, e12443. [Google Scholar] [CrossRef]
- Suzui, T.; Hoshino, Y. Collar rot of apple caused by Phytophthora cambivora (Petri) Buism. Jpn. J. Phytopathol. 1979, 45, 344–352. [Google Scholar] [CrossRef] [Green Version]
- Jung, T.; Jung, M.H.; Cacciola, S.O.; Cech, T.; Bakonyi, J.; Seress, D.; Mosca, S.; Schena, L.; Seddaiu, S.; Pane, A.; et al. Multiple new cryptic pathogenic Phytophthora species from Fagaceae forests in Austria, Italy and Portugal. IMA Fungus 2017, 8, 219–244. [Google Scholar] [CrossRef] [Green Version]
- Jung, T.; Burgess, T.I. Re-evaluation of Phytophthora citricola isolates from multiple woody hosts in Europe and North America reveals a new species, Phytophthora plurivora sp. nov. Persoonia 2009, 22, 95–110. [Google Scholar] [CrossRef] [Green Version]
- Fleischmann, F.; Schneider, D.; Matyssek, R.; Oßwald, W.F. Investigations on net CO2 assimilation, transpiration and root growth of Fagus sylvatica infested with four different Phytophthora species. Plant Biol. 2002, 4, 144–152. [Google Scholar] [CrossRef]
- Fleischmann, F.; Göttlein, A.; Rodenkirchen, H.; Lütz, C.; Oßwald, W. Biomass, nutrient and pigment content of beech (Fagus sylvatica) saplings infected with Phytophthora citricola, P. cambivora, P. pseudosyringae and P. undulata. For. Pathol. 2004, 34, 79–92. [Google Scholar] [CrossRef]
- Jung, T.; Chang, T.T.; Bakonyi, J.; Seress, D.; Pérez-Sierra, A.; Yang, X.; Hong, C.; Scanu, B.; Fu, C.H.; Hsueh, K.L.; et al. Diversity of Phytophthora species in natural ecosystems of Taiwan and association with disease symptoms. Plant Pathol. 2017, 66, 194–211. [Google Scholar] [CrossRef]
- Jung, T.; Scanu, B.; Brasier, C.M.; Webber, J.; Milenković, I.; Corcobado, T.; Tomšovský, M.; Pánek, M.; Bakonyi, J.; Maia, C.; et al. A survey in natural forest ecosystems of Vietnam reveals high diversity of both new and described Phytophthora taxa including P. ramorum. Forests 2020, 11, 93. [Google Scholar] [CrossRef] [Green Version]
- Vélez, M.L.; Silva, P.V.; Troncoso, O.A.; Greslebin, A.G. Alteration of physiological parameters of Austrocedrus chilensis by the pathogen Phytophthora austrocedrae. Plant Pathol. 2012, 61, 877–888. [Google Scholar] [CrossRef]
- Angay, O.; Fleischmann, F.; Recht, S.; Herrmann, S.; Matyssek, R.; Oßwald, W.; Buscot, F.; Grams, T.E.E. Sweets for the foe—effects of nonstructural carbohydrates on the susceptibility of Quercus robur against Phytophthora quercina. New Phytol. 2014, 203, 1282–1290. [Google Scholar] [CrossRef] [PubMed]
- Reeksting, B.J.; Taylor, N.J.; van den Berg, N. Flooding and Phytophthora cinnamomi: Effects on photosynthesis and chlorophyll fluorescence in shoots of non-grafted Persea americana (Mill.) rootstocks differing in tolerance to Phytophthora root rot. S. Afr. J. Bot. 2014, 95, 40–53. [Google Scholar] [CrossRef] [Green Version]
- Gold, K.M.; Townsend, P.A.; Larson, E.R.; Herrmann, I.; Gevens, A.J. Contact reflectance spectroscopy for rapid, accurate, and nondestructive Phytophthora infestans clonal lineage discrimination. Phytopathology 2020, 110, 851–862. [Google Scholar] [CrossRef] [PubMed] [Green Version]
- Newby, Z.; Murphy, R.J.; Guest, D.I.; Ramp, D.; Liew, E.C.Y. Detecting symptoms of Phytophthora cinnamomi infection in Australian native vegetation using reflectance spectrometry: Complex effects of water stress and species susceptibility. Australas. Plant Pathol. 2019, 48, 409–424. [Google Scholar] [CrossRef]
- Manter, D.K.; Kelsey, R.G.; Karchesy, J.J. Photosynthetic declines in Phytophthora ramorum-infected plants develop prior to water stress and in response to exogenous application of elicitins. Phytopathology 2007, 97, 850–856. [Google Scholar] [CrossRef] [PubMed]
- Abu-Nada, Y.; Kushalappa, A.C.; Marshall, W.D.; Al-Mughrabi, K.; Murphy, A. Temporal dynamics of pathogenesis-related metabolites and their plausible pathways of induction in potato leaves following inoculation with Phytophthora infestans. Eur. J. Plant Pathol. 2007, 118, 375–391. [Google Scholar] [CrossRef]
- Zhu, L.; Zhou, Y.; Li, X.; Zhao, J.; Guo, N.; Xing, H. Metabolomics analysis of soybean hypocotyls in response to Phytophthora sojae infection. Front. Plant Sci. 2018, 9, 1530. [Google Scholar] [CrossRef] [Green Version]
- Rouse, J.W.; Hass, R.H.; Schell, J.A.; Deering, D.W. Monitoring vegetation systems in the Great Plains with ERTS. Third ERTS Symp. 1974, 1, 309–317. [Google Scholar]
- Peñuelas, J.; Filella, I.; Gamon, J.A. Assessment of photosynthetic radiation-use efficiency with spectral reflectance. New Phytol. 1995, 131, 291–296. [Google Scholar] [CrossRef]
- Gitelson, A.A.; Zur, Y.; Chivkunova, O.B.; Merzlyak, M.N. Assessing carotenoid content in plant leaves with reflectance spectroscopy. Photochem. Photobiol. 2002, 75, 272–281. [Google Scholar] [CrossRef]
- Berka, M.; Luklová, M.; Dufková, H.; Berková, V.; Novák, J.; Saiz-Fernández, I.; Rashotte, A.M.; Brzobohatý, B.; Černý, M. Barley root proteome and metabolome in response to cytokinin and abiotic stimuli. Front. Plant Sci. 2020, 11, 1647. [Google Scholar] [CrossRef] [PubMed]
- Therneau, T. A Package for Survival Analysis in S. R Package Version. 2015, Volume 2. Available online: https://sites.google.com/site/statsr4us/docs/SurvivalanalysisinR_package.pdf (accessed on 16 February 2022).
- Kassambara, A.; Kosinski, M. Survminer: Drawing Survival Curves Using ‘Ggplot2’. R Package Version 0.3. 2017. Available online: https://rpkgs.datanovia.com/survminer/ (accessed on 16 February 2022).
- R Core Team. R: A Language and Environment for Statistical Computing; R Foundation for Statistical Computing: Vienna, Austria, 2019. [Google Scholar]
- Hothorn, T.; Bretz, F.; Westfall, P. Simultaneous inference in general parametric models. Biom. J. 2008, 50, 346–363. [Google Scholar] [CrossRef] [PubMed] [Green Version]
- Zeileis, A. Econometric computing with HC and HAC covariance matrix estimators. J. Stat. Softw. 2004, 11, 1–17. [Google Scholar] [CrossRef]
- Zeileis, A. Object-oriented computation of sandwich estimators. J. Stat. Softw. 2006, 16, 1–16. [Google Scholar] [CrossRef] [Green Version]
- Herberich, E.; Sikorski, J.; Hothorn, T. A robust procedure for comparing multiple means under heteroscedasticity in unbalanced designs. PLoS ONE 2010, 5, e9788. [Google Scholar] [CrossRef] [Green Version]
- Gu, Z.; Eils, R.; Schlesner, M. Complex heatmaps reveal patterns and correlations in multidimensional genomic data. Bioinformatics 2016, 32, 2847–2849. [Google Scholar] [CrossRef] [PubMed] [Green Version]
- Wickham, H. Ggplot2: Elegant Graphics for Data Analysis; Springer: Berlin/Heidelberg, Germany, 2016. [Google Scholar]
- Inkscape Project. Inkscape. 2020. Available online: https://inkscape.org/news/2020/ (accessed on 16 February 2022).
- Zarco-Tejada, P.J.; González-Dugo, M.V.; Fereres, E. Seasonal stability of chlorophyll fluorescence quantified from airborne hyperspectral imagery as an indicator of net photosynthesis in the context of precision agriculture. Remote Sens. Environ. 2016, 179, 89–103. [Google Scholar] [CrossRef]
- Sanogo, S.; El-Sebai, O.I.; Sanderson, R. Severity of Verticillium wilt, plant growth, and spectral reflectance indices of Chile pepper under periodic flooding and no-flooding conditions. HortScience 2008, 43, 414–419. [Google Scholar] [CrossRef] [Green Version]
- Sankaran, S.; Ehsani, R.; Inch, S.A.; Ploetz, R.C. Evaluation of visible-near infrared reflectance spectra of avocado leaves as a non-destructive sensing tool for detection of laurel wilt. Plant Dis. 2012, 96, 1683–1689. [Google Scholar] [CrossRef] [PubMed]
- Jansen, M.; Bergsträsser, S.; Schmittgen, S.; Müller-Linow, M.; Rascher, U. Non-invasive spectral phenotyping methods can improve and accelerate Cercospora disease scoring in sugar beet breeding. Agriculture 2014, 4, 147–158. [Google Scholar] [CrossRef] [Green Version]
- Dalio, R.J.D.; Fleischmann, F.; Chambery, A.; Eichmann, R.; Massola, N.S.; Pascholati, S.F.; Osswald, W. Immunodepletion of α-Plurivorin effector leads to loss of virulence of Phytophthora plurivora towards Fagus sylvatica. For. Pathol. 2017, 47, e12362. [Google Scholar] [CrossRef]
- Sghaier-Hammami, B.; Valero-Galvàn, J.; Romero-Rodríguez, M.C.; Navarro-Cerrillo, R.M.; Abdelly, C.; Jorrín-Novo, J. Physiological and proteomics analyses of Holm Oak (Quercus ilex subsp. ballota [Desf.] Samp.) responses to Phytophthora cinnamomi. Plant Physiol. Biochem. 2013, 71, 191–202. [Google Scholar] [CrossRef] [PubMed]
- Saiz-Fernández, I.; Milenković, I.; Berka, M.; Černý, M.; Tomšovský, M.; Brzobohatý, B.; Kerchev, P. Integrated proteomic and metabolomic profiling of Phytophthora cinnamomi attack on Sweet chestnut (Castanea sativa) reveals distinct molecular reprogramming proximal to the infection site and away from it. Int. J. Mol. Sci. 2020, 21, 8525. [Google Scholar] [CrossRef]
- Saiz-Fernández, I.; De Diego, N.; Brzobohatý, B.; Muñoz-Rueda, A.; Lacuesta, M. The imbalance between C and N metabolism during high nitrate supply inhibits photosynthesis and overall growth in maize (Zea mays L.). Plant Physiol. Biochem. 2017, 120, 213–222. [Google Scholar] [CrossRef] [PubMed]
- Clemenz, C.; Fleischmann, F.; Häberle, K.H.; Matyssek, R.; Oßwald, W. Photosynthetic and leaf water potential responses of Alnus glutinosa saplings to stem-base inoculaton with Phytophthora alni subsp. alni. Tree Physiol. 2008, 28, 1703–1711. [Google Scholar] [CrossRef] [Green Version]
- Tauzin, A.S.; Giardina, T. Sucrose and invertases, a part of the plant defense response to the biotic stresses. Front. Plant Sci. 2014, 5, 293. [Google Scholar] [CrossRef]
- Sperdouli, I.; Moustakas, M. Differential response of photosystem II photochemistry in young and mature leaves of Arabidopsis thaliana to the onset of drought stress. Acta Physiol. Plant. 2012, 34, 1267–1276. [Google Scholar] [CrossRef]
- Maurel, M.; Robin, C.; Simonneau, T.; Loustau, D.; Dreyer, E.; Desprez-Loustau, M.L. Stomatal conductance and root-to-shoot signalling in chestnut saplings exposed to Phytophthora cinnamomi or partial soil drying. Funct. Plant Biol. 2004, 31, 41–51. [Google Scholar] [CrossRef]
- Oßwald, W.; Fleischmann, F.; Rigling, D.; Coelho, A.C.; Cravador, A.; Diez, J.; Dalio, R.J.; Horta Jung, M.; Pfanz, H.; Robin, C.; et al. Strategies of attack and defence in woody plant-Phytophthora interactions. For. Pathol. 2014, 44, 169–190. [Google Scholar] [CrossRef]
- Ruiz Gómez, F.J.; Navarro-Cerrillo, R.M.; Sánchez-Cuesta, R.; Pérez-de-Luque, A. Histopathology of infection and colonization of Quercus ilex fine roots by Phytophthora cinnamomi. Plant Pathol. 2015, 64, 605–616. [Google Scholar] [CrossRef]
- Ruiz-Gómez, F.J.; Pérez-de-Luque, A.; Navarro-Cerrillo, R.M. The involvement of Phytophthora root rot and drought stress in holm oak decline: From ecophysiology to microbiome influence. Curr. For. Rep. 2019, 5, 251–266. [Google Scholar] [CrossRef]
- Vandana, V.V.; Suseela Bhai, R.; Ramakrishnan Nair, R.; Azeez, S. Role of cell wall and cell membrane integrity in imparting defense response against Phytophthora capsici in black pepper (Piper nigrum L.). Eur. J. Plant Pathol. 2019, 154, 359–375. [Google Scholar] [CrossRef]
- Parker, D.; Beckmann, M.; Zubair, H.; Enot, D.P.; Caracuel-Rios, Z.; Overy, D.P.; Snowdon, S.; Talbot, N.J.; Draper, J. Metabolomic analysis reveals a common pattern of metabolic re-programming during invasion of three host plant species by Magnaporthe grisea. Plant J. 2009, 59, 723–737. [Google Scholar] [CrossRef] [PubMed]
- Draper, J.; Rasmussen, S.; Zubair, H. Metabolite analysis and metabolomics in the study of biotrophic interactions between plants and microbes. Annu. Plant Rev. 2018, 43, 25–59. [Google Scholar] [CrossRef]
- Ahanger, M.A.; Bhat, J.A.; Siddiqui, M.H.; Rinklebe, J.; Ahmad, P. Integration of silicon and secondary metabolites in plants: A significant association in stress tolerance. J. Exp. Bot. 2020, 71, 6758–6774. [Google Scholar] [CrossRef]
- Tenenboim, H.; Brotman, Y. Omic relief for the biotically stressed: Metabolomics of plant biotic interactions. Trends Plant Sci. 2016, 21, 781–791. [Google Scholar] [CrossRef]
- Judelson, H.S.; Tani, S.; Narayan, R.D. Metabolic adaptation of Phytophthora infestans during growth on leaves, tubers and artificial media. Mol. Plant Pathol. 2009, 10, 843–855. [Google Scholar] [CrossRef]
- Rodenburg, S.Y.; Seidl, M.F.; Judelson, H.S.; Vu, A.L.; Govers, F.; de Ridder, D. Metabolic model of the Phytophthora infestans-tomato interaction reveals metabolic switches during host colonization. MBio 2019, 10, e00454-19. [Google Scholar] [CrossRef] [Green Version]
- Dumschott, K.; Richter, A.; Loescher, W.; Merchant, A. Post photosynthetic carbon partitioning to sugar alcohols and consequences for plant growth. Phytochemistry 2017, 144, 243–252. [Google Scholar] [CrossRef]
- Lee, D.K.; Ahn, S.; Cho, H.Y.; Yun, H.Y.; Park, J.H.; Lim, J.; Lee, J.; Kwon, S.W. Metabolic response induced by parasitic plant-fungus interactions hinder amino sugar and nucleotide sugar metabolism in the host. Sci. Rep. 2016, 6, 37434. [Google Scholar] [CrossRef] [PubMed] [Green Version]
- Williamson, J.D.; Jennings, D.B.; Guo, W.W.; Pharr, D.M.; Ehrenshaft, M. Sugar alcohols, salt stress, and fungal resistance: Polyols—multifunctional plant protection? J. Am. Soc. Hortic. Sci. 2002, 127, 467–473. [Google Scholar] [CrossRef] [Green Version]
- Calmes, B.; Guillemette, T.; Teyssier, L.; Siegler, B.; Pigné, S.; Landreau, A.; Iacomi, B.; Lemoine, R.; Richomme, P.; Simoneau, P. role of mannitol metabolism in the pathogenicity of the necrotrophic fungus Alternaria brassicicola. Front. Plant Sci. 2013, 4, 131. [Google Scholar] [CrossRef] [Green Version]
- Eshel, G.; Shaked, R.; Kazachkova, Y.; Khan, A.; Eppel, A.; Cisneros, A.; Acuna, T.; Gutterman, Y.; Tel-Zur, N.; Rachmilevitch, S.; et al. Anastatica hierochuntica, an Arabidopsis desert relative, is tolerant to multiple abiotic stresses and exhibits species-specific and common stress tolerance strategies with its halophytic relative, Eutrema (Thellungiella) salsugineum. Front. Plant Sci. 2017, 7, 1992. [Google Scholar] [CrossRef] [PubMed] [Green Version]
- Ohkama-Ohtsu, N.; Oikawa, A.; Zhao, P.; Xiang, C.; Saito, K.; Oliver, D.J. A γ-glutamyl transpeptidase-independent pathway of glutathione catabolism to glutamate via 5-oxoproline in Arabidopsis. Plant Physiol. 2008, 148, 1603–1613. [Google Scholar] [CrossRef] [Green Version]
- Gullner, G.; Komives, T.; Király, L.; Schröder, P. Glutathione S-transferase enzymes in plant-pathogen interactions. Front. Plant Sci. 2018, 9, 1836. [Google Scholar] [CrossRef] [Green Version]
- Vasyukova, N.I.; Chalenko, G.I.; Gerasimova, N.G.; Ozeretskovskaya, O.L. Wound repair in plant tissues (review). Appl. Biochem. Microbiol. 2011, 47, 229–233. [Google Scholar] [CrossRef]
- Pietryczuk, A.; Czerpak, R. Effect of traumatic acid on antioxidant activity in Chlorella vulgaris (Chlorophyceae). Plant Growth Regul. 2011, 65, 279–286. [Google Scholar] [CrossRef] [Green Version]
- Szabados, L.; Savouré, A. Proline: A multifunctional amino acid. Trends Plant Sci. 2010, 15, 89–97. [Google Scholar] [CrossRef]
Publisher’s Note: MDPI stays neutral with regard to jurisdictional claims in published maps and institutional affiliations. |
© 2022 by the authors. Licensee MDPI, Basel, Switzerland. This article is an open access article distributed under the terms and conditions of the Creative Commons Attribution (CC BY) license (https://creativecommons.org/licenses/by/4.0/).