
A Barcode-Based Phylogenetic Characterization of Phytophthora cactorum Identifies Two Cosmopolitan Lineages with Distinct Host Affinities and the First Report of Phytophthora pseudotsugae in California


Abstract
:1. Introduction
2. Materials and Methods
2.1. Sources of California Isolates
2.2. DNA Extraction, Amplification & Sequencing
2.3. Data Assembly & Phylogenetic Inference
3. Results
3.1. Multi-Locus Genotypes
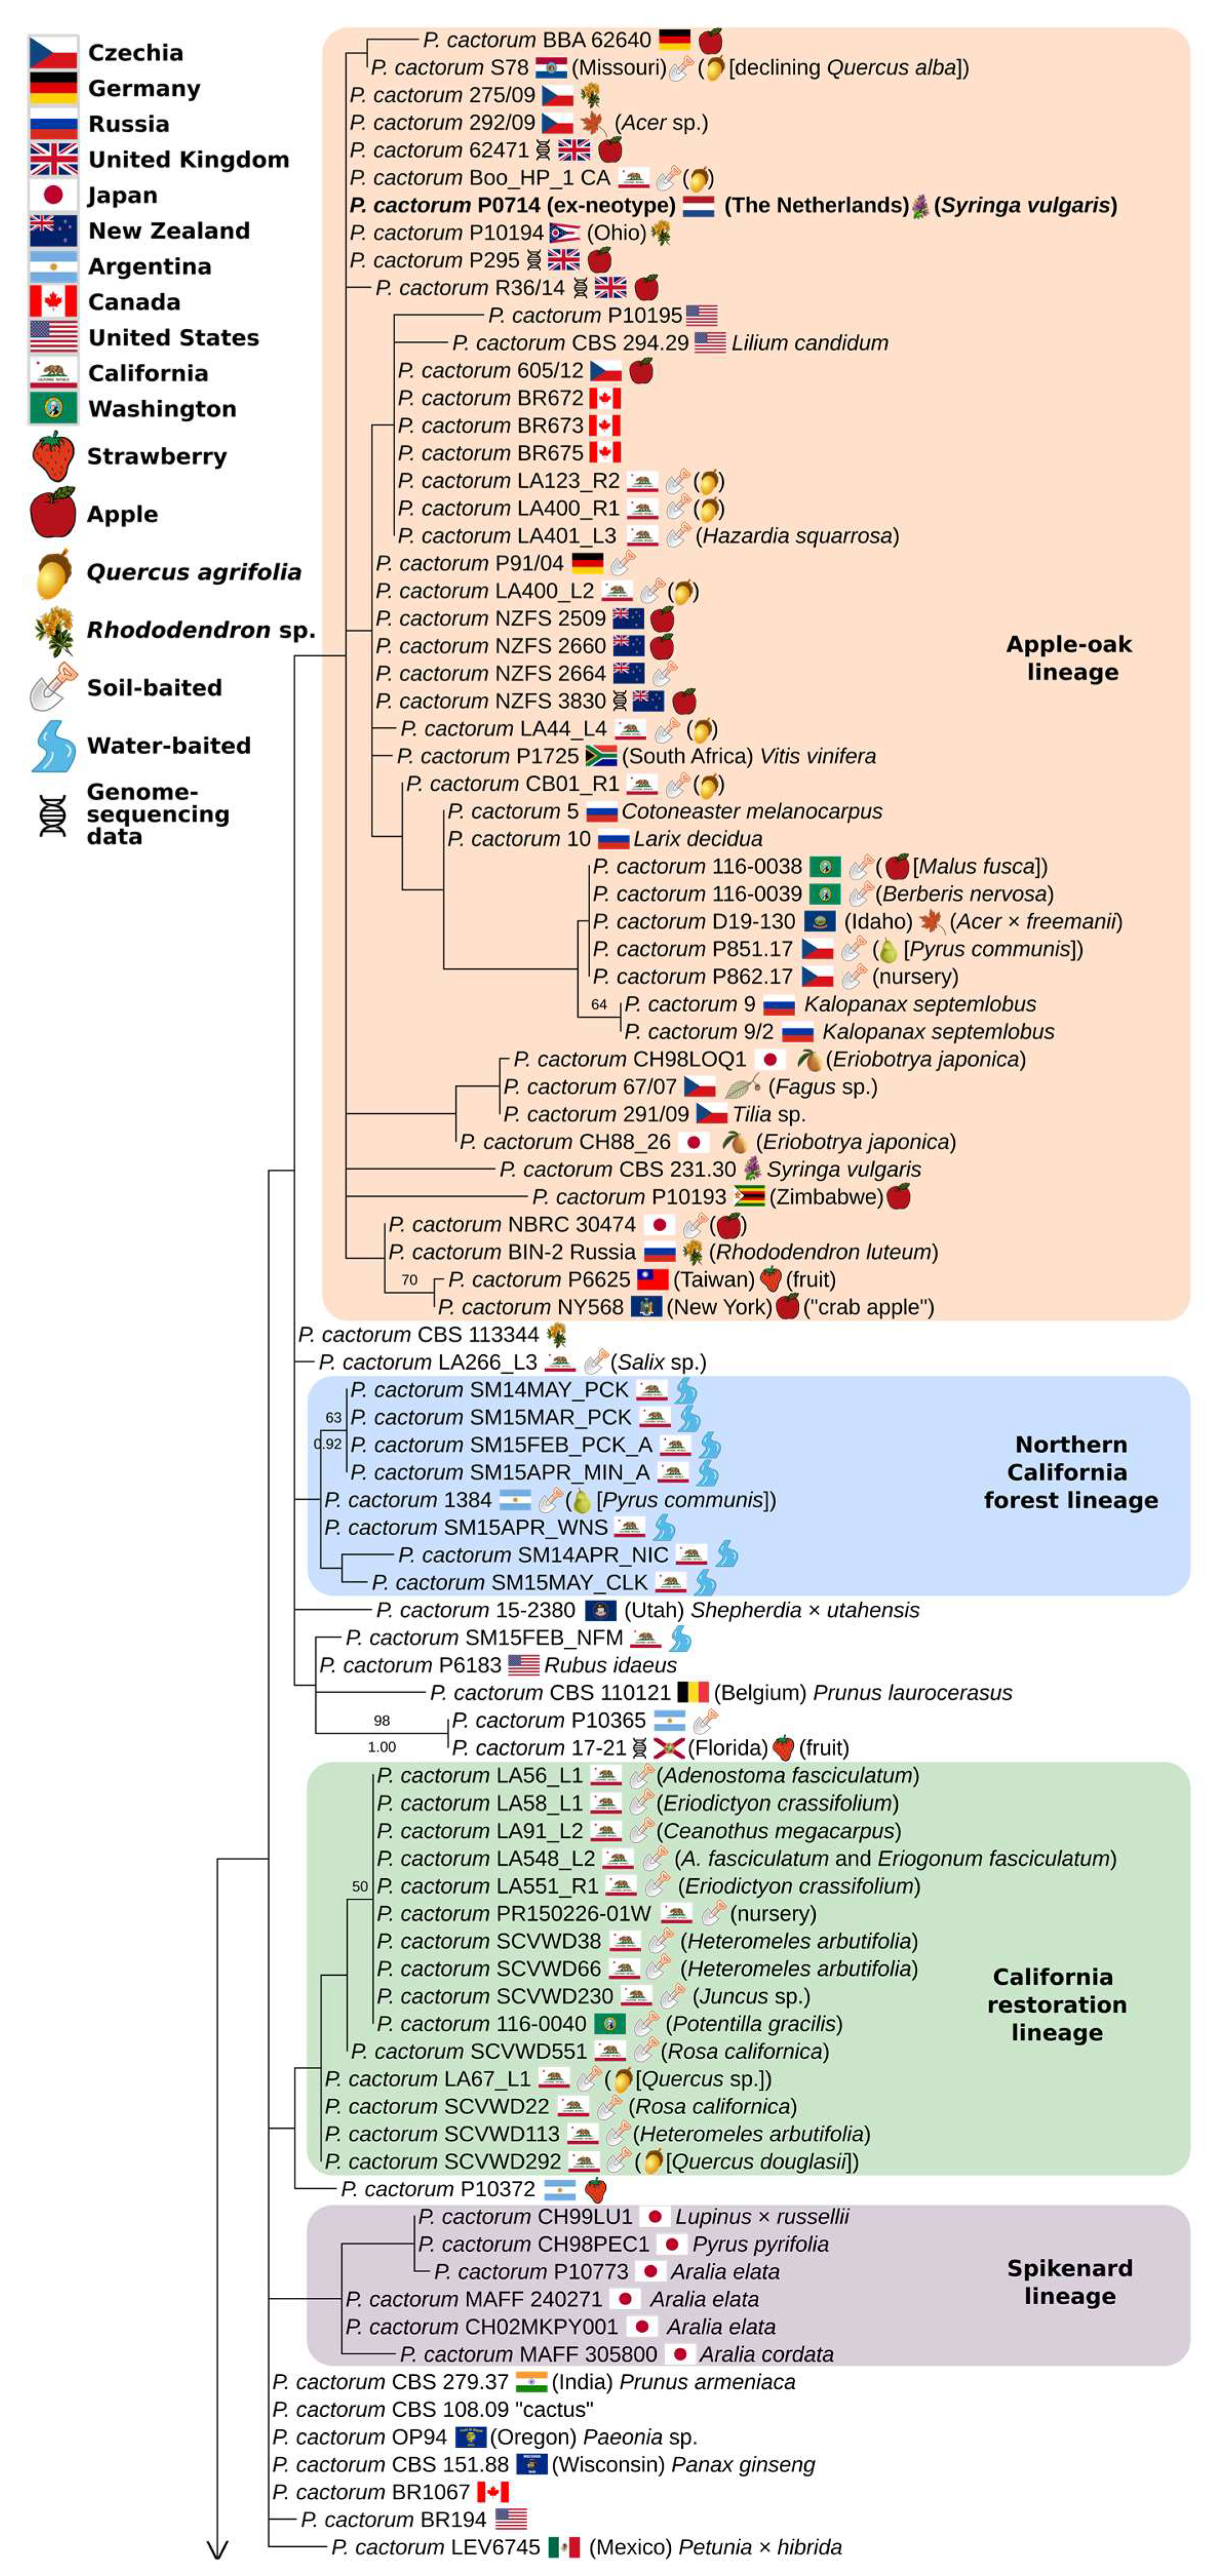
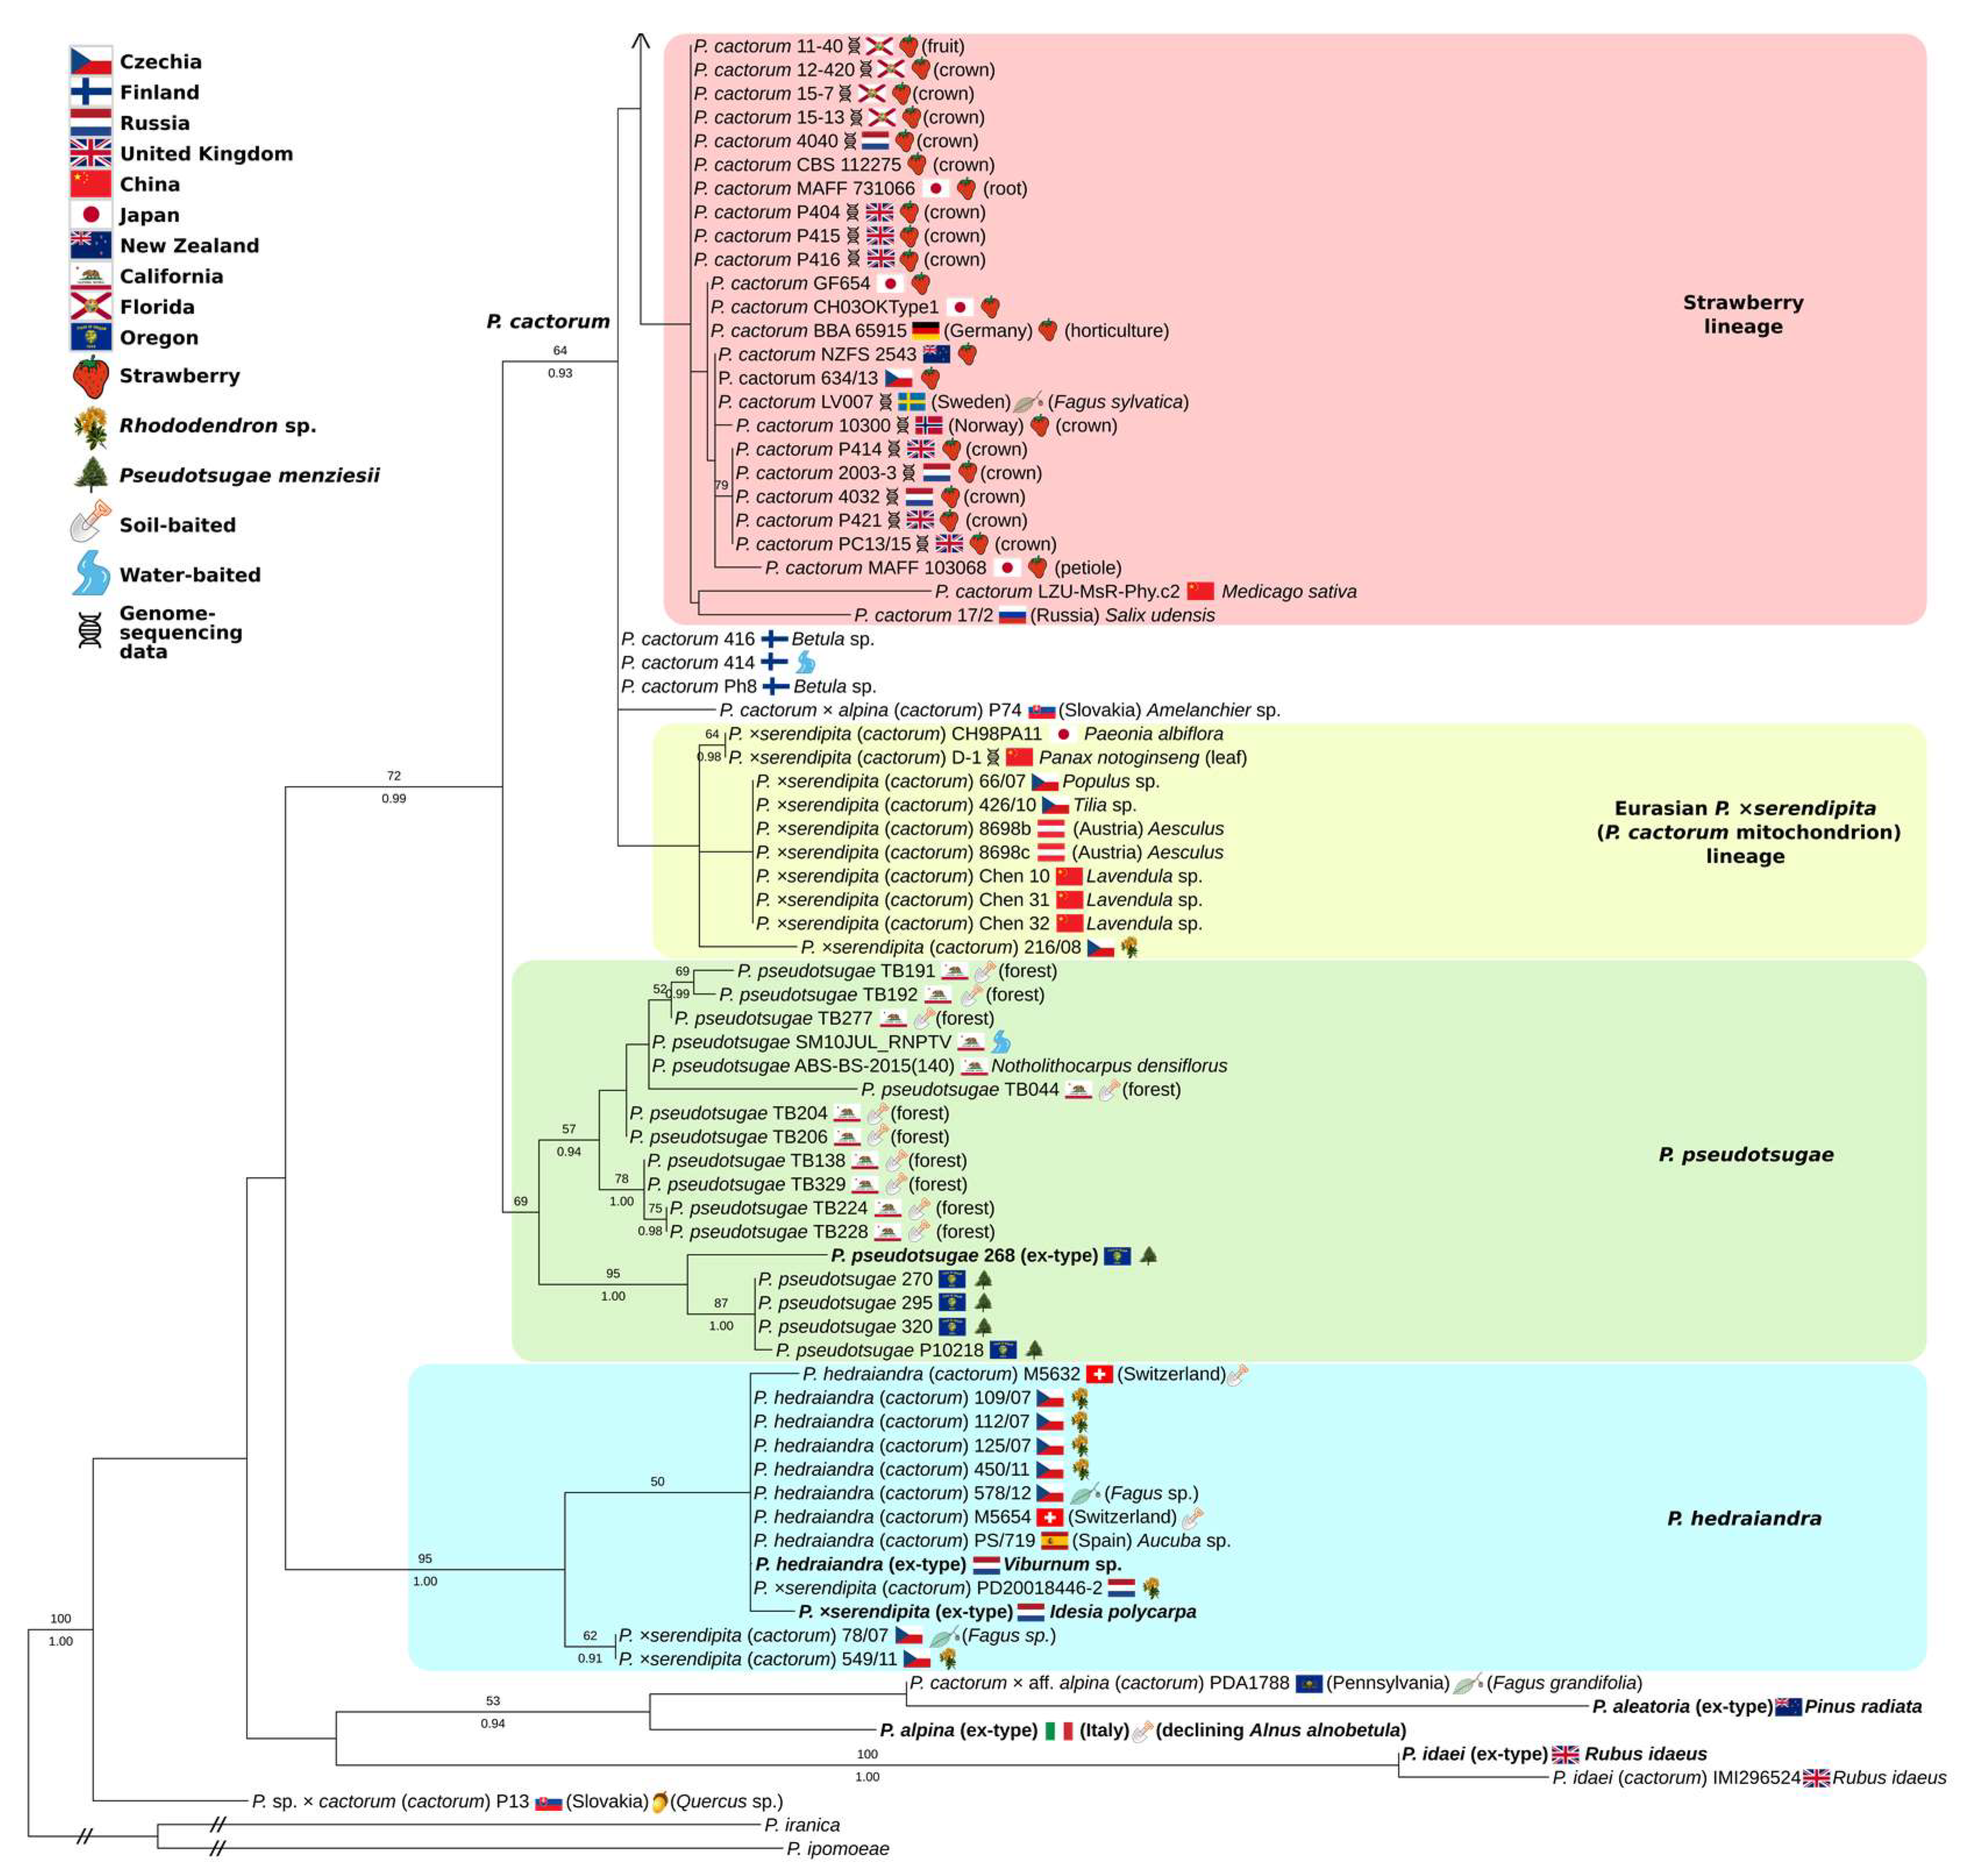
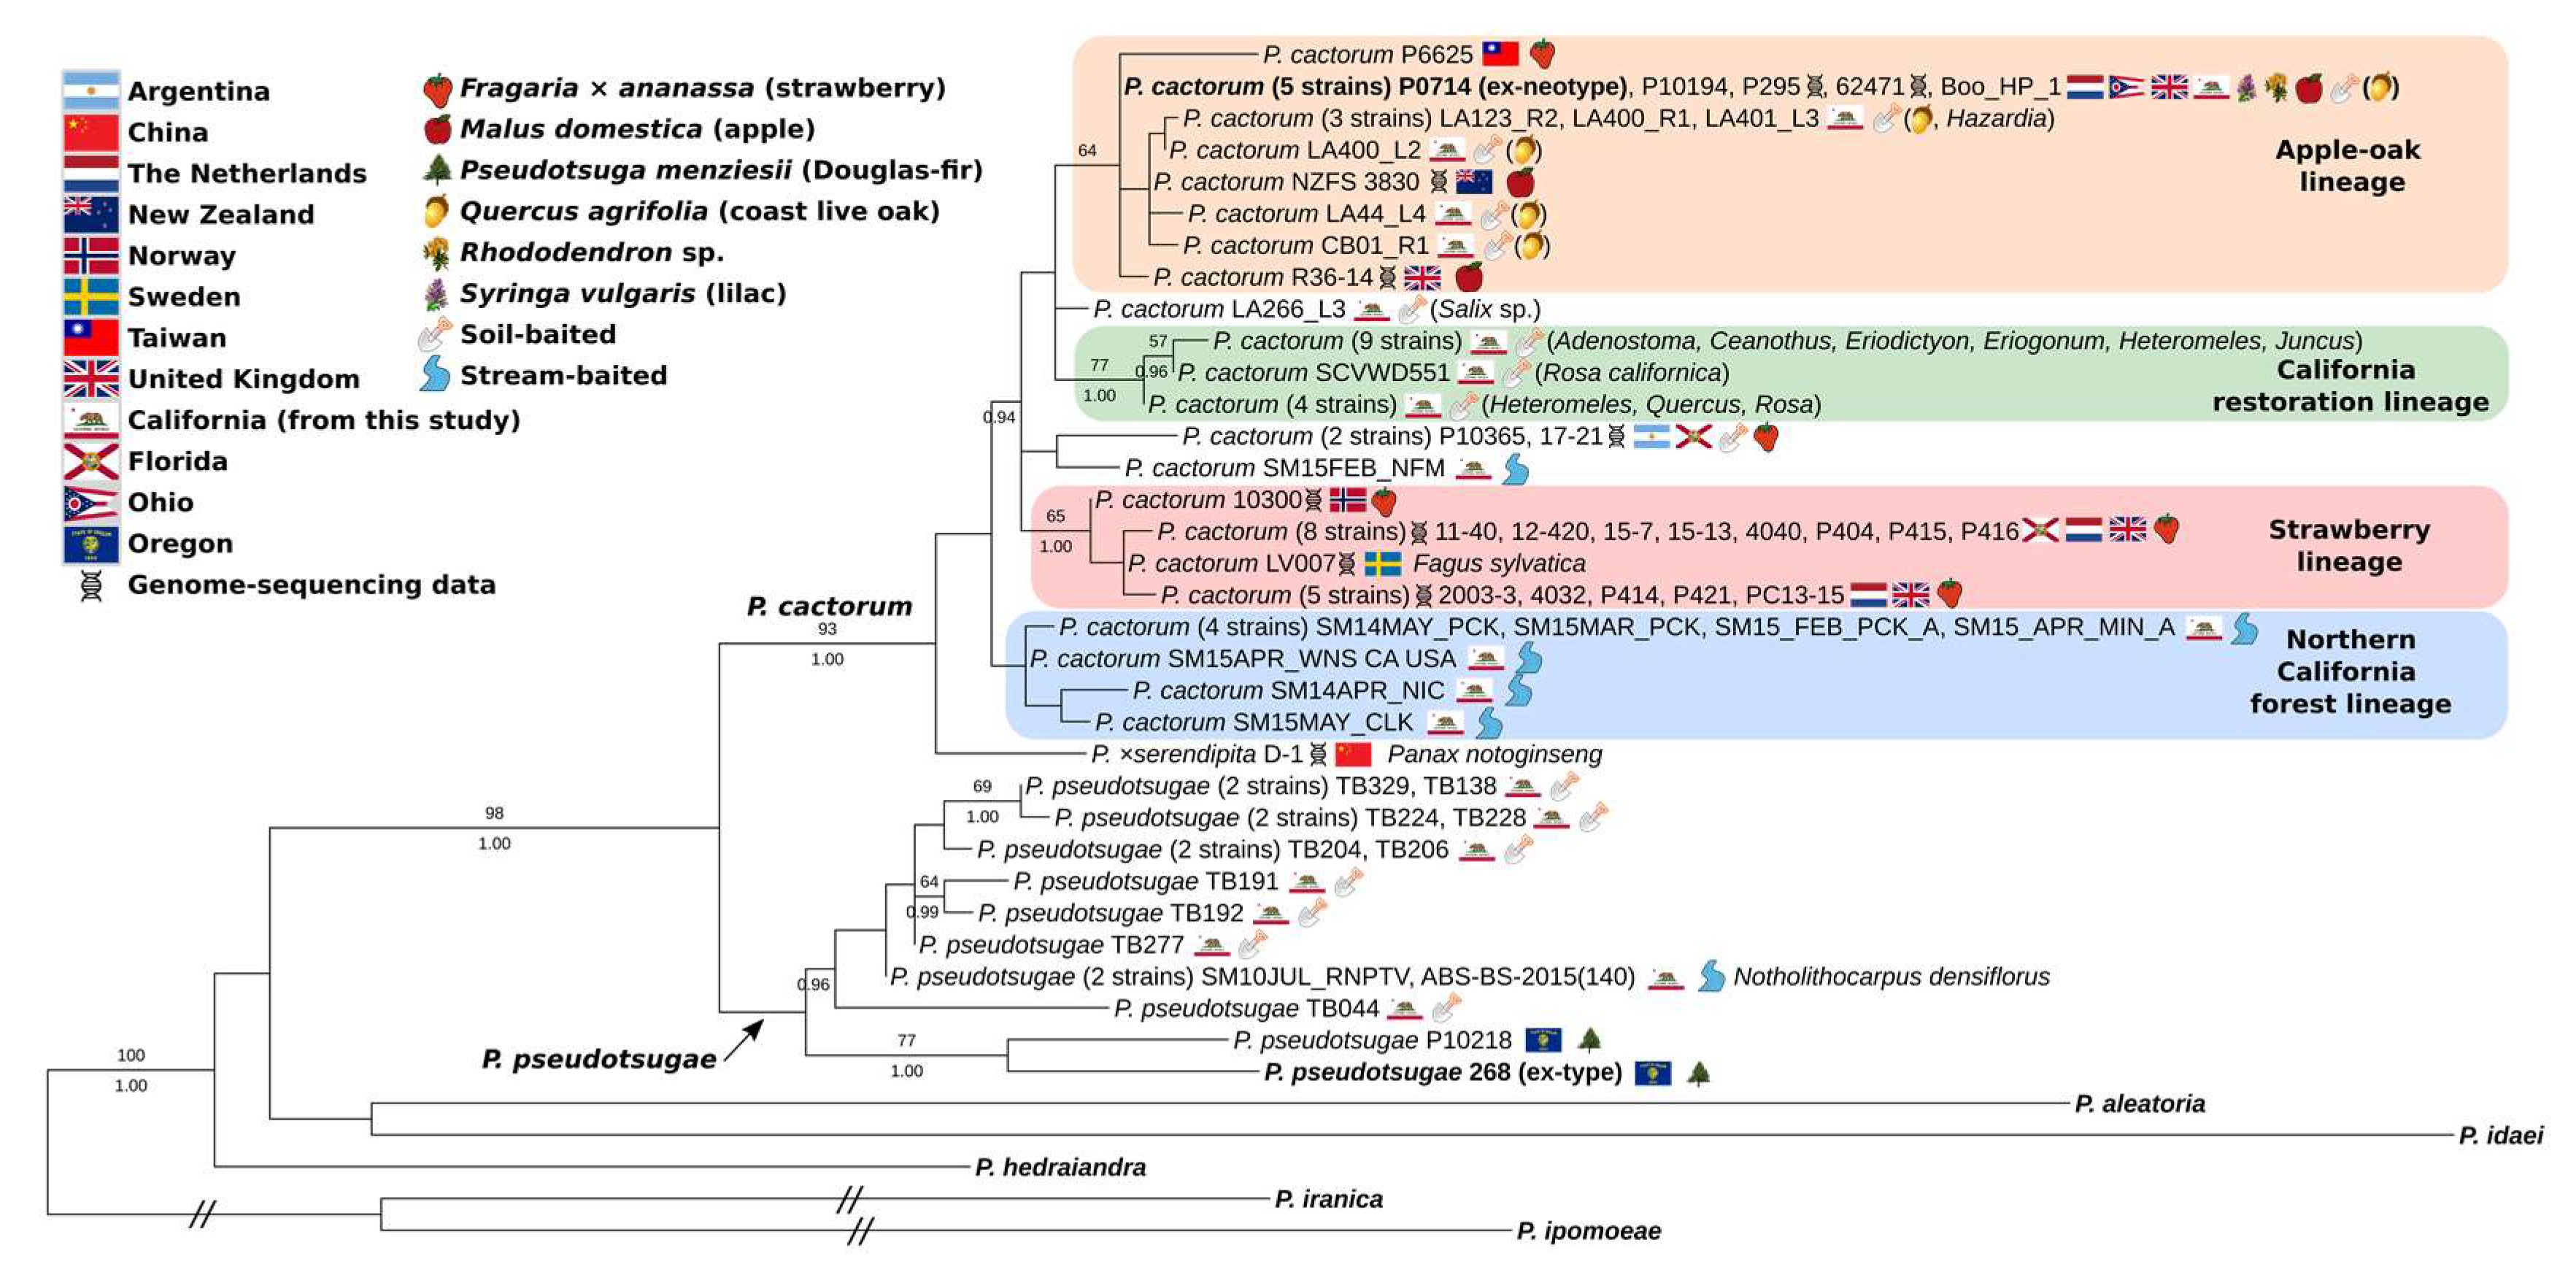
3.2. Full-Coverage, 74-Isolate Multi-Locus Trees
3.3. Partial-Coverage, 169-Isolate Multi-Locus Trees
3.4. Single-Locus Trees
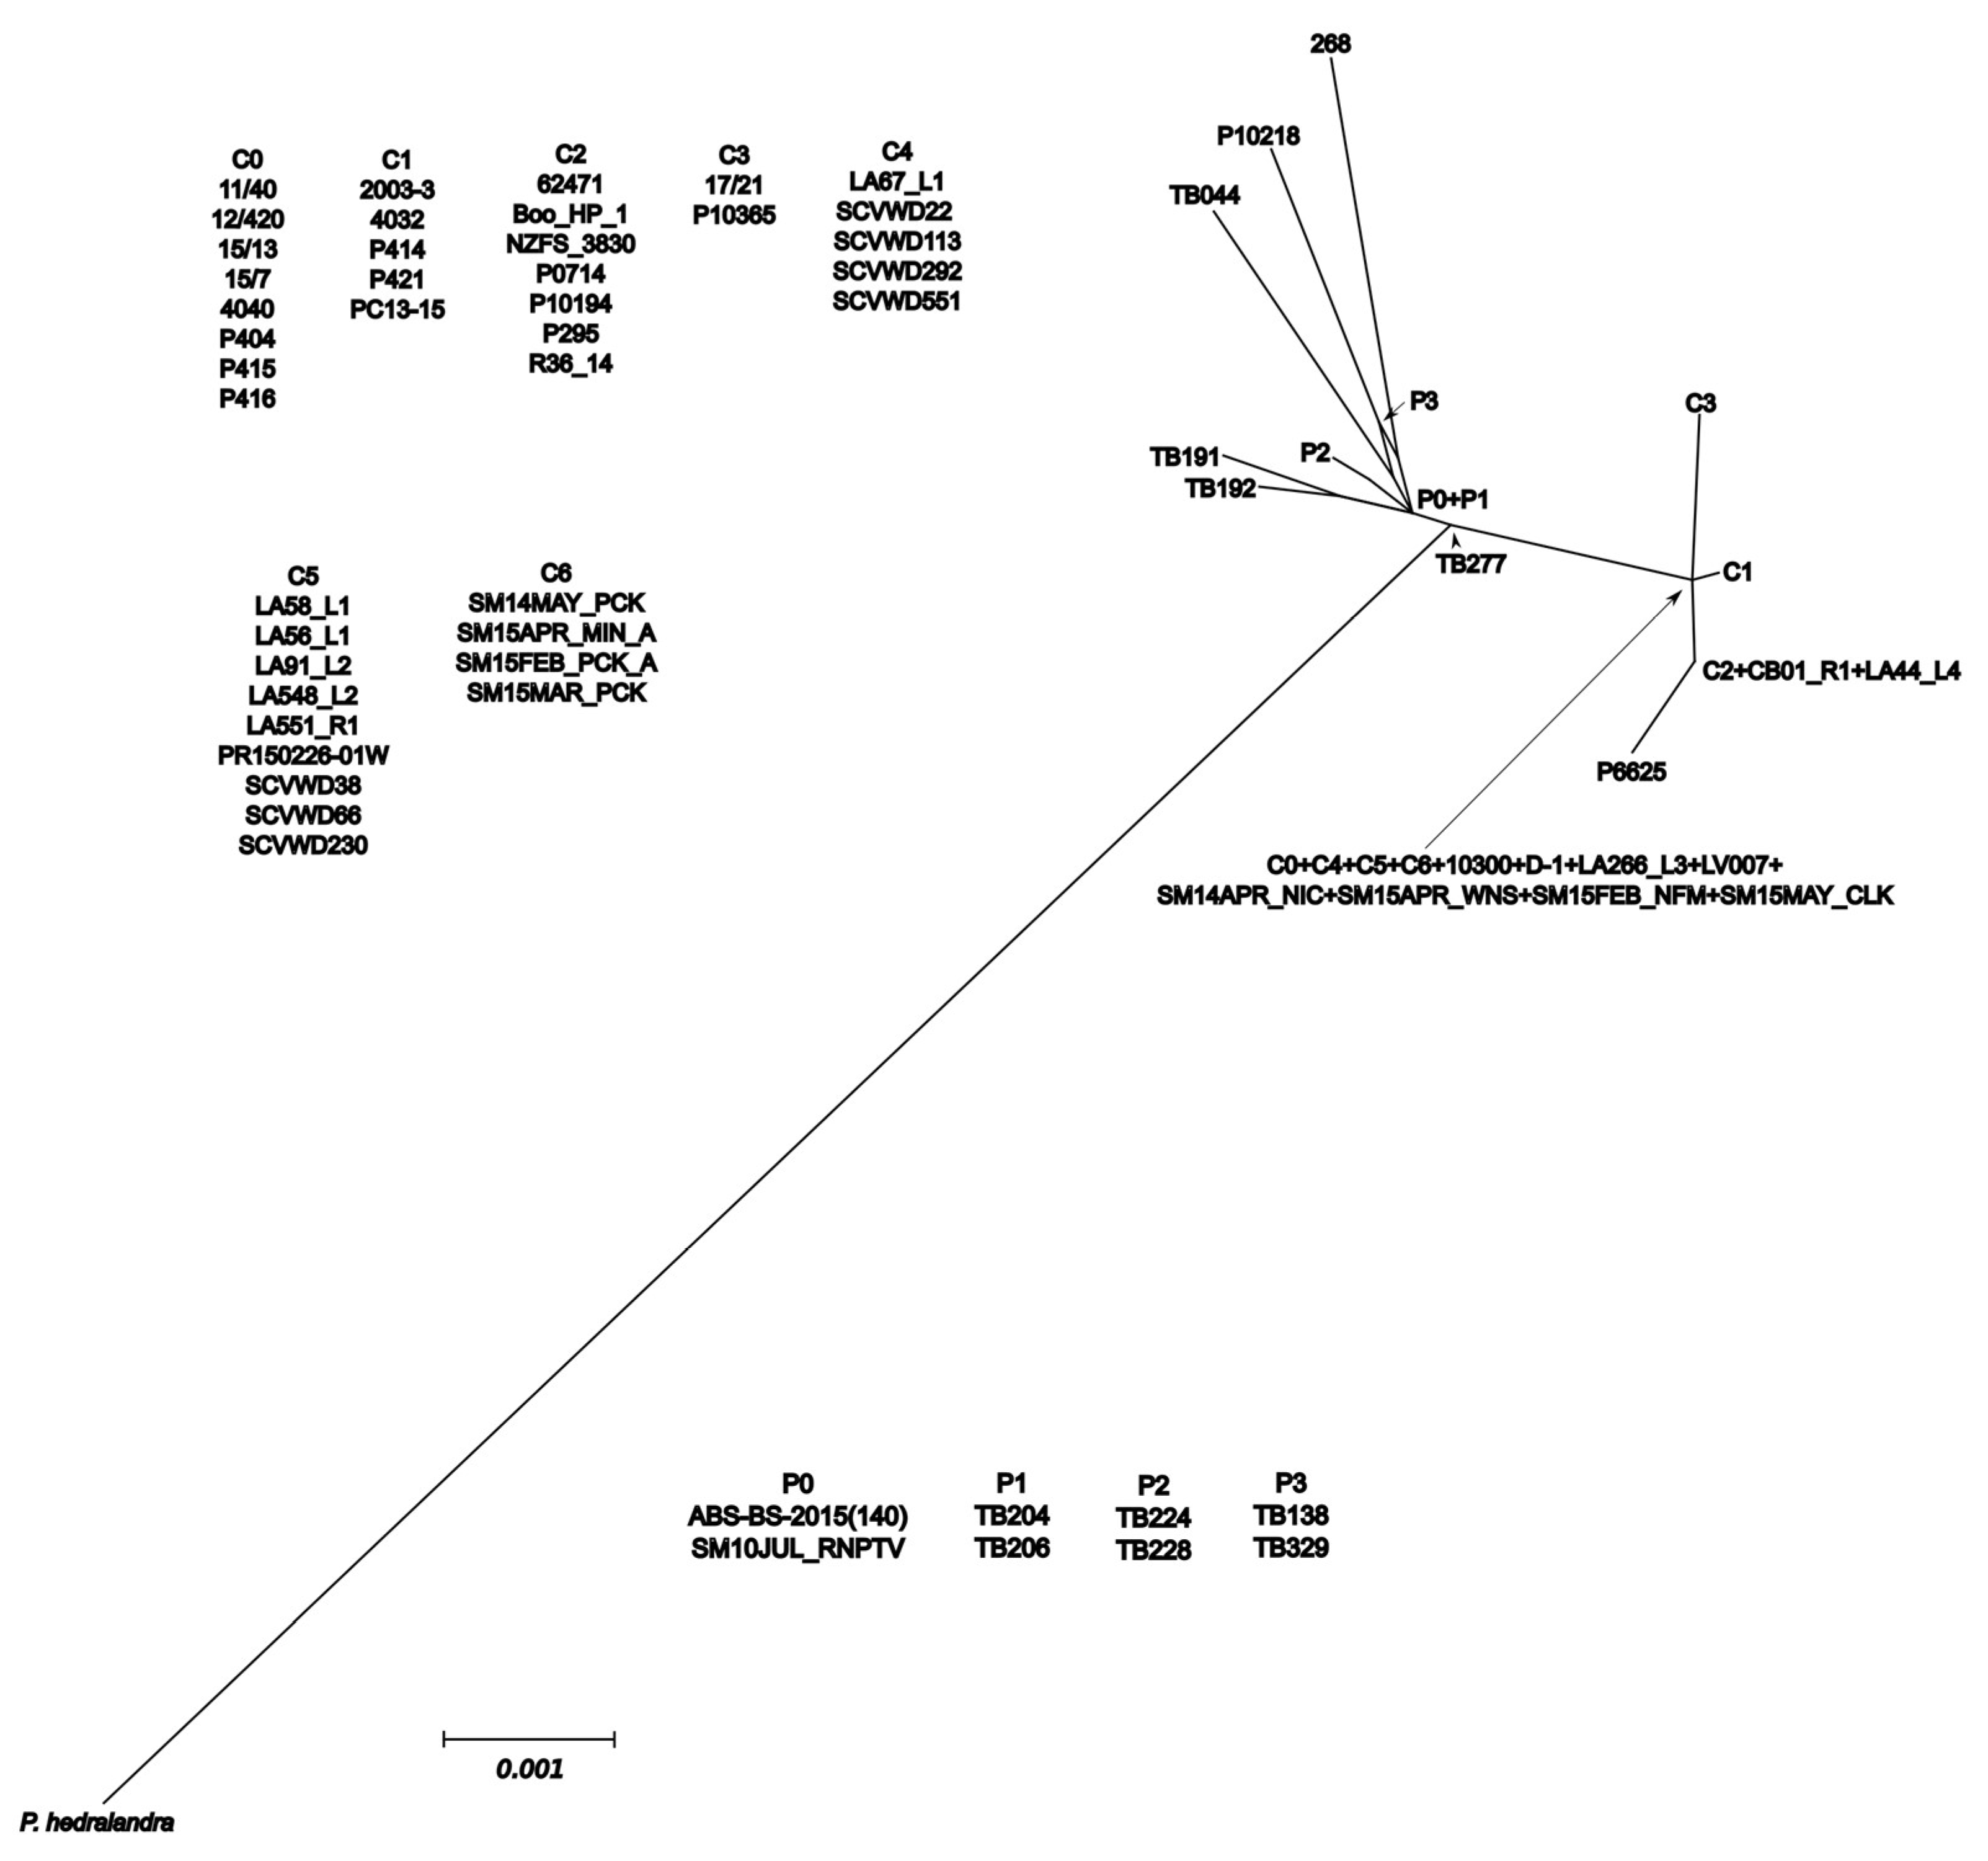
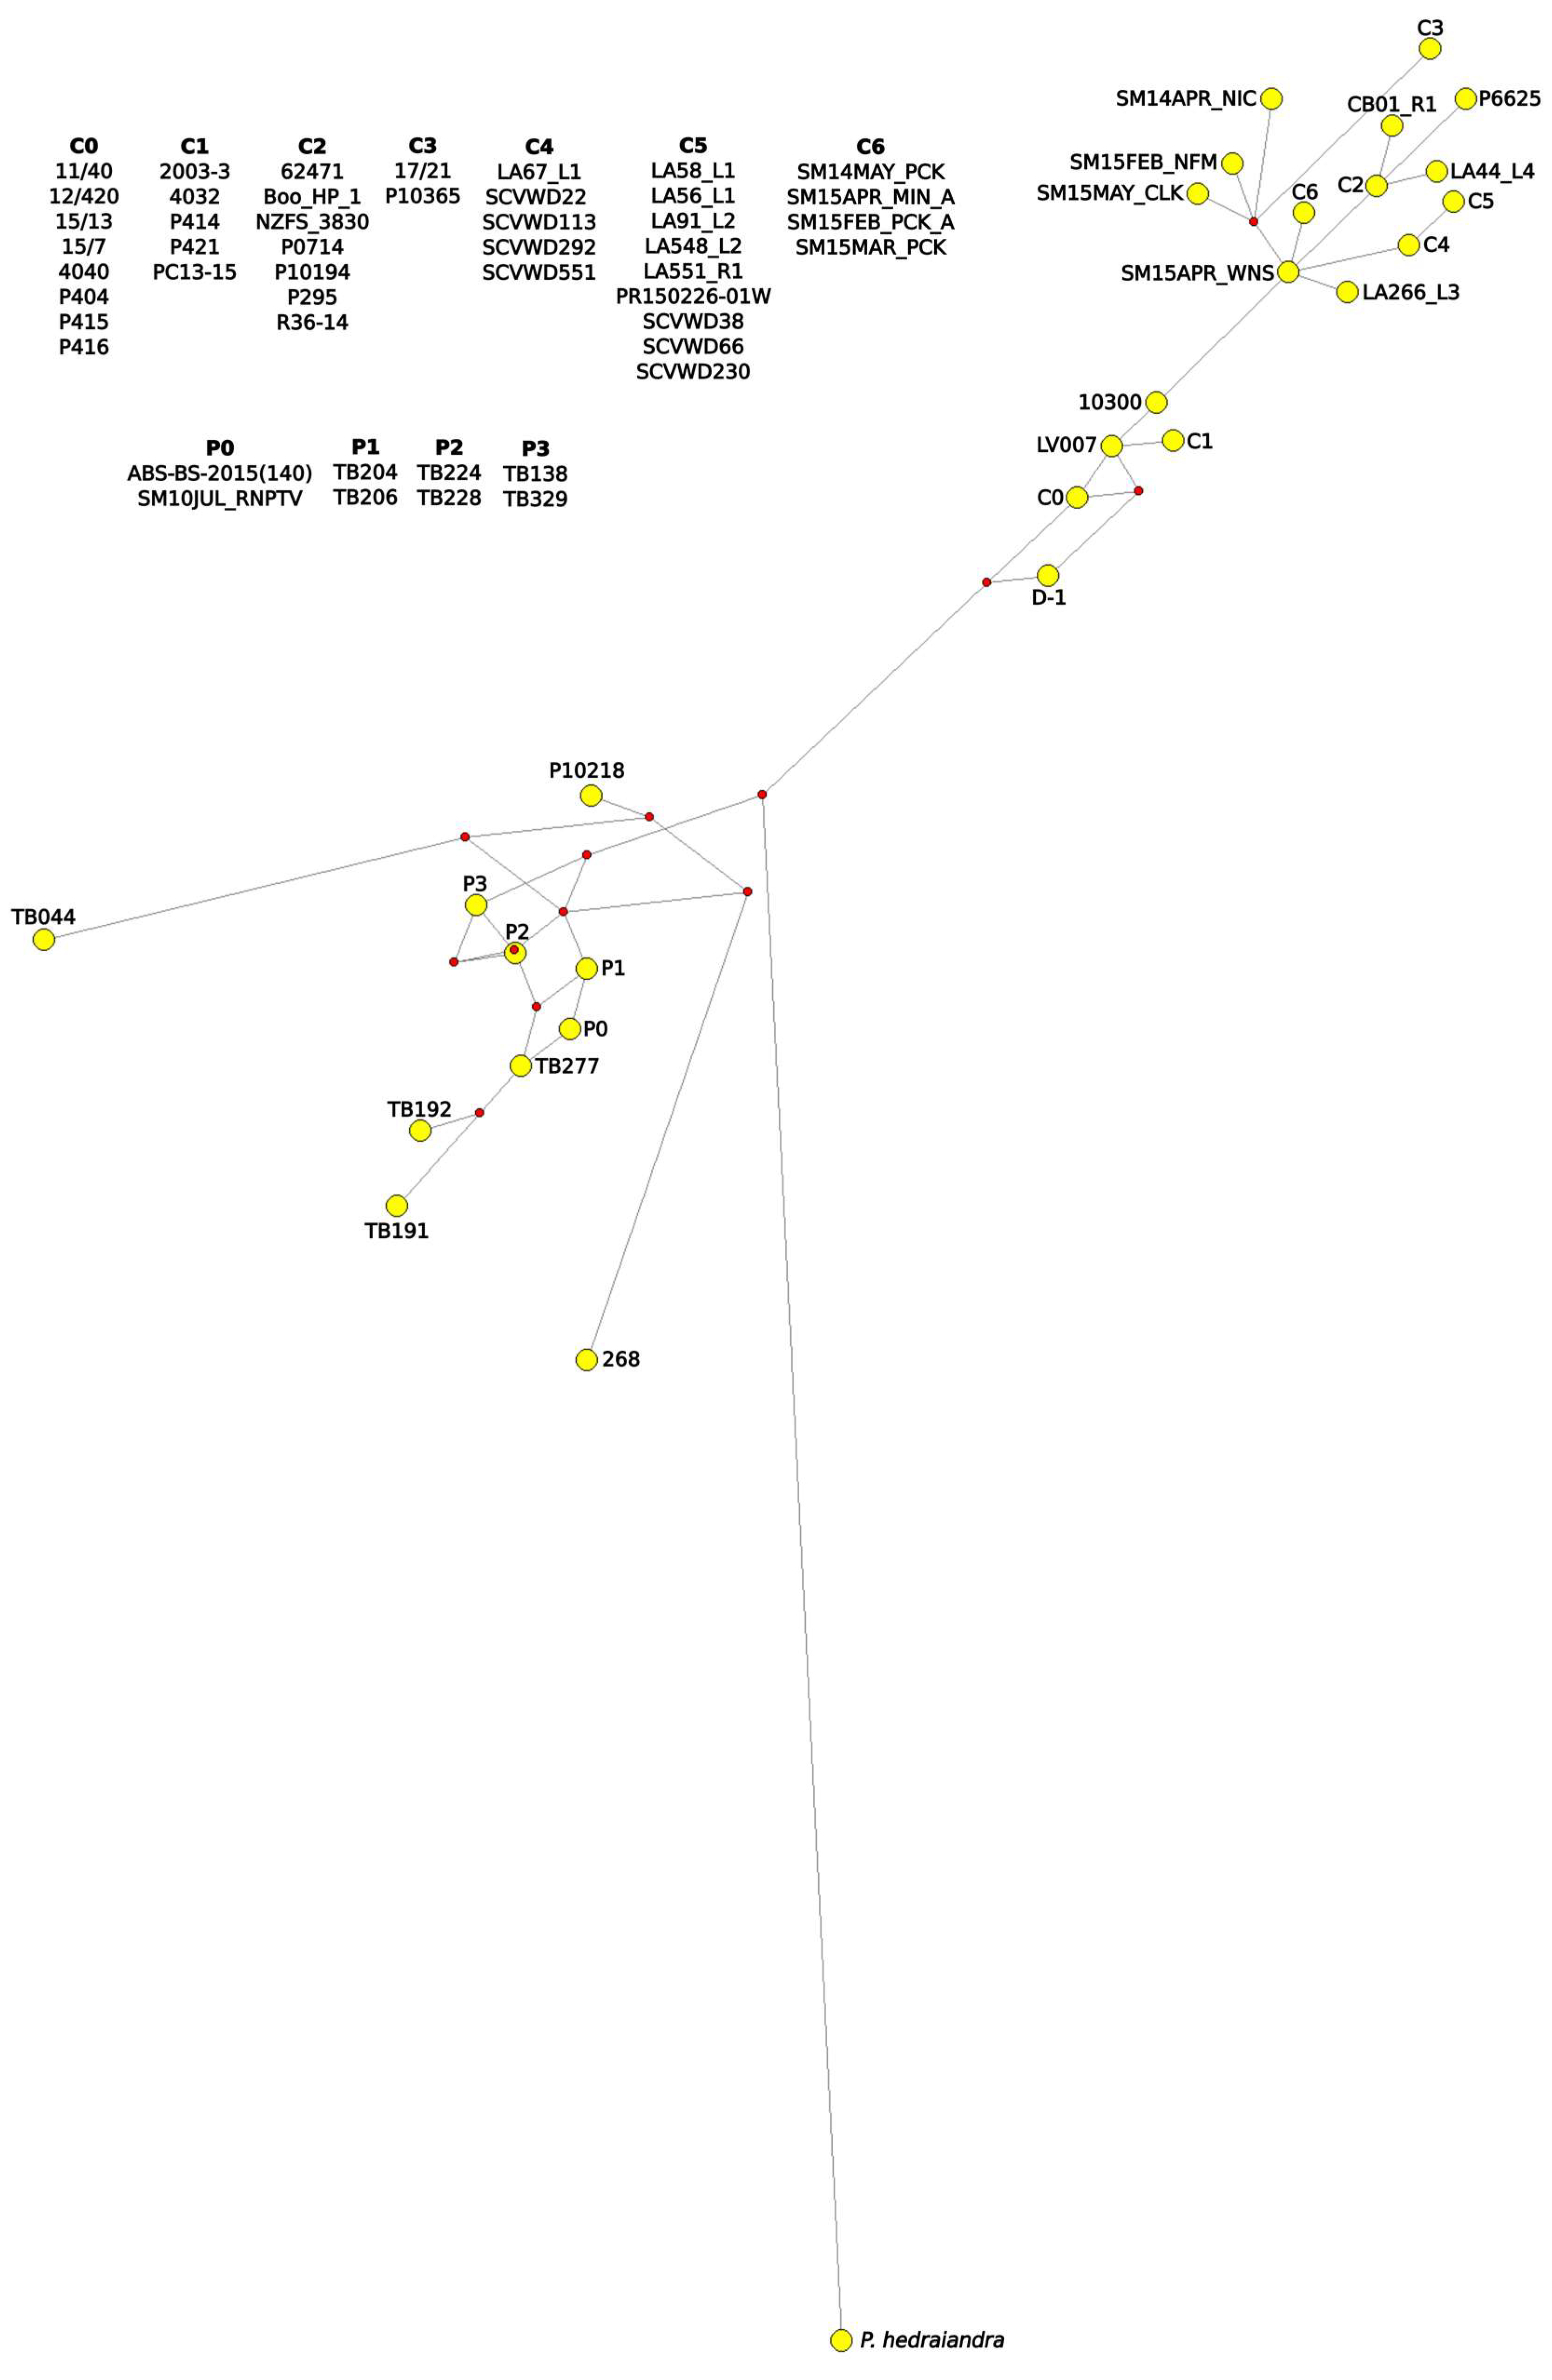
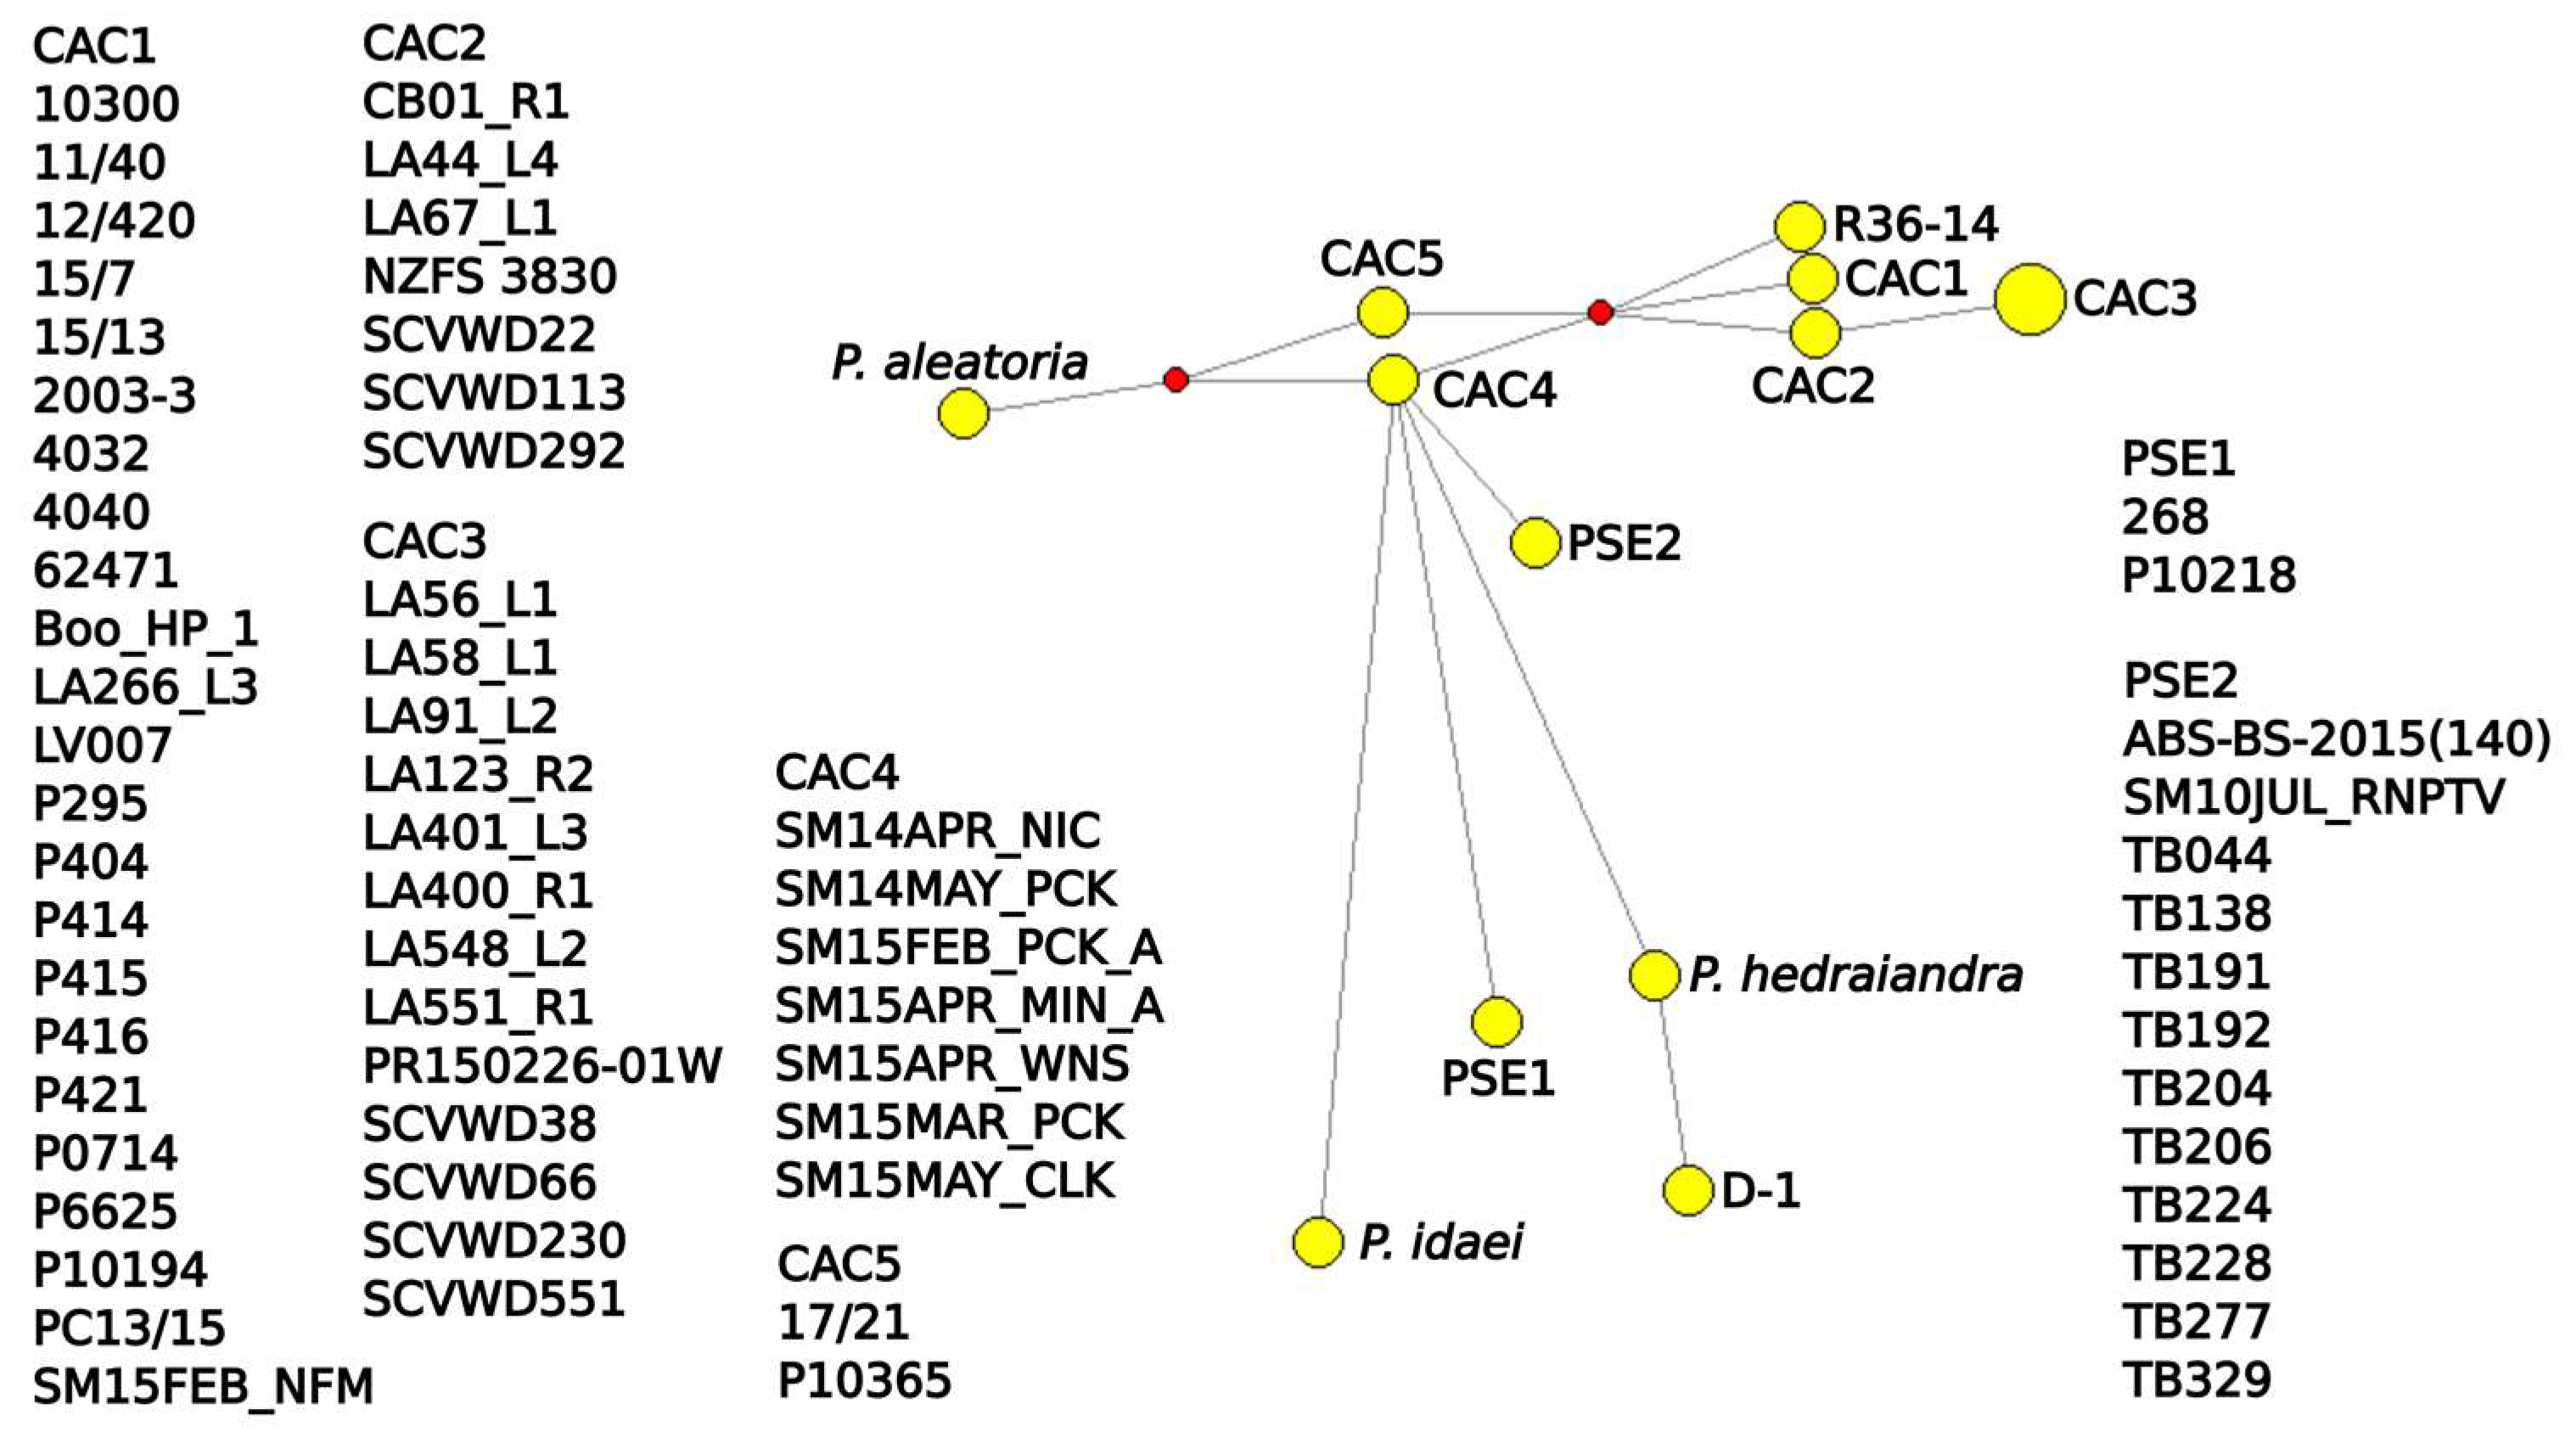
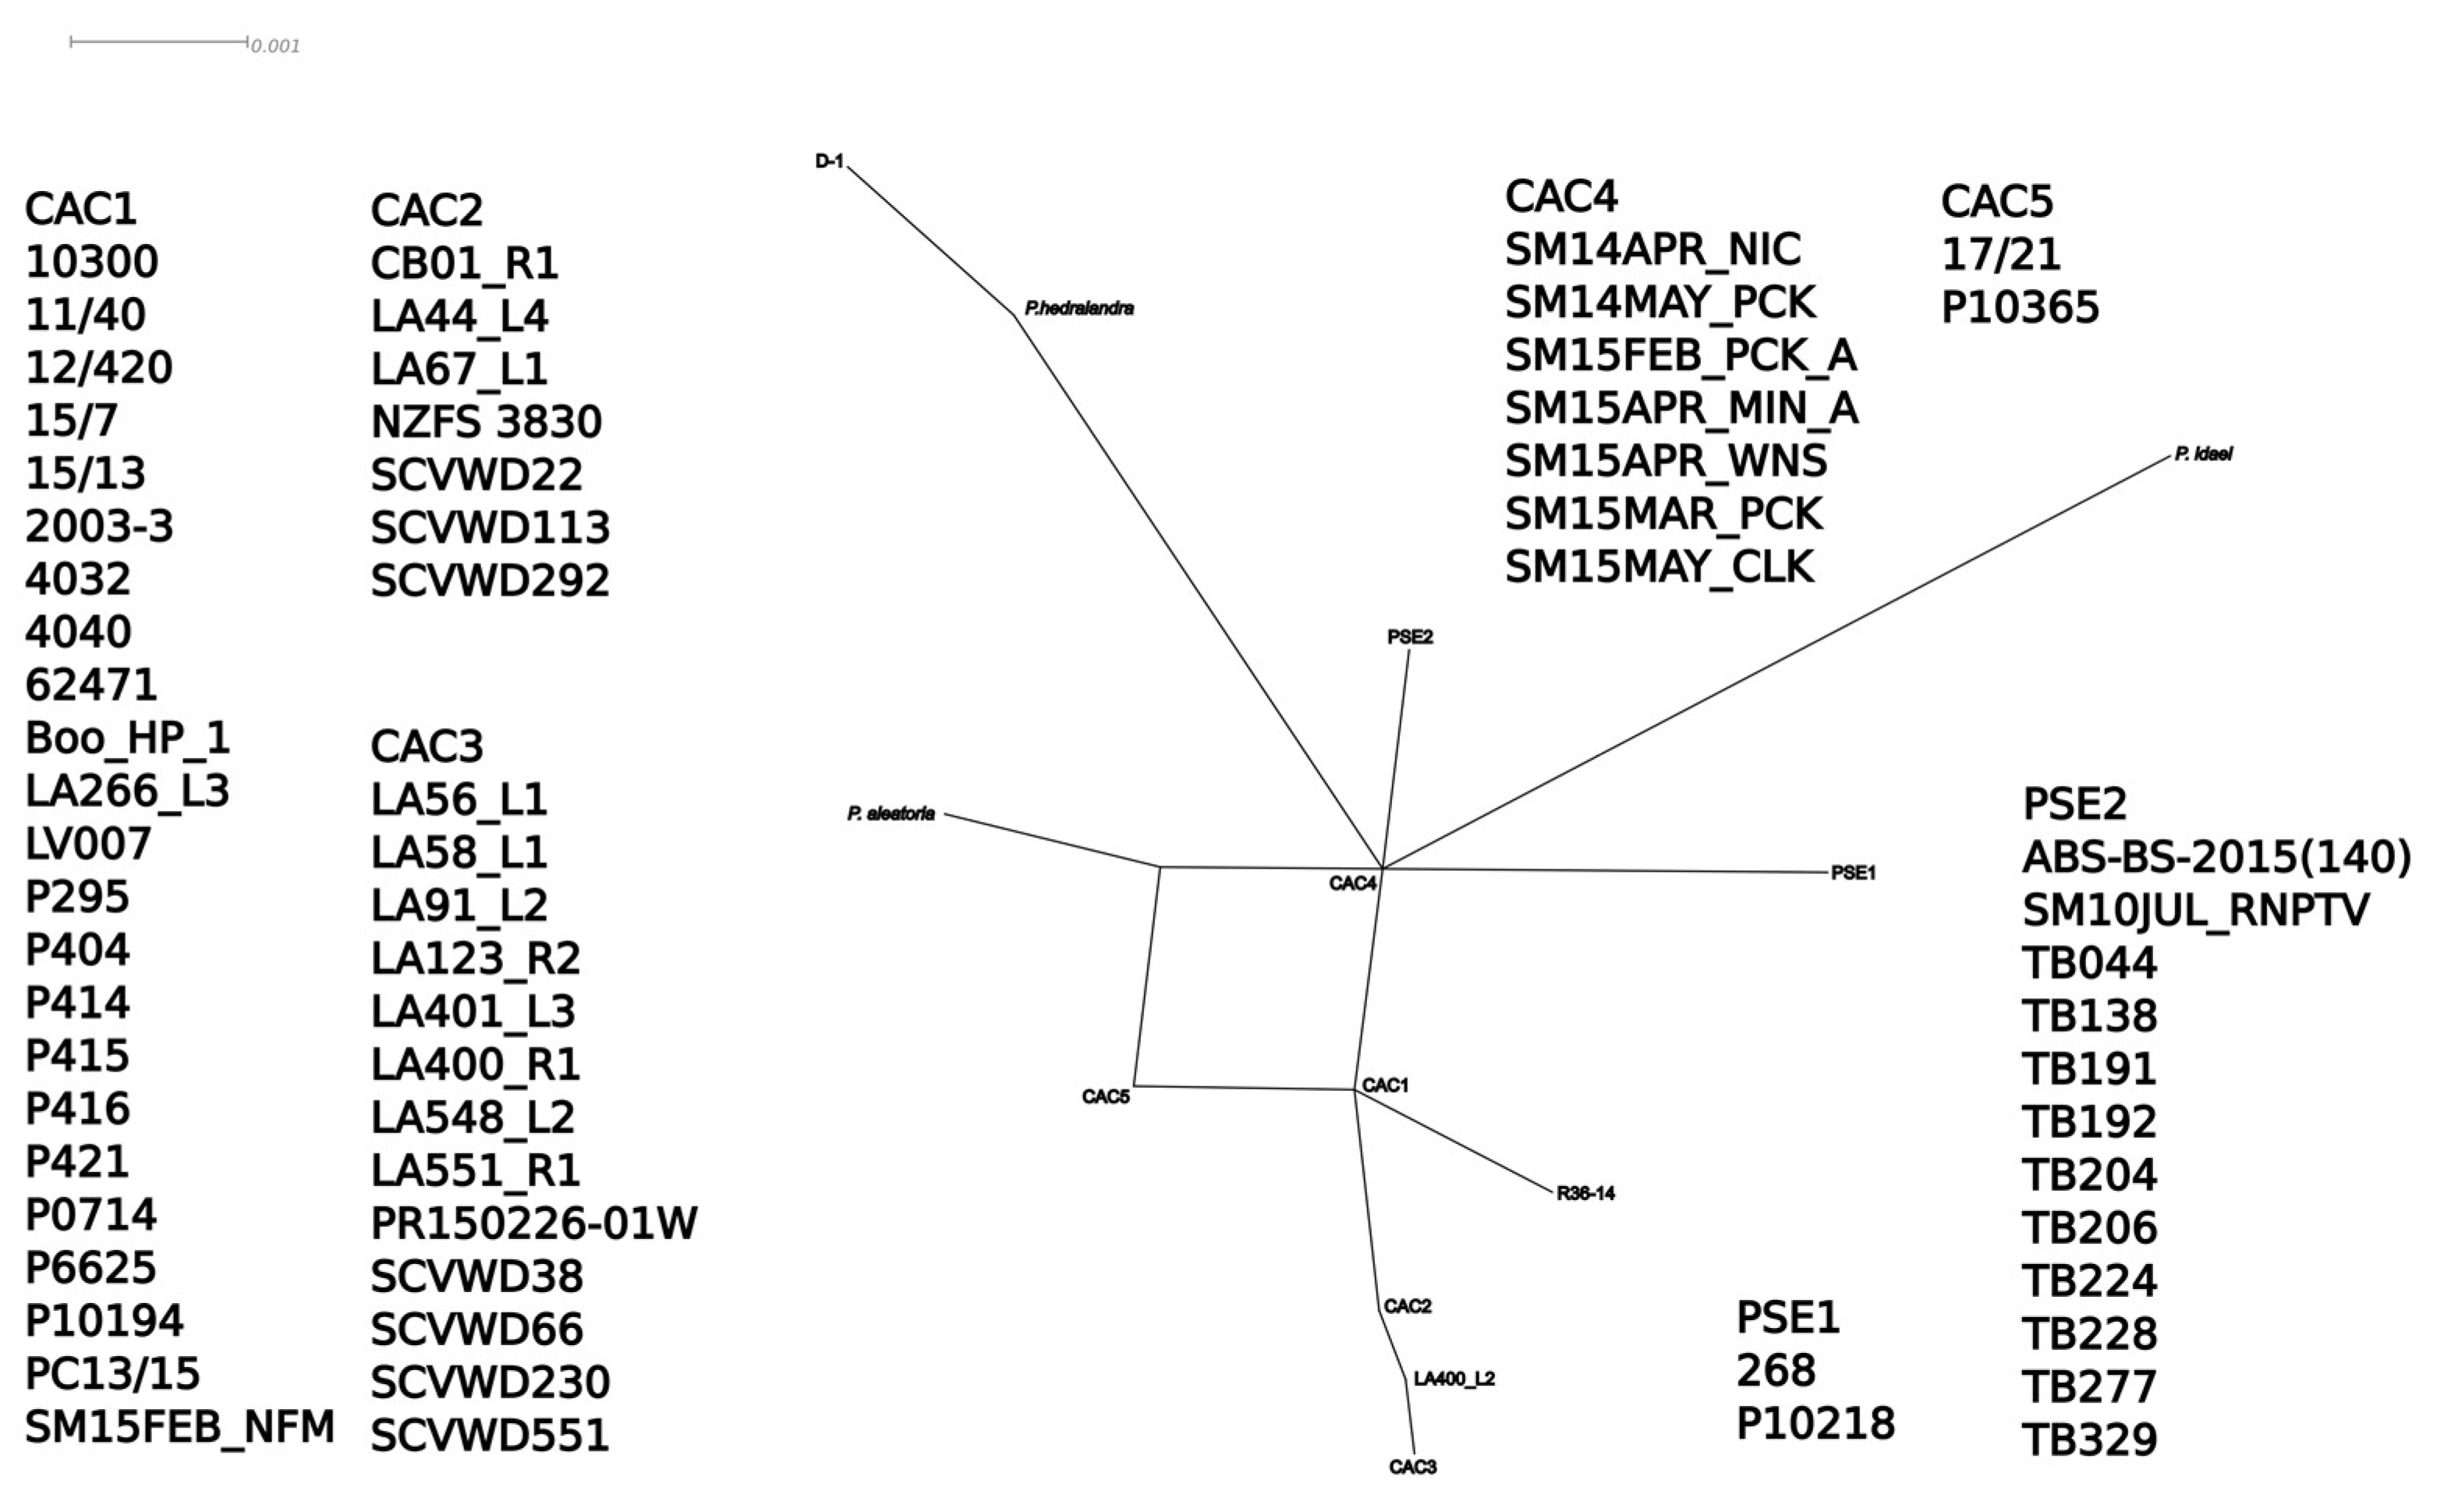
3.5. Networks
4. Discussion
4.1. Two Worldwide Lineages of P. cactorum
4.2. Diversity of California Isolates
4.3. Phytophthora ×serendipita
4.4. Sequence Barcodes and Data Sources
4.5. Host Specificity of P. cactorum
Supplementary Materials
Author Contributions
Funding
Institutional Review Board Statement
Informed Consent Statement
Data Availability Statement
Acknowledgments
Conflicts of Interest
References
- Tucker, C. Taxonomy of the Genus Phytophthora de Bary; Research Bulletin; University of Missouri, Agricultural Experiment Station: Columbia, MO, USA, 1931. [Google Scholar]
- Erwin, D.C.; Ribeiro, O.K. Phytophthora Diseases Worldwide; American Phytopathological Society: St. Paul, MN, USA, 1996; ISBN 978-0-89054-212-5. [Google Scholar]
- Marin, M.V.; Seijo, T.E.; Zuchelli, E.; Peres, N.A. Resistance to Mefenoxam of Phytophthora cactorum and Phytophthora nicotianae Causing Crown and Leather Rot in Florida Strawberry. Plant Dis. 2021, 105, 3490–3495. [Google Scholar] [CrossRef] [PubMed]
- Maas, J.L. Compendium of Strawberry Diseases, 2nd ed.; Diseases and Pests Compendium Series; The American Phytopathological Society: St. Paul, MN, USA, 1998; ISBN 978-0-89054-617-8. [Google Scholar]
- Sutton, T.B.; Aldwinckle, H.S.; Agnello, A.M.; Walgenbach, J.F. Compendium of Apple and Pear Diseases and Pests, 2nd ed.; Diseases and Pests Compendium Series; The American Phytopathological Society: St. Paul, MN, USA, 2014; ISBN 978-0-89054-433-4. [Google Scholar]
- Waterhouse, G.M. Key to the Species of Phytophthora de Bary; Mycological Papers, No. 92; Commonwealth Mycological Institute: Kew, UK, 1963. [Google Scholar]
- Hansen, E.M.; Roth, L.F.; Hamm, P.B.; Julis, A.J. Survival, Spread and Pathogenicity of Phytophthora spp. on Douglas-Fir Seedlings Planted on Forest Sites. Phytopathology 1980, 70, 422. [Google Scholar] [CrossRef]
- Hamm, P.B.; Hansen, E.M. Phytophthora pseudotsugae, a New Species Causing Root Rot of Douglas-Fir. Can. J. Bot. 1983, 61, 2626–2631. [Google Scholar] [CrossRef]
- Kennedy, D.M.; Duncan, J.M. A Papillate Phytophthora Species with Specificity to Rubus. Mycol. Res. 1995, 99, 57–68. [Google Scholar] [CrossRef]
- Cooke, D.E.L.; Kennedy, D.M.; Guy, D.C.; Russell, J.; Unkles, S.E.; Duncan, J.M. Relatedness of Group I Species of Phytophthora as Assessed by Randomly Amplified Polymorphic DNA (RAPDs) and Sequences of Ribosomal DNA. Mycol. Res. 1996, 100, 297–303. [Google Scholar] [CrossRef]
- Cooke, D.E.L.; Duncan, J.M. Phylogenetic Analysis of Phytophthora Species Based on ITS1 and ITS2 Sequences of the Ribosomal RNA Gene Repeat. Mycol. Res. 1997, 101, 667–677. [Google Scholar] [CrossRef]
- Cooke, D.E.L.; Drenth, A.; Duncan, J.M.; Wagels, G.; Brasier, C.M. A Molecular Phylogeny of Phytophthora and Related Oomycetes. Fungal Genet. Biol. 2000, 30, 17–32. [Google Scholar] [CrossRef] [PubMed]
- Man in ’t Veld, W.A.; Rosendahl, K.C.H.M.; Hong, C. Phytophthora × serendipita Sp. Nov. and P. × pelgrandis, Two Destructive Pathogens Generated by Natural Hybridization. Mycologia 2012, 104, 1390–1396. [Google Scholar] [CrossRef] [PubMed]
- Scott, P.; Taylor, P.; Gardner, J.; Puértolas, A.; Panda, P.; Addison, S.; Hood, I.; Burgess, T.; Horner, I.; Williams, N.; et al. Phytophthora aleatoria Sp. Nov., Associated with Root and Collar Damage on Pinus Rrdiata from Nurseries and Plantations. Australas. Plant Pathol. 2019, 48, 313–321. [Google Scholar] [CrossRef]
- De Cock, A.; Lévesque, C. New Species of Pythium and Phytophthora. Stud. Mycol. 2004, 50, 481–487. [Google Scholar]
- Bregant, C.; Sanna, G.P.; Bottos, A.; Maddau, L.; Montecchio, L.; Linaldeddu, B.T. Diversity and Pathogenicity of Phytophthora Species Associated with Declining Alder Trees in Italy and Description of Phytophthora alpina Sp. Nov. Forests 2020, 11, 848. [Google Scholar] [CrossRef]
- Nirenberg, H.I.; Gerlach, W.F.; Gräfenhan, T. Phytophthora × pelgrandis, a New Natural Hybrid Pathogenic to Pelargonium grandiflorum Hort. Mycologia 2009, 101, 220–231. [Google Scholar] [CrossRef] [PubMed]
- Scheer, H.A.T. Isolation of Phytophthora cactorum from Soil in Orchards and Strawberry Fields and Differences in Pathogenicity to Apple. Neth. J. Plant Pathol. 1971, 77, 65–72. [Google Scholar] [CrossRef]
- Darmono, T.W. Isolation and Pathogenicity of Phytophthora cactorum from Forest and Ginseng Garden Soils in Wisconsin. Plant Dis. 1991, 75, 610. [Google Scholar] [CrossRef]
- Eikemo, H.; Klemsdal, S.S.; Riisberg, I.; Bonants, P.; Stensvand, A.; Tronsmo, A.M. Genetic Variation between Phytophthora cactorum Isolates Differing in Their Ability to Cause Crown Rot in Strawberry. Mycol. Res. 2004, 108, 317–324. [Google Scholar] [CrossRef] [PubMed]
- Hantula, J.; Lilja, A.; Parikka, P. Genetic Variation and Host Specificity of Phytophthora cactorum Isolated in Europe. Mycol. Res. 1997, 101, 565–572. [Google Scholar] [CrossRef]
- Hantula, J.; Lilja, A.; Nuorteva, H.; Parikka, P.; Werres, S. Pathogenicity, Morphology and Genetic Variation of Phytophthora cactorum from Strawberry, Apple, Rhododendron, and Silver Birch. Mycol. Res. 2000, 104, 1062–1068. [Google Scholar] [CrossRef]
- Bhat, R.G.; Colowit, P.M.; Tai, T.H.; Aradhya, M.K.; Browne, G.T. Genetic and Pathogenic Variation in Phytophthora cactorum Affecting Fruit and Nut Crops in California. Plant Dis. 2006, 90, 161–169. [Google Scholar] [CrossRef] [PubMed]
- Nellist, C.F.; Armitage, A.D.; Bates, H.J.; Sobczyk, M.K.; Luberti, M.; Lewis, L.A.; Harrison, R.J. Comparative Analysis of Host-Associated Variation in Phytophthora cactorum. Front. Microbiol. 2021, 12, 679936. [Google Scholar] [CrossRef]
- Pánek, M.; Fér, T.; Mráček, J.; Tomšovský, M. Evolutionary Relationships within the Phytophthora cactorum Species Complex in Europe. Fungal Biol. 2016, 120, 836–851. [Google Scholar] [CrossRef]
- Pánek, M.; Střížková, I.; Zouhar, M.; Kudláček, T.; Tomšovský, M. Mixed-Mating Model of Reproduction Revealed in European Phytophthora cactorum by DdRADseq and Effector Gene Sequence Data. Microorganisms 2021, 9, 345. [Google Scholar] [CrossRef] [PubMed]
- Jung, T. Beech Decline in Central Europe Driven by the Interaction between Phytophthora Infections and Climatic Extremes. Forest Pathol. 2009, 39, 73–94. [Google Scholar] [CrossRef]
- Robideau, G.P.; de Cock, A.W.A.M.; Coffey, M.D.; Voglmayr, H.; Brouwer, H.; Bala, K.; Chitty, D.W.; DéSaulniers, N.; Eggertson, Q.A.; Gachon, C.M.M.; et al. DNA Barcoding of Oomycetes with Cytochrome c Oxidase Subunit I and Internal Transcribed Spacer. Mol. Ecol. Resour. 2011, 11, 1002–1011. [Google Scholar] [CrossRef] [PubMed]
- Martin, F.N.; Tooley, P.W. Phylogenetic Relationships among Phytophthora Species Inferred from Sequence Analysis of Mitochondrially Encoded Cytochrome Oxidase I and II Genes. Mycologia 2003, 95, 269. [Google Scholar] [CrossRef]
- Martin, F.N. Phylogenetic Relationships among Some Pythium Species Inferred from Sequence Analysis of the Mitochondrially Encoded Cytochrome Oxidase II Gene. Mycologia 2000, 92, 711. [Google Scholar] [CrossRef]
- Choi, Y.-J.; Beakes, G.; Glockling, S.; Kruse, J.; Nam, B.; Nigrelli, L.; Ploch, S.; Shin, H.-D.; Shivas, R.G.; Telle, S.; et al. Towards a Universal Barcode of Oomycetes—A Comparison of the Cox 1 and Cox 2 Loci. Mol. Ecol. Resour. 2015, 15, 1275–1288. [Google Scholar] [CrossRef] [PubMed]
- Bourret, T.B.; Mehl, H.K.; Swiecki, T.J.; Bernhardt, E.A.; Hillman, J.M.; Rizzo, D.M. Chapter 2: Restoration Outplantings of Nursery-Origin Californian Flora Are Heavily Infested with Phytophthora. Ph.D. Thesis, University of California, Davis, Davis, CA, USA, 2018. [Google Scholar]
- Boesewinkel, H.J. Storage of Fungal Cultures in Water. Trans. Br. Mycol. Soc. 1976, 66, 183–185. [Google Scholar] [CrossRef]
- Fajardo, S.N.; Bourret, T.B.; Endelenbos, C.; Lozano, E.; Rizzo, D.M.; Frankel, S.J.; VinZant, K. Assessing the Incidence and Diversity of Phytophthora Species Ocurring in Planned Restoration Areas of the Angeles National Forest. In Proceedings of the 9th Meeting of the International Union of Forest Research Organizations IUFRO Working Party 7.02.09 Phytophthora in Forests and Natural Ecosystems, Sardinia, Italy, 17 October 2019; p. 2. [Google Scholar]
- Bourret, T.B.; Mehl, H.K.; Aram, K.; Rizzo, D.M.; Hillman, J.M.; Rizzo, D.M. Chapter 3: Rhododendron Leaf Baiting of Coastal California Watersheds for Phytophthora. Ph.D. Thesis, University of California, Davis, Davis, CA, USA, 2018. [Google Scholar]
- Bourret, T.B.; Mehl, H.K.; Aram, K.; Rizzo, D.M. Rhododendron Leaf Baiting of Coastal California Watersheds for Phytophthora (Poster). In Proceedings of the Sixth Sudden Oak Death Science Symposium, San Francisco, CA, USA, 20–23 June 2016. [Google Scholar]
- Aram, K.; Rizzo, D.M. Distinct Trophic Specializations Affect How Phytophthora ramorum and Clade 6 Phytophthora spp. Colonize and Persist on Umbellularia californica Leaves in Streams. Phytopathology 2018, 108, 858–869. [Google Scholar] [CrossRef] [PubMed]
- Murphy, S.K.; Lee, C.; Valachovic, Y.; Bienapfl, J.; Mark, W.; Jirka, A.; Owen, D.R.; Smith, T.F.; Rizzo, D.M. Monitoring Phytophthora Ramorum Distribution in Streams Within California Watersheds. In Proceedings of the Sudden Oak Death Third Science Symposium, Santa Rosa, CA, USA, 15 December 2008. [Google Scholar]
- Metz, M.R.; Frangioso, K.M.; Meentemeyer, R.K.; Rizzo, D.M. Interacting Disturbances: Wildfire Severity Affected by Stage of Forest Disease Invasion. Ecol. Appl. Publ. Ecol. Soc. Am. 2011, 21, 313–320. [Google Scholar] [CrossRef] [PubMed]
- Mircetich, S.M.; Campbell, R.N.; Matheron, M.E. Phytophthora Trunk Canker of Coast Live Oak and Cork Oak Trees in California. Plant Dis. Report. 1977, 61, 66–70. [Google Scholar]
- Bourret, T.B.; Choudhury, R.A.; Mehl, H.K.; Blomquist, C.L.; McRoberts, N.; Rizzo, D.M. Multiple Origins of Downy Mildews and Mito-Nuclear Discordance within the Paraphyletic Genus Phytophthora. PLoS ONE 2018, 13, e0192502. [Google Scholar] [CrossRef] [PubMed]
- Martin, F.N.; Coffey, M.D. Mitochondrial Haplotype Analysis for Differentiation of Isolates of Phytophthora cinnamomi. Phytopathology 2012, 102, 229–239. [Google Scholar] [CrossRef] [PubMed]
- Maddison, D.R.; Maddison, W.P. Chromaseq: A Mesquite Package for Analyzing Sequence Chromatograms. Version 1.12. 2014. Available online: http://mesquiteproject.org/packages/chromaseq (accessed on 31 October 2020).
- Maddison, W.P.; Maddison, D.R. Mesquite: A Modular System for Evolutionary Analysis. Version 3.04. 2015. Available online: http://mesquiteproject.org (accessed on 31 October 2020).
- Larsson, A. AliView: A Fast and Lightweight Alignment Viewer and Editor for Large Datasets. Bioinformatics 2014, 30, 3276–3278. [Google Scholar] [CrossRef] [PubMed]
- Katoh, K. MAFFT Version 5: Improvement in Accuracy of Multiple Sequence Alignment. Nucleic Acids Res. 2005, 33, 511–518. [Google Scholar] [CrossRef] [PubMed]
- Katoh, K.; Standley, D.M. MAFFT Multiple Sequence Alignment Software Version 7: Improvements in Performance and Usability. Mol. Biol. Evol. 2013, 30, 772–780. [Google Scholar] [CrossRef] [PubMed]
- Katoh, K.; Toh, H. Improved Accuracy of Multiple NcRNA Alignment by Incorporating Structural Information into a MAFFT-Based Framework. BMC Bioinform. 2008, 9, 212. [Google Scholar] [CrossRef] [PubMed]
- Borchsenius, F. FastGap 1.2; Department of Biosciences, Aarhus University: Aarhus, Denmark, 2009. [Google Scholar]
- Minh, B.Q.; Schmidt, H.A.; Chernomor, O.; Schrempf, D.; Woodhams, M.D.; von Haeseler, A.; Lanfear, R. IQ-TREE 2: New Models and Efficient Methods for Phylogenetic Inference in the Genomic Era. Mol. Biol. Evol. 2020, 37, 1530–1534. [Google Scholar] [CrossRef]
- Chernomor, O.; von Haeseler, A.; Minh, B.Q. Terrace Aware Data Structure for Phylogenomic Inference from Supermatrices. Syst. Biol. 2016, 65, 997–1008. [Google Scholar] [CrossRef] [PubMed]
- Kalyaanamoorthy, S.; Minh, B.Q.; Wong, T.K.F.; von Haeseler, A.; Jermiin, L.S. ModelFinder: Fast Model Selection for Accurate Phylogenetic Estimates. Nat. Methods 2017, 14, 587–589. [Google Scholar] [CrossRef] [PubMed]
- Lanfear, R.; Frandsen, P.B.; Wright, A.M.; Senfeld, T.; Calcott, B. PartitionFinder 2: New Methods for Selecting Partitioned Models of Evolution for Molecular and Morphological Phylogenetic Analyses. Mol. Biol. Evol. 2016, 34, 772–773. [Google Scholar] [CrossRef] [PubMed]
- Stöver, B.C.; Müller, K.F. TreeGraph 2: Combining and Visualizing Evidence from Different Phylogenetic Analyses. BMC Bioinform. 2010, 11, 7. [Google Scholar] [CrossRef] [PubMed]
- Jung, T.; Horta Jung, M.; Webber, J.F.; Kageyama, K.; Hieno, A.; Masuya, H.; Uematsu, S.; Pérez-Sierra, A.; Harris, A.R.; Forster, J.; et al. The Destructive Tree Pathogen Phytophthora ramorum Originates from the Laurosilva Forests of East Asia. J. Fungi 2021, 7, 226. [Google Scholar] [CrossRef] [PubMed]
- Huson, D.H. SplitsTree: Analyzing and Visualizing Evolutionary Data. Bioinformatics 1998, 14, 68–73. [Google Scholar] [CrossRef] [PubMed]
- Huson, D.H.; Bryant, D. Application of Phylogenetic Networks in Evolutionary Studies. Mol. Biol. Evol. 2006, 23, 254–267. [Google Scholar] [CrossRef] [PubMed]
- Bandelt, H.J.; Forster, P.; Rohl, A. Median-Joining Networks for Inferring Intraspecific Phylogenies. Mol. Biol. Evol. 1999, 16, 37–48. [Google Scholar] [CrossRef] [PubMed]
- Bily, D.; Nikolaeva, E.V.; Olson, T.; Kang, S. Phytophthora spp. Associated with Appalachian Oak Forests and Waterways in Pennsylvania, with P. abietivora as a Pathogen of Five Native Woody Plant Species. Plant Dis. 2021. [Google Scholar] [CrossRef] [PubMed]
- Rahman, M.Z.; Uematsu, S.; Coffey, M.D.; Uzuhashi, S.; Suga, H.; Kageyama, K. Re-Evaluation of Japanese Phytophthora Isolates Based on Molecular Phylogenetic Analyses. Mycoscience 2014, 55, 314–327. [Google Scholar] [CrossRef]
- Brasier, C.M. The Biosecurity Threat to the UK and Global Environment from International Trade in Plants. Plant Pathol. 2008, 57, 792–808. [Google Scholar] [CrossRef]
- Man in ‘t Veld, W.A.; de Cock, A.W.A.M.; Summerbell, R.C. Natural Hybrids of Resident and Introduced Phytophthora Species Proliferating on Multiple New Hosts. Eur. J. Plant Pathol. 2007, 117, 25–33. [Google Scholar] [CrossRef]
- Bertier, L.; Leus, L.; D’hondt, L.; de Cock, A.W.A.M.; Höfte, M. Host Adaptation and Speciation through Hybridization and Polyploidy in Phytophthora. PLoS ONE 2013, 8, e85385. [Google Scholar] [CrossRef] [PubMed]
- Burgess, T.I. Molecular Characterization of Natural Hybrids Formed between Five Related Indigenous Clade 6 Phytophthora Species. PLoS ONE 2015, 10, e0134225. [Google Scholar] [CrossRef] [PubMed]
- Turland, N.; Wiersema, J.; Barrie, F.; Greuter, W.; Hawksworth, D.; Herendeen, P.; Knapp, S.; Kusber, W.-H.; Li, D.-Z.; Marhold, K.; et al. (Eds.) International Code of Nomenclature for Algae, Fungi, and Plants; Regnum Vegetabile; Koeltz Botanical Books: Shenzhen, China, 2018; Volume 159, ISBN 978-3-946583-16-5. [Google Scholar]
- Ganley, A.R.D.; Kobayashi, T. Highly Efficient Concerted Evolution in the Ribosomal DNA Repeats: Total RDNA Repeat Variation Revealed by Whole-Genome Shotgun Sequence Data. Genome Res. 2007, 17, 184–191. [Google Scholar] [CrossRef] [PubMed]
- Zhou, Y.; Duvaux, L.; Ren, G.; Zhang, L.; Savolainen, O.; Liu, J. Importance of Incomplete Lineage Sorting and Introgression in the Origin of Shared Genetic Variation between Two Closely Related Pines with Overlapping Distributions. Heredity 2017, 118, 211–220. [Google Scholar] [CrossRef] [PubMed]
- Charlesworth, B.; Bartolomé, C.; Noël, V. The Detection of Shared and Ancestral Polymorphisms. Genet. Res. 2005, 86, 149–157. [Google Scholar] [CrossRef] [PubMed]
- Hudson, R.R.; Coyne, J.A. Mathematical Consequences of the Genealogical Species Concept. Evolution 2002, 56, 1557–1565. [Google Scholar] [CrossRef] [PubMed]


| Project | Restoration Outplantings | Stream Monitoring | Chapparal and Stream Soil Baiting | Forest Soil Baiting | Direct Sampling of Seedling Roots | UCD Campus Baiting |
|---|---|---|---|---|---|---|
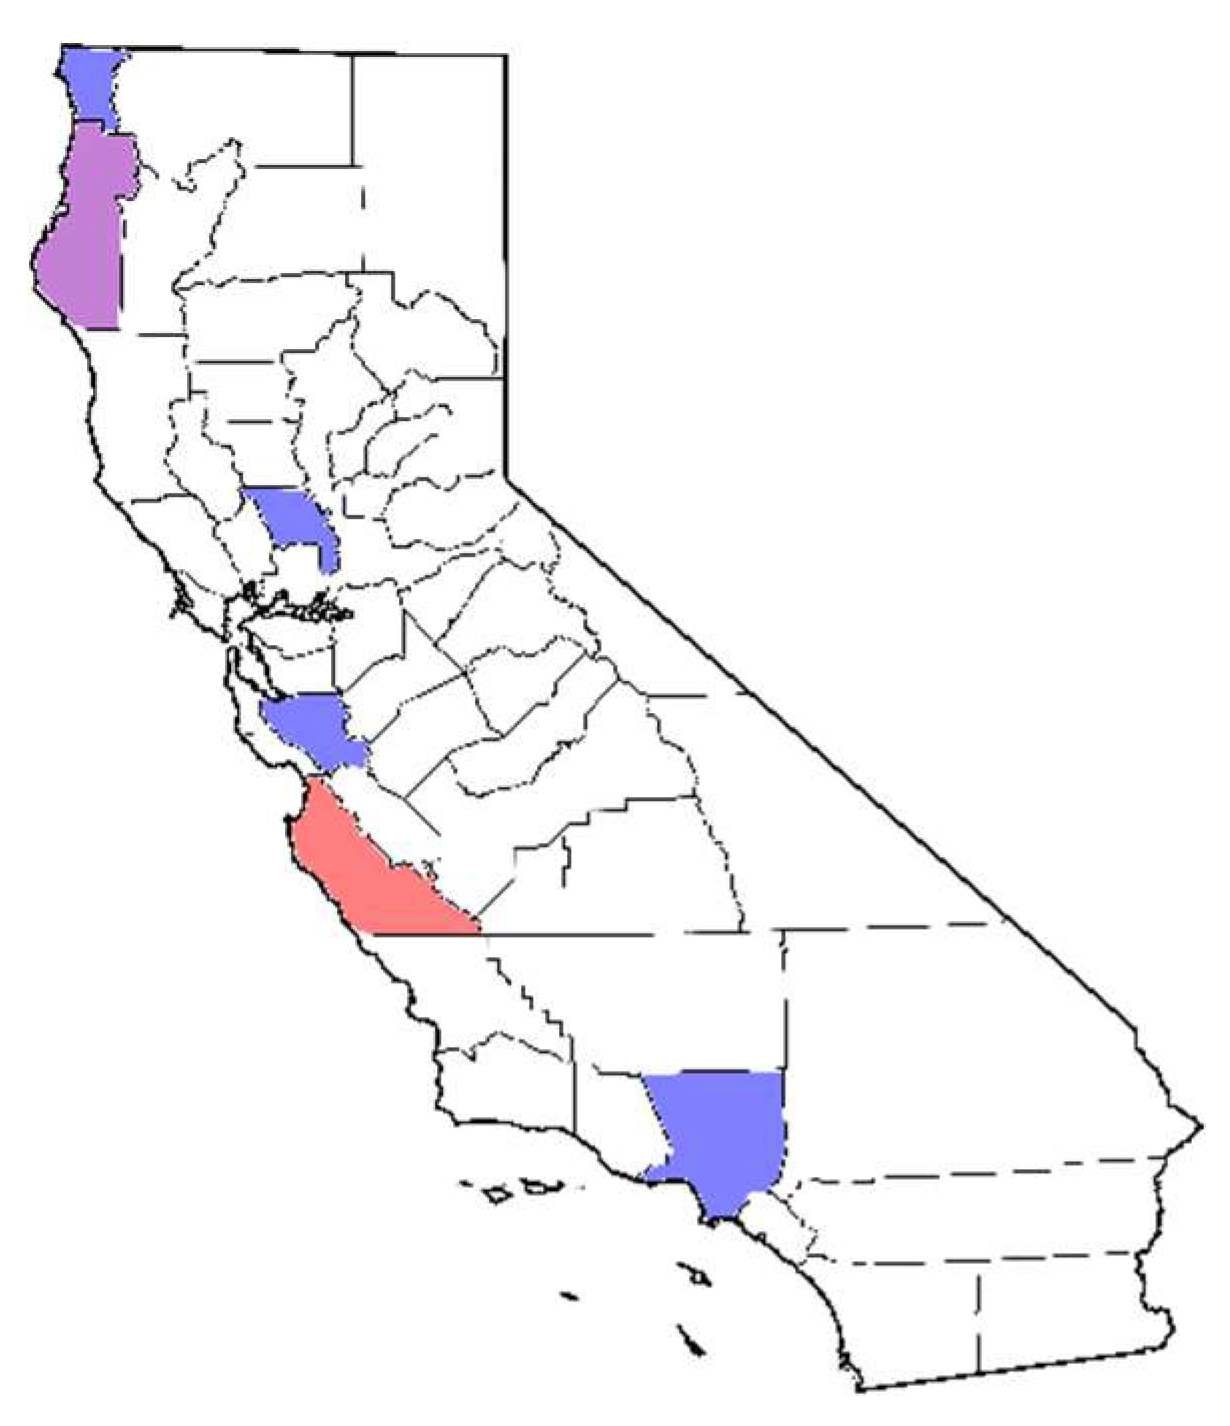
| Range within CA | Bay area (northern), Angeles National Forest (southern) | Central to northern | Angeles National Forest (southern) | Big Sur (central) | Big Sur (central) | Sacramento Valley (northern) |
| Substrate(s) | Rhizosphere soil and plant roots | Stream water | Rhizosphere soil | Bulk soil | Notholithocarpus densiflorus seedling root | Rhizosphere soil |
| Bait | Pear fruit and rhododendron leaf | Rhododendron leaf | Pear fruit and rhododendron leaf | Rhododendron leaf | N/A | Pear fruit and rhododendron leaf |
| Subclade 1a species isolated | P. cactorum, P. hedraiandra, P. ×serendipita | P. cactorum, P. pseudotsugae | P. cactorum | P. pseudotsugae | P. pseudotsugae | P. cactorum |
| Isolates used for this study (Counties) | 15 (Los Angeles, 7; Santa Clara, 8) | 9 (Del Norte, 7; Humboldt, 2) | 5 (Los Angeles) | 10 (Monterey) | 1 (Monterey) | 2 (Yolo) |
Publisher’s Note: MDPI stays neutral with regard to jurisdictional claims in published maps and institutional affiliations. |
© 2022 by the authors. Licensee MDPI, Basel, Switzerland. This article is an open access article distributed under the terms and conditions of the Creative Commons Attribution (CC BY) license (https://creativecommons.org/licenses/by/4.0/).
Share and Cite
Bourret, T.B.; Fajardo, S.N.; Engert, C.P.; Rizzo, D.M. A Barcode-Based Phylogenetic Characterization of Phytophthora cactorum Identifies Two Cosmopolitan Lineages with Distinct Host Affinities and the First Report of Phytophthora pseudotsugae in California. J. Fungi 2022, 8, 303. https://doi.org/10.3390/jof8030303
Bourret TB, Fajardo SN, Engert CP, Rizzo DM. A Barcode-Based Phylogenetic Characterization of Phytophthora cactorum Identifies Two Cosmopolitan Lineages with Distinct Host Affinities and the First Report of Phytophthora pseudotsugae in California. Journal of Fungi. 2022; 8(3):303. https://doi.org/10.3390/jof8030303
Chicago/Turabian StyleBourret, Tyler B., Sebastian N. Fajardo, Cole P. Engert, and David M. Rizzo. 2022. "A Barcode-Based Phylogenetic Characterization of Phytophthora cactorum Identifies Two Cosmopolitan Lineages with Distinct Host Affinities and the First Report of Phytophthora pseudotsugae in California" Journal of Fungi 8, no. 3: 303. https://doi.org/10.3390/jof8030303
APA StyleBourret, T. B., Fajardo, S. N., Engert, C. P., & Rizzo, D. M. (2022). A Barcode-Based Phylogenetic Characterization of Phytophthora cactorum Identifies Two Cosmopolitan Lineages with Distinct Host Affinities and the First Report of Phytophthora pseudotsugae in California. Journal of Fungi, 8(3), 303. https://doi.org/10.3390/jof8030303