
Distribution and Origin of Major, Trace and Rare Earth Elements in Wild Edible Mushrooms: Urban vs. Forest Areas


Abstract
:1. Introduction
2. Materials and Methods
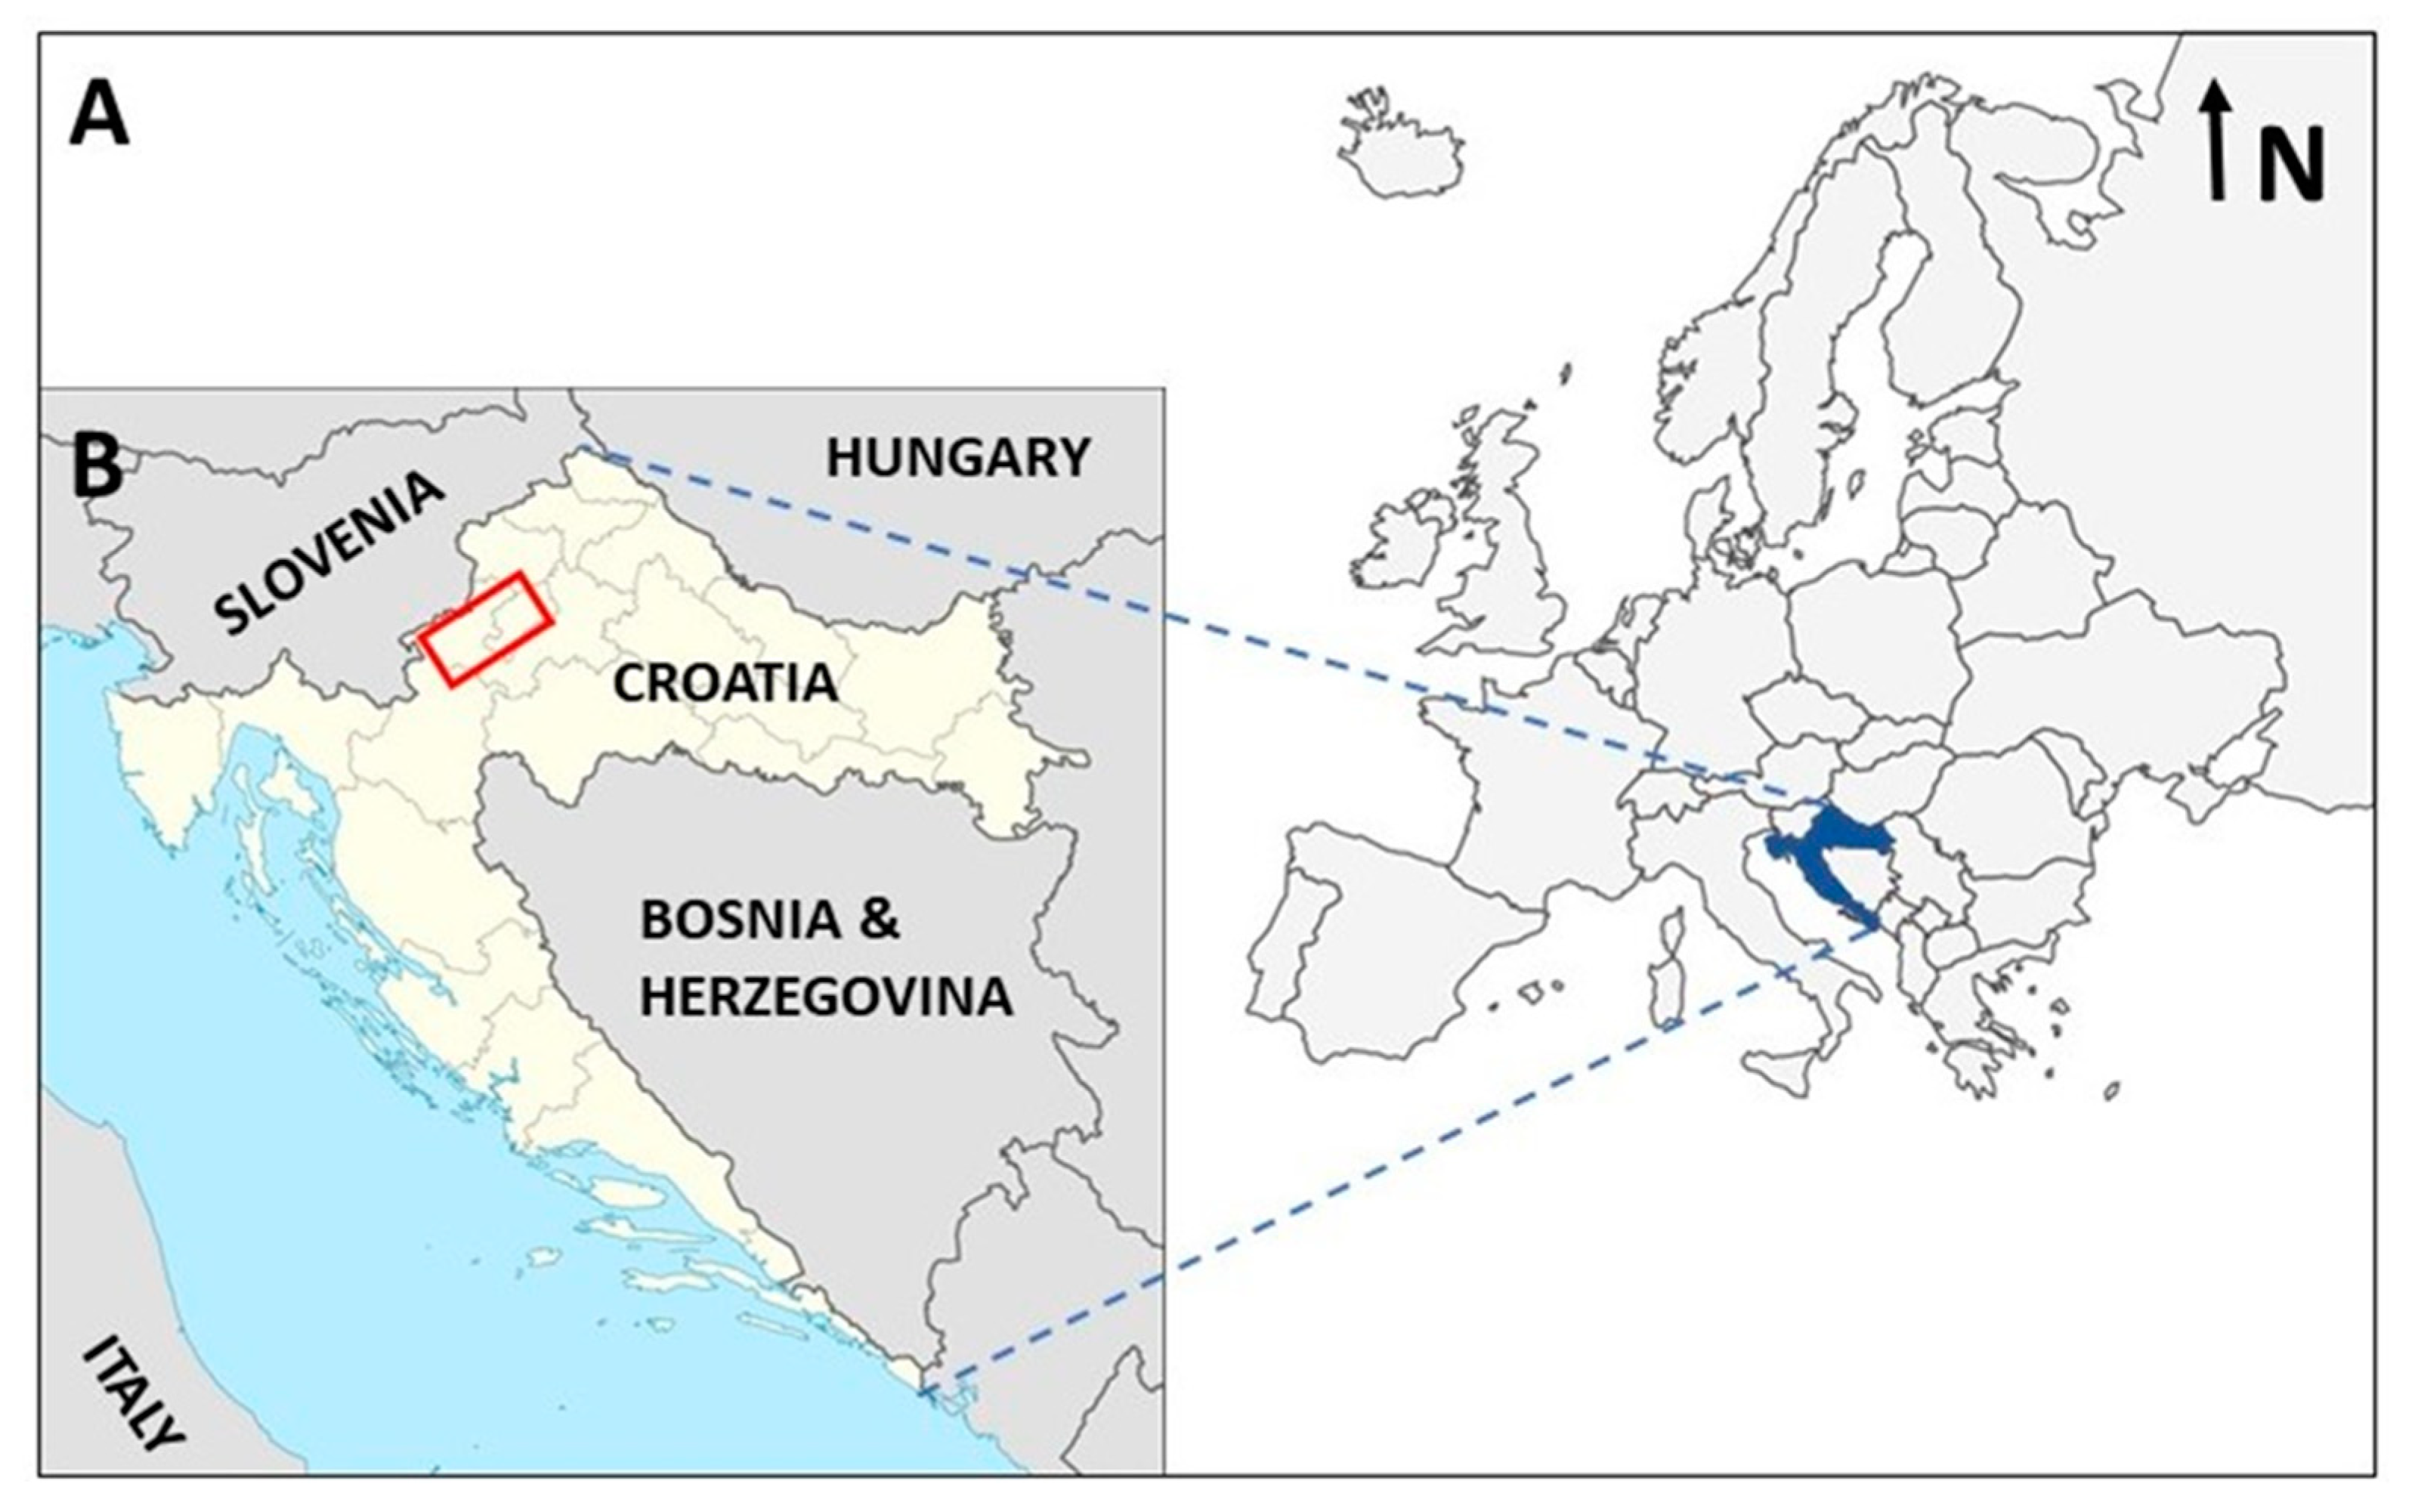
2.1. Study Area
2.2. Sample Collection and Preparation
2.3. Multi-Element Analysis
2.4. Quality Control
2.5. Health Risk Assessment
2.6. Statistical Analysis
3. Results
4. Discussion
4.1. Toxic Elements (Pb, Cd, As)
4.2. Macronutrients (Ca, Mg, K, Na)
4.3. Micronutrients (Cu, Fe, Mn, Mo, Se, Zn)
4.4. Lithogenic Group of Elements
4.5. Rare Earth Elements
4.6. Factors Influencing the Element Uptake
- (i)
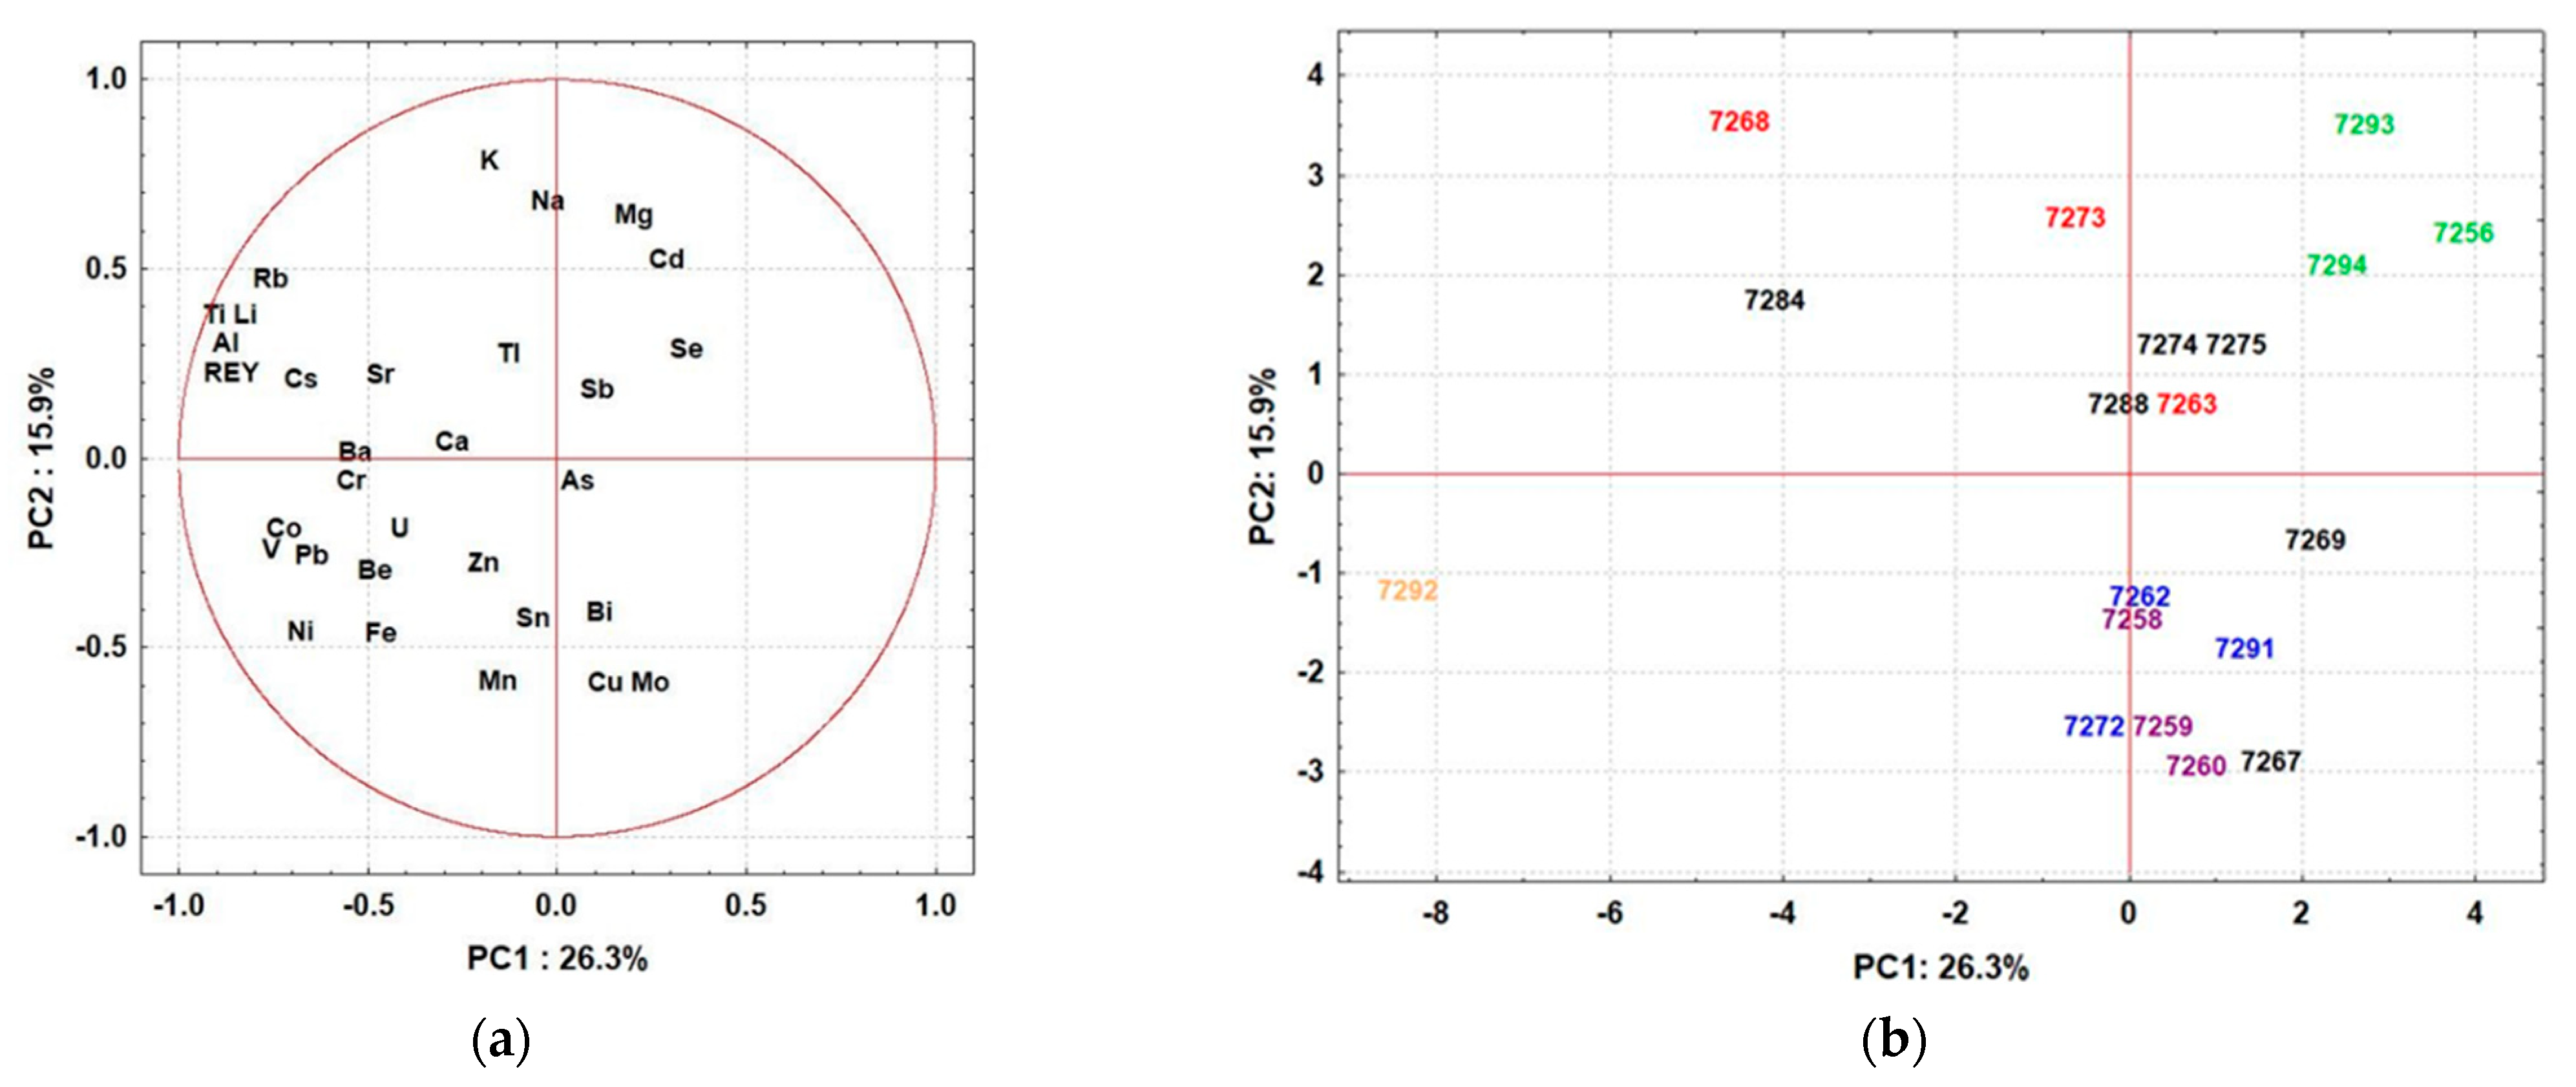
- Mushrooms belonging to the Psathyrellaceae family (1/7263, 1/7268, and 1/7273; colored red in Figure 2b) showed high variability in element distribution, suggesting that soil geochemistry/properties are the main factor determining the uptake of elements. However, P. piluliformis (1/7268 and 1/7273) collected from widely separated sites showed similarities in terms of high uptake of macronutrients (K, Na, Mg) and low uptake of Mo and Cu, indicating that the uptake of these elements is species-specific.
- (ii)
- L. leucothites (1/7293) and A. cylindracea (1/7294) sampled from the same site in the city of Zagreb, and P. dryinus (1/7256) (all colored green in Figure 2b) from another site within the urban area were characterized by high Cd concentrations; these mushrooms were collected near a road and, therefore, the elevated Cd levels could be explained by traffic pollution. However, elevated levels of other elements derived from traffic pollution, such as Pb, were not observed.
- (iii)
- Mushrooms from the Tricholomataceae family (1/7262, 1/7272, and 1/7291; colored blue) were grouped independently of sampling sites, suggesting that species-specific affinities in element uptake predominate. These mushrooms were described by slightly higher levels of Cu, Mn, and Mo and lower levels of Cd and macronutrients.
- (iv)
- Significant similarity in the content of elements was observed in different mushrooms sampled within the green area at the Jelenovac site: L. excipuliforme (1/7259), I. gibba (1/7258), L. perlatum (1/7260) (all colored purple in Figure 2b) and P. flaccida (1/7262) (colored blue in Figure 2b). This strongly suggests that geochemistry and soil properties are the main factors controlling elemental uptake, as these samples are characterized by higher levels of Cu, Mn, and Mo and lower levels of K, Mg, and Na.
- (v)
- PCA analysis confirmed the unique elemental composition of C. cornucopioides (1/7292; colored orange in Figure 2b), which is distinguished from all other samples by its significantly elevated values of Co, Ni, Pb, and REY.
4.7. Health Risk Assessment
5. Conclusions
Supplementary Materials
Author Contributions
Funding
Institutional Review Board Statement
Informed Consent Statement
Data Availability Statement
Acknowledgments
Conflicts of Interest
References
- Katz, A. Alternative Medicine for Prostate Cancer: Diet Vitamins Minerals and Supplements. In Early Diagnosis and Treatment of Cancer Series: Prostate Cancer; Su, L.-M., Ed.; Elsevier: Amsterdam, The Netherlands, 2010. [Google Scholar]
- Marchand, L.R.A.; Stewart, J. Breast Cancer. In Integrative Medicine; Rakel, D., Ed.; Lancet: London, UK, 2018. [Google Scholar]
- Kabata-Pendias, A. Trace Elements in Soils and Plants; CRC Press: Boca Raton, FL, USA, 2010. [Google Scholar]
- Falandysz, J.; Kawano, M.; Swieczkowski, A.; Brzostowski, A.; Dadej, M. Total mercury in wild-grown higher mushrooms and underlying soil from Wdzydze Landscape Park Northern Poland. Food Chem. 2003, 81, 21–26. [Google Scholar] [CrossRef]
- Kalač, P. A review of edible mushroom radioactivity. Food Chem. 2001, 75, 29–35. [Google Scholar] [CrossRef]
- Svoboda, L.; Zimmermannova, K.; Kalač, P. Concentrations of mercury cadmium lead and copper in fruiting bodies of edible mushrooms in an emission area of a copper smelter and a mercury smelter. Sci. Total Environ. 2000, 246, 61–67. [Google Scholar] [CrossRef]
- Falandysz, J.; Borovička, J. Macro and trace mineral constituents and radionuclides in mushrooms: Health benefits and risks. Appl. Microbiol. Biotechnol. 2012, 97, 477–501. [Google Scholar] [CrossRef] [Green Version]
- Das, N. Heavy metal biosorption by mushrooms. Nat. Prod. Radiance 2005, 4, 454–459. [Google Scholar]
- García, M.A.; Alonso, J.; Fernandez, M.I.; Melgar, M.J. Lead content in edible wild mushrooms in Northwest Spain as indicator of environmental contamination. Arch. Environ. Contam. Toxicol. 1998, 34, 330–335. [Google Scholar] [CrossRef]
- García, M.A.; Alonso, J.; Melgar, M.J. Lead in edible mushrooms; Levels and bioaccumulation factors. J. Hazard. Mater. 2009, 167, 777–783. [Google Scholar] [CrossRef] [PubMed]
- Kalač, P.; Svoboda, L. A review of trace element concentrations in edible mushrooms. Food Chem. 2000, 69, 273–281. [Google Scholar] [CrossRef]
- Ivanić, M.; Fiket, Ž.; Medunić, G.; Furdek Turk, M.; Marović, G.; Senčar, J.; Kniewald, G. Multi-element composition of soil mosses and mushrooms and assessment of natural and artificial radioactivity of a pristine temperate rainforest system (Slavonia, Croatia). Chemosphere 2019, 215, 668–677. [Google Scholar] [CrossRef]
- Mleczek, M.; Niedzielski, P.; Kalač, P.; Budka, A.; Siwulski, M.; Gąsecka, M.; Rzymski, P.; Magdziak, Z.; Sobieralski, K. Multielemental analysis of 20 mushroom species growing near a heavily trafficked road in Poland. Environ. Sci. Pollut. Res. 2016, 23, 16280–16295. [Google Scholar] [CrossRef] [PubMed] [Green Version]
- Sager, M. Urban Soils and Road Dust—Civilization Effects and Metal Pollution—A Review. Environments 2020, 7, 98. [Google Scholar] [CrossRef]
- Rodríguez-Seijo, A.; Arenas-Lago, D.; Andrade, M.L.; Vega, F.A. Identifying sources of Pb pollution in urban soils by means of MC-ICP-MS and TOF-SIMS. Environ. Sci. Pollut. Res. 2015, 22, 7859–7872. [Google Scholar] [CrossRef]
- Carvalho, M.L.; Pimentel, A.C.; Fernandes, B. Study of heavy metals in wild edible mushrooms under different pollution conditions by X-ray fluorescence spectrometry. Anal. Sci. 2005, 21, 747–750. [Google Scholar] [CrossRef]
- Petkovšek, S.A.S.; Pokorny, B. Lead and cadmium in mushrooms from the vicinity of two large emission sources in Slovenia. Sci. Total Environ. 2013, 443, 944–954. [Google Scholar] [CrossRef] [PubMed]
- Kokkoris, V.; Massas, I.; Polemis, E.; Koutrotsios, G.; Zervakis, G.I. Accumulation of heavy metals by wild edible mushrooms with respect to soil substrates in the Athens metropolitan area (Greece). Sci. Total Environ. 2019, 685, 280–296. [Google Scholar] [CrossRef] [PubMed]
- Schlecht, M.T.; Säumel, I. Wild growing mushrooms for the Edible City? Cadmium and lead content in edible mushrooms harvested within the urban agglomeration of Berlin. Ger. Environ. Pollut. 2015, 204, 298–305. [Google Scholar] [CrossRef] [PubMed]
- Świsłowski, P.; Dołhańczuk-Śródka, A.; Rajfur, M. Bibliometric analysis of European publications between 2001 and 2016 on concentrations of selected elements in mushrooms. Environ. Sci. Pollut. Res. 2020, 27, 22235–22250. [Google Scholar] [CrossRef] [PubMed] [Green Version]
- Michelot, D.; Siobud, E.; Dore, J.C.; Viel, C.; Poirier, F. Update of metal content profiles in mushrooms – toxicological implications and tentative approach to the mechanisms of bioaccumulation. Toxicon 1998, 36, 1997–2012. [Google Scholar] [CrossRef]
- Svoboda, L.; Kalač, P.; Špička, J.; Janoušková, D. Leaching of cadmium lead and mercury from fresh and differently preserved edible mushroom Xerocomus badius during soaking and boiling. Food Chem. 2002, 79, 41–45. [Google Scholar] [CrossRef]
- Falandysz, J.; Szymczyk, K.; Ichihashi, H.; Bielawski, L.; Gucia, M.; Frankowska, A.; Yamasaki, S.I. ICP/MS and ICP/AES elemental analysis (38 elements) of edible wild mushrooms growing in Poland. Food Addit. Contam. 2001, 18, 503–513. [Google Scholar] [CrossRef]
- Malinowska, E.; Szefer, P.; Falandaysz, J. Metals bioaccumulation by bay bolete Xerocomus badius from selected sites in Poland. Food Chem. 2004, 84, 405–416. [Google Scholar] [CrossRef]
- Nowakowski, P.; Markiewicz-Żukowska, R.; Soroczyńska, J.; Puścion-Jakubik, A.; Mielcarek, K.; Borawska, M.H.; Socha, K. Evaluation of toxic element content and health risk assessment of edible wild mushrooms. J. Food Compos. Anal. 2021, 96, 103698. [Google Scholar] [CrossRef]
- Alonso, J.; García, M.; Pérez-López, M.; Melgar, M.J. The concentrations and bioconcentration factors of copper and zinc in edible mushrooms. Arch. Environ. Contam. Toxicol. 2003, 44, 180–188. [Google Scholar] [CrossRef] [PubMed]
- Mendil, D.; Uluözlü, Ö.D.; Tüzen, M.; Hasdemir, E.; Sarı, H. Trace metal levels in mushroom samples from Ordu Turkey. Food Chem. 2005, 91, 463–467. [Google Scholar] [CrossRef]
- Sesli, E.; Tuzen, M.; Soylak, M. Evaluation of trace metal contents of some wild edible mushrooms from Black sea region Turkey. J. Hazard. Mater. 2008, 160, 462–467. [Google Scholar] [CrossRef] [PubMed]
- Turkekul, I.; Elmastas, M.; Tüzen, M. Determination of iron copper manganese zinc lead and cadmium in mushroom samples from Tokat Turkey. Food Chem. 2004, 84, 389–392. [Google Scholar] [CrossRef]
- Yamaç, M.; Yıldız, D.; Sarıkürkcü, C.; Çelikkollu, M.; Solak, M.H. Heavy metals in some edible mushrooms from the Central Anatolia Turkey. Food Chem. 2007, 103, 263–267. [Google Scholar] [CrossRef]
- Aruguete, D.M.; Aldstadt, J.H.; Mueller, G.M. Accumulation of several heavy metals and lanthanides in mushrooms (Agaricales) from the Chicago region. Sci. Total Environ. 1998, 224, 43–56. [Google Scholar] [CrossRef]
- Fu, Z.; Liu, G.; Wang, L. Assessment of potential human health risk of trace element in wild edible mushroom species collected from Yunnan Province China. Environ. Sci. Pollut. Res. Int. 2020, 27, 29218–29227. [Google Scholar] [CrossRef]
- Zhu, F.; Qu, L.; Fan, W.; Qiao, M.; Hao, H.; Wang, X. Assessment of heavy metals in some wild edible mushrooms collected from Yunnan Province China. Environ. Monit. Assess. 2011, 179, 191–199. [Google Scholar] [CrossRef]
- Stefanović, V.; Trifković, J.; Djurdjić, S.; Vukojević, V.; Tešić, Ž.; Mutić, J. Study of silver selenium and arsenic concentration in wild edible mushroom Macrolepiota procera health benefit and risk. Environ. Sci. Pollut. Res. 2016, 23, 22084–22098. [Google Scholar] [CrossRef] [PubMed]
- Stefanović, V.; Trifković, J.; Mutić, J.; Tešić, Ž. Metal accumulation capacity of parasol mushroom (Macrolepiota procera) from Rasina region (Serbia). Environ. Sci. Pollut. Res. 2016, 23, 13178–13190. [Google Scholar] [CrossRef] [PubMed]
- Alaimo, M.G.; Dongarrà, G.; La Rosa, A.; Tamburo, E.; Vasquez, G.; Varrica, D. Major and trace elements in Boletus aereus and Clitopilus prunulus growing on volcanic and sedimentary soils of Sicily (Italy). Ecotoxicol. Environ. Saf. 2018, 157, 182–190. [Google Scholar] [CrossRef] [PubMed]
- Alaimo, M.G.; Saitta, A.; Ambrosio, E. Bedrock and soil geochemistry influence the content of chemical elements in wild edible mushrooms (Morchella group) from South Italy (Sicily). Acta Mycol. 2019, 54, 1122. [Google Scholar] [CrossRef] [Green Version]
- Cocchi, L.; Vescovi, L.; Petrini, L.; Petrin, E. Heavy metals in edible mushrooms in Italy. Food Chem. 2006, 98, 277–284. [Google Scholar] [CrossRef]
- Giannaccini, G.; Betti, L.; Palego, L.; Mascia, G.; Schmid, L.; Lanza, M.; Mela, A.; Fabbrini, L.; Biondi, L.; Lucacchini, A. The trace element content of top-soil and wild edible mushroom samples collected in Tuscany Italy. Environ. Monit. Assess. 2012, 184, 7579–7595. [Google Scholar] [CrossRef]
- Širić, I.; Kos, I.; Kasap, A.; Petković, F.Z.; Držaić, V. Heavy metals bioaccumulation by edible saprophytic mushrooms. J. Cent. Eur. Agric. 2016, 17, 884–900. [Google Scholar]
- Širić, I.; Humar, M.; Kasap, A.; Kos, I.; Mioč, B.; Pohleven, F. Heavy metal bioaccumulation by wild edible saprophytic and ectomycorrhizal mushrooms. Environ. Sci. Pollut. Res. 2016, 23, 18239–18252. [Google Scholar] [CrossRef]
- Širić, I.; Kasap, A.; Bedeković, D.; Falandysz, J. Lead, cadmium and mercury contents and bioaccumulation potential of wild edible saprophytic and ectomycorrhizal mushrooms Croatia. J. Environ. Sci. Health B. 2017, 52, 156–165. [Google Scholar] [CrossRef]
- Salminen, R.; Batista, M.J.; Bidovec, M.; Demetriades, A.; De Vivo, B.; De Vos, W.; Duris, M.; Gilucis, A.; Gregorauskiene, V.; Halamić, J.; et al. FOREGS Geochemical Atlas of Europe Part 1: Background Information Methodology and Maps. Geological Survey of Finland Espoo. 2005, p. 526. Available online: http://weppi.gtk.fi/publ/foregsatlas/ (accessed on 17 March 2021).
- Fiket, Ž.; Medunić, G.; Furdek Turk, M.; Ivanić, M.; Kniewald, G. Influence of soil characteristics on rare earth fingerprints in mosses and mushrooms: Example of a pristine temperate rainforest (Slavonia Croatia). Chemosphere 2017, 179, 92–100. [Google Scholar] [CrossRef]
- Mešić, A.; Šamec, D.; Jadan, M.; Bahun, V.; Tkalčec, Z. Integrated morphological with molecular identification and bioactive compounds of 23 Croatian wild mushrooms samples. Food Biosci. 2020, 37, 100720. [Google Scholar] [CrossRef]
- Filipović Marijić, V.; Raspor, B. Site-specific gastrointestinal metal variability in relation to the gut content and fish age of indigenous european chub from the Sava River. Water Air Soil Pollut. 2012, 223, 4769–4783. [Google Scholar] [CrossRef]
- Fiket, Ž.; Mikac, N.; Kniewald, G. Mass fractions of forty-six major and trace elements including rare earth elements in sediment and soil reference materials used in environmental studies. Geostand. Geoanal. Res. 2017, 41, 123–135. [Google Scholar] [CrossRef]
- Dowlati, M.; Sobhi, H.R.; Esrafili, A.; FarzadKia, M.; Yeganeh, M. Heavy metals content in edible mushrooms: A systematic review, meta-analysis and health risk assessment. Trends Food. Sci. Technol. 2021, 109, 527–535. [Google Scholar] [CrossRef]
- USEPA. Reference Dose (RfD): Description and Use in Health Risk Assessment; USEPA: Washington, DC, USA, 1993. [Google Scholar]
- Cvetković, J.S.; Mitić, V.D.; Stankov-Jovanović, V.P.; Dimitrijević, M.V.; Nikolić-Mandić, S.D. Elemental composition of wild edible mushrooms from Serbia. Anal. Lett. 2015, 48, 2107–2121. [Google Scholar] [CrossRef]
- Dimitrijević, M.V.; Mitić, V.D.; Cvetković, J.S.; Jovanović, V.P.S.; Mutić, J.J.; Mandić, S.D.N. Update on element content profiles in eleven wild edible mushrooms from family Boletaceae. Eur. Food Res. Technol. 2016, 242, 1–10. [Google Scholar] [CrossRef]
- Kalač, P. Trace element contents in European species of wild growing edible mushrooms: A review for the period 2000–2009. Food Chem. 2010, 122, 2–15. [Google Scholar] [CrossRef]
- Niedzielski, P.; Mleczek, M.; Budka, A.; Rzymski, P.; Siwulski, M.; Jasińska, A.; Gąsecka, M.; Budzyńska, S. A screening study of elemental composition in 12 marketable mushroom species accessible in Poland. Eur. Food Res. Technol. 2017, 243, 1759–1771. [Google Scholar] [CrossRef] [Green Version]
- Sarikurkcu, C.; Popović-Djordjević, J.; Solak, M.H. Wild edible mushrooms from Mediterranean region: Metal concentrations and health risk assessment. Ecotoxicol. Environ. Saf. 2020, 190, 110058. [Google Scholar] [CrossRef] [PubMed]
- Sevindik, M.; Rasul, A.; Hussain, G.; Anwar, H.; Zahoor, M.K.; Sarfraz, I.; Kamran, K.S.; Akgul, H.; Akata, I.; Selamoglu, Z. Determination of anti-oxidative anti-microbial activity and heavy metal contents of Leucoagaricus leucothites. Pak. J. Pharm. Sci. 2018, 31, 2163–2168. [Google Scholar]
- Jorhem, L.; Sundström, B. Levels of some trace elements in edible fungi. Z. Lebensm. Unters. Forsch. 1995, 201, 311–316. [Google Scholar] [CrossRef] [PubMed]
- Brzezicha-Cirocka, J.; Mędyk, M.; Falandysz, J.; Szefer, P. Bio-and toxic elements in edible wild mushrooms from two regions of potentially different environmental conditions in eastern Poland. Environ. Sci. Pollut. Res. 2016, 23, 21517–21522. [Google Scholar] [CrossRef] [PubMed] [Green Version]
- Melgar, M.J.; Alonso, J.; García, M.A. Cadmium in edible mushrooms from NW Spain: Bioconcentration factors and consumer health implications. Food Chem. Toxicol. 2016, 88, 13–20. [Google Scholar] [CrossRef]
- Sardans, J.; Peñuelas, J. Trace element accumulation in the moss Hypnum cupressiforme Hedw.; and the trees Quercus ilex L.; and Pinus halepensis Mill.; in Catalonia. Chemosphere 2005, 60, 1293–1307. [Google Scholar] [CrossRef]
- Vetter, J. Arsenic content of some edible mushroom species. Eur. Food Res. Technol. 2004, 219, 71–74. [Google Scholar] [CrossRef]
- Falandysz, J.; Rizal, L.M. Arsenic and its compounds in mushrooms: A review. J. Environ. Sci. Health C 2016, 34, 217–232. [Google Scholar] [CrossRef]
- Commission Regulation (EC). No 629/2008 of 2 July 2008 Amending Regulation. (EC) No 1881/2006 Setting Maximum Levels for Certain Contaminants in Foodstuffs. 2008; L 173/6–173/9. [Google Scholar]
- Commission Regulation (EC). No 2015/1005 of 25 June 2015 Amending Regulation. (EC) No 1881/2006 as Regards Maximum Levels of Lead in Certain Foodstuffs. 2015; L 161/9–161/13. [Google Scholar]
- Official Gazette. Regulations on Maximum Levels of Certain Contaminants in Foodstuffs; National Journal Zagreb Croatia 2008, 154/08. Available online: https://narodne-novine.nn.hr/clanci/sluzbeni/2008_12_154_4198.html (accessed on 9 December 2021).
- Brzezicha-Cirocka, J.; Grembecka, M.; Grochowska, I.; Falandysz, J.; Szefer, P. Elemental composition of selected species of mushrooms based on a chemometric evaluation. Ecotoxicol. Environ. Saf. 2019, 173, 353–365. [Google Scholar] [CrossRef]
- Romić, M.; Romić, D. Heavy metals distribution in agricultural topsoils in urban area. Environ. Geol. 2003, 43, 795–805. [Google Scholar] [CrossRef]
- Borovička, J.; Řanda, Z. Distribution of iron cobalt zinc and selenium in macrofungi. Mycol. Prog. 2007, 6, 249. [Google Scholar] [CrossRef]
- Demirbaş, A. Concentrations of 21 metals in 18 species of mushrooms growing in the East Black Sea region. Food Chem. 2001, 75, 453–457. [Google Scholar] [CrossRef]
- Vetter, J. Lithium content of some common edible wild-growing mushrooms. Food Chem. 2005, 90, 31–37. [Google Scholar] [CrossRef]
- Zocher, A.L.; Kraemer, D.; Merschel, G.; Bau, M. Distribution of major and trace elements in the bolete mushroom Suillus luteus and the bioavailability of rare earth elements. Chem. Geol. 2018, 483, 491–500. [Google Scholar] [CrossRef]
- Borovička, J.; Kubrová, J.; Rohovec, J.; Řanda, Z.; Dunn, C.E. Uranium thorium and rare earth elements in macrofungi: What are the genuine concentrations? Biometals 2011, 24, 837–845. [Google Scholar] [CrossRef] [PubMed]
- Mleczek, M.; Niedzielski, P.; Kalač, P.; Siwulski, M.; Rzymski, P.; Gąsecka, M. Levels of platinum group elements and rare-earth elements in wild mushroom species growing in Poland. Food Addit. Contam. 2015, 33, 86–94. [Google Scholar] [CrossRef] [PubMed]
- Falandysz, J.; Chudzińska, M.; Barałkiewicz, D.; Drewnowska, M.; Hanć, A. Toxic elements and bio-metals in Cantharellus mushrooms from Poland and China. Environ. Sci. Pollut. Res. Int. 2017, 24, 11472–11482. [Google Scholar] [CrossRef] [Green Version]
- Nikkarinen, M.; Mertanen, E. Impact of geological origin on trace element composition of edible mushrooms. J. Food Compos. Anal. 2004, 17, 301–310. [Google Scholar] [CrossRef]


| Taxon/Family | Locality | Habitat | Substrate | |
|---|---|---|---|---|
| Urban area, Zagreb | ||||
| 1/7256 b | Pleurotus dryinus Pleurotaceae | Črnomerec | forest of Populus nigra, Acer campestre, Sambucus nigra | wood |
| 1/7258 a | Infundibulicybe gibba Tricholomataceae | Jelenovac | forest of Quercus robur, Carpinus betulus, Fagus sylvatica | soil |
| 1/7259 a | Lycoperdon excipuliforme Agaricaceae | Jelenovac | forest of Quercus robur, Carpinus betulus, Fagus sylvatica | soil |
| 1/7260 a | Lycoperdon perlatum Agaricaceae | Jelenovac | forest of Quercus robur, Carpinus betulus, Fagus sylvatica | soil |
| 1/7262 a | Paralepista flaccida Tricholomataceae | Jelenovac | forest of Quercus robur, Carpinus betulus, Fagus sylvatica | soil |
| 1/7263 a | Psathyrella multipedata Psathyrellaceae | Jelenovac | forest of Quercus robur, Carpinus betulus, Fagus sylvatica | soil |
| 1/7267 a | Lycoperdon perlatum Agaricaceae | Maksimir Park | forest of Quercus robur, Q. petraea, Carpinus betulus | soil |
| 1/7268 a | Psathyrella piluliformis Psathyrellaceae | Maksimir Park | forest of Quercus robur, Q. petraea, Carpinus betulus | wood |
| 1/7269 a | Macrolepiota procera Agaricaceae | Maksimir Park | forest of Quercus robur, Q. petraea, Carpinus betulus | soil |
| 1/7272 a | Infundibulicybe gibba Tricholomataceae | Dotršćina Park | forest of Quercus petraea, Carpinus betulus, Fagus sylvatica | soil |
| 1/7273 a | Psathyrella piluliformis Psathyrellaceae | Dotršćina Park | forest of Quercus sp., Carpinus betulus | wood |
| 1/7274 a | Coprinus comatus Agaricaceae | Dotršćina Park | forest of Quercus sp., Carpinus betulus | soil |
| 1/7275 a | Hymenopellis radicata Physalacriaceae | Dotršćina Park | forest of Quercus sp., Carpinus betulus | wood |
| 1/7293 a | Leucoagaricus leucothites Agaricaceae | Ruđer Bošković Institute | grassland | soil |
| 1/7294 b | Agrocybe cylindracea Strophariaceae | Ruđer Bošković Institute | grassland, on old living tree of Populus nigra | wood |
| Forest area, Karlovac County | ||||
| 1/7284 c | Lactarius deterrimus Russulaceae | Dvorišće Ozaljsko | grassland, near planted Picea abies | soil |
| 1/7288 c | Lactarius deterrimus Russulaceae | Vukova Gorica | grassland, near planted Picea abies | soil |
| 1/7291 a | Lepista nuda Tricholomataceae | Vukova Gorica | forest of Quercus robur, Corylus avellana | soil |
| 1/7292 c | Craterellus cornucopioides Cantharellaceae | Novaki Ozaljski | forest of Fagus sylvatica | soil |
| Al | As | Ba | Be | Bi | Ca | Cd | Co | Cr | Cs | Cu | |
| LOD | 2 | 0.003 | 0.05 | 0.001 | 0.001 | 15 | 0.002 | 0.002 | 0.03 | 0.002 | 0.03 |
| LOQ | 6 | 0.01 | 0.15 | 0.003 | 0.003 | 45 | 0.006 | 0.006 | 0.1 | 0.006 | 0.1 |
| 1/7256 | 7.83 | 0.019 | 0.096 | <DL | <DL | 26 | 0.681 | 0.006 | 0.313 | 0.016 | 2.19 |
| 1/7258 | 30.9 | 0.318 | 1.599 | <DL | 0.001 | 171 | 0.379 | 0.026 | 0.265 | 0.124 | 46.6 |
| 1/7259 | 19.4 | 0.394 | 0.518 | <DL | 0.004 | 187 | 0.356 | 0.125 | 0.419 | 0.002 | 38.6 |
| 1/7260 | 17.0 | 0.542 | 0.484 | <DL | 0.003 | 164 | 0.313 | 0.171 | 0.378 | 0.003 | 84.3 |
| 1/7262 | 33.2 | 0.482 | 1.367 | <DL | 0.001 | 273 | 0.144 | 0.031 | 0.246 | 0.015 | 28.8 |
| 1/7263 | 23.5 | 3.684 | 1.126 | 0.001 | 0.003 | 374 | 0.365 | 0.100 | 0.221 | 0.124 | 78.0 |
| 1/7267 | 24.4 | 0.549 | 0.528 | <DL | 0.010 | 146 | 0.271 | 0.092 | 0.198 | 0.017 | 67.2 |
| 1/7268 | 99.3 | 0.087 | 1.725 | 0.001 | 0.002 | 216 | 0.396 | 0.084 | 0.305 | 0.333 | 11.3 |
| 1/7269 | 12.6 | 0.219 | 0.307 | <DL | 0.002 | 188 | 0.384 | 0.033 | 0.279 | 0.008 | 56.6 |
| 1/7272 | 27.6 | 0.661 | 0.979 | 0.002 | 0.001 | 262 | 0.216 | 0.018 | 0.306 | 0.037 | 52.4 |
| 1/7273 | 43.9 | 0.151 | 0.591 | 0.001 | 0.001 | 231 | 0.490 | 0.139 | 0.343 | 0.604 | 20.0 |
| 1/7274 | 22.9 | 0.489 | 0.580 | <DL | 0.001 | 545 | 0.486 | 0.058 | 0.608 | 0.006 | 42.3 |
| 1/7275 | 40.7 | 0.008 | 0.810 | <DL | <DL | 223 | 0.116 | 0.021 | 0.159 | 0.035 | 9.44 |
| 1/7284 | 91.0 | 0.639 | 1.453 | <DL | <DL | 276 | 0.593 | 0.069 | 0.268 | 0.167 | 16.5 |
| 1/7288 | 34.4 | 0.260 | 0.554 | <DL | 0.002 | 257 | 0.550 | 0.048 | 0.337 | 0.581 | 8.85 |
| 1/7291 | 26.1 | 0.593 | 0.512 | <DL | 0.001 | 255 | 0.177 | 0.125 | 0.223 | 0.043 | 41.0 |
| 1/7292 | 77.2 | 0.012 | 0.793 | 0.002 | 0.001 | 256 | 0.549 | 0.701 | 0.761 | 1.956 | 32.9 |
| 1/7293 | 13.0 | 0.310 | 0.294 | <DL | <DL | 144 | 4.547 | 0.043 | 0.278 | 0.482 | 26.2 |
| 1/7294 | 16.0 | <DL | 0.227 | <DL | <DL | 128 | 3.956 | 0.011 | 0.230 | 0.419 | 44.8 |
| avg | 34.8 | 0.52 | 0.77 | 0.001 | 0.002 | 227 | 0.79 | 0.10 | 0.32 | 0.26 | 37.3 |
| min | 7.83 | 0.01 | 0.10 | 0.001 | 0.001 | 25.6 | 0.12 | 0.01 | 0.16 | 0.002 | 2.19 |
| max | 99.3 | 3.68 | 1.73 | 0.002 | 0.010 | 545 | 4.55 | 0.70 | 0.76 | 1.96 | 84.3 |
| Fe | K | Li | Mg | Mn | Mo | Na | Ni | Pb | Rb | ||
| LOD | 3 | 15 | 0.002 | 6 | 0.25 | 0.005 | 3 | 0.03 | 0.03 | 0.03 | |
| LOQ | 10 | 45 | 0.006 | 18 | 0.75 | 0.015 | 10 | 0.1 | 0.1 | 0.1 | |
| 1/7256 | 11.0 | 42327 | 0.019 | 1706 | 5.58 | 0.018 | 77.2 | 0.325 | 0.072 | 14.7 | |
| 1/7258 | 95.7 | 25183 | 0.031 | 1086 | 21.5 | 0.557 | 60.4 | 0.559 | 0.135 | 10.3 | |
| 1/7259 | 52.5 | 17100 | 0.015 | 1194 | 13.6 | 0.332 | 70.3 | 0.611 | 1.11 | 5.48 | |
| 1/7260 | 103 | 22924 | 0.012 | 1597 | 27.7 | 0.355 | 36.1 | 0.742 | 0.509 | 2.59 | |
| 1/7262 | 49.4 | 41252 | 0.026 | 1395 | 31.4 | 0.812 | 53.5 | 0.363 | 0.228 | 2.69 | |
| 1/7263 | 49.0 | 65291 | 0.025 | 2014 | 11.6 | 0.488 | 829 | 0.547 | 0.352 | 24.6 | |
| 1/7267 | 79.7 | 17410 | 0.013 | 1520 | 38.2 | 0.375 | 41.6 | 0.472 | 0.868 | 26.5 | |
| 1/7268 | 87.9 | 66745 | 0.078 | 2067 | 22.9 | 0.015 | 932 | 0.327 | 0.261 | 289 | |
| 1/7269 | 60.6 | 33029 | 0.017 | 1300 | 11.5 | 0.409 | 49.5 | 0.358 | 0.437 | 10.1 | |
| 1/7272 | 76.1 | 27369 | 0.016 | 959 | 36.4 | 0.606 | 47.9 | 0.663 | 0.128 | 40.1 | |
| 1/7273 | 67.4 | 80836 | 0.037 | 2093 | 25.6 | 0.016 | 653 | 0.247 | 0.406 | 185 | |
| 1/7274 | 57.0 | 49527 | 0.013 | 1639 | 14.5 | 0.164 | 835 | 0.181 | 0.161 | 27.9 | |
| 1/7275 | 32.9 | 38559 | 0.027 | 1060 | 21.3 | 0.045 | 410 | 0.187 | 0.122 | 27.3 | |
| 1/7284 | 62.7 | 34991 | 0.079 | 1248 | 8.13 | 0.007 | 60.6 | 0.508 | 0.180 | 144 | |
| 1/7288 | 29.7 | 25886 | 0.021 | 1153 | 4.93 | 0.010 | 35.9 | 0.505 | 0.187 | 191 | |
| 1/7291 | 48.0 | 31622 | 0.010 | 1031 | 37.6 | 1.145 | 72.5 | 0.432 | 0.535 | 37.6 | |
| 1/7292 | 77.3 | 46135 | 0.074 | 939 | 25.1 | 0.103 | 74.1 | 1.595 | 4.019 | 299 | |
| 1/7293 | 23.9 | 60912 | 0.025 | 1876 | 7.26 | 0.235 | 1011 | 0.162 | 0.299 | 46.8 | |
| 1/7294 | 22.1 | 43277 | 0.012 | 1694 | 5.87 | 0.050 | 25.2 | 0.259 | 0.234 | 133 | |
| avg | 57.1 | 40546 | 0.029 | 1451 | 19.5 | 0.302 | 283 | 0.476 | 0.539 | 79.8 | |
| min | 11.0 | 17100 | 0.010 | 939 | 4.93 | 0.007 | 25.2 | 0.162 | 0.072 | 2.59 | |
| max | 103 | 80836 | 0.079 | 2093 | 38.2 | 1.145 | 1011 | 1.595 | 4.019 | 299 | |
| Sb | Sc | Se | Sn | Sr | Ti | Tl | U | V | Zn | ||
| LOD | 0.002 | 0.002 | 0.02 | 0.003 | 0.5 | 0.5 | 0.001 | 0.001 | 0.002 | 1.5 | |
| LOQ | 0.006 | 0.006 | 0.06 | 0.01 | 1.5 | 1.5 | 0.003 | 0.003 | 0.006 | 4.5 | |
| 1/7256 | 0.002 | <DL | <DL | 0.095 | 0.052 | 0.52 | <DL | <DL | 0.011 | 17.3 | |
| 1/7258 | 0.015 | <DL | 0.144 | 0.094 | 0.386 | 2.89 | 0.001 | <DL | 0.153 | 74.2 | |
| 1/7259 | 0.006 | 0.099 | 0.725 | 0.195 | 0.394 | 1.15 | <DL | 0.010 | 0.094 | 143 | |
| 1/7260 | 0.006 | 0.047 | 0.788 | 0.140 | 0.391 | 0.65 | 0.001 | 0.005 | 0.081 | 109 | |
| 1/7262 | 0.013 | 0.031 | 0.842 | 0.156 | 0.734 | 2.16 | 0.005 | 0.004 | 0.131 | 100 | |
| 1/7263 | 0.068 | <DL | 1.593 | 0.118 | 1.198 | 2.29 | 0.003 | 0.004 | 0.083 | 97.6 | |
| 1/7267 | 0.004 | <DL | 0.679 | 0.086 | 0.282 | 1.20 | <DL | <DL | 0.068 | 127 | |
| 1/7268 | 0.012 | 0.012 | <DL | 0.085 | 0.966 | 9.70 | 0.006 | 0.002 | 0.174 | 89.4 | |
| 1/7269 | 0.005 | 0.026 | 0.387 | 0.107 | 0.309 | 1.91 | 0.003 | <DL | 0.052 | 72.8 | |
| 1/7272 | 0.007 | 0.011 | 0.254 | 0.116 | 0.609 | 1.69 | 0.001 | 0.001 | 0.111 | 66.9 | |
| 1/7273 | 0.003 | 0.012 | <DL | 0.117 | 0.497 | 3.51 | 0.011 | 0.001 | 0.083 | 69.8 | |
| 1/7274 | 0.011 | 0.004 | 0.386 | 0.083 | 0.756 | 1.57 | 0.003 | 0.003 | 0.054 | 58.3 | |
| 1/7275 | 0.004 | <DL | <DL | 0.102 | 0.428 | 3.58 | 0.001 | <DL | 0.067 | 45.8 | |
| 1/7284 | 0.002 | 0.024 | 0.414 | 0.068 | 0.734 | 8.65 | 0.052 | 0.008 | 0.138 | 133 | |
| 1/7288 | 0.003 | 0.013 | 0.318 | 0.122 | 0.479 | 2.73 | 0.129 | 0.003 | 0.038 | 103 | |
| 1/7291 | 0.004 | <DL | 0.205 | 0.057 | 0.318 | 1.18 | 0.004 | <DL | 0.136 | 58.3 | |
| 1/7292 | 0.004 | 0.094 | <DL | 0.114 | 0.543 | 7.76 | 0.002 | 0.005 | 0.150 | 64.2 | |
| 1/7293 | 0.035 | <DL | 1.49 | 0.066 | 0.277 | 0.93 | 0.007 | 0.001 | 0.018 | 75.3 | |
| 1/7294 | 0.003 | <DL | <DL | 0.069 | 0.488 | 1.51 | 0.007 | 0.001 | 0.025 | 91.5 | |
| avg | 0.011 | 0.034 | 0.633 | 0.105 | 0.518 | 2.93 | 0.012 | 0.003 | 0.088 | 84.1 | |
| min | 0.002 | 0.004 | 0.144 | 0.057 | 0.052 | 0.52 | 0.001 | 0.001 | 0.011 | 17.3 | |
| max | 0.068 | 0.099 | 1.593 | 0.195 | 1.198 | 9.70 | 0.129 | 0.010 | 0.174 | 143 |
| La | Ce | Pr | Nd | Sm | Eu | Gd | Tb | Dy | Ho | Er | Tm | Yb | Lu | Y | ∑REY | |
|---|---|---|---|---|---|---|---|---|---|---|---|---|---|---|---|---|
| LOD | 0.001 | 0.001 | 0.001 | 0.001 | 0.001 | 0.001 | 0.001 | 0.001 | 0.001 | 0.001 | 0.001 | 0.001 | 0.001 | 0.001 | 0.001 | |
| LOQ | 0.003 | 0.003 | 0.003 | 0.003 | 0.003 | 0.003 | 0.003 | 0.003 | 0.003 | 0.003 | 0.003 | 0.003 | 0.003 | 0.003 | 0.003 | |
| 1/7256 | 0.003 | 0.006 | 0.001 | 0.002 | 0.001 | <DL | <DL | <DL | 0.009 | <DL | <DL | <DL | 0.007 | <DL | 0.002 | 0.031 |
| 1/7258 | 0.012 | 0.028 | 0.003 | 0.012 | 0.003 | 0.001 | <DL | <DL | 0.011 | 0.001 | 0.001 | <DL | 0.008 | <DL | 0.012 | 0.092 |
| 1/7259 | 0.005 | 0.009 | 0.001 | 0.004 | 0.001 | 0.000 | <DL | <DL | 0.010 | <DL | 0.001 | <DL | 0.008 | <DL | 0.004 | 0.043 |
| 1/7260 | 0.006 | 0.010 | 0.001 | 0.005 | 0.001 | 0.001 | <DL | <DL | 0.011 | <DL | 0.001 | <DL | 0.008 | <DL | 0.007 | 0.051 |
| 1/7262 | 0.016 | 0.031 | 0.004 | 0.016 | 0.003 | 0.001 | <DL | <DL | 0.011 | 0.001 | 0.001 | <DL | 0.009 | <DL | 0.013 | 0.094 |
| 1/7263 | 0.021 | 0.039 | 0.006 | 0.022 | 0.006 | 0.001 | 0.002 | 0.001 | 0.013 | 0.001 | 0.002 | <DL | 0.008 | <DL | 0.024 | 0.146 |
| 1/7267 | 0.009 | 0.017 | 0.002 | 0.007 | 0.001 | 0.001 | <DL | <DL | 0.011 | <DL | <DL | <DL | 0.008 | <DL | 0.004 | 0.060 |
| 1/7268 | 0.053 | 0.115 | 0.013 | 0.057 | 0.010 | 0.002 | <DL | 0.001 | 0.016 | 0.002 | 0.003 | 0.001 | 0.010 | 0.001 | 0.032 | 0.316 |
| 1/7269 | 0.005 | 0.012 | 0.001 | 0.003 | 0.001 | <DL | <DL | <DL | 0.010 | <DL | <DL | <DL | 0.007 | <DL | 0.006 | 0.045 |
| 1/7272 | 0.015 | 0.026 | 0.003 | 0.012 | 0.002 | 0.001 | <DL | <DL | 0.011 | <DL | 0.001 | <DL | 0.008 | <DL | 0.009 | 0.088 |
| 1/7273 | 0.019 | 0.035 | 0.004 | 0.014 | 0.003 | 0.001 | <DL | <DL | 0.011 | 0.001 | 0.001 | <DL | 0.008 | <DL | 0.012 | 0.109 |
| 1/7274 | 0.010 | 0.019 | 0.003 | 0.010 | 0.003 | 0.001 | <DL | <DL | 0.010 | <DL | 0.001 | <DL | 0.007 | <DL | 0.006 | 0.070 |
| 1/7275 | 0.024 | 0.051 | 0.006 | 0.026 | 0.005 | 0.001 | <DL | <DL | 0.011 | 0.000 | 0.001 | <DL | 0.008 | <DL | 0.011 | 0.144 |
| 1/7284 | 0.093 | 0.137 | 0.017 | 0.063 | 0.011 | 0.002 | <DL | 0.002 | 0.020 | 0.003 | 0.006 | 0.001 | 0.014 | 0.001 | 0.082 | 0.452 |
| 1/7288 | 0.028 | 0.031 | 0.004 | 0.014 | 0.003 | 0.001 | <DL | 0.001 | 0.013 | 0.001 | 0.003 | <DL | 0.007 | <DL | 0.040 | 0.146 |
| 1/7291 | 0.016 | 0.024 | 0.003 | 0.014 | 0.003 | 0.001 | <DL | <DL | 0.008 | <DL | 0.001 | <DL | 0.006 | <DL | 0.009 | 0.085 |
| 1/7292 | 0.050 | 0.080 | 0.008 | 0.034 | 0.007 | 0.001 | <DL | 0.001 | 0.013 | 0.001 | 0.004 | 0.001 | 0.009 | 0.001 | 0.029 | 0.239 |
| 1/7293 | 0.008 | 0.013 | 0.001 | 0.006 | 0.002 | <DL | <DL | <DL | 0.010 | <DL | <DL | <DL | 0.007 | <DL | 0.004 | 0.051 |
| 1/7294 | 0.010 | 0.019 | 0.002 | 0.008 | 0.002 | <DL | <DL | <DL | 0.010 | <DL | 0.001 | <DL | 0.007 | <DL | 0.005 | 0.064 |
| avg | 0.021 | 0.037 | 0.004 | 0.017 | 0.004 | 0.001 | 0.002 | 0.001 | 0.012 | 0.001 | 0.002 | 0.001 | 0.008 | 0.001 | 0.016 | 0.122 |
| min | 0.003 | 0.006 | 0.001 | 0.002 | 0.001 | <DL | <DL | <DL | 0.008 | <DL | <DL | <DL | 0.006 | <DL | 0.002 | 0.031 |
| max | 0.093 | 0.137 | 0.017 | 0.063 | 0.011 | 0.002 | 0.002 | 0.002 | 0.02 | 0.003 | 0.006 | 0.001 | 0.014 | 0.001 | 0.082 | 0.452 |
| Croatia | Serbia | Italy | |||||
|---|---|---|---|---|---|---|---|
| Element | Edible (Caps and Stipes) [40,41,42] | Agaricus sp., Trichaptum biforme [12] | M. procera (Caps and Stipes) [34,35] | Edible [50] | Boletaceae (Edible) [51] | Different Fungal Species [38] | Morchella Group [37] |
| Al | 623–925 | 29–5664 | 54.2–396 | 27.7–608 | 0.05–0.33 | ||
| As | 0.19–3.64 | 0.01–3.40 | 0.03–1.66 | 0.10–11.6 | <DL–0.23 | ||
| Ba | 19.2–72.4 | 0.20–46 | 1.20–8.7 | 0.33–4.06 | |||
| Be | 0.02–0.41 | <DL | |||||
| Bi | 0.04–0.08 | 0.02–1.40 | <DL | ||||
| Cd | 0.60–3.23 | 0.02–0.18 | 0.04–43.5 | 0.27–2.93 | 0.68–2.94 | 0.16–101 | 0.18–21.5 |
| Co | 0.17–2.92 | <DL–12.0 | 0.07–0.72 | 0.06–0.28 | |||
| Cr | 0.77–3.85 | 1.32–13.19 | 0.20–13.8 | 3.25–10.8 | 0.16–1.34 | 0.26–2.18 | |
| Cs | 0.15–1.18 | 0.05–0.48 | |||||
| Cu | 7.41–78.2 | 6.67–32.4 | 29–304 | 12.2–73.6 | 4.66–34.3 | 10.1–63 | |
| Fe | 49.3–154 | 365–4905 | 30–4018 | 45.9–319 | 24.4–515 | 35–517 | |
| Li | 0.49–7.57 | 0.21–1.27 | 0.03–0.67 | ||||
| Mn | 18.9–248 | 7.6–367 | 9.0–35.5 | 2.91–23.8 | 7.5–46.3 | ||
| Mo | 0.16–0.43 | 1.14–2.3 | 0.2–0.45 | ||||
| Ni | 2.02–4.10 | 1.02–7.16 | 0.09–11.7 | 2.24–5.04 | 0.40–1.69 | 0.6–2.33 | |
| Pb | 0.48–1.91 | 1.29–5.73 | <DL–14.3 | 6.32–9.8 | 0.29–10.6 | 0.58–10.6 | <DL–1.09 |
| Rb | 2.28–12.6 | 23.74–500 | 2.55–36.6 | ||||
| Sb | 0.05–0.28 | 4.9–26.1 | 0.01–0.05 | ||||
| Sc | |||||||
| Se | 0.17–3.3 | 0.04–2.32 | 0.2–94.4 | <DL–0.49 | |||
| Sn | 0.14–0.61 | <DL | |||||
| Sr | 7.98–21.7 | 0.08–29.9 | 1.15–4.34 | 0.50–4.71 | 0.8–5.8 | ||
| Ti | 59.02–647 | 1.2–156 | 6.31–18.8 | ||||
| Tl | 0.01–0.17 | 0.002–0.13 | |||||
| You | 0.04–0.46 | 0.001–0.02 | |||||
| V | 1.34–15.7 | 0.06–1.26 | |||||
| Zn | 41.99–90.56 | 21.3–59.1 | 27.3–535 | 38.7–117 | 17.6–301.6 | 99.7–259 | |
| Ca * | 0.02–4.43 | 0.55–2.12 | 0.11–2.33 | 0.28–3.51 | |||
| K * | 11–120 | 11.3–41.8 | 10.1–21.2 | 25.6–> 43 | |||
| Mg * | 0.69–3.4 | 0.29–1.12 | 0.79–2.64 | ||||
| Na * | 11–1900 | 0.41–0.93 | 39.8–916 | 0.1–0.83 | |||
| Croatia | Poland | Czech Republic | Italy | |||
|---|---|---|---|---|---|---|
| Element | Agaricus sp. (Caps and Stipes) [44] | Agaricus sp., Trichaptum biforme [12] | M. procera (Caps and Stipes) [34,35] | Edible [48] | Boletaceae (Edible) [49] | Different Fungal Species [38] |
| La | 1.373 | 0.083 ± 0.049 | 0.06 | <0.01–0.08 | 0.023 | 0.015–0.488 |
| Ce | 4.137 | 0.18 ± 0.091 | 0.12 | 0.042 | 0.025–0.843 | |
| Pr | 0.526 | 0.017 ± 0.009 | 0.04 | 0.02–1.8 | 0.0056 | <DL–0.109 |
| Nd | 2.137 | 0.058 ± 0.003 | 0.17 | 0.11–0.45 | 0.020 | 0.011–0.446 |
| Sm | 0.467 | 0.012 ± 0.006 | 0.03 | 0.0041 | 0.0021–0.0822 | |
| Eu | 0.099 | 0.0027 ± 0.018 | <0.01 | 0.00068 | <DL–0.019 | |
| Gd | 0.305 | 0.011 ± 0.006 | 0.05 | <0.01–0.05 | 0.0023 | 0.002–0.081 |
| Tb | 0.057 | 0.0018 ± 0.0009 | 0.03 | 0.00059 | <DL–0.012 | |
| Dy | 0.285 | 0.010 ± 0.005 | <0.01 | 0.0022 | 0.001–0.0724 | |
| Ho | 0.062 | 0.0023 ± 0.0012 | 0.04 | <0.01–0.30 | 0.00042 | 0.0003–0.015 |
| Er | 0.163 | 0.0070 ± 0.0035 | 0.72 | 0.0013 | 0.0005–0.0429 | |
| Tm | 0.027 | 0.0011 ± 0.0006 | 0.03 | 0.00017 | 0.0001–0.006 | |
| Yb | 0.150 | 0.0073 ± 0.0037 | 0.02 | 0.0013 | <DL–0.041 | |
| Lu | 0.027 | 0.0011 ± 0.0005 | 0.02 | 0.00013 | <DL–0.0058 | |
| Y | 0.693 | 0.074 ± 0.039 | 0.04 | 0.009–0.549 | ||
| ∑REY | 9.797 | 0.481 | 0.23 | 0.104 | ||
| Target Hazard Quotient (THQ) | Hazard Index (HI) | |||||||||||||
|---|---|---|---|---|---|---|---|---|---|---|---|---|---|---|
| As | Ba | Be | Cd | Cu | Fe | Mn | Ni | Pb | Sb | Sr | U | Zn | ||
| 1/7256 | 0.026 | 0.000 | 0.000 | 0.280 | 0.023 | 0.006 | 0.016 | 0.007 | 0.008 | 0.002 | 0.000 | 0.000 | 0.024 | 0.392 |
| 1/7258 | 0.436 | 0.003 | 0.000 | 0.156 | 0.479 | 0.056 | 0.063 | 0.011 | 0.016 | 0.015 | 0.000 | 0.000 | 0.102 | 1.337 |
| 1/7259 | 0.540 | 0.001 | 0.000 | 0.146 | 0.397 | 0.031 | 0.040 | 0.013 | 0.130 | 0.006 | 0.000 | 0.001 | 0.196 | 1.501 |
| 1/7260 | 0.742 | 0.001 | 0.000 | 0.129 | 0.866 | 0.060 | 0.081 | 0.015 | 0.060 | 0.006 | 0.000 | 0.001 | 0.149 | 2.111 |
| 1/7262 | 0.660 | 0.003 | 0.000 | 0.059 | 0.296 | 0.029 | 0.092 | 0.007 | 0.027 | 0.013 | 0.001 | 0.001 | 0.137 | 1.325 |
| 1/7263 | 5.047 | 0.002 | 0.000 | 0.150 | 0.801 | 0.029 | 0.034 | 0.011 | 0.041 | 0.070 | 0.001 | 0.001 | 0.134 | 6.321 |
| 1/7267 | 0.752 | 0.001 | 0.000 | 0.111 | 0.690 | 0.047 | 0.112 | 0.010 | 0.102 | 0.004 | 0.000 | 0.000 | 0.174 | 2.004 |
| 1/7268 | 0.119 | 0.004 | 0.000 | 0.163 | 0.116 | 0.052 | 0.067 | 0.007 | 0.031 | 0.012 | 0.001 | 0.000 | 0.122 | 0.694 |
| 1/7269 | 0.300 | 0.001 | 0.000 | 0.158 | 0.582 | 0.036 | 0.034 | 0.007 | 0.051 | 0.005 | 0.000 | 0.000 | 0.100 | 1.273 |
| 1/7272 | 0.905 | 0.002 | 0.000 | 0.089 | 0.538 | 0.045 | 0.107 | 0.014 | 0.015 | 0.007 | 0.000 | 0.000 | 0.092 | 1.815 |
| 1/7273 | 0.207 | 0.001 | 0.000 | 0.201 | 0.205 | 0.040 | 0.075 | 0.005 | 0.048 | 0.003 | 0.000 | 0.000 | 0.096 | 0.882 |
| 1/7274 | 0.670 | 0.001 | 0.000 | 0.200 | 0.435 | 0.033 | 0.043 | 0.004 | 0.019 | 0.011 | 0.001 | 0.000 | 0.080 | 1.496 |
| 1/7275 | 0.011 | 0.002 | 0.000 | 0.048 | 0.097 | 0.019 | 0.063 | 0.004 | 0.014 | 0.004 | 0.000 | 0.000 | 0.063 | 0.324 |
| 1/7284 | 0.875 | 0.003 | 0.000 | 0.244 | 0.170 | 0.037 | 0.024 | 0.010 | 0.021 | 0.002 | 0.001 | 0.001 | 0.182 | 1.570 |
| 1/7288 | 0.356 | 0.001 | 0.000 | 0.226 | 0.091 | 0.017 | 0.014 | 0.010 | 0.022 | 0.003 | 0.000 | 0.000 | 0.141 | 0.883 |
| 1/7291 | 0.812 | 0.001 | 0.000 | 0.073 | 0.421 | 0.028 | 0.110 | 0.009 | 0.063 | 0.004 | 0.000 | 0.000 | 0.080 | 1.602 |
| 1/7292 | 0.016 | 0.002 | 0.000 | 0.226 | 0.338 | 0.045 | 0.074 | 0.033 | 0.472 | 0.004 | 0.000 | 0.001 | 0.088 | 1.299 |
| 1/7293 | 0.425 | 0.001 | 0.000 | 1.869 | 0.269 | 0.014 | 0.021 | 0.003 | 0.035 | 0.036 | 0.000 | 0.000 | 0.103 | 2.776 |
| 1/7294 | 0.000 | 0.000 | 0.000 | 1.626 | 0.460 | 0.013 | 0.017 | 0.005 | 0.027 | 0.003 | 0.000 | 0.000 | 0.125 | 2.278 |
| RfD | 0.3 a | 200 a | 2 a | 1 a | 40 b | 700 b | 140 a | 20 a | 3.5 b | 0.4 a | 600 a | 3 a | 300 a | |
Publisher’s Note: MDPI stays neutral with regard to jurisdictional claims in published maps and institutional affiliations. |
© 2021 by the authors. Licensee MDPI, Basel, Switzerland. This article is an open access article distributed under the terms and conditions of the Creative Commons Attribution (CC BY) license (https://creativecommons.org/licenses/by/4.0/).
Share and Cite
Ivanić, M.; Furdek Turk, M.; Tkalčec, Z.; Fiket, Ž.; Mešić, A. Distribution and Origin of Major, Trace and Rare Earth Elements in Wild Edible Mushrooms: Urban vs. Forest Areas. J. Fungi 2021, 7, 1068. https://doi.org/10.3390/jof7121068
Ivanić M, Furdek Turk M, Tkalčec Z, Fiket Ž, Mešić A. Distribution and Origin of Major, Trace and Rare Earth Elements in Wild Edible Mushrooms: Urban vs. Forest Areas. Journal of Fungi. 2021; 7(12):1068. https://doi.org/10.3390/jof7121068
Chicago/Turabian StyleIvanić, Maja, Martina Furdek Turk, Zdenko Tkalčec, Željka Fiket, and Armin Mešić. 2021. "Distribution and Origin of Major, Trace and Rare Earth Elements in Wild Edible Mushrooms: Urban vs. Forest Areas" Journal of Fungi 7, no. 12: 1068. https://doi.org/10.3390/jof7121068
APA StyleIvanić, M., Furdek Turk, M., Tkalčec, Z., Fiket, Ž., & Mešić, A. (2021). Distribution and Origin of Major, Trace and Rare Earth Elements in Wild Edible Mushrooms: Urban vs. Forest Areas. Journal of Fungi, 7(12), 1068. https://doi.org/10.3390/jof7121068