Article

Thaldh3-Dependent GABA Metabolism Modulates Response of Trichoderma to Fusaric Acid-Induced Oxidative Stress

1
Key Lab of Organic-Based Fertilizers of China and Jiangsu Provincial Key Lab for Solid Organic Waste Utilization, Nanjing Agricultural University, Nanjing 210095, China
2
College of Resources & Environmental Science, Nanjing Agricultural University, Nanjing 210095, China
*
Author to whom correspondence should be addressed.
These authors contributed equally to this work.
J. Fungi 2025, 11(7), 542; https://doi.org/10.3390/jof11070542
Submission received: 2 June 2025 / Revised: 17 July 2025 / Accepted: 18 July 2025 / Published: 21 July 2025
(This article belongs to the Section Fungi in Agriculture and Biotechnology)

Abstract

Fusaric acid (FSA) is a mycotoxin produced by pathogenic Fusarium species that inhibits the growth of various beneficial microbes. In this study, we investigated the molecular mechanisms by which Trichoderma harzianum NJAU4742 (Th), a beneficial fungus, responds to FSA-induced stress. Here, by combining a transcriptome analysis, a gene knockout, and physiological data measurements, our study investigated the molecular mechanisms underlying the response of Trichoderma harzianum NJAU4742 (Th) to FSA stress. The results showed that FSA can induce severe oxidative stress in Th, and an aldehyde dehydrogenase (Thaldh3) in Th plays a critical role in alleviating FSA stress. Deleting Thaldh3 significantly decreased the γ-aminobutyrate (GABA) content, causing more severe oxidative damage in Th. Furthermore, we also provide evidence demonstrating that Thaldh3 alleviates FSA stress by enhancing the activities of key enzymes involved in the tricarboxylic acid cycle and ATP content. A pot experiment showed that an enhanced tolerance to FSA increased the Th biomass, strengthening its antagonistic capacity against pathogens and reducing the disease index in tomatoes. In conclusion, these observations provide new insight into the role of beneficial microbes in promoting plant health.

1. Introduction

Fusarium species are the most significant plant pathogens among the world, capable of infecting a wide range of ~100 host plant species, including maize, tomatoes, wheat, cotton, rice, bananas, and eggplants. They cause severe damage in terms of global food security [1,2,3]. Fusarium species possess the genetic capacity to produce hundreds of structurally diverse secondary metabolites, including various mycotoxins such as trichothecenes, zearalenone, fumonisins, enniatins, and fusaric acid (FSA) [1,4]. These toxins are widely regarded as critical factors contributing to plant disease development [5]. Moreover, it has been reported that Fusarium infections often lead to substantial toxin accumulation in crops, which not only significantly reduces both the quality and yield of agricultural products [6], but also poses a severe threat to humans and livestock [7]. FSA is a non-specific phytotoxin produced by several Fusarium species that exhibits strong cytotoxicity to both plant and animal cells [8]. The phytotoxic effects of FSA on plants include damaging host cell membranes [9], reducing mitochondrial respiratory activity [10], and inhibiting ATP synthesis [9]. In animals, FSA toxicity typically manifests as vomiting and hypotension [11]. Therefore, it is imperative to develop effective strategies to manage Fusarium and food contamination by its mycotoxins.
Currently, the prevailing strategy for controlling Fusarium relies on the utilization of synthetic agrochemicals [12]. This approach not only intensifies the emergence of fungicide resistance, but also results in detrimental effects on ecosystems. The application of microbial biological agents (BCAs) is regarded as an environmentally friendly measure to manage Fusarium wilt disease [13]. Various BCAs have been reported to control various pathogens through mechanisms such as inhibiting pathogen growth [14], suppressing mycotoxin synthesis [15], and activating plant defense responses [16]. However, during the antagonistic interactions between BCAs and Fusarium, the production of inhibitory compounds capable of halting or impeding the growth of competing microorganisms provides an ecological advantage to the producing microbes [17]. This specific form of intense competition is referred to as “interference competition” [18]. Mycotoxins secreted by Fusarium, especially enniatins, beauvericin, and FSA, exhibit antimicrobial activity against a variety of BCAs. For example, enniatins were found to promote the inhibition of B. bassiana and T. harzianum [19]. Beauvericin had a strong antibacterial activity against plant growth bacteria and Gram-negative bacteria [20]. Therefore, enhancing the resistance of BCAs to mycotoxins is a critical factor for improving their biocontrol efficacy against pathogens.
Trichoderma is one of the most widely used BCAs and biofertilizers in agricultural ecosystems worldwide [21]. It can colonize in the plant rhizosphere, thereby promoting plant growth and defending against various plant diseases [16,21]. Trichoderma harzianum NJAU4742 (Th), initially isolated from mature compost, has been reported to inhibit pathogen growth through mycoparasitism [22] and the secretion of chemical compounds [23]. However, these studies mainly focused on the direct interaction between Th and pathogens; the details of the mechanism by which Th tolerates FSA secreted by Fusarium pathogens remain largely unclear. A previous study reported that Trichoderma has the ability to tolerate various inorganic and organic environmental pollutants [24]. In this study, we proved that Th was able to grow under a high FSA concentration. The transcriptomics showed that an aldehyde dehydrogenase (aldh3) gene responsible for γ-aminobutyrate (GABA) synthesis played a crucial role in defending against FSA. GABA is a widely distributed four-carbon non-protein amino acid that is associated with various abiotic and biotic stresses [25]. For instance, the accumulation of GABA directly interacts with aluminum-activated malate transporters and outward-rectifying K+ channels within guard cells, thereby enhancing drought and hypoxia tolerance in plants [25]. The application of GABA is reported to enhance ion transport, cell wall remodeling, antioxidation, growth and reproduction, stress resistance, and amino acid synthesis in yeast [26]. Therefore, the objective of this study was to elucidate the molecular mechanisms by which Trichoderma harzianum tolerates fusaric acid toxicity, with a specific focus on the role of the Thaldh3-mediated GABA pathway. Additionally, we aimed to clarify how this specific mechanism contributes to the antagonistic interaction between Th and Fusarium pathogens, thereby deepening our understanding of microbial interactions and biocontrol efficacy in the rhizosphere.

2. Materials and Methods

2.1. Strains and Culture Conditions

Trichoderma harzianum NJAU4742 (Th) was isolated from mature compost and stored at the Jiangsu Provincial Key Lab for Organic Solid Waste Utilization. The genome sequence (NCBI accession: LVVK00000000.1) has been previously published [23]. Th was cultured on potato dextrose agar (PDA; Difco, Franklin Lakes, NJ, USA) at 28 °C, and spores were harvested by washing 5-day-old cultures with sterile water, filtered through four layers of sterile gauze, and quantified using a hemocytometer (Marienfeld, Lauda-Königshofen Germany).
Fusarium oxysporum f. sp. lycopersici strain Fol4287 (Fol) (stored at the Jiangsu Provincial Key Lab for Organic Solid Waste Utilization) was cultured on PDA under identical conditions, with the conidia prepared as described above.

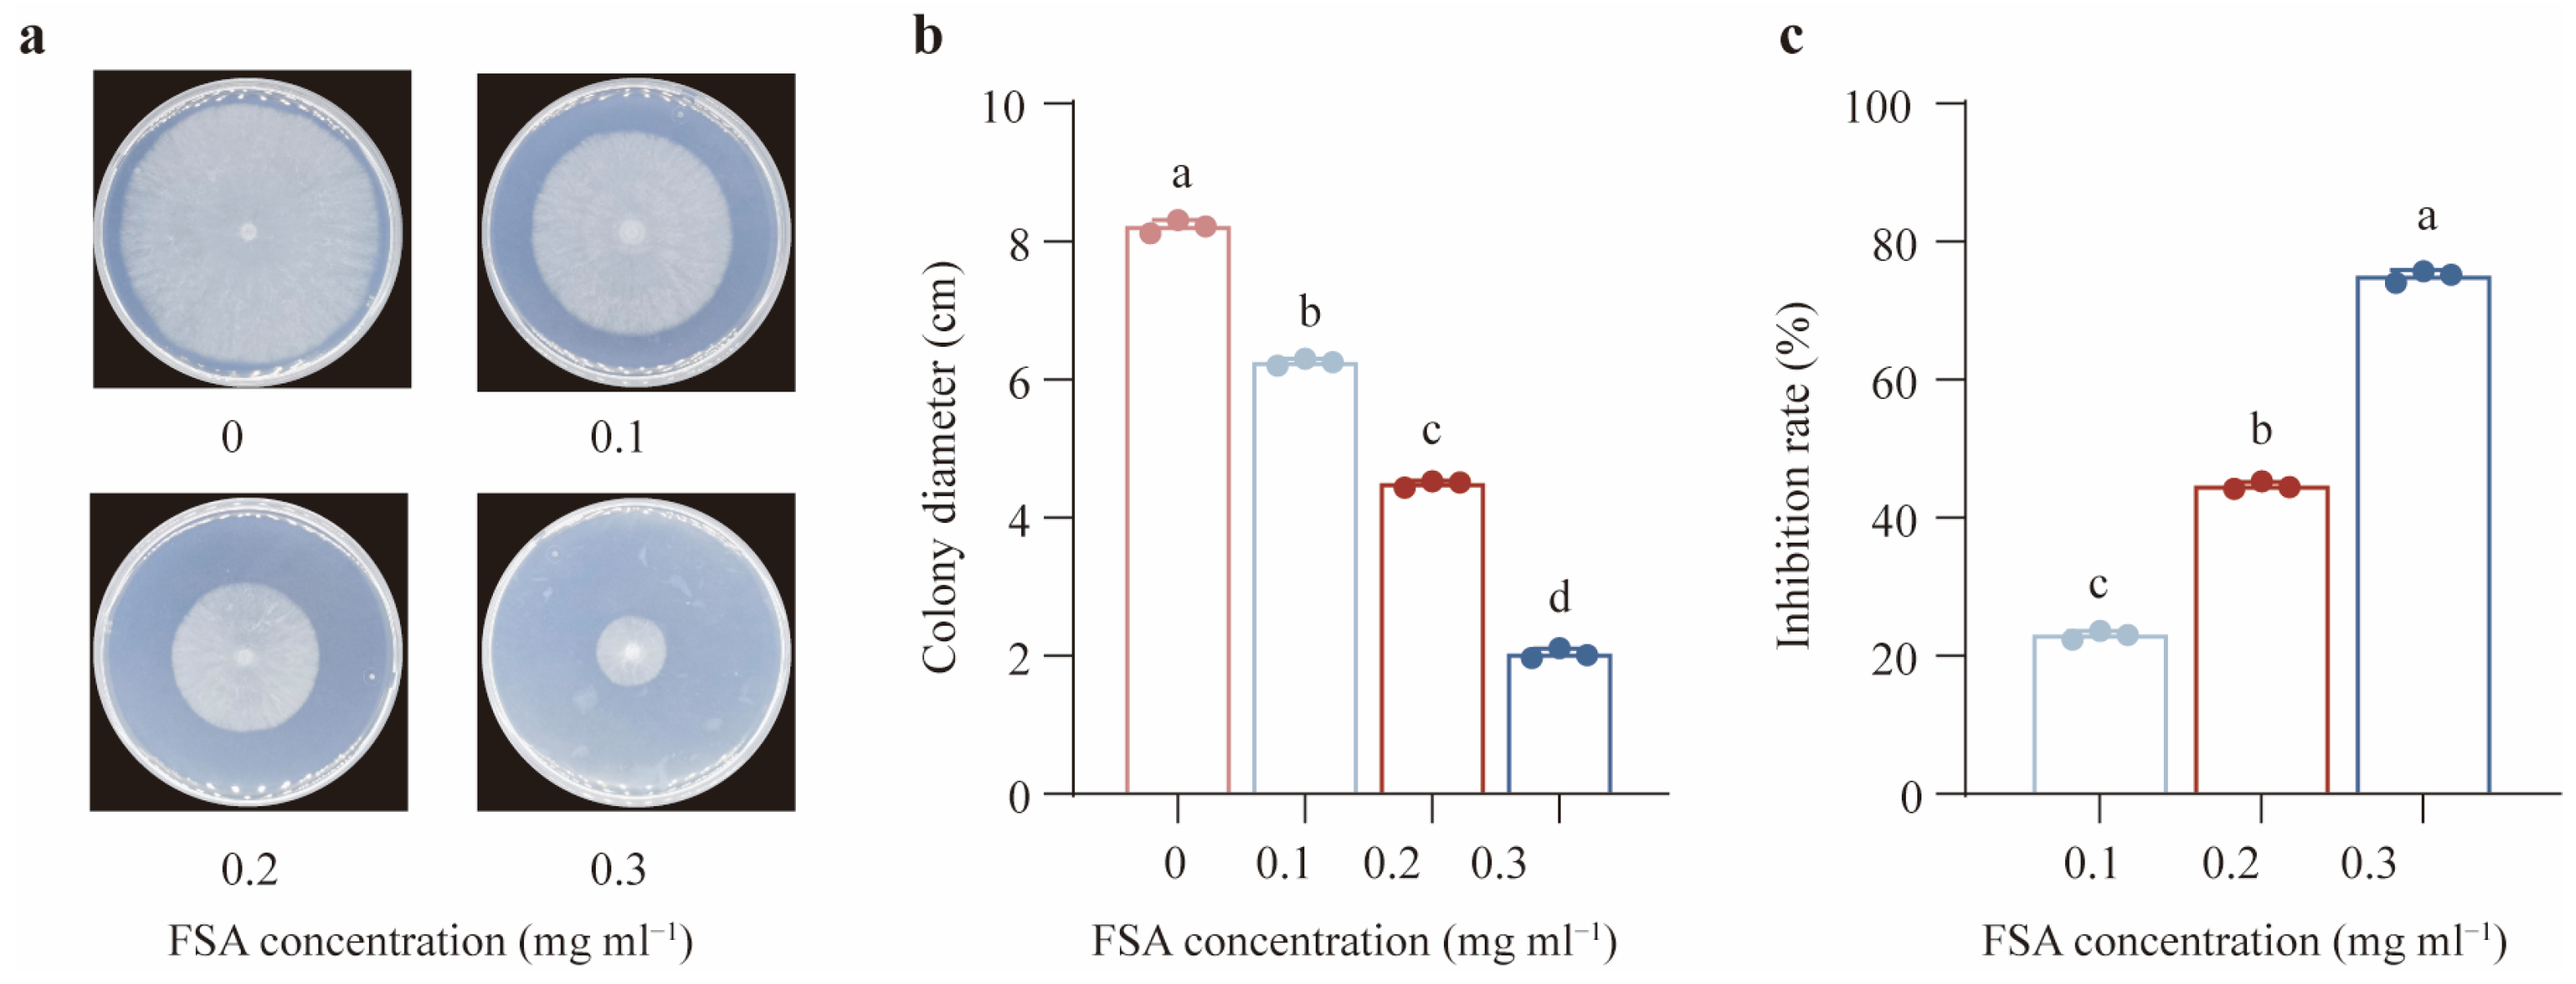
2.2. Inhibitory Effects of FSA on Th

To determine the inhibitory effects of FSA (Sigma, Darmstadt, Germany) on Th, fresh Th spores were inoculated onto minimal media (MM) containing glucose (1%, w/v), KH2PO4 (1.5%, w/v), (NH4)2SO4 (0.5%, w/v), and MgSO4 (0.06%, w/v), and the concentration of FSA was adjusted using a diluted FSA solution (100 mg mL−1). Three days after inoculation, the inhibitory rate of FSA on Th was calculated. Each treatment included three independent biological replicates.

2.3. RNA Sequencing and Transcriptome Analysis

Spores of Th-WT (1 × 10⁷ spores mL−1) were inoculated with or without FSA (0.3 mg mL−1) for three days. The mycelia of Th-WT in two treatments were collected and flash-frozen in liquid nitrogen for a further transcriptional analysis. For each treatment, three independent biological replicates were prepared for RNA extraction and transcriptome sequencing. The total RNA was extracted using the mirVana miRNA Isolation Kit (Ambion, Austin, TX, USA), and the integrity was verified by 1% agarose gel electrophoresis. Qualified RNA samples were sequenced on an Illumina sequencing platform (HiSeqTM 2500, Illumina, Inc., San Diego, CA, USA). High-quality clean reads were filtered using Cutadapt (version 1.9). Raw reads were quality-filtered with Cutadapt (v1.9) and aligned to the T. harzianum NJAU4742 genome using HISAT2 (version 2.2.1.0). Differentially expressed genes (DEGs) were identified using the DESeq (2012) R package (version 1.18.0), and the significance thresholds were set at a p-value < 0.05 and a fold change ≥ 1.50 or ≤0.67. Based on the results of DEGs, volcano plots were created and KEGG (Kyoto Encyclopedia of Genes and Genomes) enrichment analyses were conducted to explore the functional roles of the selected genes. All the analyses and visualizations were carried out using R. The data were deposited to the NCBI under the accession number PRJNA1189886.

2.4. Extraction of T. harzianum NJAU4742 Genomic DNA and Construction of Homologous Fragments

Genomic DNA of T. harzianum NJAU4742 was extracted using the CTAB method. The fungal mycelia were first frozen in liquid nitrogen and then ground thoroughly using a mortar and pestle. Approximately 200 mg of the resulting powder was transferred to a tube containing 500 μL of CTAB extraction buffer. The mixture was incubated at 65 °C for 30 min, with mixing every 10 min. After incubation, 200 μL of chloroform was added, and the solution was gently mixed at room temperature for 2 min. The mixture was then centrifuged at 12,000× g for 5 min, and the supernatant was carefully collected. An equal volume of isopropanol was added to the supernatant, followed by incubation at −20 °C for at least 30 min. Afterward, the solution was centrifuged at 12,000× g for 5 min, and the supernatant was discarded. The resulting pellet was washed with 700 μL of 75% ethanol, vortexed briefly, and centrifuged again at 12,000× g for 5 min. The supernatant was discarded, and the tube containing the DNA pellet was air-dried in a biosafety cabinet (UV light turned off). Once dry, the pellet was resuspended in 100 μL of deionized water by vortexing, and the DNA concentration was determined using a UV spectrophotometer.
The construction of homologous fragments was generated using overlapping PCR. The 1.2 kb upstream and downstream flanking regions of target genes were amplified using Phanta Flash Master Mix (Vazyme P520-01, Vazyme, Nanjing, China). The fusion construct was organized in the following order: upstream–hygromycin B–downstream. Overlapping PCR was performed using the CloneAmp HiFi PCR Premix (TaKaRa, San Jose, CA, USA, Cat. No. 639298). The primers used for the overlapping amplification are listed in Supplementary Table S1.

2.5. Generation of Targeted Gene Mutants in T. harzianum NJAU4742

A schematic of the gene knockout strategy is presented in Supplementary Figure S1. Th-WT spores (1 × 10⁸ spores mL−1) were inoculated and evenly spread onto solid PDA medium covered with a sterile cellophane sheet. After approximately 16 h of incubation, the germinated spores were lysed using a lysis solution composed of 0.75% (w/v) lysing enzymes (Sigma, Lot# SLBJ0553V) and Solution A (6 M sorbitol, 0.5 M KH2PO4, and a pH adjusted to 5.6 with 1 M KOH). The lysis mixture was incubated at 28 °C with shaking at 100 rpm for 120 min. Following lysis, the spore layer was gently dislodged using pipette tips and filtered through four layers of sterile gauze on ice. The resulting filtrate was then centrifuged at 2000 rpm for 10 min at 4 °C. The supernatant was retained to a final volume of 3 mL, and the pellet was gently resuspended. The suspension was centrifuged again under the same conditions, and the supernatant was discarded. The remaining pellet was resuspended in Solution B (10 M sorbitol, 0.5 M CaCl2·2H2O, and 1 mL of 1 M Tris–HCl, with a pH of 7.5) to prepare the protoplast suspension.
Protoplast transformation was carried out by mixing the protoplast solution with functional DNA fragments and a PEG solution (25% PEG6000, 0.05 M CaCl2·2H2O, and 1 mL of 1 M Tris–HCl, with a pH of 7.5) in a volume ratio of 77% protoplast solution, 19% PEG solution, and 4% DNA fragments. This mixture was incubated on ice for 20 min, followed by the addition of 4 mL of the PEG solution and another 5 min incubation on ice. Subsequently, 6 mL of Solution B was added. The transformation mixture was then spread evenly onto sucrose–PDA plates (containing 1 M sucrose). After approximately 16 h, PDA medium supplemented with 0.2 mg mL−1 of hygromycin B was poured over the surface. After 36 h, emerging transformants were transferred to a selective PDA medium. Homologous recombinations were confirmed via PCR to eliminate non-specific insertions. Verified transformants were purified by single-spore isolation on a selective medium, ensuring the presence of the target gene and clonal purity.

2.6. Assay of Mycelium Inhibition Growth Rate and Intracellular Metabolites

To assess the sensitivity of various strains to fusaric acid (FSA), 1 μL of spore suspension (1 × 10⁷ spores mL−1) from T. harzianum and its mutants was inoculated onto MM medium supplemented with FSA, achieving a final concentration of 0.3 mg mL−1. After six days, the diameters of the colonies were measured. To reveal specific growth-suppression patterns across individual gene knockout strains under FSA exposure, the specific index was measured as follows: specific index = (mean diameter of Th-WT in FSA treatment − mean diameter of Th-mutant in FSA treatment)/(mean diameter of Th-WT in control treatment − mean diameter of Th-mutant in control treatment). Each treatment included three independent biological replicates.
Similarly, to evaluate the contributions of GABA and β-alanine in alleviating FSA stress, the mycelial diameter was measured after four days of culture on MM medium supplemented with FSA and additional GABA (100 μg mL−1) or β-alanine (100 μg mL−1), respectively. The entire process included a control group in which FSA was not incorporated. Simultaneously, fresh mycelia were harvested from MM plates covered with cellophane. The mycelia were then homogenized in ice-cold extraction buffer (Solarbio BC0310 kit, Solarbio, Guntur, India), followed by centrifugation at 12,000× g for 10 min. The resulting supernatants were analyzed for metabolites using commercial kits: superoxide dismutase (SOD) (Solarbio BC0175), reduced glutathione (GSH) (Solarbio BC1175), oxidized glutathione (GSSG) (Solarbio BC1180), citrate synthase (CS) (Solarbio BC1060), isocitrate dehydrogenase (ICDHm) (Aladdin I486212-1kit, Aladdin Scientific, Riverside, CA, USA), α-ketoglutarate dehydrogenase (α-KGDH) (CheKine KTB1240, Abbkine, Atlanta, GA, USA), γ-aminobutyric acid (GABA) (Elabscience E-BC-K852-M, Elabscience, Wuhan, China), glutamate decarboxylase (GAD) (geruisi G1102F, Geruisi, Hangzhou, China), γ-aminobutyric acid transaminase (GABA-T) (geruisi G1103F), and adenosine triphosphate (ATP) (CheKine KTB1019). Each treatment included three independent biological replicates, and each biological replicate consisted of three technical replicates.

2.7. Pot Experiments

Soil from a tomato-cultivated field (Baima Experimental Base, Nanjing, China) was air-dried, sieved (2 mm), and split into non-sterile and γ-irradiated (Co60, 25 kGy) batches. Surface-sterilized Solanum lycopersicum cv. Micro-Tom seeds (70% ethanol, 3 min; 5% NaOCl, 3 min) were germinated on moist filter paper for 2 days and grown in seedling trays for 7 days. Polypropylene pots (200 g soil) received four treatments, as follows:
  • T1 (CK): Soil inoculated with Fol only, serving as the control.
  • T2: Soil co-inoculated with Fol and Th-WT strains.
  • T3: Soil co-inoculated with Fol and the ΔThaldh3 strains.
  • T4: Soil co-inoculated with Fol and ΔThaldh3, with exogenous GABA added at 100 μg g−1 soil.
Each treatment included three replicates with eight plants in each replicate. Spores of Th-WT or its mutant, ΔThaldh3 (1 × 10⁶ spores g−1 soil), were applied 3 days post-transplantation. Fol (1 × 10⁶ spores g−1 soil) was inoculated 7 days later. The plants were maintained in a growth chamber (16 h light/30 °C, 8 h dark/28 °C, 75% humidity). The disease severity index (DI) of the tomato plants was evaluated according to the scoring scale described by Ji et al. [27]. In brief, Scale 0 represented healthy plants without any signs of wilting or yellowing. Scale 1 indicated the wilting or abscission of cotyledons. Scale 2 was assigned when 30–50% of the true leaves were wilted or dropped. Scale 3 corresponded to 50–80% wilting or the loss of true leaves, and Scale 4 denoted complete leaf abscission or the death of the entire plant. The disease severity index of the tomato plants was assessed using the following formula:
D I =   i = 1   k s × n N × S × 100 %
where
si = severity score of the *i*-th category;
ni = number of plants in the *i*-th severity category;
N = total number of plants assessed;
Smax = maximum severity score possible;
k = number of severity categories.

2.8. Soil Sampling, DNA Extraction, and Real-Time Quantitative PCR Analysis

The rhizosphere soils were collected as previously described. DNA was extracted from 0.5 g of soil from each sample using the PowerSoil DNA Isolation Kit (Mobio Laboratories, Carlsbad, CA, USA) according to the manufacturer’s instructions. The DNA concentration and quality were assessed with a NanoDrop 2000 spectrophotometer (Thermo Scientific, Waltham, MA, USA). The abundances of Fol and Th were measured on an ABI 7500 real-time PCR system (Applied Biosystems, Waltham, MA, USA). The primers used in this study are shown in Supplementary Table S1.

2.9. Statistical Analyses

All the statistical analyses were conducted using IBM SPSS version 22 (IBM Corporation, New York, NY, USA) and the R software (version 3.5.0). The significance of the differences among multiple groups, excluding the sequencing data, was assessed using a one-way analysis of variance (ANOVA) followed by Duncan’s multiple range tests. For comparisons between two groups, a two-sided Student’s t-test was employed. The following thresholds were applied throughout the study: p < 0.05 (*) and n.s. indicating no statistical significance.

3. Results

3.1. The Transcriptome Profiling of Th Exposed to FSA

To investigate the influence of FSA on the growth of Th, the Th was treated with different FSA concentrations (0.1 to 0.3 mg·mL−1). As shown in Figure 1a,b, FSA substantially inhibited the mycelial growth of Th in a dose-dependent manner. The highest inhibition rate was 75%, which occurred when Th was exposed to 0.3 mg mL−1 of FSA (Figure 1c). To gain a more comprehensive understanding of the mechanisms by which Th tolerates the extreme toxicity of FSA, we determined 0.3 mg mL−1 as the optimal concentration for subsequent experiments. Subsequently, the transcriptome profiling was performed on Th exposed to this concentration of FSA.
According to the statistical assessment, more than 93% of the sample data were valid, and the sequencing quality (Q30) exceeded 95%, demonstrating that the dataset satisfied the required quality criteria (Supplementary Table S2). The principal coordinate analysis (PCoA) results revealed a significant transcriptional difference between CK and the FSA treatment, and this finding was further validated by the correlation coefficient matrix (Supplementary Figures S2 and S3). To further illustrate the differences between the two treatments, a volcano plot analysis was performed. The results showed that a total of 3443 unigenes exhibited significant expression changes following the FSA treatment, with 2063 unigenes upregulated and 1380 unigenes downregulated (Figure 2a). A Kyoto Encyclopedia of Genes and Genomes (KEGG) analysis classified the unigenes into six primary functional categories, including cellular processes, environmental information processing, genetic information processing, human diseases, metabolism, and organismal systems. The most significantly upregulated subcategories are presented in Figure 2b, and 10 of them were associated with metabolism. Meanwhile, we found that the most upregulated gene pathways were also linked to substance metabolism (Figure 2c). Based on these observations, we thus focused on the gene expression related to metabolism for further analysis. Notably, we observed that, within the KEGG pathways associated with beta-alanine metabolism, a specific segment of the substance metabolism was consistently upregulated (Supplementary Figure S4). All eight genes involved in this metabolism were significantly upregulated in response to the FSA treatment based on our transcriptomic analysis. The fold change in expression ranged from 2.98 to 8.88, indicating the robust transcriptional activation of this metabolic pathway under FSA-induced oxidative stress. This metabolic cascade encompasses the sequential changes from spermine to spermidine, followed by the conversion of spermidine into 1, 3-diaminopropane, then 1, 3-diaminopropane into 3-aminopropanal, and finally, 3-aminopropanal into 3aminopropionic acid (Figure 2d). Among these metabolites, spermidine and 3-aminopropionic acid (3-APA) are both recognized as well-known antioxidants under stress conditions. We thus inferred that Th may alleviate the inhibitory effects of FSA by activating the metabolic pathway of these key compounds.

3.2. FSA Induced Severe Intracellular Oxidative Stress in Th

To validate the above hypothesis, we examined whether FSA induces intracellular oxidative stress in Th. SOD is commonly regarded as the first line of defense against oxidative stress. Contrary to our expectations, we found that the application of FSA significantly decreased the intracellular SOD activity (p < 0.05, Figure 3a). This may be attributed to the fact that a high concentration of FSA causes excessive oxidative stress, which in turn inhibits SOD activity. Comparable findings have been documented in plants exposed to heavy metal toxicity and salt stress. Reduced glutathione (GSH), a ubiquitous protective antioxidant present in both intracellular and extracellular environments, serves as a critical cellular defense component. The GSH/ GSSG (oxidized glutathione) ratio is widely considered as a reliable biomarker for oxidative stress, where diminished ratios are correlated with heightened oxidative perturbation. We then selected the GSH/ GSSG ratio as the key indicator for quantifying the oxidative stress dynamics in Th. Our results demonstrated that FSA induced the marked upregulation of both the GSH and GSSG levels (p < 0.05), while concurrently eliciting a significant decrease in the GSH/ GSSG ratio compared to the control treatment (Figure 3b–d), unequivocally demonstrating FSA-triggered intracellular oxidative stress in Th.

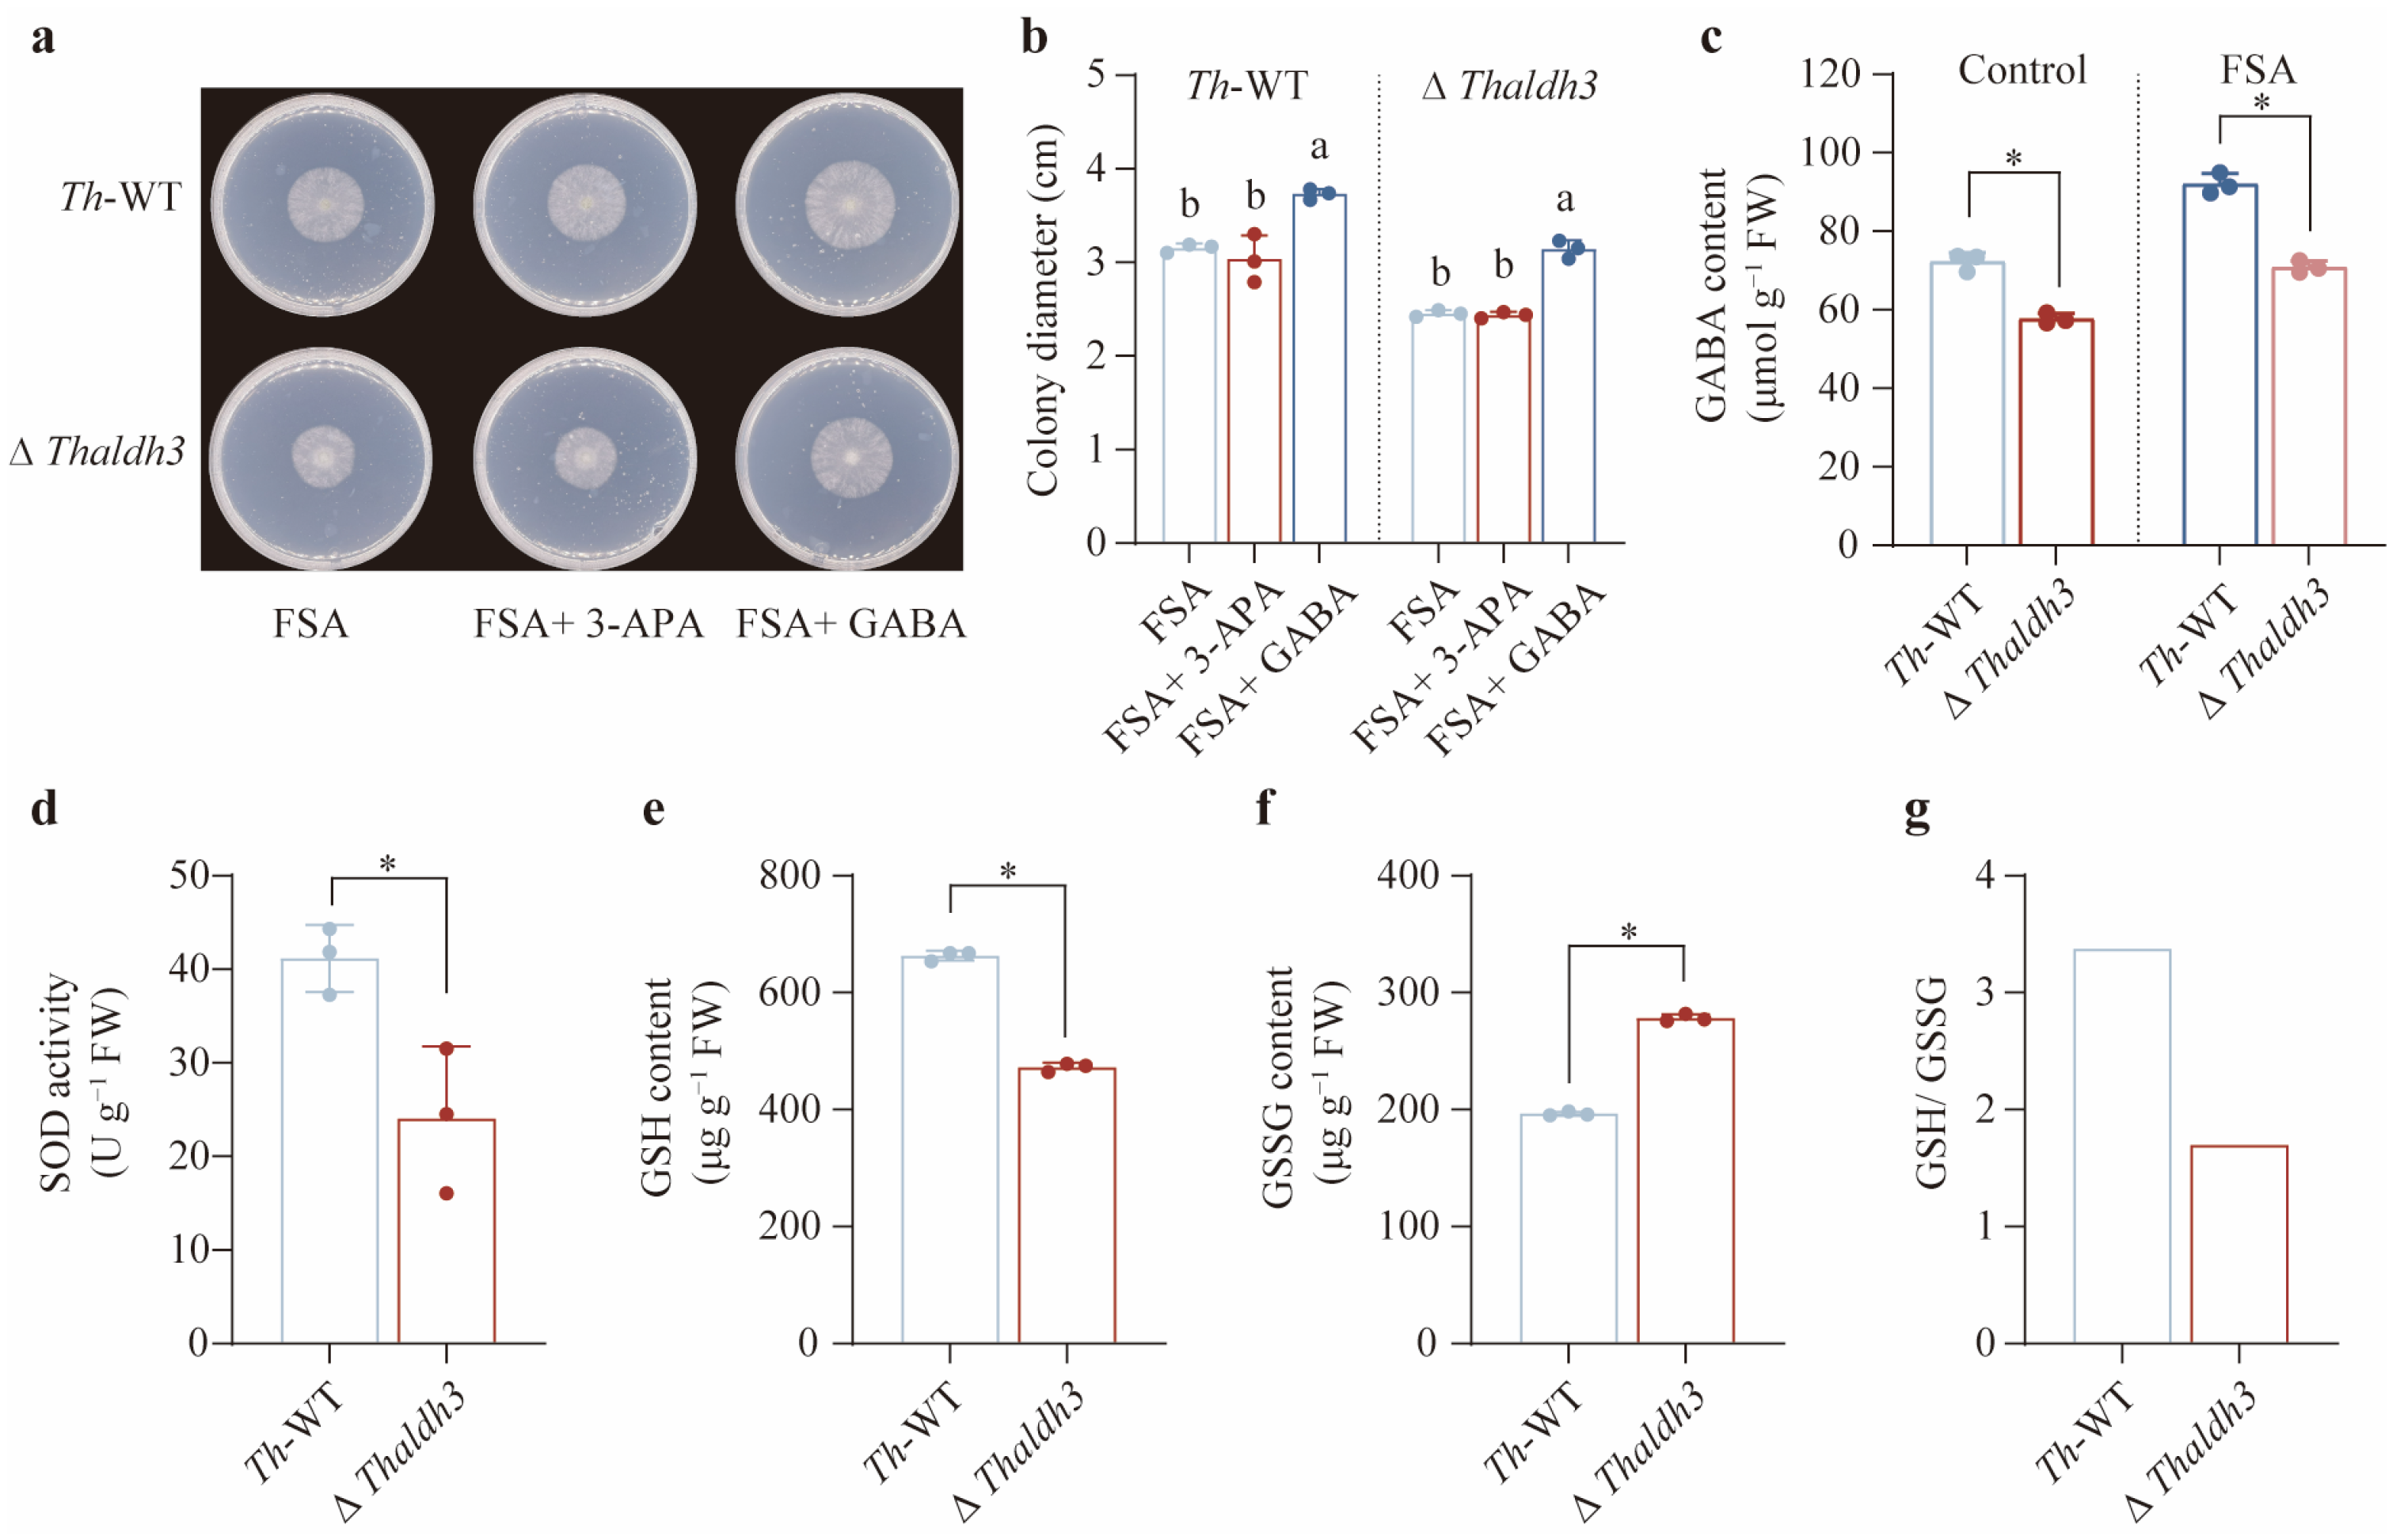
3.3. Thaldh3 Played a Critical Role in the Response to FSA Stress

To functionally characterize the roles of various genes involved in the biosynthetic pathway from arginine to 3-aminopropionic acid in mitigating FSA-induced oxidative stress, we systematically constructed knockout mutants of all eight genes encoding this metabolic cascade. Except for the ∆Thaldh3 and ∆Thaldh4 mutants, all the other mutants exhibited varying degrees of growth impairment compared to Th-WT under the control treatment. Among them, ∆Thaldh2 displayed the most severe growth impairment, followed by ∆Thaldh1 and ∆Thcuao2, while no significant differences were observed among ∆Thsmo1, ∆Thcuao1, and ∆Thcuao3 (Figure 3e,f). For the FSA treatment, similar growth impairments were observed among all the Th mutants compared to Th-WT. ∆Thaldh2 and ∆Thaldh1 exhibited the most severe growth impairment, followed by ∆Thaldh3 and ∆Thsmo1, with no significant differences among ∆Thcuao1, ∆Thcuao2, and ∆Thaldh4 (Figure 3e,g). Notably, ∆Thcuao3 showed the slightest growth impairment. Due to a growth impairment caused by specific gene deletions in the control treatment, we employed a specific index (DFSA-wt − DFSA-mutant)/(DControl-wt − DControl-mutant) to reveal specific growth-suppression patterns across individual gene knockout strains under FSA exposure. Notably, we found that ∆Thaldh3 showed the highest specific index among these mutants under the FSA treatment (Figure 3h), illustrating that the Thaldh3 gene plays a critical role in FSA resistance. Based on these results, we selected ∆Thaldh3 as the potential key gene for subsequent mechanistic investigations of oxidative stress mitigation.

3.4. GABA Was the Key Substance to Mitigate FSA-Triggered Oxidative Stress

Given that Thaldh3 encodes the enzyme responsible for converting 3-aminopropanal into 3-APA, the observed growth impairment in ΔThaldh3 under the FSA treatment is likely attributable to its reduction in the 3-APA content. Contrary to our expectation, an exogenous application of 3-APA failed to rescue the growth of Th-WT and ΔThaldh3 in the FSA treatment (Figure 4a,b). We then speculated that 3-APA is not the key substance used by Th to resist the oxidative stress caused by FSA. Previous studies have demonstrated the broad substrate specificity of the ALDH-family enzymes. Our results found that ΔThaldh3 significantly reduced the content of GABA (p < 0.05), a homolog of 3-APA, compared with Th-WT in both the CK and FSA treatments (Figure 4c). Furthermore, additive GABA markedly enhanced the Th-WT biomass and rescued ΔThaldh3 growth for Th-WT under FSA stress (p < 0.05, Figure 4a,b). These results suggest that Thaldh3 mitigates FSA-induced stress by mediating the biosynthesis of GABA.
To confirm whether the aldh3 knockout alleviated the intracellular oxidative stress caused by FSA, we analyzed the glutathione redox status by quantifying the SOD activity and the GSH/ GSSG ratios between ΔThaldh3 and Th-WT under FSA stress. Our results indicated that the SOD activity in ΔThaldh3 was significantly lower than in Th-WT (p < 0.05, Figure 4d). The ΔThaldh3 strain showed a significantly lower GSH content and higher GSSG accumulation compared to Th-WT under FSA stress (p < 0.05), resulting in a significantly reduced GSH/ GSSG ratio (Figure 4e–g). These results imply that GABA is essential for Th to counteract FSA-induced oxidative stress.

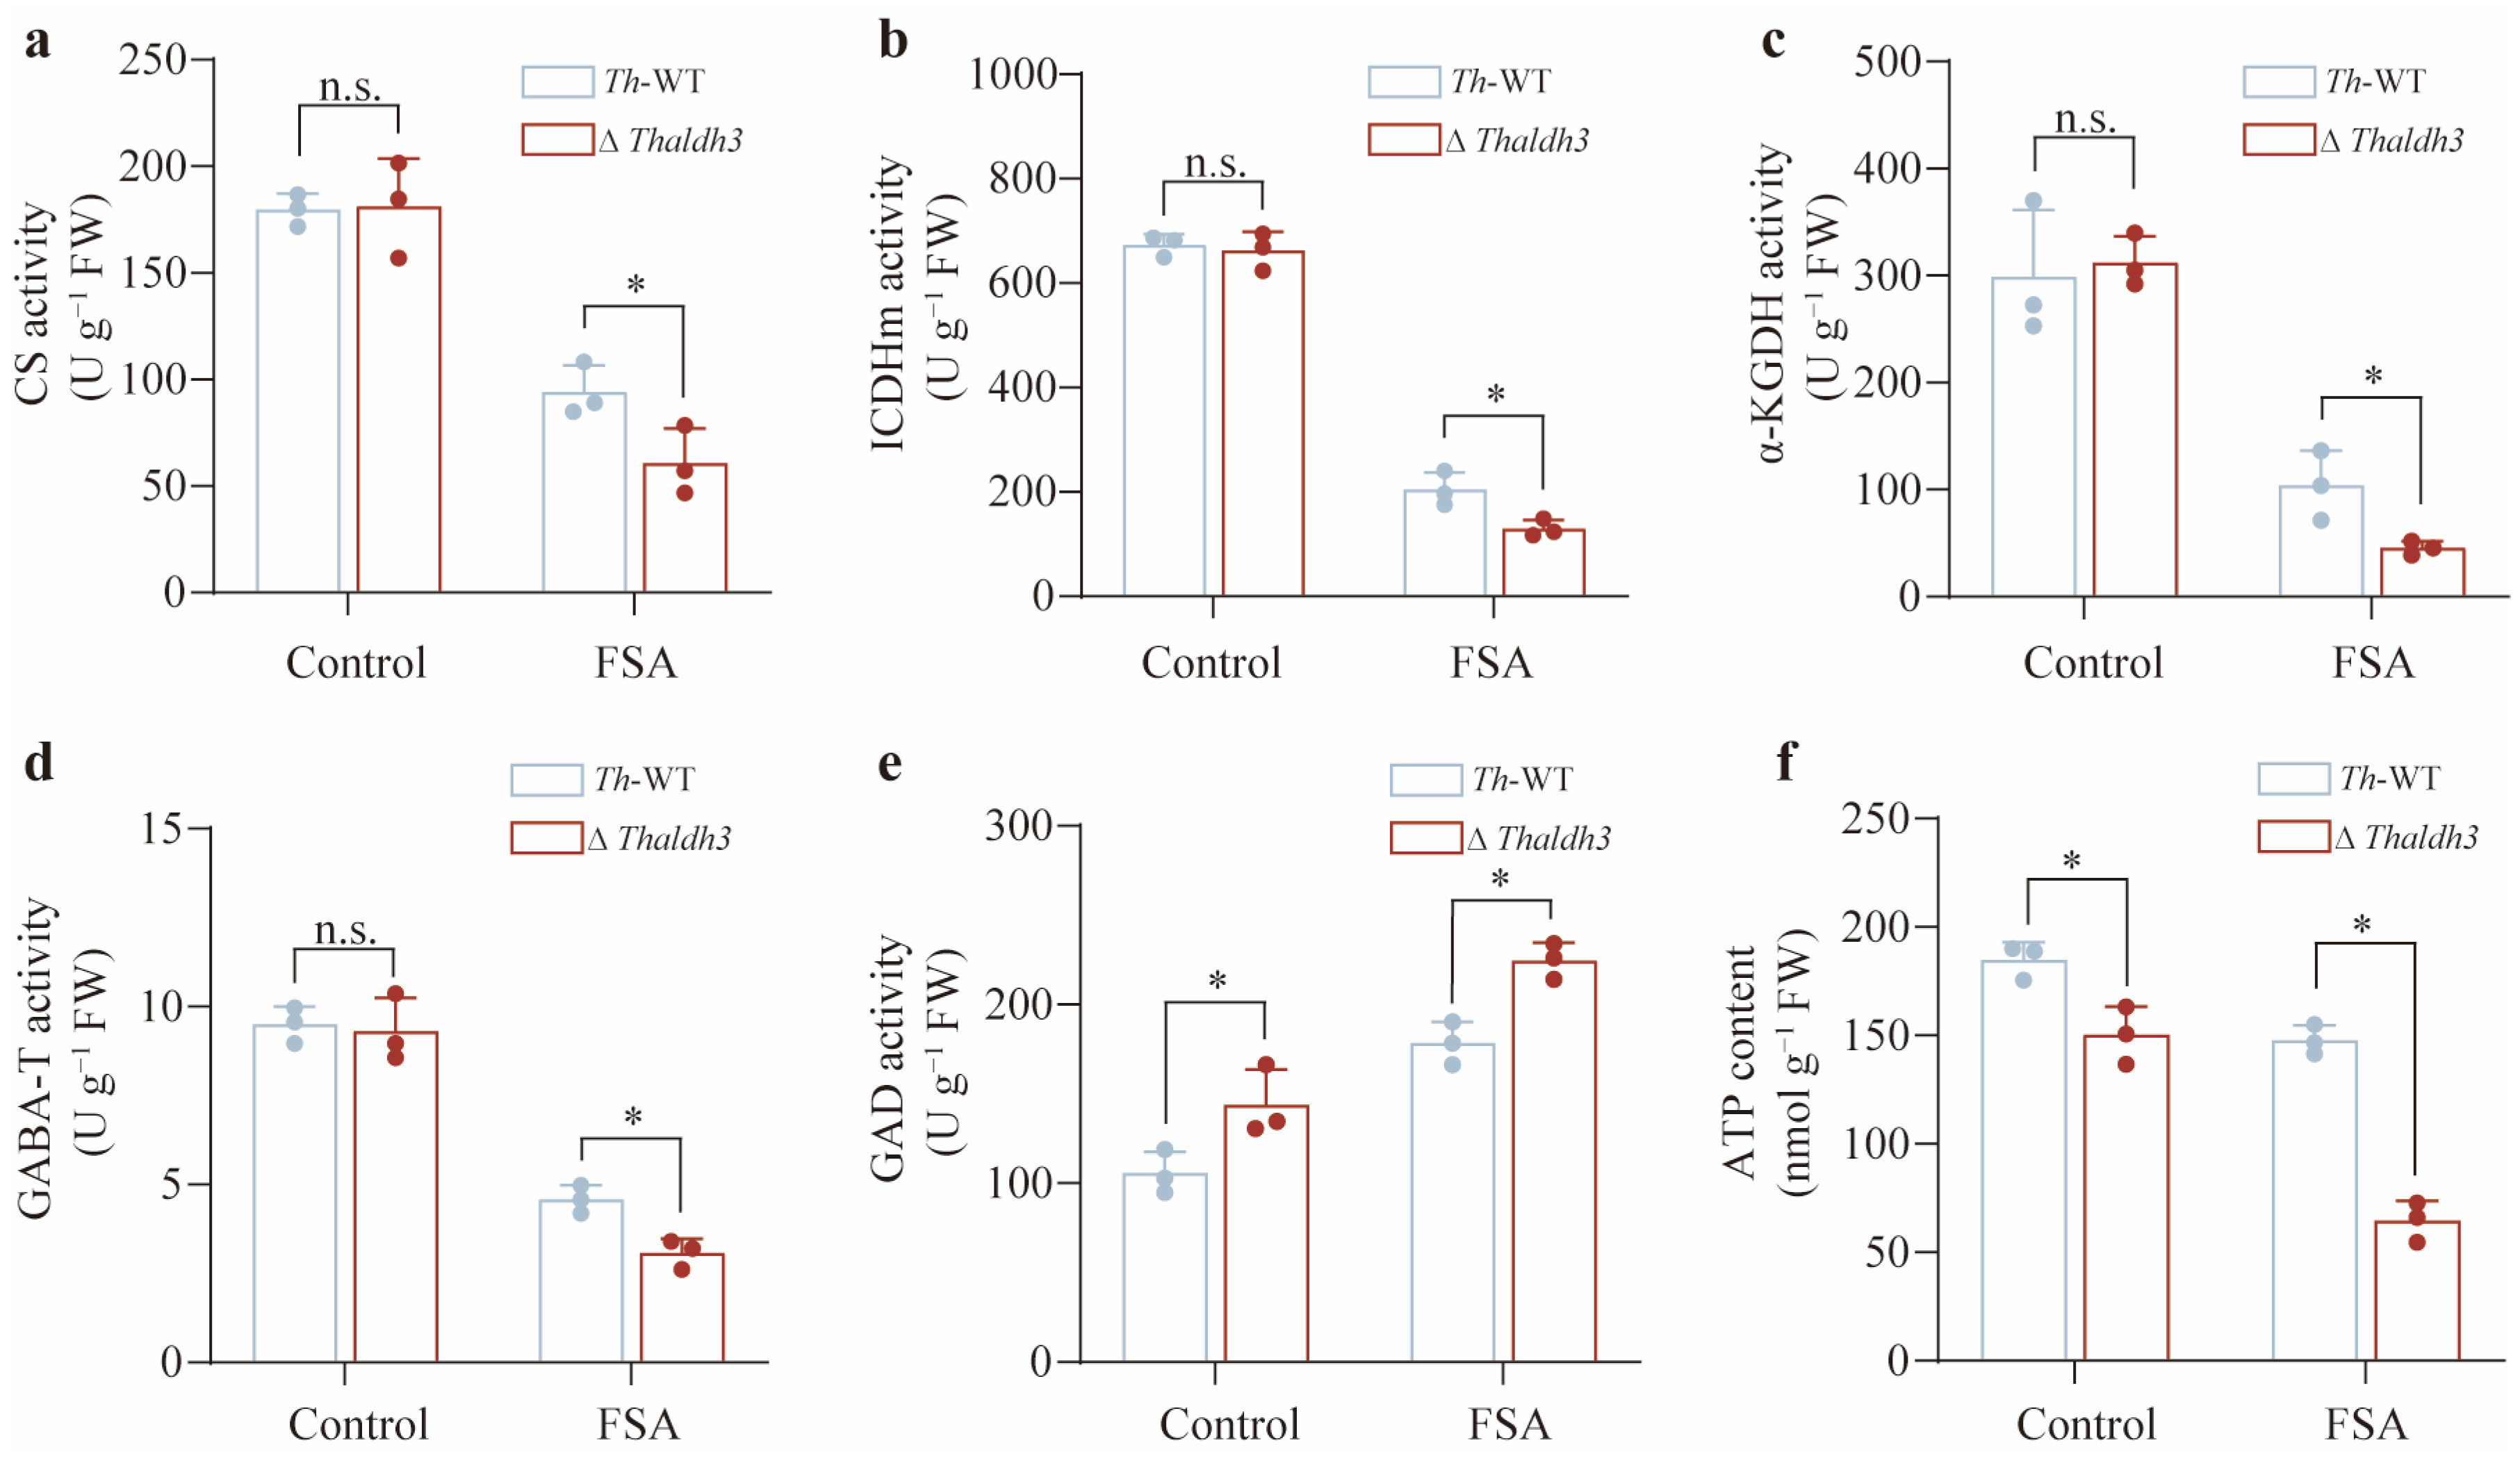
3.5. Thaldh3 Alleviated FSA Stress by Upregulating the Tricarboxylic Acid Cycle Rate

GABA is typically accumulated in the cytoplasm due to the oxidative stress. An increasing body of evidence suggests that GABA can be transported to the mitochondria, and then participate in the tricarboxylic acid (TCA) cycle. The next objective was to investigate the potential role of Thaldh3 in influencing the TCA cycle under FSA-induced oxidative stress. We selected citrate synthase (CS), isocitrate dehydrogenase (ICDHm), and α-ketoglutarate dehydrogenase (α-KGDH) to characterize the rate of the TCA cycle. CS was the initial rate-limiting enzyme of the TCA cycle, which catalyzed the condensation of acetyl-CoA and oxaloacetate to form citrate. ICDHm and α-KGDH played critical roles in generating intermediate metabolites during the TCA cycle, which catalyzed the conversion of isocitrate into α-ketoglutarate (α-KG) and α-ketoglutarate into succinyl-CoA, respectively. Our results showed that there was no significant difference among these enzyme activities between Th-WT and ΔThaldh3 for the control treatment (Figure 5a–c). However, these enzyme activities in ΔThaldh3 were significantly lower than in Th-WT for the FSA treatment (p < 0.05, Figure 5a–c). These results indicate that Thaldh3 enhanced the activities of key TCA-cycle-related enzymes by promoting GABA synthesis under FSA stress.
To further investigate the potential connection between Thaldh3 and the TCA cycle, we also measured the enzyme activities of GABA transaminase (GABA-T) and glutamic acid decarboxylase (GAD). GABA-T catalyzes the transamination of GABA to succinic semialdehyde, which is further metabolized to succinate and enters the TCA cycle. GAD is responsible for converting glutamate to GABA, representing another pathway in GABA synthesis. Our study demonstrated that the GABA-T activity was not altered by the control treatment, but its activity in ΔThaldh3 was significantly lower than Th-WT for the FSA treatment (p < 0.05, Figure 5d). This might be attributable to the critical role of GABA under FSA stress. The knockout of aldh3 significantly reduced the GABA content, which in turn led to a decrease in GABA-T activity. As for the GAD activity, it was significantly upregulated in ΔThaldh3 under both the CK and FSA treatments (p < 0.05, Figure 5e). As an alternative pathway for GABA synthesis, the significant upregulation of GAD activity was considered a compensation strategy in microbes. Given that the TCA cycle rate directly influences intracellular ATP production, we further measured the ATP content in Th. As anticipated, the ATP content showed a moderate decline between Th-WT and ΔThaldh3 in the control treatments. However, the difference between the two strains became much more pronounced for the FSA treatment (Figure 5f). In summary, our results revealed a Thaldh3-mediated molecular mechanism in tolerating FSA stress. This novel mechanism alleviated FSA stress by regulating the TCA cycle rates through the modulation of GABA content.

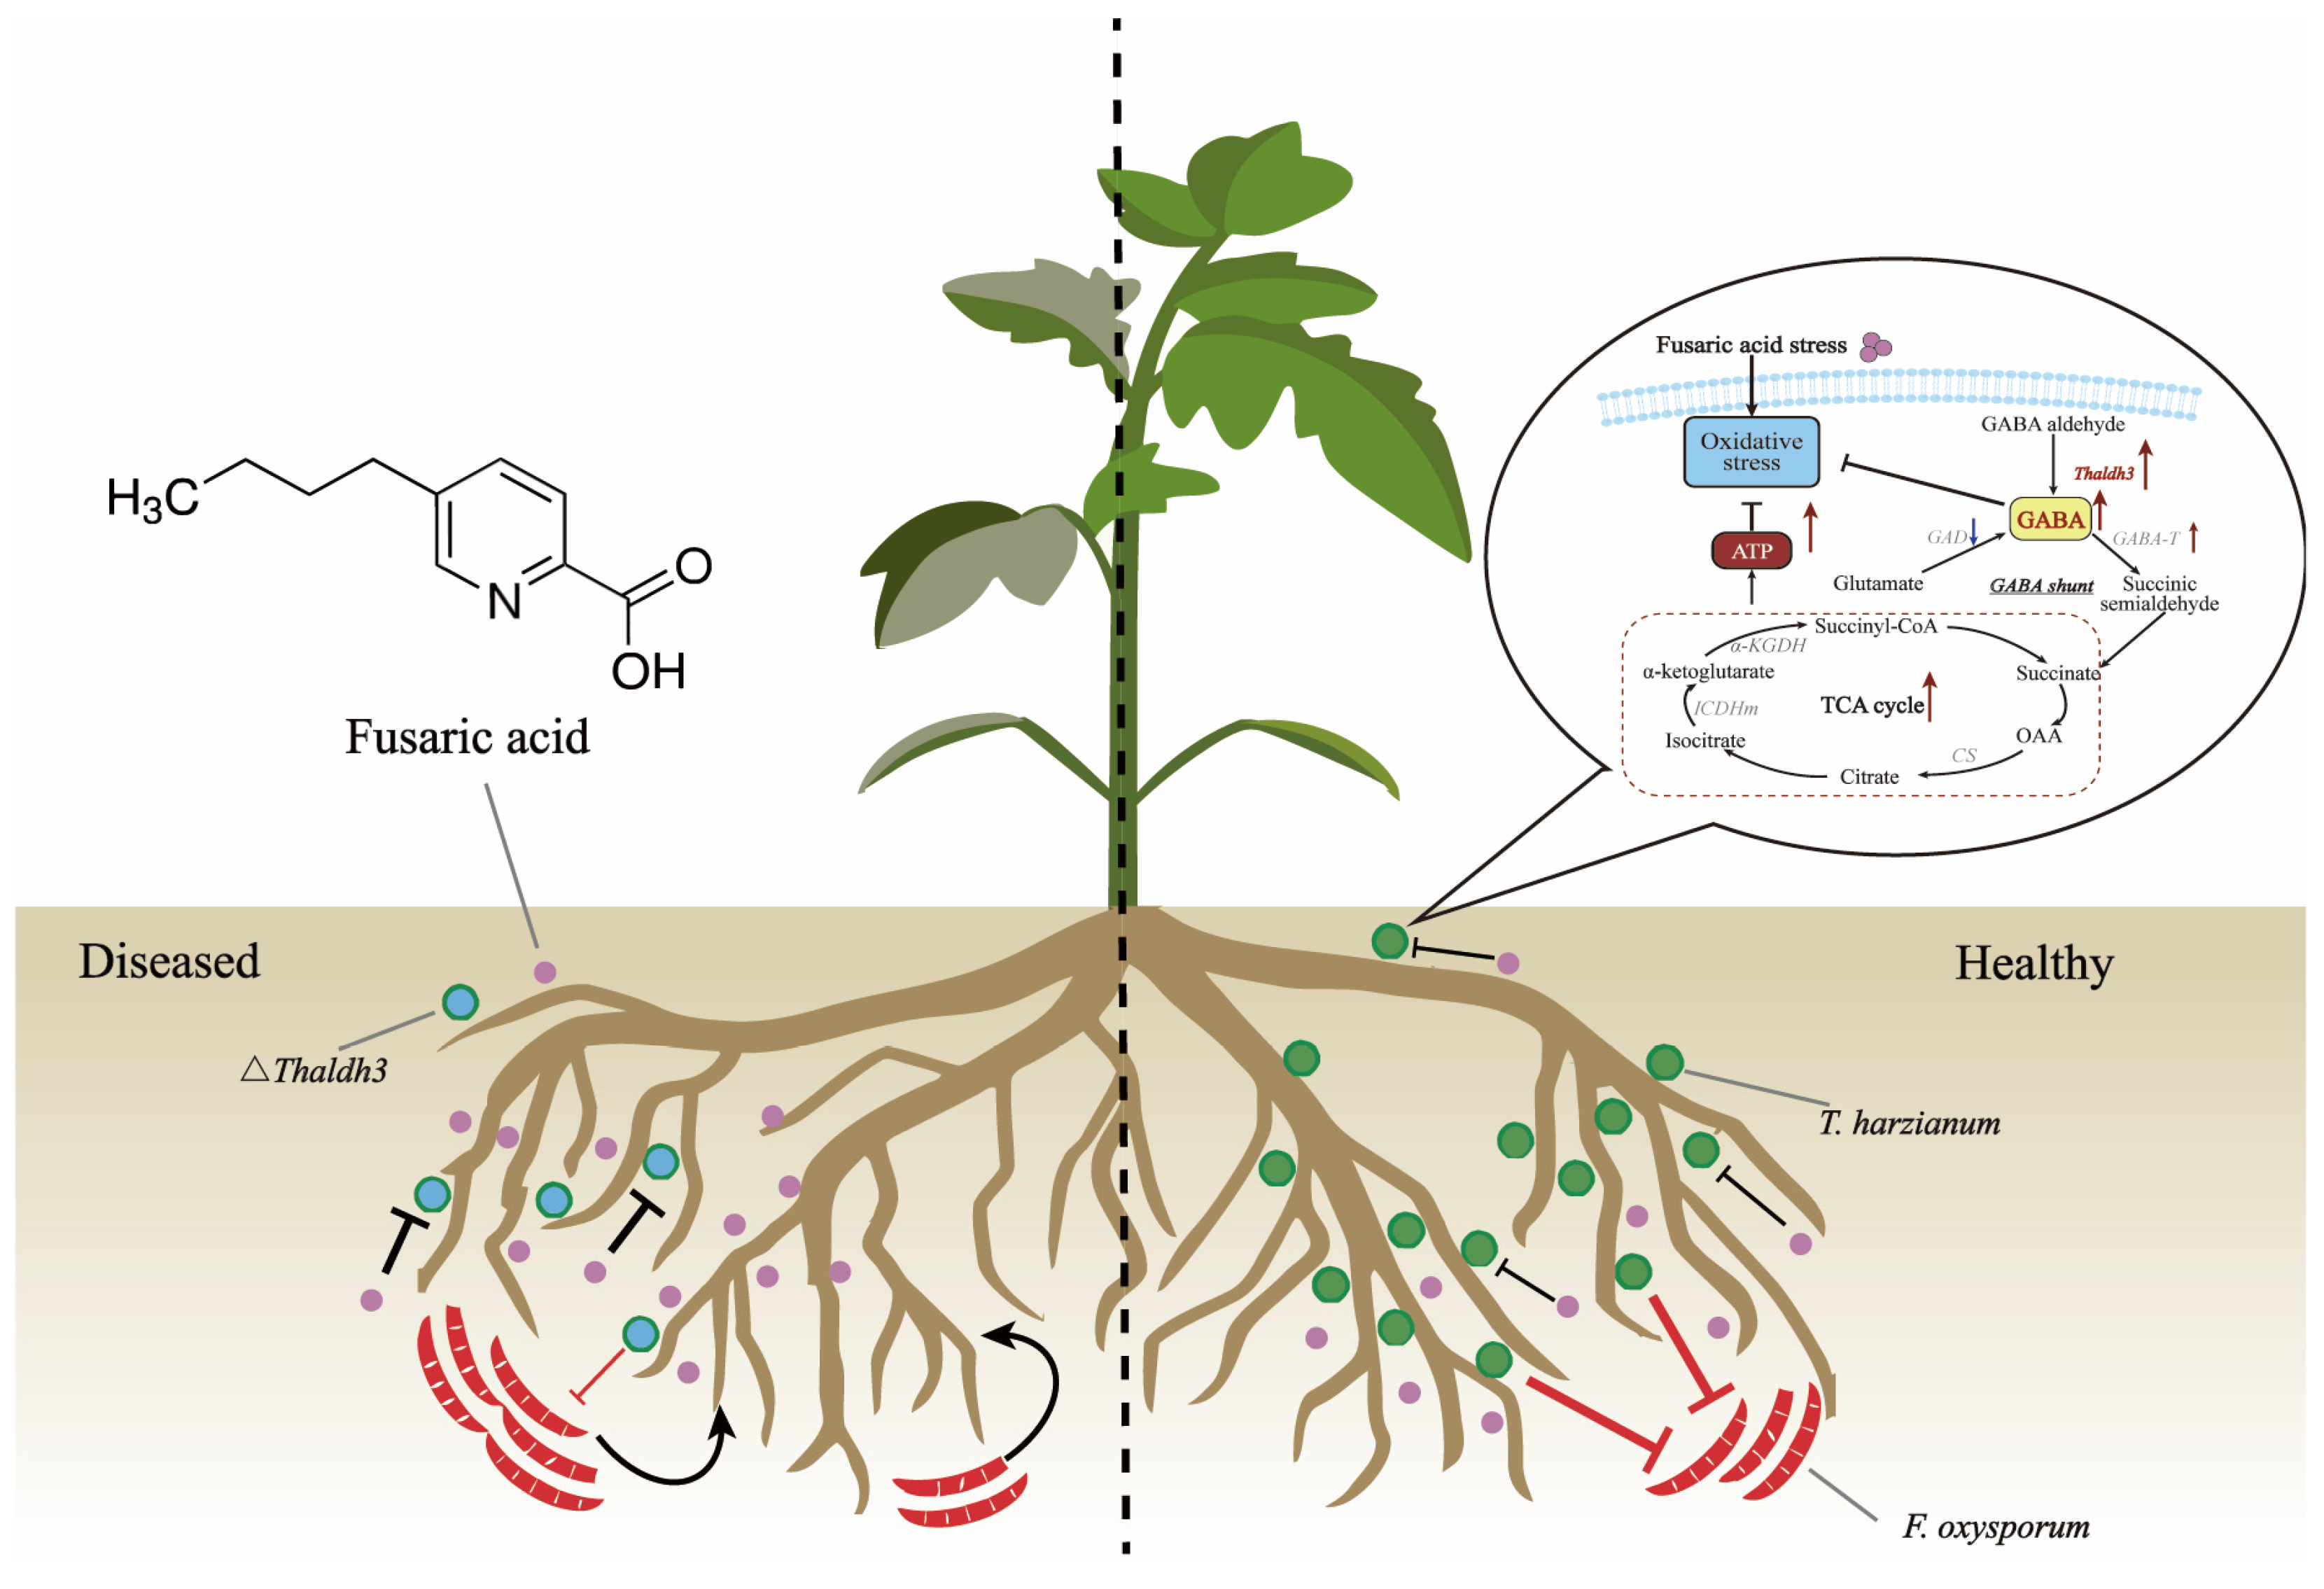
3.6. Enhancing Th Resistance to FSA Is Beneficial for Reducing the Occurrence of Plant Diseases

Based on the hypothesis that the biocontrol efficacy of Th against Fol might correlate with its tolerance to FSA, we conducted a series of pot experiments to validate this hypothesis. Our results demonstrated that a single Fol inoculation caused significant disease development in tomato plants, whereas the exogenous application of different Th strains alleviated the disease symptoms to varying degrees (p < 0.05, Figure 6a). Specifically, the Th-WT and ∆Thaldh3 + GABA treatments exhibited the strongest disease suppression, with a significant reduction in the disease index by 63% and 59.5%, respectively (p < 0.05). In contrast, the ∆Thaldh3 treatment showed a 32.7% reduction in the disease index. These findings suggest that the efficacy of Th against Fol is significantly positively correlated with its tolerance capability towards FSA.
In addition, we measured the abundance of Th and Fol in rhizosphere soil across different treatments. We observed that the abundance of Th exhibited a pattern across the three treatments as follows: ∆Thaldh3 < ∆Thaldh3 + GABA < Th-WT (Figure 6b). We also found that the highest abundance of Fol was observed for the CK treatment, followed by the ∆Thaldh3 treatment, while no significant differences were detected between the Th-WT and ∆Thaldh3 + GABA treatments (Figure 6c). A further correlation analysis revealed a significant positive correlation between the abundance of Fol and the disease index, while the Th abundance was significantly negatively correlated with the disease index (p < 0.05, Supplementary Figure S5). These results collectively demonstrate that Th could further enhance its abundance in rhizosphere soil by improving its tolerance to FSA, thereby conferring a higher disease resistance to host plants.
In conclusion, we propose a working model illustrating how Th enhances its antagonistic ability against pathogens by increasing its resistance to FSA in the tomato rhizosphere (Figure 7). Upon exposure to FSA stress resulting from secretions by Fusarium species, Th enhances the expression of the Thaldh3 gene, which promotes the biosynthesis of GABA. GABA can subsequently enter the TCA cycle to increase the intracellular ATP content, thereby increasing the Th biomass and ultimately enhancing its antagonistic ability against pathogens.

4. Discussion

Mycotoxins play multiple complex roles in the interactions between beneficial microbes and pathogens [28]. Mycotoxins are primary regarded as virulence factors employed by pathogens to invade their hosts [8,28,29]. However, with the advancement of our understanding, we have gradually come to realize that mycotoxins can not only serve as "chemical weapons" for pathogens, but can also act as a driving force for the adaptation and evolution of beneficial microbes [17]. Through prolonged ecological competition, many microorganism communities have gradually developed sophisticated mechanisms for metabolizing and adapting to these mycotoxins [30]. For instance, numerous fungi have been reported to detoxify various mycotoxins through diverse pathways or activate defense-related genes to resist or actively transport mycotoxins [28,31,32]. In summary, these interactions mediated by mycotoxins encompass various mechanisms, such as antagonism, competition, and adaptation. Understanding these mechanisms not only sheds light on the intricate interactions within microbial ecosystems, but also establishes a robust theoretical framework for devising more effective biocontrol strategies and integrated disease-management solutions.
In this study, we focused on elucidating the tolerance mechanism of a widely reported fungal biocontrol agent, Th, against the mycotoxin FSA secreted by Fusarium species. The tolerance of Trichoderma to FSA has been previously reported. For example, Marinella reported that FSA strongly inhibited the growth of Th ITEM 908, while its UV-C mutant significantly enhanced its tolerance to FSA [17]. Similarly, Vivek tested five different Trichoderma strains and found that all of them could tolerate FSA concentrations of up to 500 ppm [33]. He hypothesized that various physiological responses within Trichoderma might contribute to their tolerance to FSA. However, these studies did not further elucidate the molecular mechanisms of the Trichoderma tolerance to FSA. In our study, we first confirmed that FSA stress induced oxidative stress in Trichoderma by measuring the intracellular GSH/ GSSG ratio, consistent with previous reports in both plants [34] and animals [35]. By combining a transcriptomic analysis with functional validation, we further demonstrated that Th significantly upregulated a series of antioxidant-related genes under FSA stress, particularly the Thaldh3 gene. The deletion of Thaldh3 significantly impaired Th growth in the presence of FSA, highlighting its critical role in FSA tolerance. The Thaldh3 gene is generally associated with the metabolism of toxic aldehydes in various organisms [36], playing a crucial role in mitigating cellular oxidative damage. Our findings also confirmed that the deletion of aldh3 exacerbates FSA-induced oxidative stress in Th, reinforcing its essential role in the fungal defense mechanism against mycotoxin stress.
Thaldh3 is considered responsible for converting 3-aminopropanal into 3-aminopropionic acid; we thus hypothesized that 3-aminopropionic acid might be a key compound used by Th to fight against the oxidative stress caused by FSA. However, our results revealed that 3-aminopropionic acid did not alleviate FSA-induced oxidative stress. Instead, aldh3 significantly influenced the intracellular GABA content, thereby modulating Th’s tolerance to FSA. Studies have shown that members of the aldh family exhibit a broad substrate specificity [37,38], catalyzing the oxidation of multiple aldehydes. This also explains why we observed a decrease in the GABA content in ∆Thaldh3. Although a complementation strain for ΔThaldh3 was not included in this study, the observed phenotypes, such as impaired growth under FSA stress, a reduced antioxidant capacity, and decreased GABA accumulation, were consistently reversed by an exogenous GABA application. This phenotypic rescue supports the functional role of Thaldh3 in GABA-mediated FSA tolerance. Nevertheless, future studies incorporating complementation lines will be valuable to further confirm the specific contribution of Thaldh3.
In this study, we also confirmed that Thaldh3 enhances the Th resistance to FSA by increasing the TCA cycle rate, further contributing to ATP accumulation. GABA produced by Thaldh3 can directly enter the TCA cycle via the GABA shunt, thereby accelerating energy metabolism [39]. This process not only maintains the physiological activity of Th, but also enhances its antioxidant capacity under FSA stress. Our study provides additional evidence supporting the pivotal role of GABA as a signaling molecule in various stress environments [40]. Although our results highlight the central role of GABA metabolism in mediating Thaldh3-dependent FSA stress tolerance, microbial responses to chemical stressors are often multifactorial. It is possible that other downstream metabolites or parallel pathway, such as glutathione turnover [41] or redox-sensitive signaling cascades [42], may also contribute to the observed phenotype. Further metabolomic and genetic studies will be required to dissect the broader metabolic networks involved in FSA-induced oxidative stress adaptation.
In the competition between pathogens and beneficial microbes, pathogens often rely on secreting mycotoxins to inhibit the growth of beneficial microbes [29]. This strategy allows them to occupy advantageous ecological niches and subsequently infect plants [29]. Therefore, improving the tolerance of beneficial microbes to these mycotoxins is of great significance for biocontrol efficiency and maintaining plant health. Our pot experiments demonstrated a significant positive correlation between Th’s effectiveness in controlling Fol and its tolerance to FSA. Enhancing Trichoderma’s resistance to FSA facilitates its numerical dominance in the rhizosphere, thereby improving its antagonistic activity against pathogens. Similarly, Marinella found that enhancing the tolerance of Trichoderma harzianum ITEM 908 to FSA is beneficial for improving its effectiveness in disease control [17]. Notably, although the Th-WT treatment exhibited a higher Th abundance than the ∆Thaldh3 + GABA treatment, no significant differences were observed between these two treatments in terms of the disease index or the Fol abundance. A previous study indicated that the application of GABA can reduce the disease index by altering the rhizosphere’s microbial community [43]. Therefore, we hypothesize that Trichoderma and GABA acted synergistically to maintain plant health by reshaping the microbial community in the ∆Thaldh3 + GABA treatment. Future studies should focus on exploring the regulatory effects of Trichoderma and GABA on the microbial community structure. In conclusion, our study revealed a novel mechanism by which Thaldh3 enhanced the biocontrol efficacy of Trichoderma through the GABA-mediated mitigation of FSA stress, providing new insights into fungal stress adaptations and biocontrol improvement.

5. Conclusions

This study revealed that the regulation of redox metabolism, particularly through GABA metabolism mediated by Thaldh3, is a key molecular mechanism underpinning Trichoderma harzianum’s enhanced survival and antagonistic capacity against FSA produced by Fusarium species. These findings significantly advance our understanding of beneficial microbial defense strategies against mycotoxins and provide a crucial theoretical foundation for enhancing the stability and efficacy of biocontrol agents to promote plant health.

Supplementary Materials

The following supporting information can be downloaded at: https://www.mdpi.com/article/10.3390/jof11070542/s1, Figure S1: Schematic diagram of gene knockout via homologous recombination using hygromycin resistance as a selection marker; Figure S2: Principal coordinate analysis (PCoA) of transcriptiome profile among CK and FSA treatments; Figure S3: Correlation matrix analysis of transcriptomic profiles across strains and their replicates; Figure S4: The relative expression of genes among CK and FSA treatments; Figure S5: Verification of each gene knockout mutant by PCR to verify homologous recombination and whether gene exists; Figure S6: The Pearson correlation between Disease index and Fol abundance (a). The Pearson correlation between Disease index and Th abundance (b). Table S1: Oligonucleotide primers used in this study; Table S2: Sequencing sequence statistics and quality control; Table S3: The basic information of eight genes involved in the β-alanine biosynthesis pathway; Table S4: Summary of gene knockout efficiency for eight genes involved in the β-alanine biosynthesis pathway.

Author Contributions

L.C.: methodology, software, supervision, writing—original draft, and writing—review and editing. X.S.: methodology, software, supervision, writing—original draft, and writing—review and editing. T.L.: funding acquisition, supervision, and data curation. Y.L.: methodology and formal analysis. T.W.: investigation and software. B.L.: investigation and validation. D.L.: writing—review and editing, supervision, and data curation. Q.S.: writing—review and editing and supervision. All authors have read and agreed to the published version of the manuscript.

Funding

This work was funded by the National Natural Science Foundation of China (32302679), the Natural Science Foundation of Jiangsu Province (BK20230991), and the China Postdoctoral Foundation under grant number 2024M751440.

Institutional Review Board Statement

Not applicable.

Informed Consent Statement

Not applicable.

Data Availability Statement

The original contributions presented in this study are included in the article/Supplementary Material. Further inquiries can be directed to the corresponding author.

Conflicts of Interest

The authors declare no conflict of interest.

References

  1. Munkvold, G.P. Fusarium species and their associated mycotoxins. Mycotoxigenic Fungi Methods Protoc. 2017, 1542, 51–106. [Google Scholar]
  2. Bakker, M.G.; Acharya, J.; Moorman, T.B.; Robertson, A.E.; Kaspar, T.C. The potential for cereal rye cover crops to host corn seedling pathogens. Phytopathology 2016, 106, 591–601. [Google Scholar] [CrossRef]
  3. Ma, L.-J.; Geiser, D.M.; Proctor, R.H.; Rooney, A.P.; O’Donnell, K.; Trail, F.; Gardiner, D.M.; Manners, J.M.; Kazan, K. Fusarium pathogenomics. Annu. Rev. Microbiol. 2013, 67, 399–416. [Google Scholar] [CrossRef]
  4. Kokkonen, M.; Ojala, L.; Parikka, P.; Jestoi, M. Mycotoxin production of selected Fusarium species at different culture conditions. Int. J. Food Microbiol. 2010, 143, 17–25. [Google Scholar] [CrossRef] [PubMed]
  5. Proctor, R.H.; Hohn, T.M.; McCormick, S.P. Reduced virulence of Gibberella zeae caused by disruption of a trichothecene toxin biosynthetic gene. Mol. Plant-Microbe Interact. 1995, 8, 593–601. [Google Scholar] [CrossRef] [PubMed]
  6. Marroquín-Cardona, A.; Johnson, N.; Phillips, T.; Hayes, A. Mycotoxins in a changing global environment–a review. Food Chem. Toxicol. 2014, 69, 220–230. [Google Scholar] [CrossRef] [PubMed]
  7. Wu, F.; Groopman, J.D.; Pestka, J.J. Public health impacts of foodborne mycotoxins. Annu. Rev. Food Sci. Technol. 2014, 5, 351–372. [Google Scholar] [CrossRef]
  8. Liu, S.; Li, J.; Zhang, Y.; Liu, N.; Viljoen, A.; Mostert, D.; Zuo, C.; Hu, C.; Bi, F.; Gao, H.; et al. Fusaric acid instigates the invasion of banana by Fusarium oxysporum f. sp. cubense TR 4. New Phytol. 2020, 225, 913–929. [Google Scholar] [CrossRef]
  9. D’Alton, A.; Etherton, B. Effects of fusaric acid on tomato root hair membrane potentials and ATP levels. Plant Physiol. 1984, 74, 39–42. [Google Scholar] [CrossRef]
  10. Telles-Pupulin, A.R.; Diniz, S.; Bracht, A.; Ishii-Iwamoto, E. Effects of fusaric acid on respiration in maize root mitochondria. Biol. Plant. 1996, 38, 421–429. [Google Scholar] [CrossRef]
  11. Niehaus, E.-M.; Diaz-Sanchez, V.; Von Bargen, K.; Kleigrewe, K.; Humpf, H.-U.; Limón, M.C. Fusarins and fusaric acid in fusaria. In Biosynthesis and Molecular Genetics of Fungal Secondary Metabolites; Springer: Berlin/Heidelberg, Germany, 2014; pp. 239–262. [Google Scholar]
  12. Gxasheka, M.; Wang, J.; Gunya, B.; Mbanjwa, V.; Tyasi, T.L.; Dlamini, P.; Gao, J. In vitro effect of some commercial fungicides on mycelial growth of Fusarium species causing maize ear rot disease in China. Arch. Phytopathol. Plant Prot. 2021, 54, 557–569. [Google Scholar] [CrossRef]
  13. Chen, L.-H.; Cui, Y.-Q.; Yang, X.-M.; Zhao, D.-K.; Shen, Q.-R. An antifungal compound from Trichoderma harzianum SQR-T037 effectively controls Fusarium wilt of cucumber in continuously cropped soil. Australas. Plant Pathol. 2012, 41, 239–245. [Google Scholar] [CrossRef]
  14. Xu, S.; Liu, Y.-X.; Cernava, T.; Wang, H.; Zhou, Y.; Xia, T.; Cao, S.; Berg, G.; Shen, X.-X.; Wen, Z.; et al. Fusarium fruiting body microbiome member Pantoea agglomerans inhibits fungal pathogenesis by targeting lipid rafts. Nat. Microbiol. 2022, 7, 831–843. [Google Scholar] [CrossRef] [PubMed]
  15. Matsumoto, H.; Fan, X.; Wang, Y.; Kusstatscher, P.; Duan, J.; Wu, S.; Chen, S.; Qiao, K.; Wang, Y.; Ma, B.; et al. Bacterial seed endophyte shapes disease resistance in rice. Nat. Plants 2021, 7, 60–72. [Google Scholar] [CrossRef] [PubMed]
  16. Tao, C.; Wang, Z.; Liu, S.; Lv, N.; Deng, X.; Xiong, W.; Shen, Z.; Zhang, N.; Geisen, S.; Li, R.; et al. Additive fungal interactions drive biocontrol of Fusarium wilt disease. New Phytol. 2023, 238, 1198–1214. [Google Scholar] [CrossRef] [PubMed]
  17. Marzano, M.; Gallo, A.; Altomare, C. Improvement of biocontrol efficacy of Trichoderma harzianum vs. Fusarium oxysporum f. sp. lycopersici through UV-induced tolerance to fusaric acid. Biol. Control 2013, 67, 397–408. [Google Scholar] [CrossRef]
  18. Karlovsky, P. Secondary metabolites in soil ecology. In Secondary Metabolites in Soil Ecology; Springer: Berlin/Heidelberg, Germany, 2008; pp. 1–19. [Google Scholar]
  19. Meca, G.; Soriano, J.; Gaspari, A.; Ritieni, A.; Moretti, A.; Mañes, J. Antifungal effects of the bioactive compounds enniatins A, A1, B, B1. Toxicon 2010, 56, 480–485. [Google Scholar] [CrossRef]
  20. Wang, Q.; Xu, L. Beauvericin, a bioactive compound produced by fungi: A short review. Molecules 2012, 17, 2367–2377. [Google Scholar] [CrossRef]
  21. Woo, S.L.; Hermosa, R.; Lorito, M.; Monte, E. Trichoderma: A multipurpose, plant-beneficial microorganism for eco-sustainable agriculture. Nat. Rev. Microbiol. 2023, 21, 312–326. [Google Scholar] [CrossRef]
  22. Zhang, J.; Miao, Y.; Rahimi, M.J.; Zhu, H.; Steindorff, A.; Schiessler, S.; Cai, F.; Pang, G.; Chenthamara, K.; Xu, Y.; et al. Guttation capsules containing hydrogen peroxide: An evolutionarily conserved NADPH oxidase gains a role in wars between related fungi. Environ. Microbiol. 2019, 21, 2644–2658. [Google Scholar] [CrossRef]
  23. Zhang, J.; Akcapinar, G.B.; Atanasova, L.; Rahimi, M.J.; Przylucka, A.; Yang, D.; Kubicek, C.P.; Zhang, R.; Shen, Q.; Druzhinina, I.S. The neutral metallopeptidase NMP1 of Trichoderma guizhouense is required for mycotrophy and self-defence. Environ. Microbiol. 2016, 18, 580–597. [Google Scholar] [CrossRef]
  24. Tripathi, P.; Singh, P.C.; Mishra, A.; Chauhan, P.S.; Dwivedi, S.; Bais, R.T.; Tripathi, R.D. Trichoderma: A potential bioremediator for environmental clean up. Clean Technol. Environ. Policy 2013, 15, 541–550. [Google Scholar] [CrossRef]
  25. Shelp, B.J.; Aghdam, M.S.; Flaherty, E.J. γ-Aminobutyrate (GABA) regulated plant defense: Mechanisms and opportunities. Plants 2021, 10, 1939. [Google Scholar] [CrossRef]
  26. Zhao, L.; Shu, Y.; Xiao, J.; Lin, R.; Godana, E.A.; Zhang, X.; Zhang, H. Transcriptome analysis reveals mechanisms involved in the enhanced antagonistic efficacy of Sporidiobolus pararoseus Y16 treated by γ-aminobutyric acid. Biol. Control 2022, 176, 105089. [Google Scholar] [CrossRef]
  27. Ji, H.M.; Mao, H.; Li, S.; Feng, T.; Zhang, Z.; Cheng, L.; Luo, S.; Borkovich, K.A.; Ouyang, S. Fol-milR1, a pathogenicity factor of Fusarium oxysporum, confers tomato wilt disease resistance by impairing host immune responses. New Phytol. 2021, 232, 705–718. [Google Scholar] [CrossRef] [PubMed]
  28. Venkatesh, N.; Keller, N.P. Mycotoxins in conversation with bacteria and fungi. Front. Microbiol. 2019, 10, 403. [Google Scholar] [CrossRef] [PubMed]
  29. Jin, X.; Jia, H.; Ran, L.; Wu, F.; Liu, J.; Schlaeppi, K.; Dini-Andreote, F.; Wei, Z.; Zhou, X. Fusaric acid mediates the assembly of disease-suppressive rhizosphere microbiota via induced shifts in plant root exudates. Nat. Commun. 2024, 15, 5125. [Google Scholar] [CrossRef]
  30. Ianiri, G.; Idnurm, A.; Wright, S.A.I.; Durán-Patrón, R.; Mannina, L.; Ferracane, R.; Ritieni, A.; Castoria, R. Searching for genes responsible for patulin degradation in a biocontrol yeast provides insight into the basis for resistance to this mycotoxin. Appl. Environ. Microbiol. 2013, 79, 3101–3115. [Google Scholar] [CrossRef]
  31. Magan, N.; Marcon, A.G.; Samsudin, N.I.P.; Rodríguez-Sixtos, A.; Garcia-Cela, E.; Verheecke-Vaessen, C.; Medina, A. Biological control agents for mycotoxin control: Are they resilient enough? In How Research Can Stimulate the Development of Commercial Biological Control Against Plant Diseases; Springer: Cham, Switzerland, 2020; pp. 295–309. [Google Scholar]
  32. Ianiri, G.; Idnurm, A.; Castoria, R. Transcriptomic responses of the basidiomycete yeast Sporobolomyces sp. to the mycotoxin patulin. BMC Genom. 2016, 17, 210. [Google Scholar] [CrossRef]
  33. Sharma, V.; Bhandari, P.; Singh, B.; Bhatacharya, A.; Shanmugam, V. Chitinase expression due to reduction in fusaric acid level in an antagonistic Trichoderma harzianum S17TH. Indian J. Microbiol. 2013, 53, 214–220. [Google Scholar] [CrossRef]
  34. Singh, V.K.; Upadhyay, R.S. Fusaric acid induced cell death changes in oxidative metabolism of Solanum lycopersicum L. Bot. Stud. 2014, 55, 66. [Google Scholar]
  35. Devnarain, N.; Tiloke, C.; Nagiah, S.; Chuturgoon, A.A. Fusaric acid induces oxidative stress and apoptosis in human cancerous oesophageal SNO cells. Toxicon 2017, 126, 4–11. [Google Scholar] [CrossRef]
  36. Jackson, B.; Brocker, C.; Thompson, D.C.; Black, W.; Vasiliou, K.; Nebert, D.W.; Vasiliou, V. Update on the aldehyde dehydrogenase gene (ALDH) superfamily. Hum. Genom. 2011, 5, 283–303. [Google Scholar] [CrossRef] [PubMed]
  37. Shortall, K.; Durack, E.; Magner, E.; Soulimane, T. Study of ALDH from Thermus thermophilus—Expression, Purification and Characterisation of the Non-Substrate Specific, Thermophilic Enzyme Displaying Both Dehydrogenase and Esterase Activity. Cells 2021, 10, 3535. [Google Scholar] [CrossRef] [PubMed]
  38. Brocker, C.; Vasiliou, M.; Carpenter, S.; Carpenter, C.; Zhang, Y.; Wang, X.; Kotchoni, S.O.; Wood, A.J.; Kirch, H.-H.; Kopečný, D.; et al. Aldehyde dehydrogenase (ALDH) superfamily in plants: Gene nomenclature and comparative genomics. Planta 2013, 237, 189–210. [Google Scholar] [CrossRef] [PubMed]
  39. Michaeli, S.; Fait, A.; Lagor, K.; Nunes-Nesi, A.; Grillich, N.; Yellin, A.; Bar, D.; Khan, M.; Fernie, A.R.; Turano, F.J.; et al. A mitochondrial GABA permease connects the GABA shunt and the TCA cycle, and is essential for normal carbon metabolism. Plant J. 2011, 67, 485–498. [Google Scholar] [CrossRef]
  40. Li, L.; Dou, N.; Zhang, H.; Wu, C. The versatile GABA in plants. Plant Signal. Behav. 2021, 16, 1862565. [Google Scholar] [CrossRef]
  41. Deng, H.; Chen, J.; Gao, R.; Liao, X.; Cai, Y. Adaptive Responses to Oxidative Stress in the Filamentous Fungal Shiraia bambusicola. Molecules 2016, 21, 1118. [Google Scholar] [CrossRef]
  42. Keller, N.P. Fungal secondary metabolism: Regulation, function and drug discovery. Nat. Rev. Microbiol. 2019, 17, 167–180. [Google Scholar] [CrossRef]
  43. Wang, P.; Lopes, L.D.; Lopez-Guerrero, M.G.; van Dijk, K.; Alvarez, S.; Riethoven, J.-J.; Schachtman, D.P.; Xu, G. Natural variation in root exudation of GABA and DIMBOA impacts the maize root endosphere and rhizosphere microbiomes. J. Exp. Bot. 2022, 73, 5052–5066. [Google Scholar] [CrossRef]
Figure 1. The influence of fusaric acid (FSA) on the growth of T. harzianum NJAU4742. (a) An image of T. harzianum NJAU4742 grown under different FSA concentrations. (b) The colony diameter of T. harzianum NJAU4742 under different FSA concentrations. (c) The inhibition rate of T. harzianum NJAU4742 under different FSA concentrations. The strains were inoculated on MM medium supplemented with 0, 0.1, 0.2, or 0.3 mg mL−1 of FSA for 72 h. The data represent the means ± s.d.; n = 3 (b,c). Different letters above the error bars indicate significant groups (p < 0.05), one-way ANOVA, Duncan’s multiple range tests, (b,c).
Jof 11 00542 g001
Figure 2. The transcriptome analysis of T. harzianum NJAU4742 under fusaric acid (FSA) stress. (a) Volcano plot of all identified genes between CK and FSA treatments. Grey circles indicate no regulated expressed genes, green circles denote significantly downregulated genes, and red circles indicate significantly upregulated genes. The horizontal axis represents the log2 fold change (log2FoldChange), and the vertical axis represents the negative base −10 logarithm of the p-value (−log10 p-value). Dashed lines indicate the significance thresholds corresponding to a p-value < 0.05 and an absolute fold change of ≥1.50 (upregulation) or ≤0.67 (downregulation). (b) The primary functional categories of the significant upregulated genes according to the Kyoto Encyclopedia of Genes and Genomes (KEGG) analysis. (c) The bubble map of the top 20 upregulated subcategories belonging to substance metabolism. The size of the circles represents the count of enriched genes. (d) A specific segment of substance metabolism belonging to beta-alanine metabolism was consistently upregulated.
Jof 11 00542 g002
Figure 3. Thaldh3 was responsible for mitigating FSA-induced oxidative stress. (ad) Comparison of intracellular oxidative stress in Trichoderma harzianum NJAU4742 (Th) under the control and FSA (0.3 mg mL−1) treatments. The intracellular SOD activity (a), GSH content (b), GSSG content (c), and GSH /GSSG ratio (d) were measured. (e) The image of T. harzianum NJAU4742 (Th-WT) and its eight mutants grown under the control and FSA treatments. The strains were inoculated on MM medium for 72 h in the control treatment and on MM medium supplemented with 0.3 mg mL−1 FSA for 144 h in the FSA treatment. (f,g) The colony diameter of each strain in the control (f) and FSA (g) treatments. (h) The specific index to reveal specific growth-suppression patterns across individual gene knockout strains under FSA exposure. Each value was calculated using the mean colony diameters from three biological replicates. Since the index was derived from averaged values, statistical significance was not applied to this calculation. The data represent the means ± s.d.; n = 3 (ac,f,g). Significance was determined by using a two-sided Student’s t-test (* p < 0.05). Different letters above error bars indicate a significant group (p < 0.05, one-way ANOVA, Duncan’s multiple range tests) (f,g).
Jof 11 00542 g003
Figure 4. Thaldh3 alleviated FSA-induced oxidative stress through regulating GABA content. (a) An image of T. harzianum NJAU4742 (Th–WT) and ΔThaldh3 grown under FSA, FSA + 3-APA, and FSA + GABA treatments. The strains were inoculated for 96 h in each treatment. (b) The colony diameter of Th-WT and ΔThaldh3 under the FSA, FSA+3-APA, and FSA+GABA treatments. (c) The intracellular GABA content in Th-WT and ΔThaldh3 under the control and FSA treatments. (dg) A comparison of intracellular oxidative stress in Th-WT and ΔThaldh3 under FSA (0.3 mg mL−1) treatments. The intracellular SOD activity (d), GSH content (e), GSSG content (f), and GSH/ GSSG ratio (g) were measured. The data represent the means ± s.d.; n = 3 (bf). Different letters above error bars indicate a significant group (p < 0.05, one-way ANOVA, Duncan’s multiple range tests) (b,c). Significance was determined by using a two-sided Student’s t-test (* p < 0.05) (df).
Jof 11 00542 g004
Figure 5. Thaldh3 influenced the TCA cycle rates to alleviate FSA stress. The CS activity (a), ICDHm activity (b), α-KGDH activity (c), GABA-T activity (d), GAD activity (e), and ATP content (f) were measured in Trichoderma harzianum NJAU4742 (Th–WT) and ΔThaldh3 under the control and FSA treatments. The data represent the means ± s.d.; n = 3 (af). Significance was determined by using a two-sided Student’s t-test (* p < 0.05; n.s.: not significant) (af).
Jof 11 00542 g005
Figure 6. Enhancing T. harzianum NJAU4742 resistance to FSA is beneficial for reducing the tomato disease index. The disease index (a), Th abundance (b), and Fol abundance (c) were measured among different treatments. The data represent the means ± s.d.; n = 3 (ac). Different letters above error bars indicate a significant group (p < 0.05, one-way ANOVA, Duncan’s multiple range tests) (ac).
Jof 11 00542 g006
Figure 7. Conceptual diagram of T. harzianum NJAU4742 mitigating Fusarium wilt disease through enhancing the resistance to fusaric acid (FSA) in the tomato rhizosphere. Under FSA stress, T. harzianum showed an increased expression of Thaldh3, promoting GABA synthesis. The increased GABA further entered the TCA cycle, resulting in elevated ATP content, enhanced fungal growth, and improved antagonistic activity against pathogens. The red arrows indicate the increase in gene expression levels, enzyme activity or the content of specific substances. The green dots represent wild-type Trichoderma (Th-WT), while the blue-centered green dots indicate genetically edited Trichoderma (∆ Thaldh3), and the pink dots represents FSA secreted by F. oxysporum.
Jof 11 00542 g007
Disclaimer/Publisher’s Note: The statements, opinions and data contained in all publications are solely those of the individual author(s) and contributor(s) and not of MDPI and/or the editor(s). MDPI and/or the editor(s) disclaim responsibility for any injury to people or property resulting from any ideas, methods, instructions or products referred to in the content.

