Article

Fusarium musae Infection in Animal and Plant Hosts Confirms Its Cross-Kingdom Pathogenicity

1
Department of Food, Environmental and Nutritional Sciences, University of Milan, 20133 Milan, Italy
2
Department of Imaging and Pathology, KU Leuven, 3000 Leuven, Belgium
3
Department of Microbiology, Immunology and Transplantation, KU Leuven, 3000 Leuven, Belgium
4
Department of Laboratory Medicine and National Reference Center for Mycosis, UZ Leuven, 3000 Leuven, Belgium
*
Authors to whom correspondence should be addressed.
J. Fungi 2025, 11(2), 90; https://doi.org/10.3390/jof11020090
Submission received: 23 November 2024 / Revised: 9 January 2025 / Accepted: 21 January 2025 / Published: 24 January 2025
(This article belongs to the Special Issue Fusarium spp.: A Trans-Kingdom Fungus, 2nd Edition)

Abstract

:
Fusarium musae is a pathogen belonging to the Fusarium fujikuroi species complex, isolated from both banana fruits and immunocompromised patients, therefore hypothesized to be a cross-kingdom pathogen. We aimed to characterize F. musae infection in plant and animal hosts to prove its cross-kingdom pathogenicity. Therefore, we developed two infection models, one in banana and one in Galleria mellonella larvae, as a human proxy for the investigation of cross-kingdom pathogenicity of F. musae, along with accurate disease indexes effective to differentiate infection degrees in animal and plant hosts. We tested a worldwide collection of F. musae strains isolated both from banana fruits and human patients, and we provided the first experimental proof of the ability of all strains of F. musae to cause significant disease in banana fruits, as well as in G. mellonella. Thereby, we confirmed that F. musae can be considered a cross-kingdom pathogen. We, thus, provide a solid basis and toolbox for the investigation of the host–pathogen interactions of F. musae with its hosts.

1. Introduction

Fusarium musae, a pathogenic species within the Fusarium fujikuroi species complex, was formally recognized in 2011 as a species closely related to but distinct from F. verticillioides [1]. It was first identified as a plant pathogen and recognized as one of the causative agents of crown rot in banana fruits. Cases of infection with F. musae have been reported in banana fruits in Hungary [2], Neotropical countries [3,4,5], and the Philippines [1]. Later, it was also described as a pathogen in human patients, where it caused keratitis and skin infections, as well as systemic infections in immunocompromised patients [6,7,8,9]. Cases of infection with F. musae have been reported in Italy, Greece [6], France, Belgium [9], and the USA [10]. Isolation of F. musae from different hosts raised suspicion that F. musae could be a potential cross-kingdom pathogen, further strengthened by its ability to cause infection in both bananas and humans. Plant fungal pathogens are already known as an emerging danger to both food production and ecosystem balance by causing food losses, impacting agricultural productivity, and contaminating food with harmful mycotoxins. But recently, it has become evident that some agricultural fungi may have evolved the ability to infect human hosts, posing direct infection risks and further endangering human health. It is yet unclear if and how F. musae transfers from one host to the other. Triest and Hendrickx suggested a role for bananas as carriers of spores leading to diseases in immunocompromised patients in banana-consuming countries [8].
So far, there is no experimental proof of the ability of F. musae plant strains to invade an animal (human) host and vice versa, and it has not been shown that F. musae possesses the essential virulence factors to cause infection in both a plant and animal host. It is, nevertheless, important to prove infection in relevant hosts across different kingdoms to confirm cross-kingdom pathogenicity. This process ensures compliance with Koch’s postulates, which are essential for confirming the pathogenicity of a species on specific hosts [11,12]. Indeed, exploring the literature about fungal cross-kingdom pathogens, the classification of a pathogen as cross-kingdom is mainly based on isolation from different hosts and taxonomic criteria that are constantly evolving and need frequent checks and updates. Experimental evidence supporting infection across multiple hosts is limited, with only a few studies offering such data [13,14]. Experimentally demonstrating the ability of a fungal species to cause infection in the host is a crucial step in the characterization and classification of the species as a pathogen.
On the other hand, by setting up relevant experimental model systems, one can investigate the virulence factors that make up a species’ ability to infect hosts belonging to different kingdoms. Moreover, applications can be envisaged for developing strategies that may prevent infection risks from contaminated food and agricultural losses.
With this work, we provide the first experimental evidence that a collection of F. musae strains with different host origins can infect both animals and plants. We aimed to evaluate and compare F. musae pathogenicity across kingdoms, demonstrating that strains isolated from different hosts have the ability to invade both kingdoms. To reach this goal, we established two infection models that could represent the plant host and the animal host [15,16,17,18,19].

2. Materials and Methods

2.1. Fungal Strains

For this work, we used a collection of nineteen strains of Fusarium musae, which included strains isolated from different hosts and countries of origin (Table 1).

2.2. Temperature Assay In Vitro

To determine the potential ability of F. musae strains to grow at different temperatures, we incubated all strains on Petri dishes containing V8 media (200 mL/L V8 juice Campbell, UK; 2 g/L CaCO3 Carlo Erba Reagents S.r.l, Cornaredo, MI, Italy; 15 g/L agar NeoFroxx GmbH, Einhausen, Germany) at 24 °C and 37 °C for five days. Growing rate was assessed by measuring the diameter of the colony with a ruler on the reverse of the plate; for each colony, we calculated the average value of two measurements at 90° angles to each other. We considered the average value of tree replicates.

2.3. Banana Fruit Infection

For the infection in banana fruits, we considered 20 infection sites for each strain: 4 banana fruits, each infected with 5 sterile toothpicks as previously described [20]. Infection was performed with the entire collection of F. musae strains. Control groups with sterile water and Fusarium oxysporum f.sp. lycopersici were included.
Strains were recovered from storage on V8 media plates by inoculating a few pieces of mycelium into CMC liquid media (15 g/L carboxymethylcellulose sodium (CMC) Sigma-Aldrich (St. Louis, MO, USA); 1 g/L NH4NO3 Carlo Erba Reagents S.r.l, Cornaredo, MI, Italy; 1 g/L KH2PO4 Sigma-Aldrich; 0.5 g/L MgSO4-7H2O Sigma-Aldrich; 1 g/L Yeast Extract Thermo Fisher Scientific Inc. (Waltham, MA, USA)) and incubating at 25 °C in the dark while stirring at 150 rpm. After 5 days, spores were harvested by filtering through one-fold Miracloth, and concentrations were estimated using a Burker counting chamber to obtain the concentration of 105 spores/mL for infection. Fresh conidia were used for every experiment. Healthy, organic bananas of the cultivar Cavendish with similar maturation level (green banana) obtained from Ecuador were used on the infection day; they were sterilized by immersion in 0.7% sodium hypochlorite (3 min), washed in deionized sterile water (3 min), and dried under a sterile laminar flow hood. Sterile toothpicks were immersed for 2 min in conidia solution and skewered in bananas for infection. Five toothpicks were evenly positioned per fruit, deep enough to pierce the peel and reach the pulp surface. Subsequently, fruits were covered by plastic bags and incubated at 20 °C in the dark for 10 days. After 10 days, levels of infection were estimated by measuring the diameter of the spots growing on the banana fruits, as described in Figure 1.
Infections were performed in three independent experimental repeats. In two of the replicates, all five toothpicks per fruit were soaked in either a conidia suspension from the same strain or in water. In the third replicate, each of the five infection points on each fruit received a different treatment (either conidia suspension or water) to account for any effect the individual fruits might have on infection severity.
We assessed infection in banana fruits by formulating a disease severity index that best represents the disease considering the diameter of the halos as well as browning in each infection point. The index was calculated as follows:
d i s e a s e   s e v e r i t y   i n d e x = S 2 + D   c m 2
S = based on the scale of browning; D = diameter of the spot (cm).

2.4. G. mellonella Larvae Infection Model

For infection in G. mellonella, we bought specimens of G. mellonella at the larval final stage from Biosystems Technology Ltd. (Tanners’ Yard, Crediton, UK). Larvae were maintained at 16 °C and infected within 7 days from arrival at our laboratory. Only healthy larvae were selected and used for the infection. Fungal strains listed in Table 1 were recovered from long-term storage at −80 °C by inoculating them in Petri dishes containing solid Sabouraud agar (Sigma-Aldrich) and incubating at 24 °C for 5 days. On the fifth day, the conidia were harvested directly from the plate by gently flooding the surface with 1 mL of phosphate-buffered saline (PBS) solution (Thermo Fisher Scientific). Concentrations were estimated using a Burker chamber, and appropriate dilutions were made to obtain the required concentration of 105 conidia/mL for infection. Per strain, groups of 10 larvae were infected with 1 × 10⁵ conidia/mL in a volume of 10 μL of each inoculum suspension. The infection was performed with a 1 mL insulin syringe into the last left proleg of the larva. Larvae were incubated at the desired temperature (24 °C, 28 °C, or 37 °C) in Petri dishes for up to 7 days. PBS and F. oxysporum were used as controls.

2.5. Temperature Assay in G. mellonella Larvae

Seven representative strains were chosen for temperature assay in G. mellonella. We chose plant strains F31, NRRL 28893, and MUCL 51371 and human strains IUM 11-0508, NRRL 43601, IHEM 20180, and NRRL 43658. The infection was performed as described before, and larvae were incubated at 24 °C, 28 °C, and 37 °C for 7 days.
Twice a day, all larvae were observed, and each larva was awarded a health score based on the level of activity, pigmentation, cocoon formation, and state of life according to the scoring system established by Loh et al. (Table 2) [21].
Infections were carried out independently two times. After scoring, dead larvae were removed from the Petri dishes and excluded for the following checkpoints. Dead larvae were placed at −20 °C for at least 48 h before being disposed of.

2.6. Infection Assay in G. mellonella Larvae

Infection in G. mellonella was performed with the entire collection of F. musae strains using groups of 10 larvae infected with 10 μL of conidia suspension at 1 × 10⁵ conidia/mL, as described before. Larvae were incubated at 28 °C for 7 days, and the level of infection was scored daily [21].
To be able to compare infection severity in the G. mellonella model to the data obtained from the banana model, we transformed the health scores used from evaluating larval health into a measure of disease severity as follows:
Disease   severity   index = 9 S × N 10
S (sum)= A + M + C + L; A (activity) = value from 0 to 3; M (melanization) = value from 0 to 4; C (cocoon formation) = value from 0 to 1; L (survival) = 0 (dead), 1 (alive); N = number of dead larvae.
The disease severity index represents the severity of the disease on the final observation day in each infection point, where single infection points are represented by single larvae. Consequently, the disease severity index was assigned to each larva and calculated based on “S”, which corresponds to the health score obtained on the 7th day post-infection [21], while “N” corresponds to the total number of larvae killed by the strain, and with 10 in the denominator, we account for the standard inclusion of 10 larvae per experimental group.
Specifically, we consider larval death a strong marker of disease severity; thus, we gave it greater weight in the formula. The resulting value reflects the overall health status of the larvae at the end of the observation period. If no larval deaths are observed 7 days post-infection, this suggests that the group remains largely healthy and that the infectious strain exhibits low pathogenicity.

2.7. Statistical Analysis

Statistical analysis of infection of bananas and G. mellonella larvae was performed on the disease severity indexes obtained. The values obtained were normalized by dividing them by the average value obtained for strain F31 (used as reference strain) and plotted using the data analysis framework implemented in the online software Estimation Stats [22], with H2O or F. oxysporum as shared control under default parameters. Statistical analysis was also performed by the data analysis framework estimation stats.
For the health score in G. mellonella, GraphPad Software (Boston, MA, USA, version 8.0.2) was used to plot data obtained from infection at different temperatures, and mixed-effects two-way ANOVA analysis was performed to analyze longitudinal data. Survival analysis was also performed on G. mellonella infection using the log-rank (Mantel–Cox) test; the curve was plotted with the Kaplan–Meier method using SPSS Statistics (version 27).
For quantitative comparison of data from banana and larvae infection, data plots and statistical analysis were performed using Superplotsofdata [23].

3. Results

3.1. F. musae Can Grow at 24 °C as Well as at 37 °C

To support the hypothesis of F. musae as a potential cross-kingdom pathogen, we first tested in vitro the ability of F. musae strains to survive and spread at 24 °C and 37 °C. At both temperatures, all F. musae strains were able to grow, confirming the ability of the species to proliferate at environmental temperature as well as at the human body’s physiological temperature (Table S1). Strain F31 (banana) and strain IUM 11-0507 (human) showed equal growth rates at both temperatures with no statistically significant difference in the diameter of the colony. All the other strains grew significantly slower at 37 °C, observed as a reduction in the diameter of the colonies compared to the growth at 24 °C (Table S1). Overall, the host origin of the strains (human or banana) and their geographical origin had no evident effect on the growth of the colonies at different temperatures. In vitro results demonstrated that F. musae, regardless of being isolated from plant or human hosts, possessed the ability to grow at 24 as well as 37 °C, which supports the fact that F. musae is a potential cross-kingdom pathogen.

3.2. F. musae Is Pathogenic to Banana Fruits

To prove and quantify the capability of F. musae to cause infection in a plant pathosystem, we established an infection model with banana fruits. We chose the Cavendish banana fruit, the primary cultivar affected by F. musae and the main banana cultivar transported and distributed in banana-consuming countries.
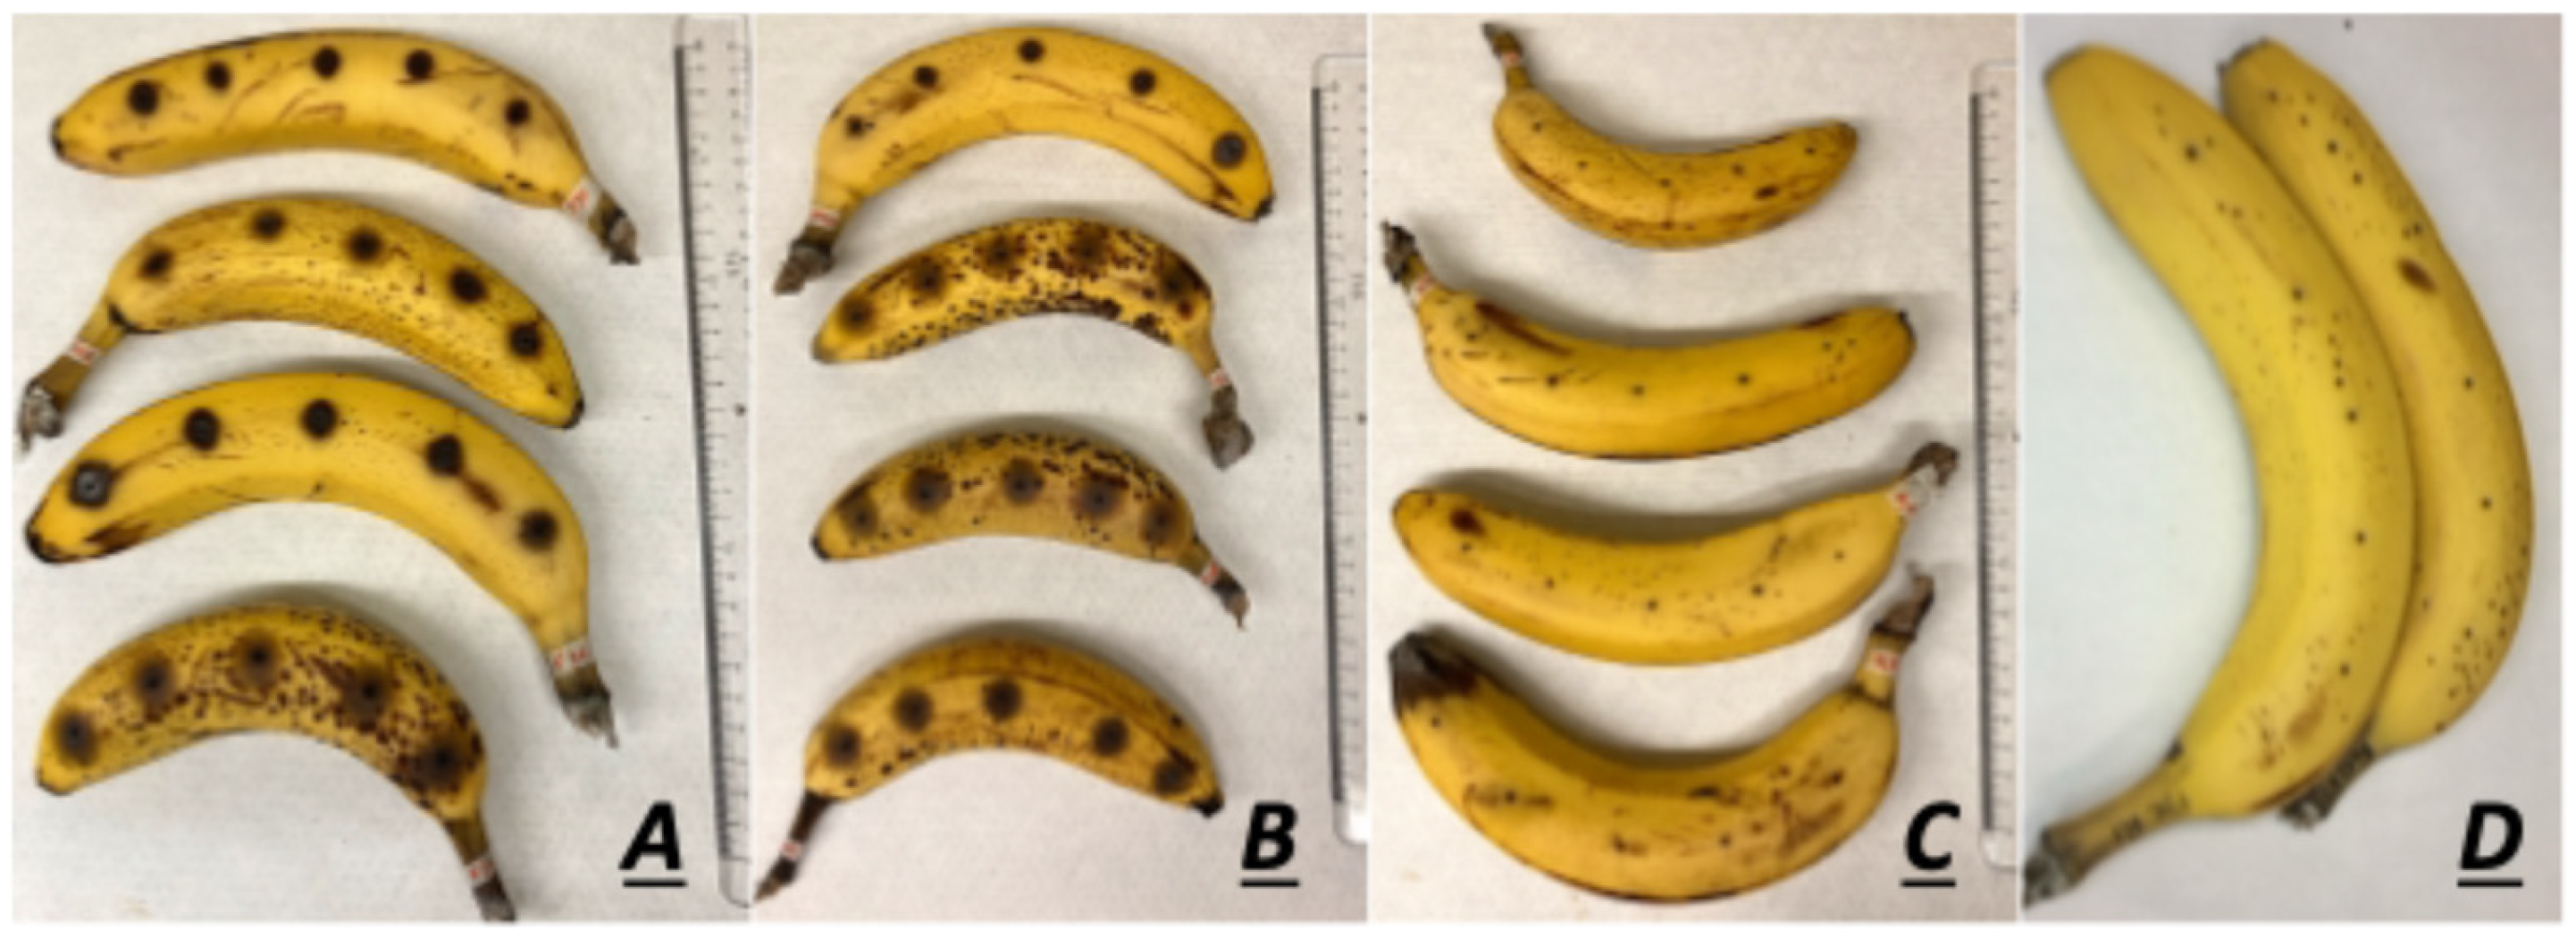
All nineteen strains presented brown halos surrounding the point of toothpick insertion, with some cases also showing mycelium formation (Figure 2).
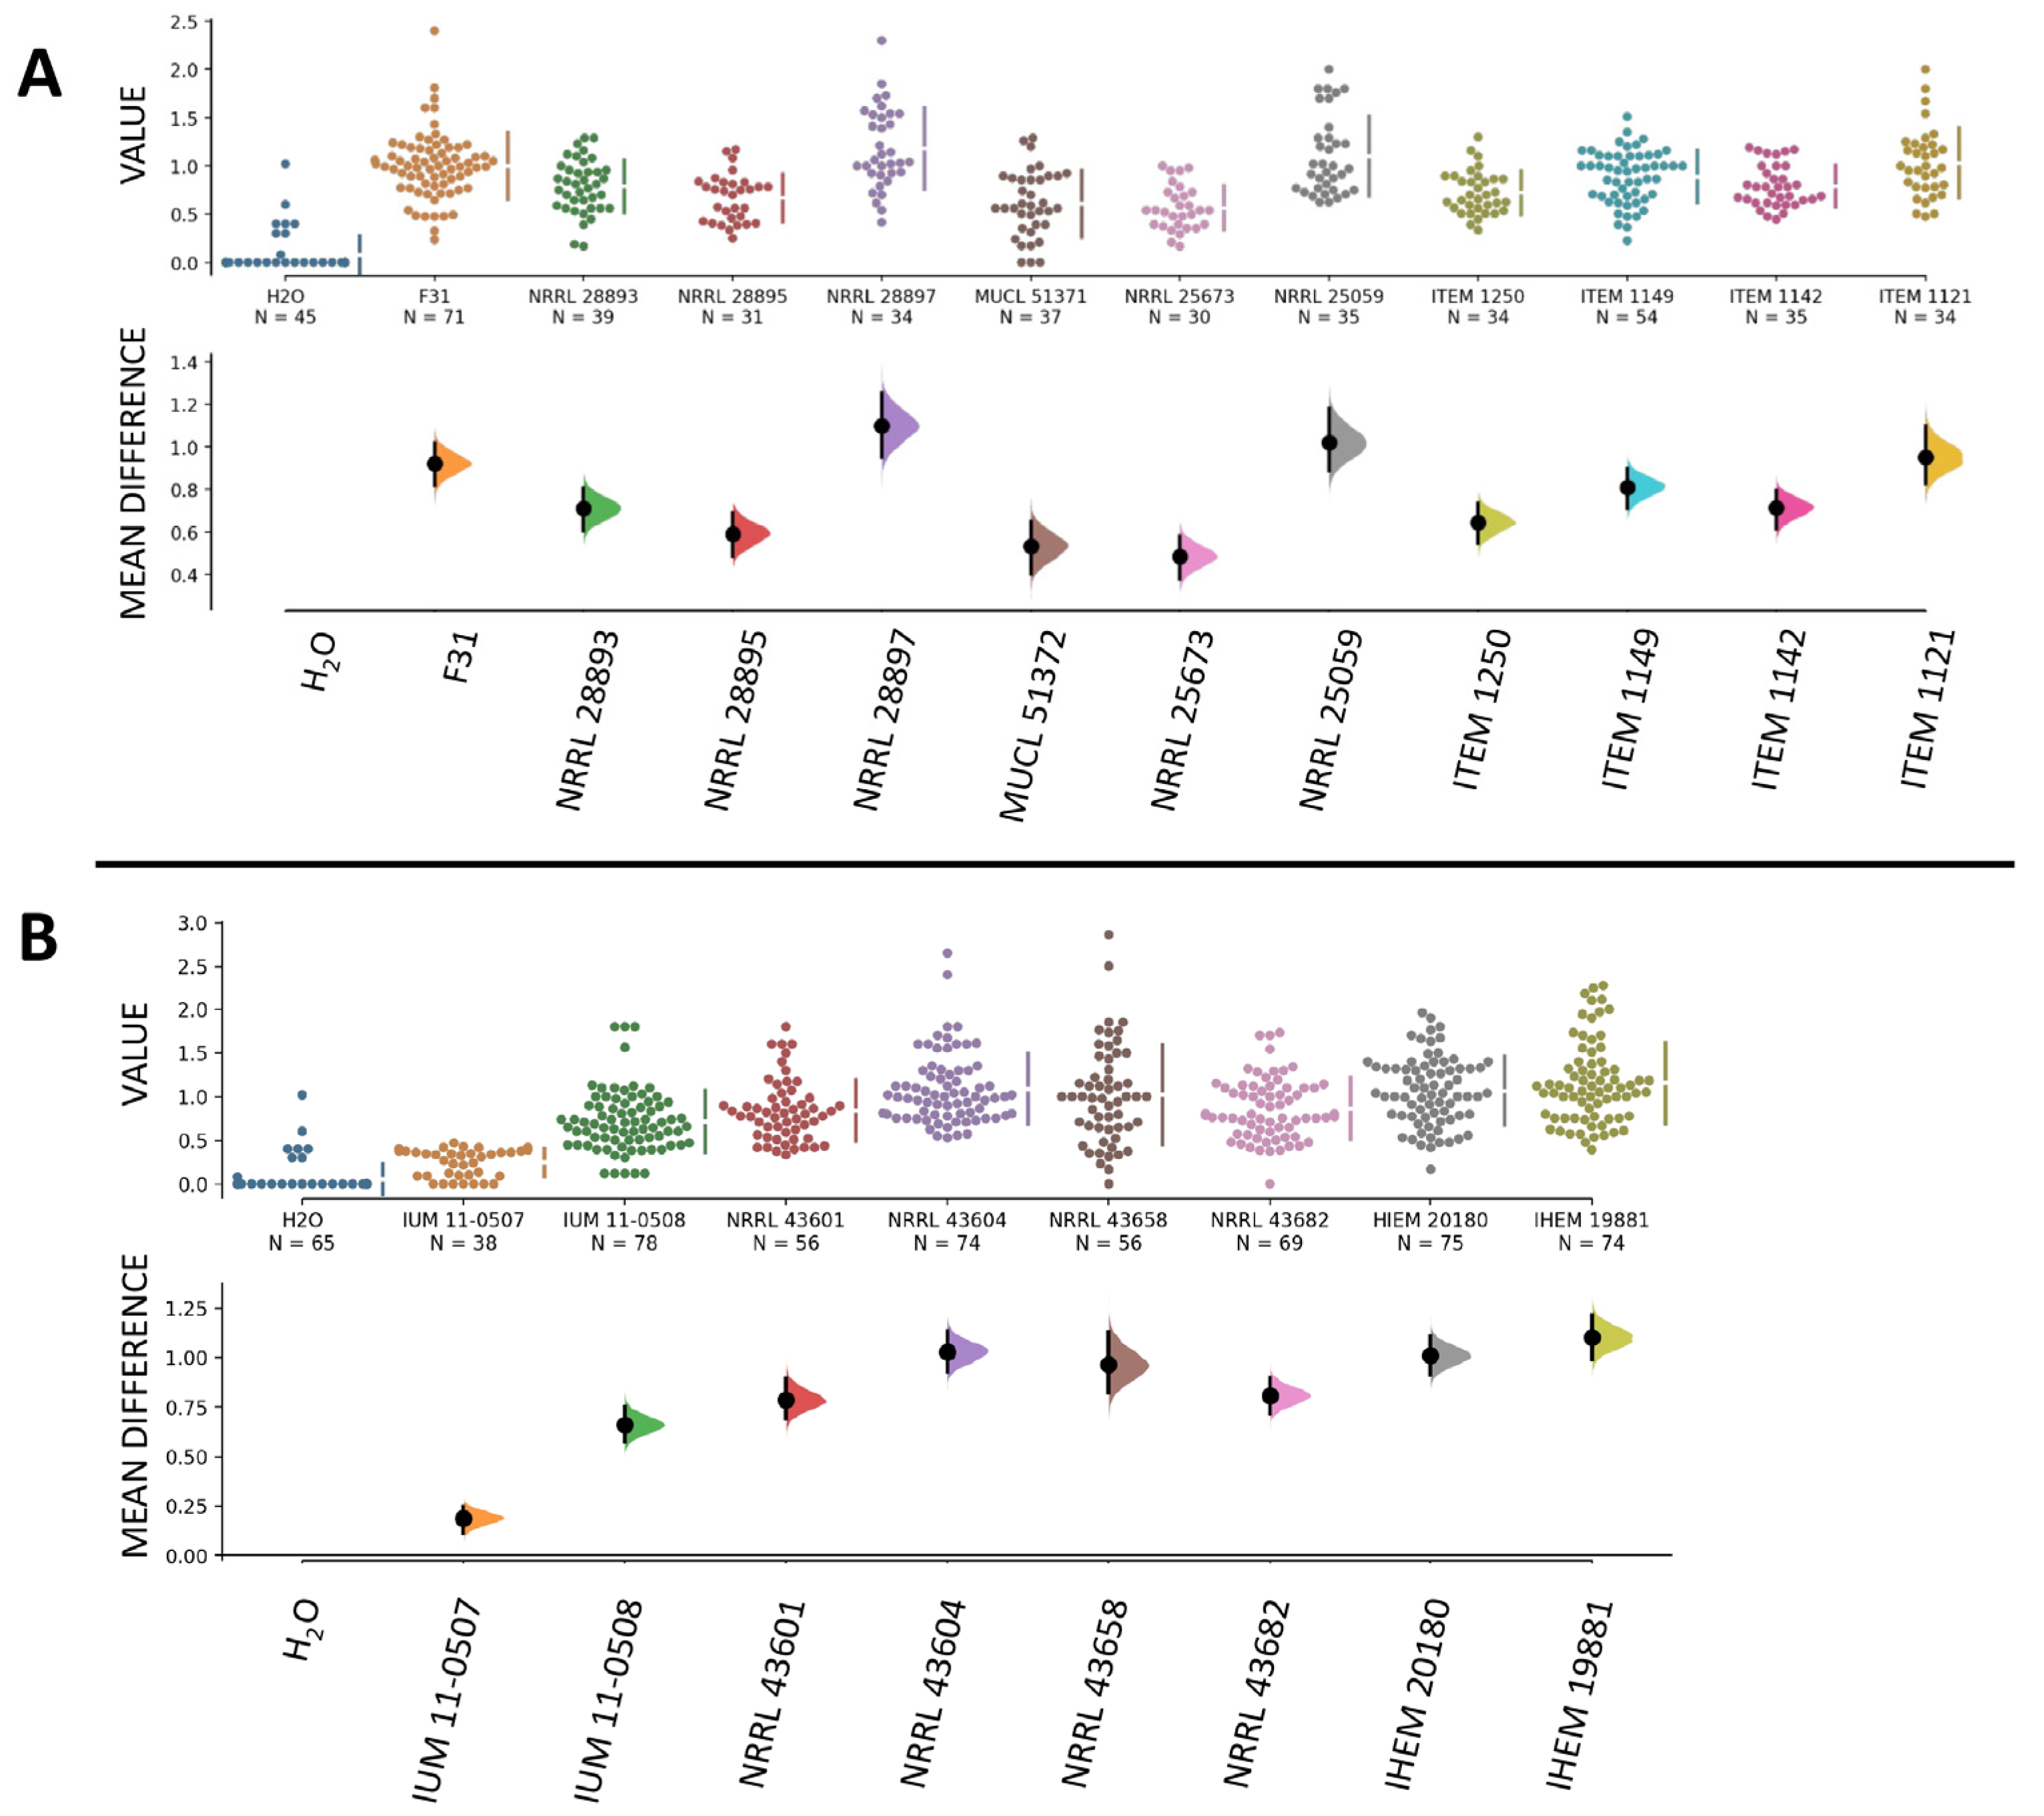
Additionally, disease severity indexes of all tested strains were significantly higher compared to the infection with H2O used as control (Figure 3), demonstrating that they were all able to cause significant disease in banana fruits. Specifically, strain NRRL 19881 (human, France) caused the highest level of infection, followed by NRRL 28897 (banana, Mexico) and NRRL 43604 (human, USA), while the lowest disease was caused by strain IUM 11-0507 (human, Greece) followed by NRRL 20673 (banana, Guatemala).
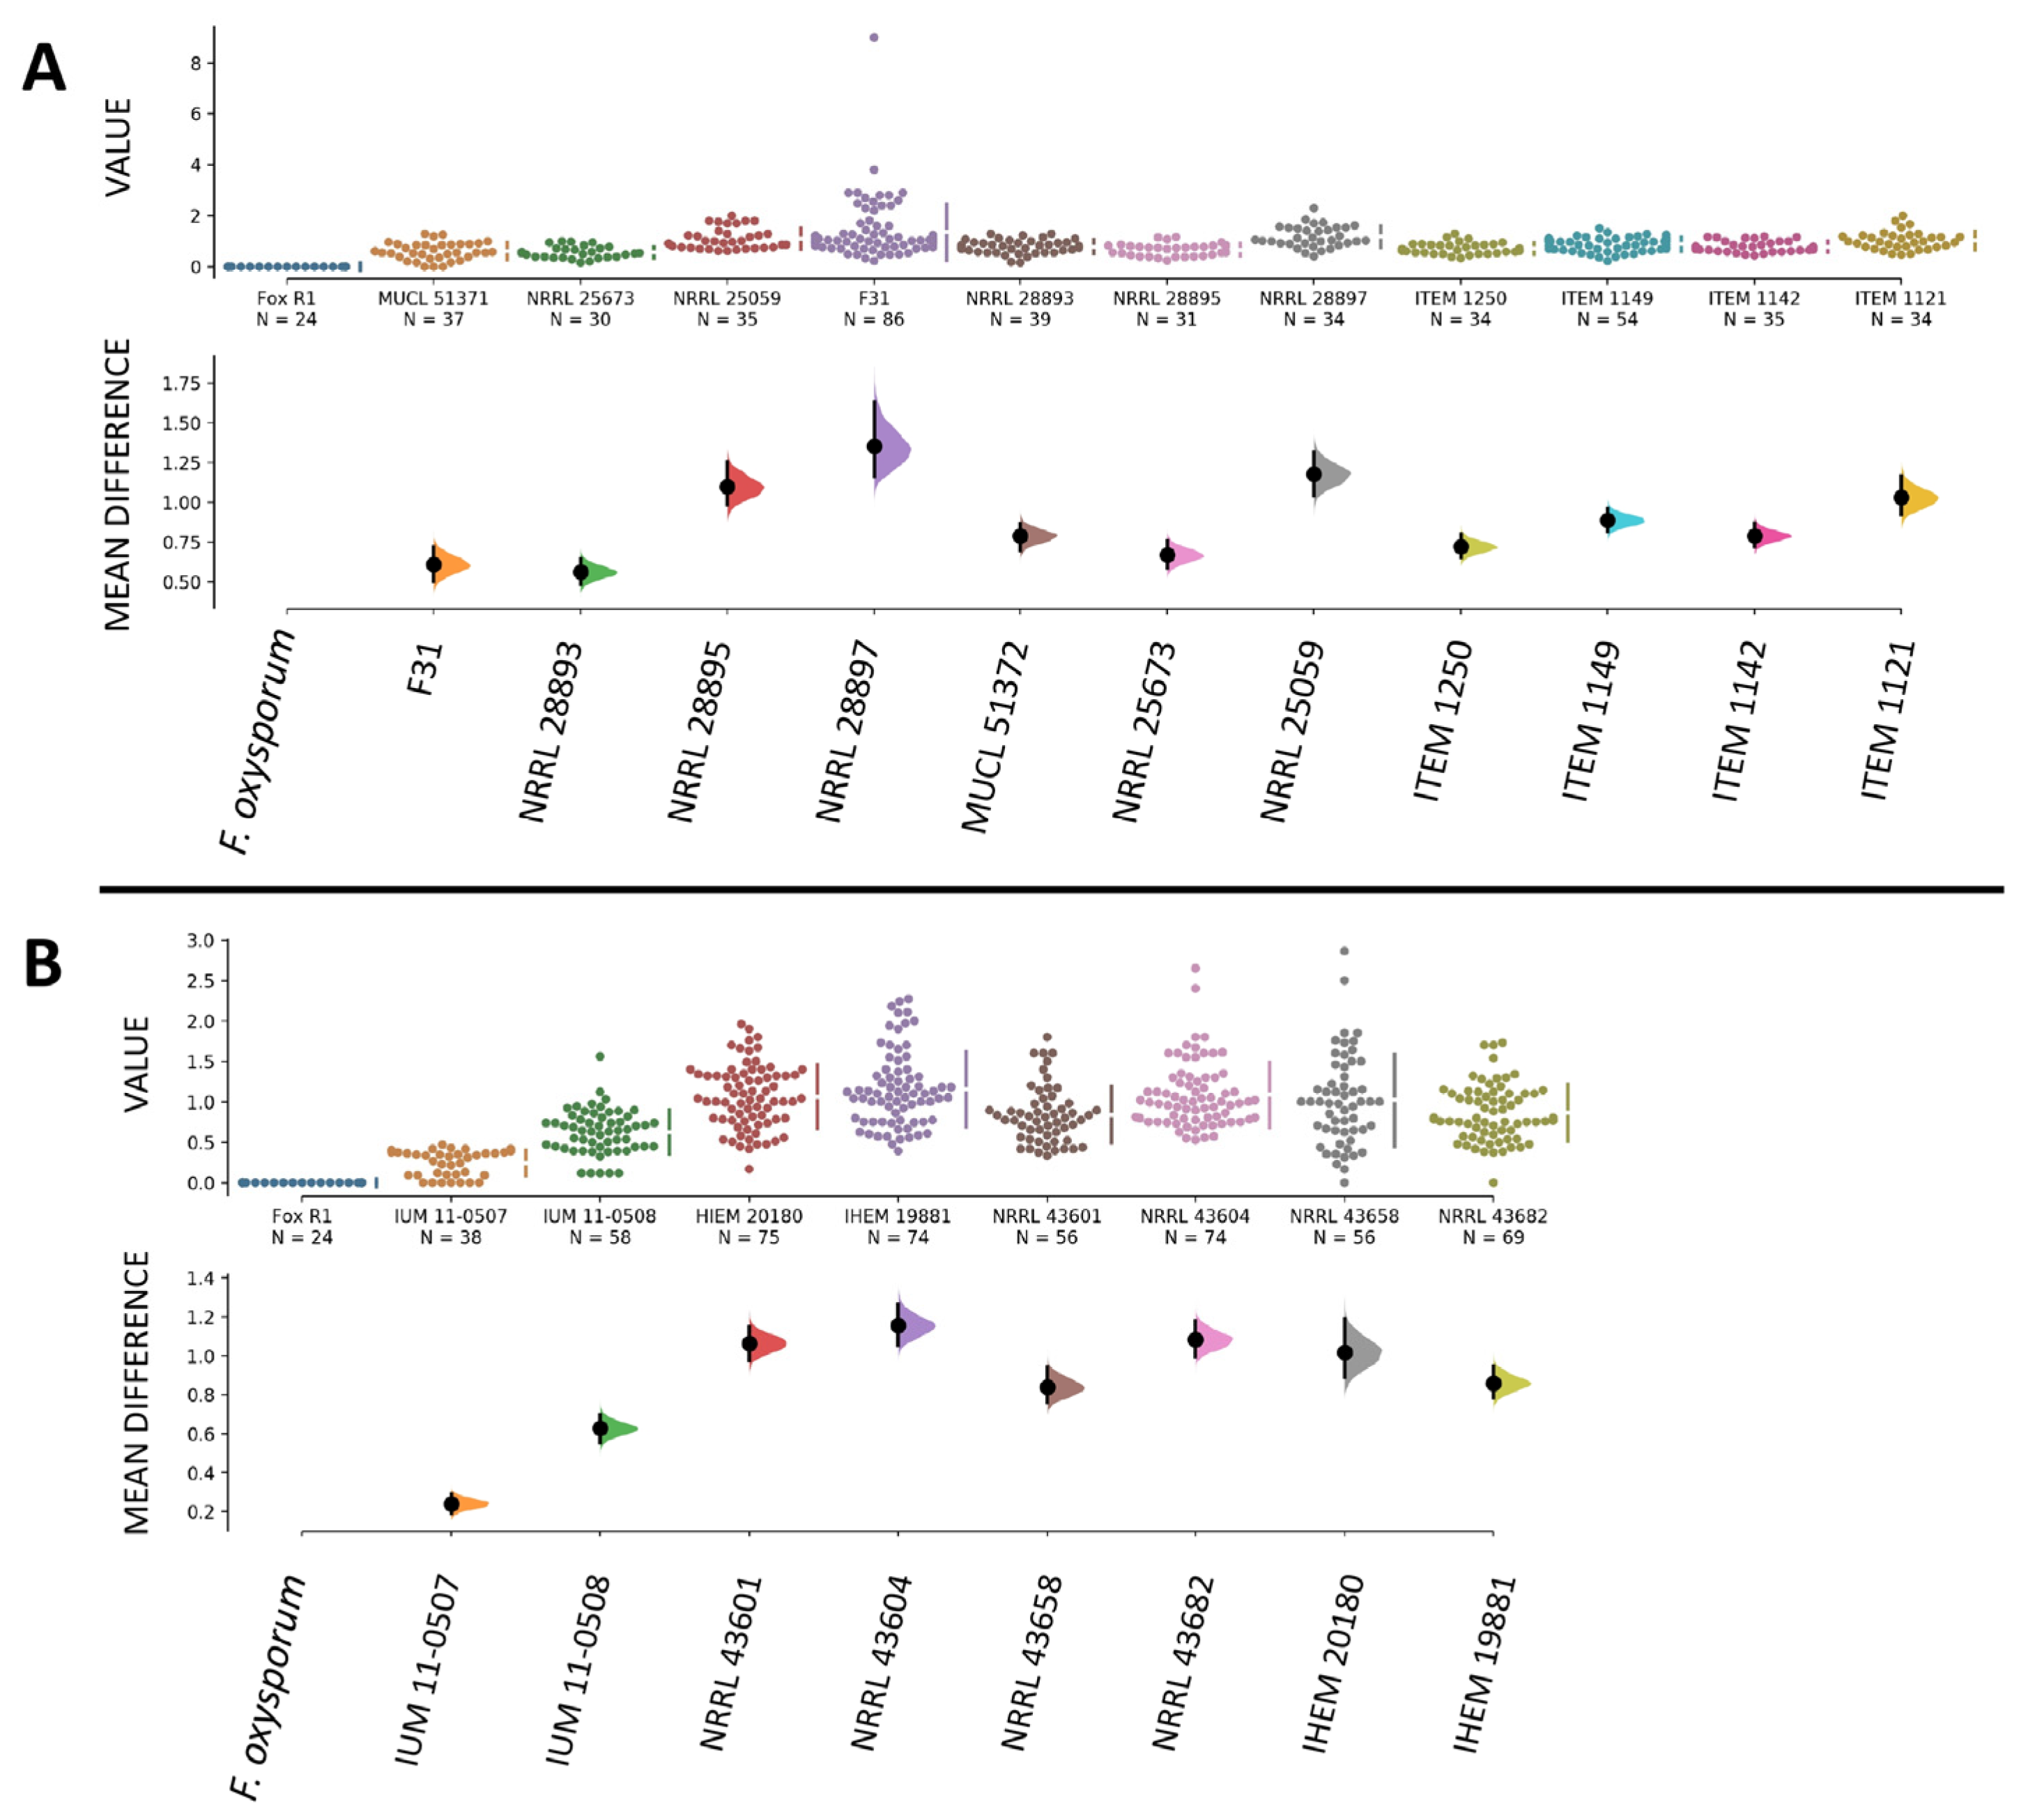
Overall, infection levels were comparable among all strains of our collection, and we did not observe differences in infection severity caused by strains isolated from plants and humans, as all showed similar abilities to invade a plant host such as the banana fruit. When comparing the pathogenicity of F. musae with the pathogenicity of F. oxysporum, as expected, all strains of F. musae showed high levels of disease severity compared to F. oxysporum that caused no symptoms in fruits with a disease severity score equal to 0 (Figure 4).
Taken together, we presented the first experimental evidence of F. musae pathogenicity in a plant host, establishing a successful model for infection. All tested F. musae strains isolated from human patients showed significant infection in a plant pathosystem. In addition, infection levels were comparable between plant and human strains, regardless of geographical origin, suggesting that no subgroups were present within the population based on the original source.

3.3. F. musae Causes Observable Disease in Larvae of G. mellonella at Environmental and Mammalian Physiological Body Temperature

To prove the ability of F. musae to invade an animal pathosystem, we built an infection model using G. mellonella larvae and assessed the ability of the species to cause infection at environmental as well as mammalian physiological body temperatures. We used the great wax moth or the honeycomb moth as ethically responsible and relevant animal models with immune systems similar to mammals, which is ideal for studying host–pathogen interactions. One of the many advantages of using G. mellonella as a host model is that the larvae can tolerate incubation at elevated temperatures (such as 37 °C). Furthermore, as we demonstrated, F. musae strains grow in vitro at both environmental and human body temperatures. Therefore, we tested different incubation temperatures to establish our F. musae-G. mellonella infection model.
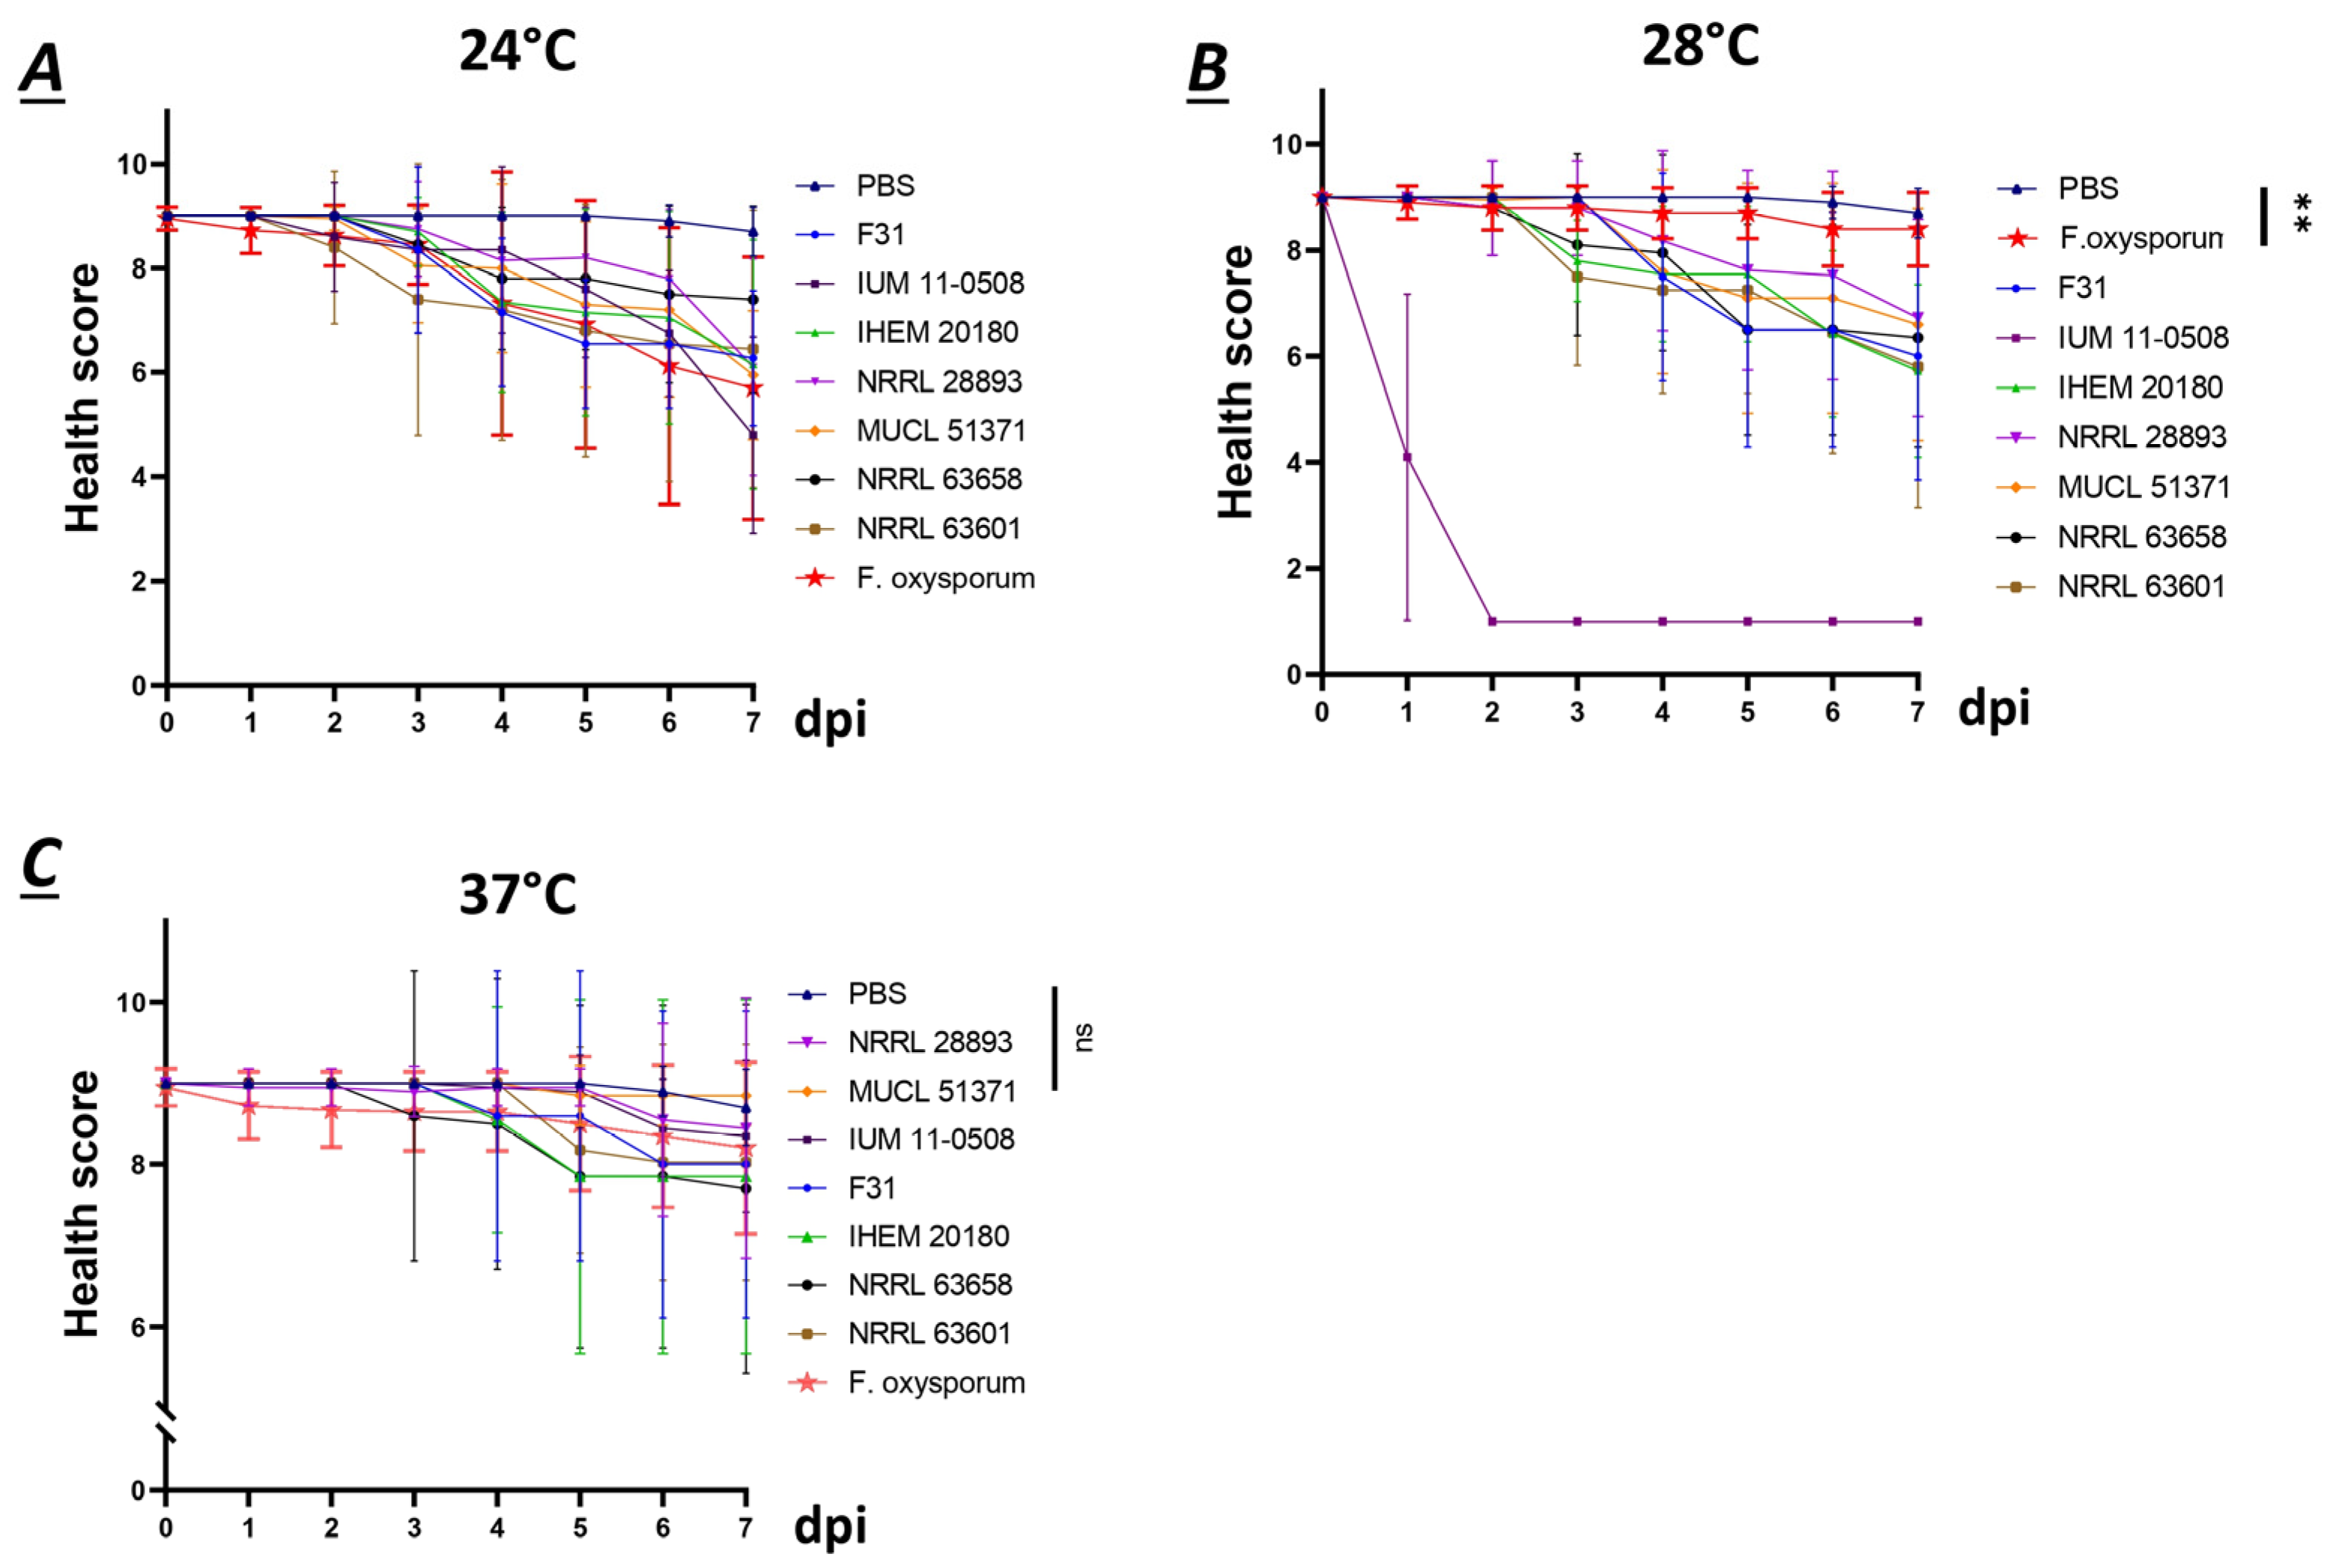
All selected seven strains of F. musae were able to cause significant disease in the larvae (Figure 5).
Specifically, strains F31, NRRL 43601, NRRL 43658, and IHEM 20180 showed similar infection levels across the three temperatures. At 24 °C and 28 °C, we observed the first decline in health scores around three days post-infection, decreasing to approximately 7, which reflected reduced larval activity and the appearance of melanized spots. Health continued to decline gradually, reaching values between 5 and 6 by the end of the observation period. At 37 °C, larvae began showing symptoms 4 days post-infection, with health scores decreasing to around 7 only by the end of the observation period. Human strain IUM 11-0508 presented significantly different activity at the three temperatures, with the highest virulence at 28 °C; at this temperature, larvae were completely melanized and dead the day after infection. Plant strains MUCL 51371 and NRRL 28893 showed a significantly reduced activity at 37 °C, with no visible symptoms, compared to 24 and 28 °C, where it exhibited great disease, and health score reached values between 5 and 6. Overall, at 37 °C, the virulence of all strains was reduced compared to lower temperatures, but almost all strains presented visible disease at all temperatures, suggesting that they potentially had virulence factors needed for the infection of an animal host at environmental temperature as well as at human body temperature. When compared to infection with F. oxyxsporum, F. musae presented significantly higher virulence at 28 °C, which we identified as the optimal temperature for infection of G. mellonella with F. musae. Meanwhile, at 37 °C and 24 °C, the behavior between the two species was comparable.
Altogether, the results provided the first experimental proof of F. musae causing infection in an animal pathosystem at different temperatures. All strains responded similarly to the tested temperatures; strains with both plant and human origins caused evident symptoms in G. mellonella, making it a relevant model for investigating F. musae, which can be extended to other Fusarium species as well.

3.4. Human and Plant Strains of F. musae Cause Comparable Levels of Infection in G. mellonella Larvae

To observe if and how the origin of the strains could be related to a specific disease severity or phenotype in G. mellonella, we evaluated the disease severity caused by the entire population of F. musae strains.
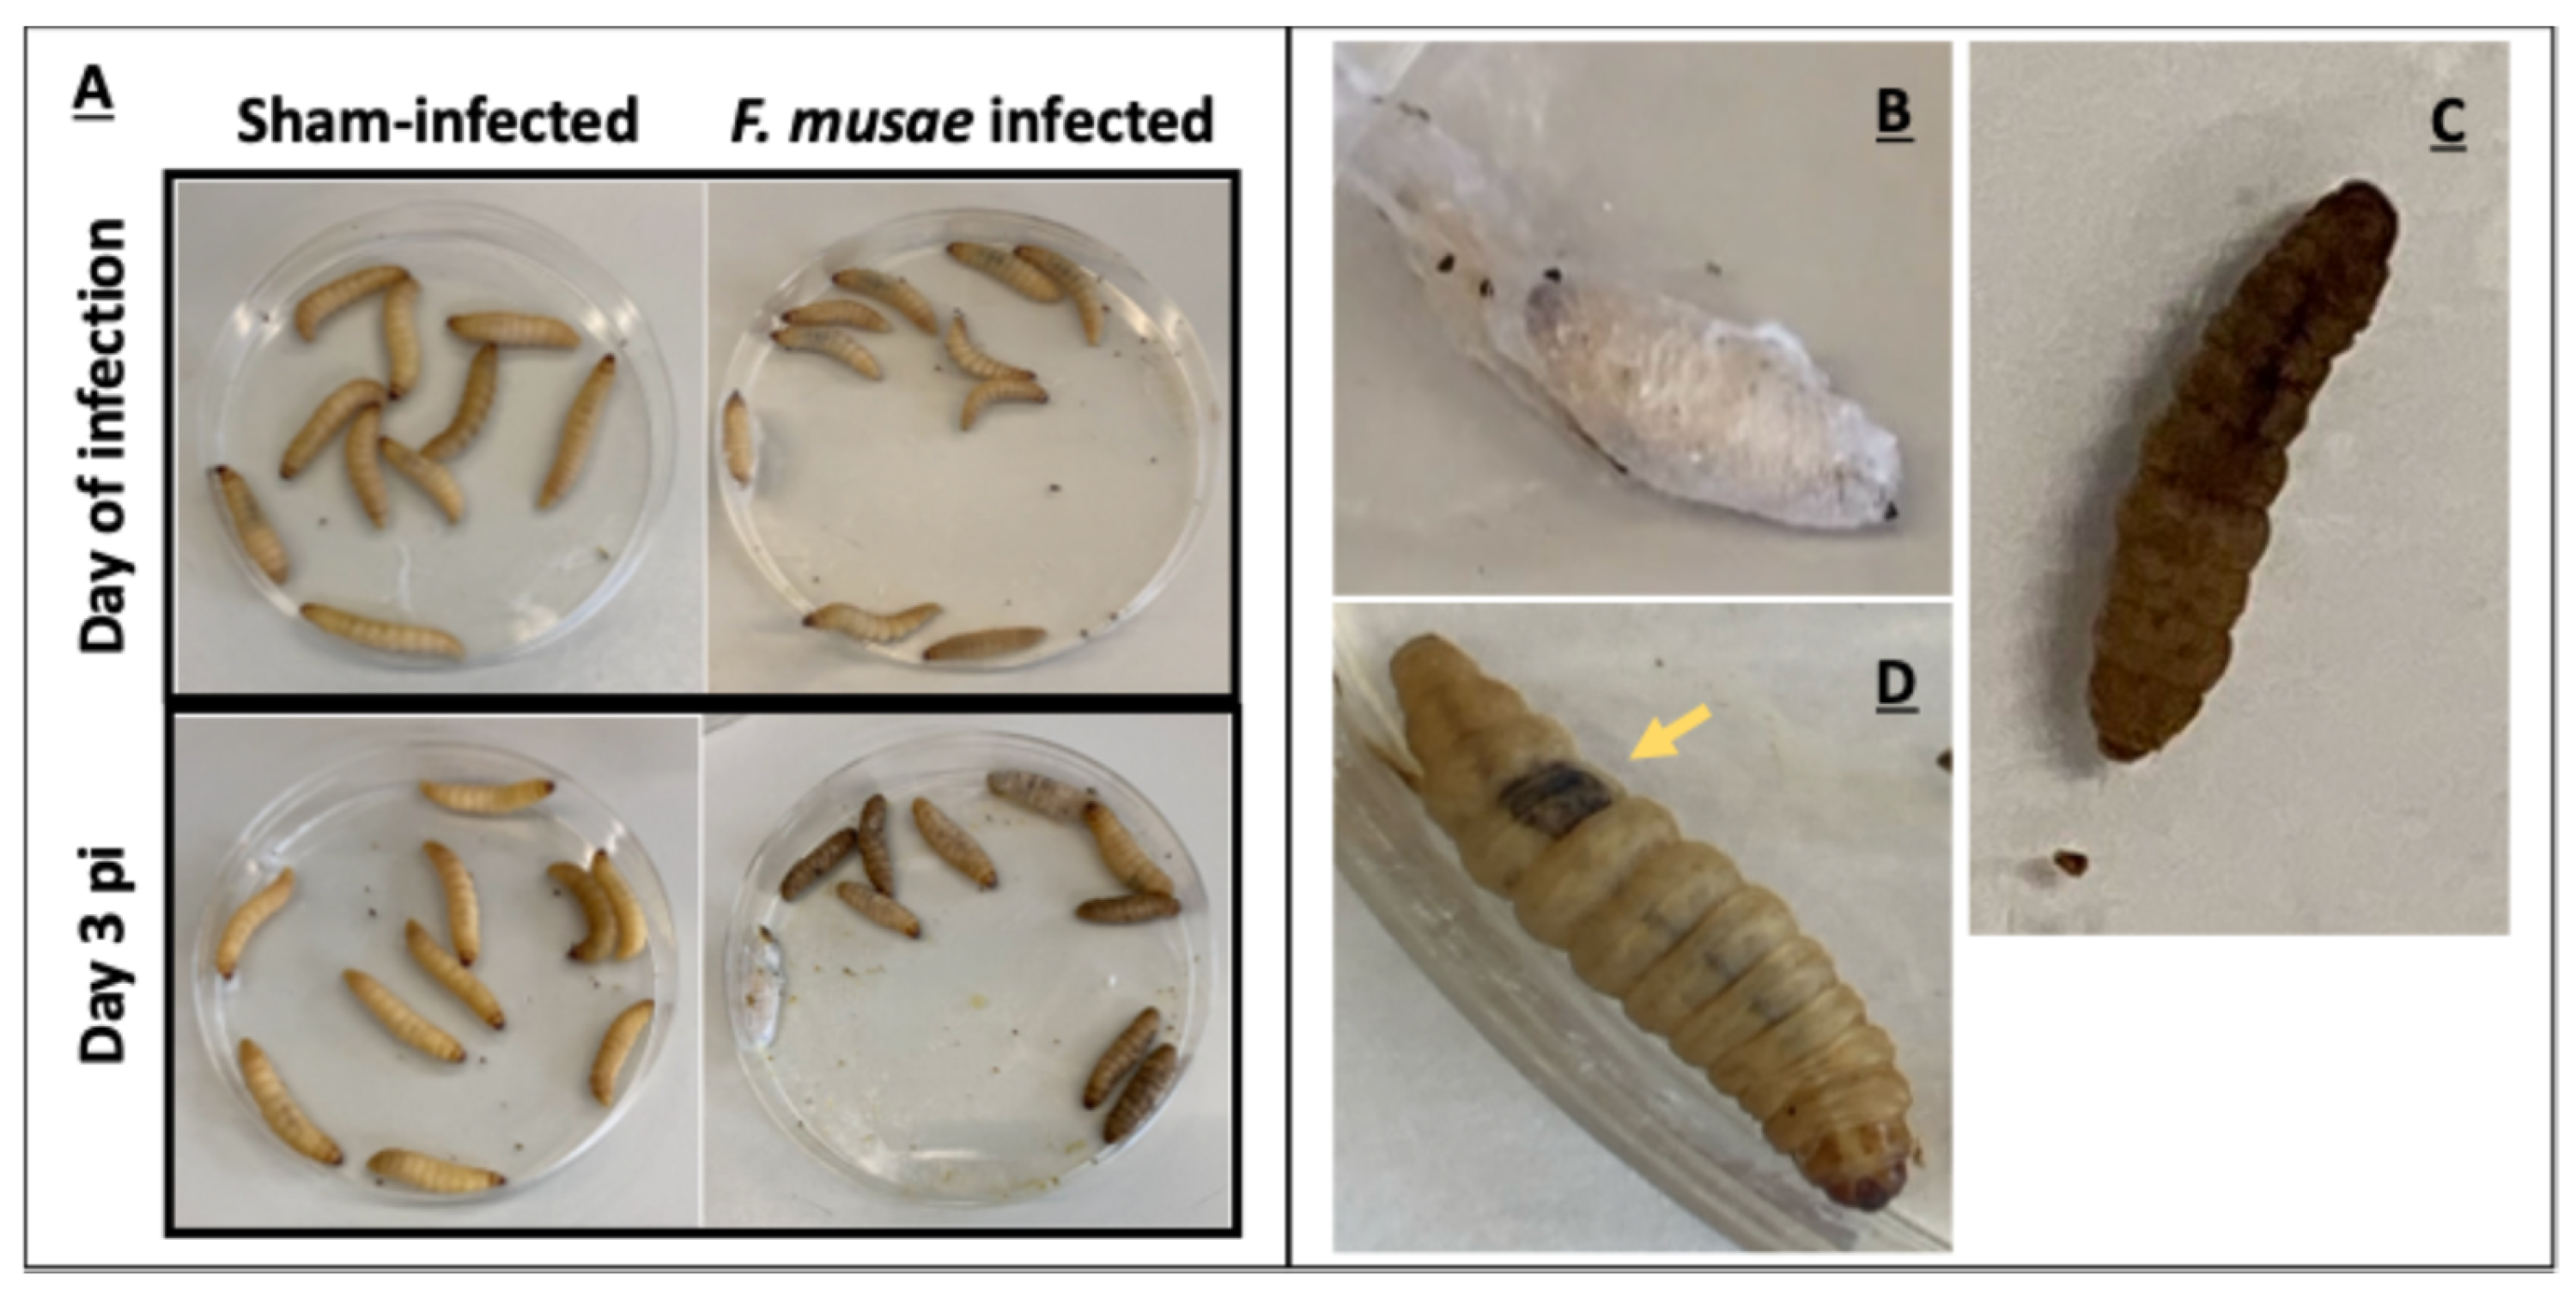
We observed that all F. musae strains were able to cause symptoms; three days after the infection, a few melanized spots were already visible on numerous larvae, while larvae injected with PBS remained healthy (Figure 6). Results were consistent and reinforced by data obtained at 28 °C from the temperature assay, where only seven representative strains were included.
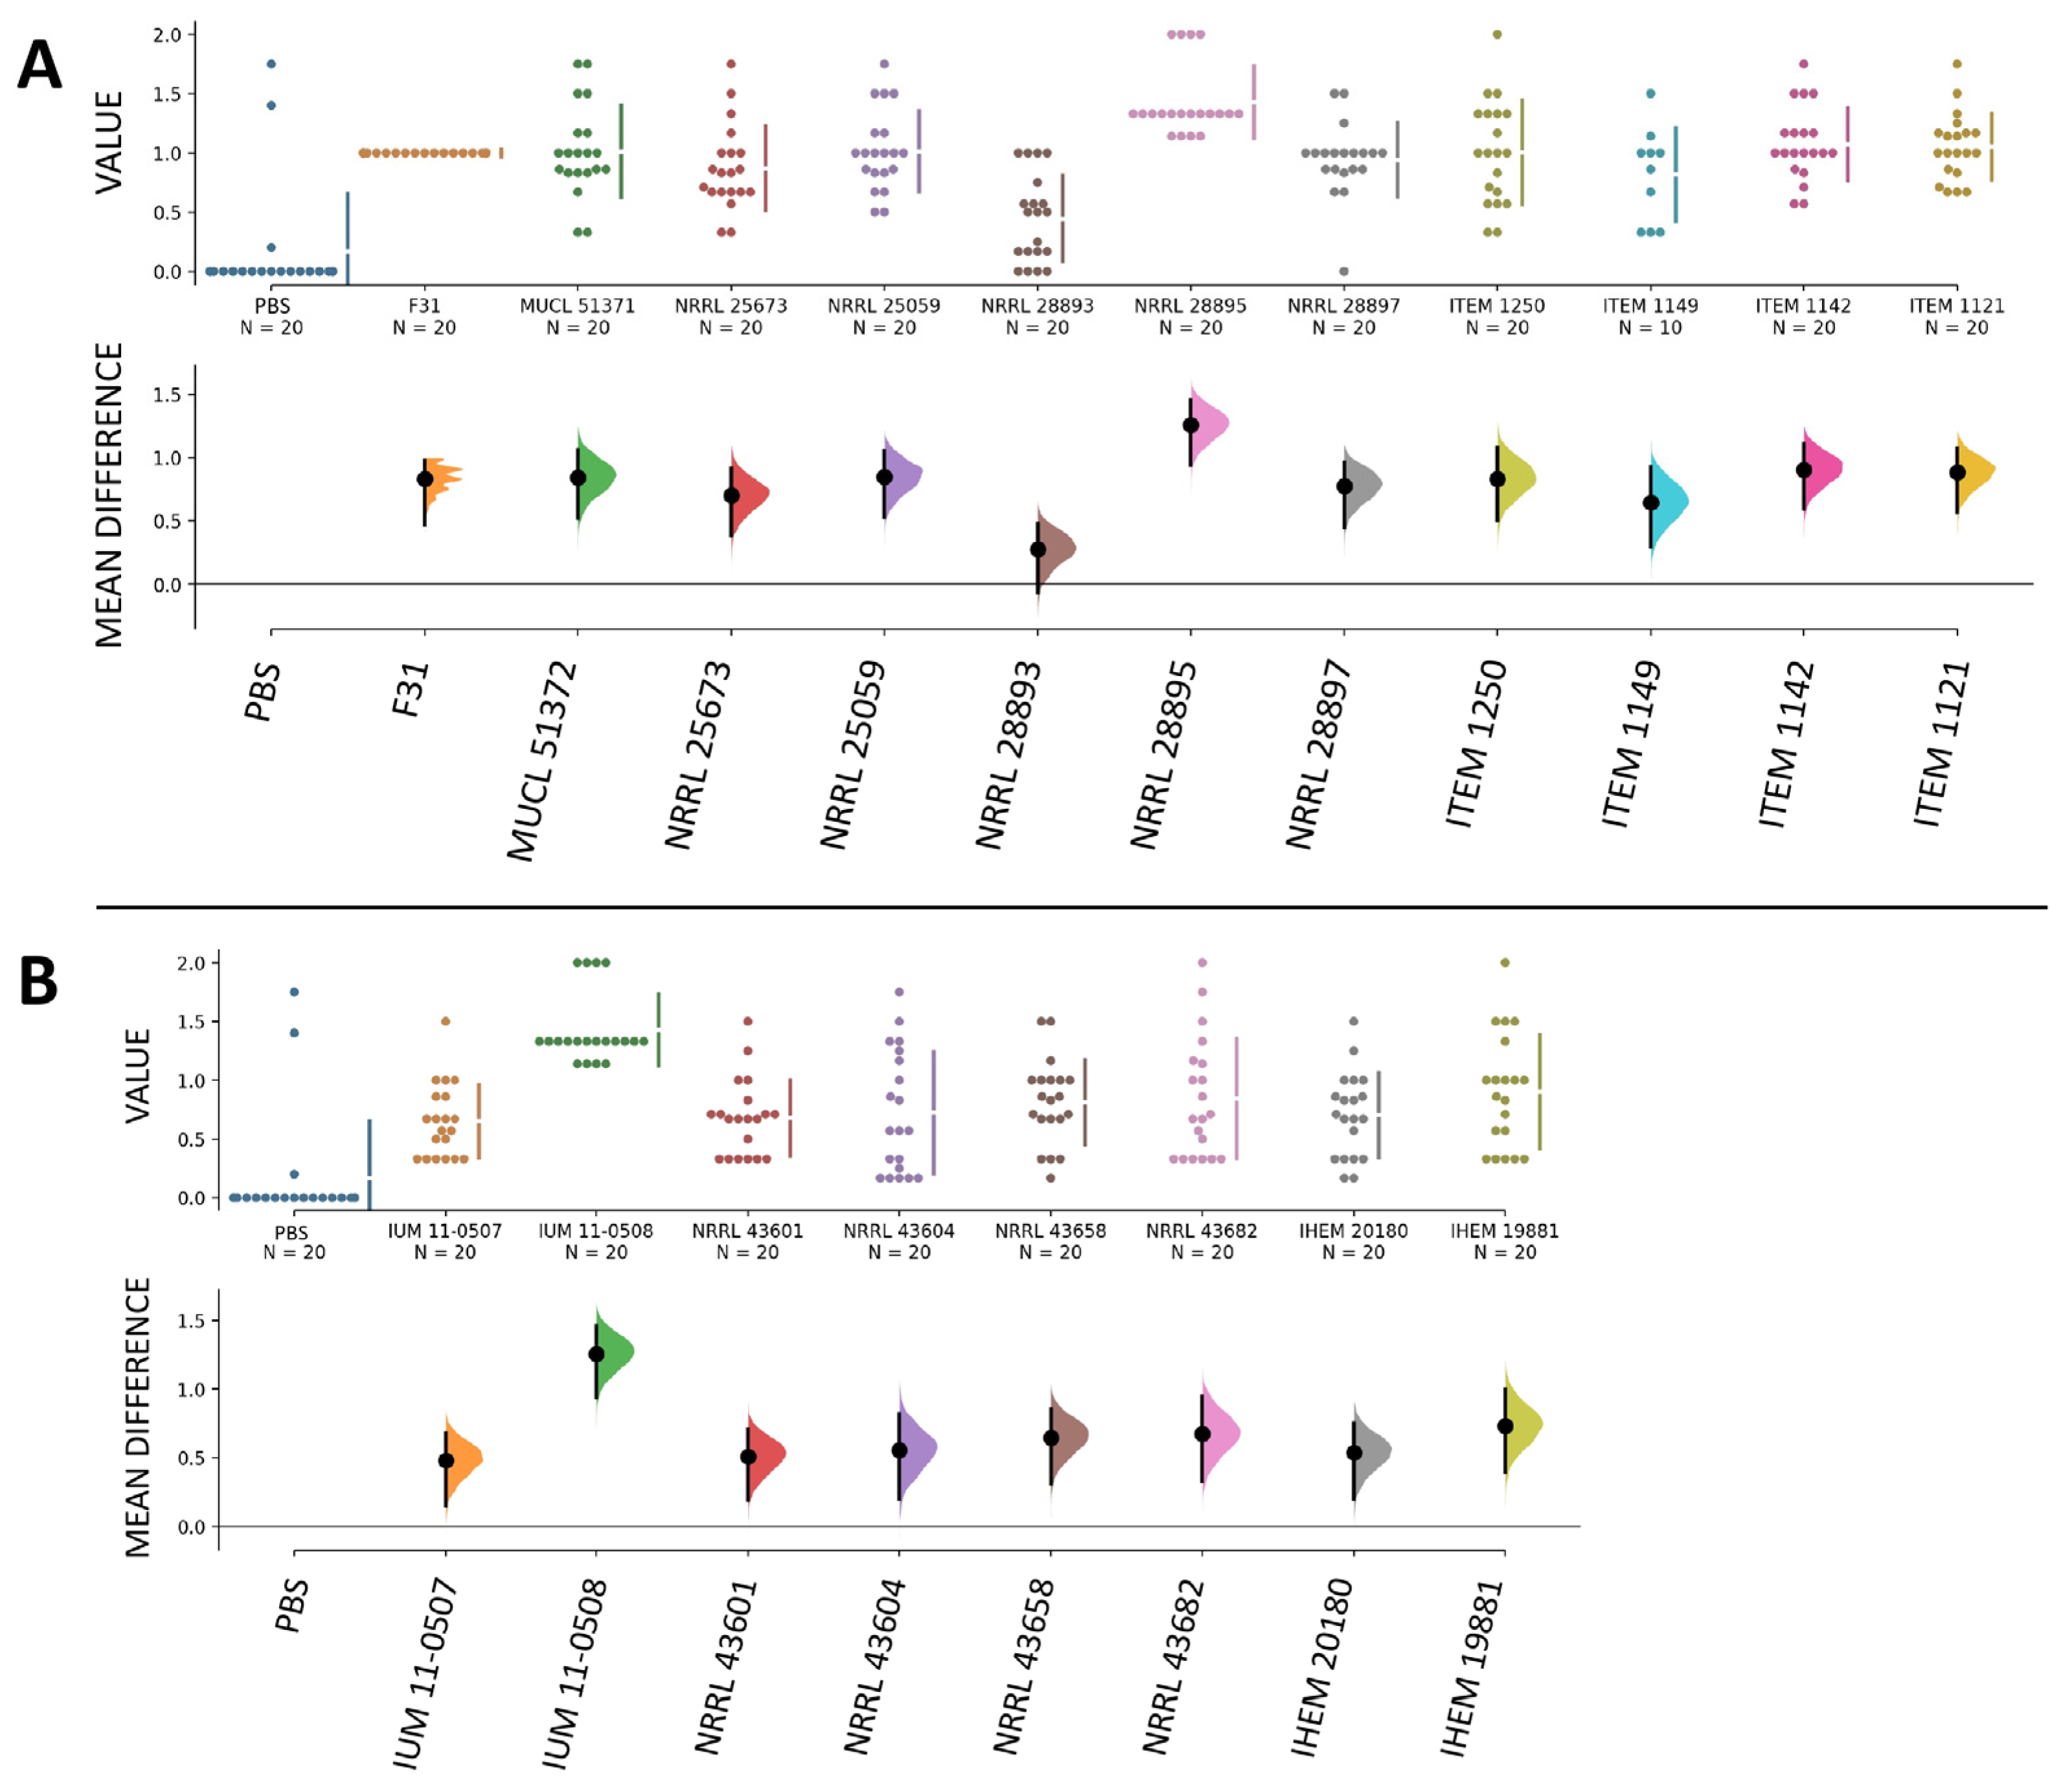
Of the nineteen F. musae strains tested, five (three human strains, IUM 11-0507, NRRL 43601, and NRRL 43604, and two plant strains, NRRL 28893 and ITEM 1149) showed the level of disease not statistically different from PBS (Figure 7). Strain IUM 11-0508 and NRRL 28895, isolated from human patients and banana fruits respectively, were the most virulent.
At the end of the observation period, in every group infected with F. musae strains, we documented the development of significant symptoms that led to larval death across all the groups.
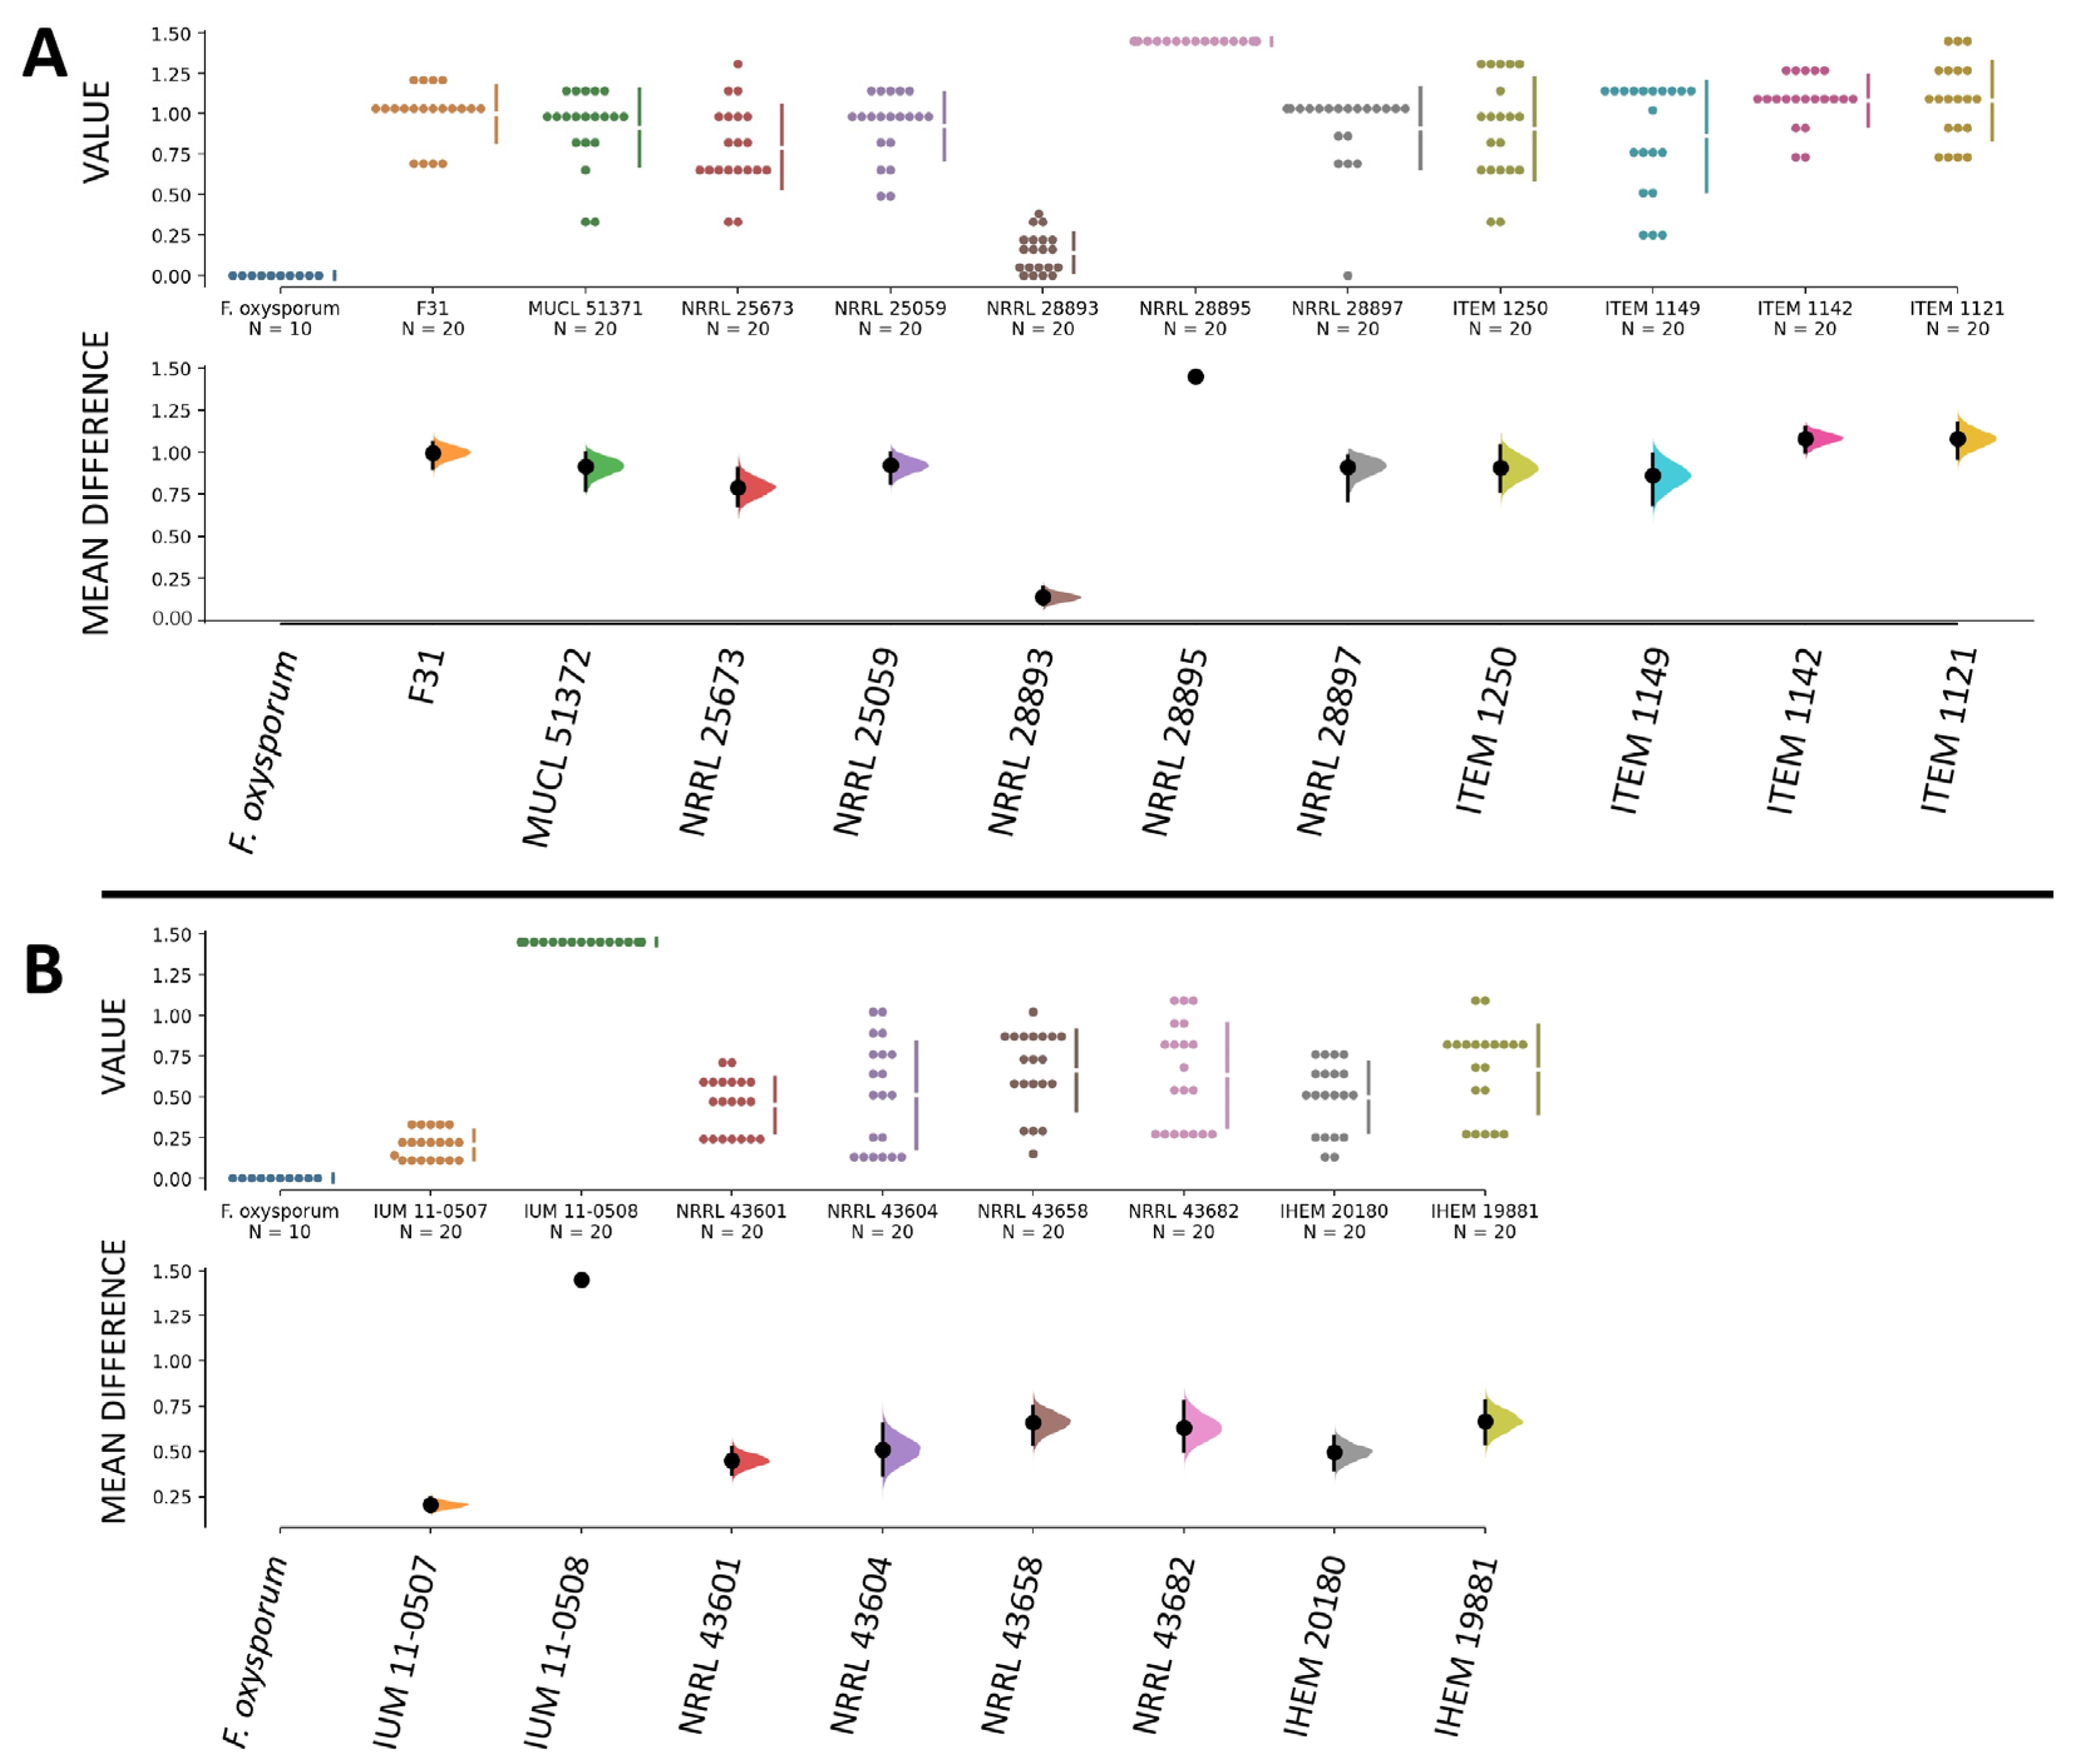
At these conditions, all strains of F. musae showed greater levels of disease compared to the Fusarium oxysporum strain, which presented a disease severity index comparable to sham-infected larvae (Figure 8).
Larvae infected with the F. oxysporum strain displayed decreased activity in a few larvae, the appearance of a single melanized spot in two larvae in one of the groups, cocoon formation in half of the larvae, and no larvae died within 7 days post-infection. When calculating the disease severity index, infection with F. oxysporum resulted in an index equal to zero, comparable to sham-infected larvae. In this case, using larval death as a strong marker of disease severity obscured the representation of other symptoms. However, overall, the group remained largely healthy, and the infectious strain exhibited low pathogenicity.
Similar to what we found in banana infection, strains with different geographical origins and host isolation sources caused comparable levels of infection in G. mellonella, suggesting that they all had virulence factors needed for the infection of an animal host.

3.5. Survival Readouts of G. mellonella Larvae Infected with Human and Plant Strains of F. musae

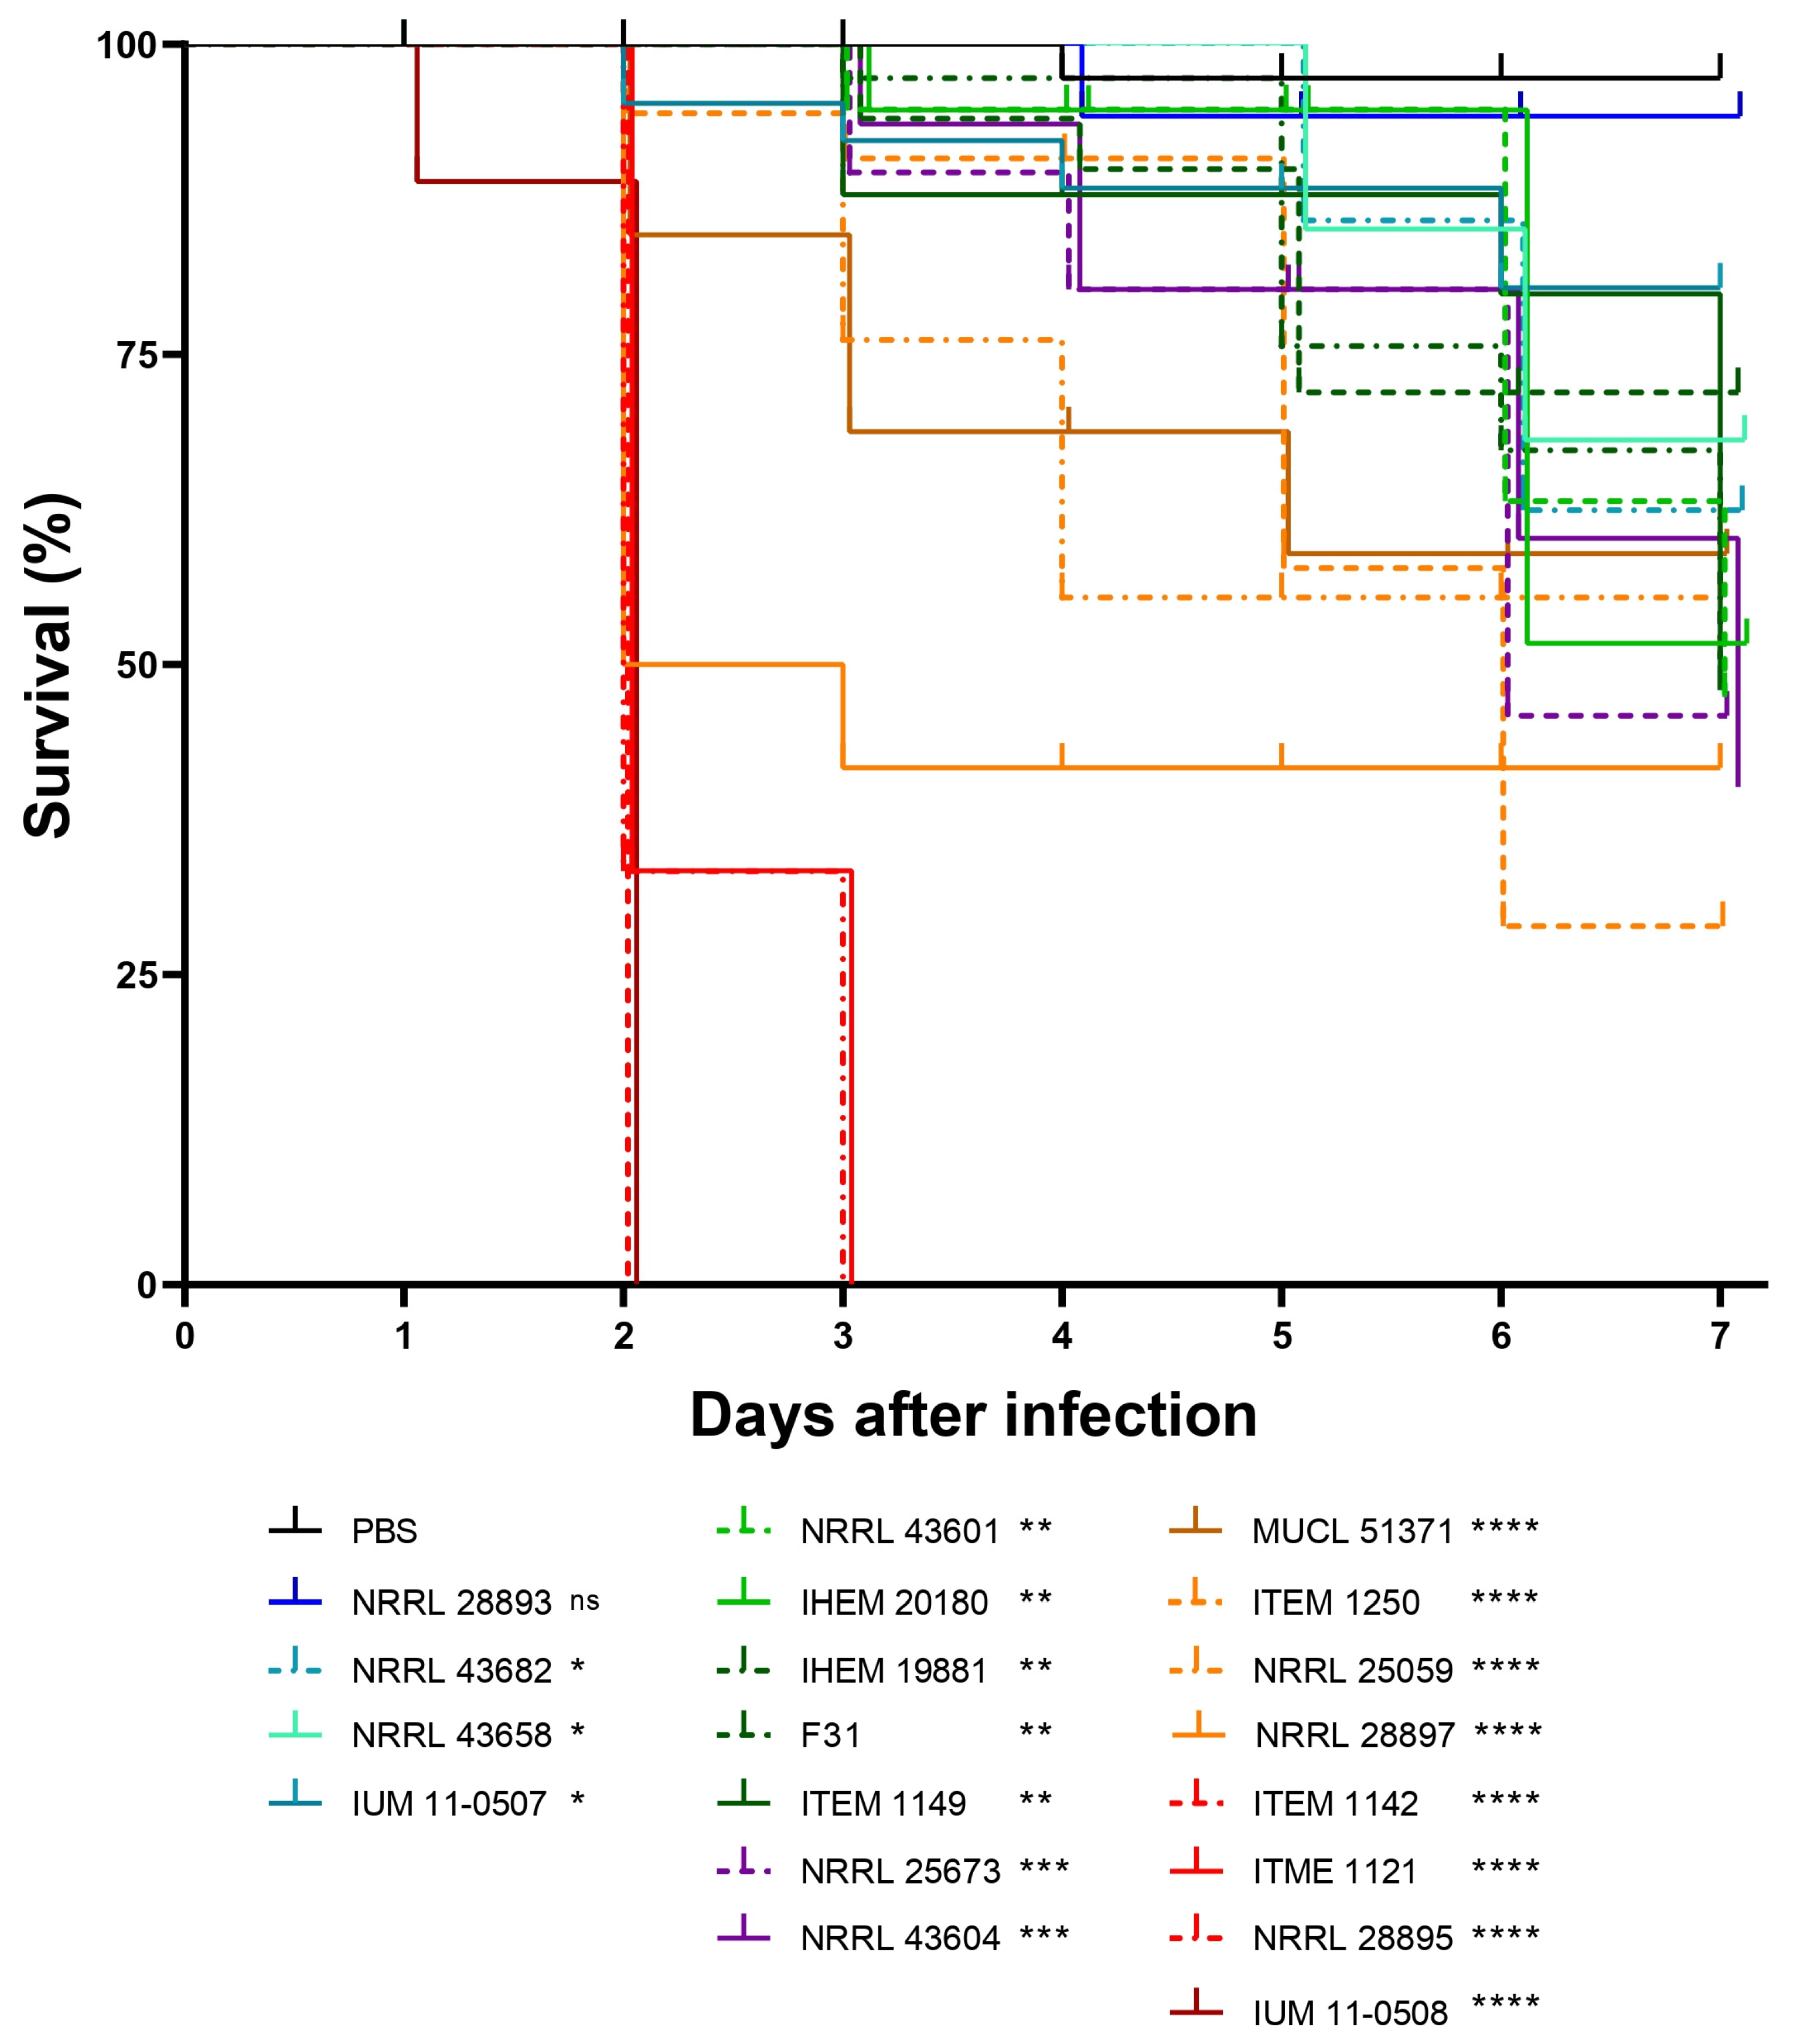
Given that survival analysis is still one of the most used readouts in G. mellonella studies and to allow for comparison with the body of the literature, we also decided to include a survival analysis in the evaluation of our infection model. Survival analysis was performed on survival data observed during the G. mellonella infection assay. F. musae infection resulted in significant mortality among the larvae (Figure 9). By 96 h post-infection, we observed a noticeable increase in the number of dead larvae, which continued to rise over the following days, indicating that both plant and human strains were capable of killing the larvae.
The virulence of the plant strain NRRL 28893 was not statistically different from the negative control. Infection with all other strains was significantly more virulent than sham-infected larvae, with no significant differences observed between strains from different origins. Overall, survival analysis confirmed that infection with F. musae led to a high number of dead larvae, supporting larval death as a strong marker of disease severity.

3.6. Quantitative Comparison of Data from Bananas and Larvae Infection

To study if human and plant strains showed the same behavior in both hosts and if specific trends were observable based on the isolation origin of the strains, we plotted together the data obtained from the infection of banana fruits and G. mellonella larvae with the entire collection of nineteen strains of F. musae. The distribution of data showed that infection severity in banana fruits was mostly comparable with that observed in G. mellonella (Figure 10).
Only human strain IUM 11-0508 showed different behavior in the two different hosts, as it was highly virulent in G. mellonella but less virulent in banana fruits. We did not find any specific interdependence between hosts or geographical origin of the strains and their virulence.

4. Discussion

The field of fungal cross-kingdom pathogens is still in its infancy. A conspicuous number of species has been identified as pathogenic to organisms from more than one kingdom [13,24]. In most cases, classification as a cross-kingdom pathogen is performed based on the isolation from different hosts of strains with shared taxonomic criteria. To qualify as a cross-kingdom pathogen, evidence of infection in the different hosts is essential. Studies verifying Koch’s postulates in diverse hosts are limited to pathogens that are considered cross-kingdom
F. musae is a putative cross-kingdom pathogen; in fact, strains isolated from humans and bananas are part of common taxa [1,25,26,27]. However, the pathogenicity of F. musae has not yet been experimentally verified, as is required by Koch’s postulates. Therefore, in this work, we aimed to prove experimentally if F. musae could be confirmed as a cross-kingdom pathogen by validating infection models for the investigation of its pathogenicity in both plant and animal kingdoms.
Our results showed that all F. musae strains of our collection, independently of their isolation source, could grow in vitro at 25 °C as well as at higher temperatures such as 37 °C, suggesting that they are all well adapted to occupy different ecological niches and share virulence factors needed to spread at environmental temperature but also at a human body temperature.
Indeed, pathogenicity in different host models’ environments is an important step to understanding F. musae as a cross-kingdom pathogen; therefore, our next step was to identify the most suitable hosts for this investigation. Banana fruits are the only known hosts of F. musae in the plant kingdom, and the fungus is one of the causative agents of crown rot, which is considered one of the most important post-harvest diseases of bananas [3]. Therefore, we established an infection model for the investigation of F. musae using banana fruits similar to the model used for the investigation of F. verticillioides [20].
For the animal kingdom, we established an infection model with larvae of Galleria mellonella. G. mellonella larvae are considered a successful and ethically responsible, relevant host model for the study of host–pathogen interaction. When compared to rodent models of infection, G. mellonella larvae offer considerable advantages: they are easily and inexpensively obtained in large numbers, are simple to use, and are easy to maintain without special laboratory equipment. Additional major benefits are their ability to thrive at 37 °C, their ease of maintenance and manipulation, few ethical constraints, and their size, which simplify the infection [28,29,30,31,32]. The structural and functional similarities between the innate immune system of mammals and the insect immune response present an additional reason to use it for the study of human fungal pathogens [33,34,35,36,37]. Indeed, among the host model alternatives to mice, Galleria mellonella larvae present several favorable attributes that make it an optimal model host for the investigation of various fungi, including Fusarium spp., as the well-known cross-kingdom pathogens F. solani and F. oxysporum [18,29,38,39,40,41,42,43,44,45,46].
We hypothesized that temperature would play a crucial role during the infection of G. mellonella larvae. Consequently, we tested the ability of our collection of strains to cause infection at environmental as well as mammal physiological body temperatures. We observed that all our strains showed 28 °C as the optimum temperature for the infection, while at 37 °C, the growth of our strains was overall reduced. This is consistent with the environments from where they were isolated: bananas usually grow at temperatures ranging from 25 °C to 28 °C, while the human body temperature is not uniform throughout. While core body temperature is 37 °C, extremities and corneal tissues have lower temperatures and are more exposed to injuries, making them more susceptible to fungal infections, including those by F. musae [24,47].
We did not only consider the best experimental model for studying F. musae pathogenicity but also the methodology to evaluate the extent of disease caused in host model systems representing plant and animal kingdoms. To evaluate banana fruit infection, we established a semiquantitative scoring system based on halo, browning, and mycelium formation. For evaluating disease severity in G. mellonella, survival analysis is the most used readout for the study of virulence of fungi of clinical interest, but it gives a binary result that does not allow us to observe other or milder symptoms of infection. A more sophisticated measure exists that accounts for not only life or death but several aspects of larval health [21]. Melanization is part of G. mellonella’s humoral system; it is a complex enzymatic cascade where melanin is synthesized due to wound and pathogen encapsulation, and usually, it correlates with the death of the wax worm soon after. The degree of melanization can depend on the infecting pathogen [41]. Some pathogens cause profound and uniform melanization, whilst others cause more subtle color changes, which can be difficult to interpret. Higher activity corresponds to a healthier wax worm, while cocoon formation and activity of the larvae indicate good health of the individual [17,21].
To better represent disease severity in our infection models and enable comparison of the virulence level of single strains, we established disease severity indexes. The banana disease severity index takes into account the diameter and the level of browning of the spots growing on the fruits, while the G. mellonella severity index considers the importance of larval death as well as other symptoms that can be linked to specific mechanisms involved in pathogen–host interaction. These indexes allowed us to assess and compare the virulence of individual strains in both bananas and G. mellonella models, observing possible differences in the interaction with the two different hosts.
Based on this novel experimental model with the disease severity quantification framework we established, we verified that strains of F. musae with different hosts and geographical origins could cause a high level of disease, and most of the strains did not discriminate between the host tested, as they were able to cause comparable levels of disease in both banana fruits and G. mellonella larvae. Interestingly, the human strain IUM 11-0508 showed different infections of the two hosts, causing high disease levels in G. mellonella while being a weak pathogen of bananas. It is known that different model organisms may also differentiate infection characteristics within a species (as shown in Aspergillus fumigatus [48]). We are, therefore, aware that the animal model selected here, despite its advantages and extensive use [48,49], does not fully mimic the host response of a mammalian host; therefore, future studies addressing the behavior of the fungus in mammalian models are warranted.
Overall, all the tested strains of F. musae consistently showed high infection in both our host models, with infection levels that were comparable among plant- and human-derived strains. Additionally, variations in symptoms and degrees of infection were observed among F. musae strains in both hosts. Together, these findings indicate that F. musae virulence is driven by strain specificity rather than host specificity. Our phenotypic tests allowed us to identify strains that have peculiar behavior against the different hosts, such as IUM 11-0508, as well as strains that grow with difficulty at temperatures required for human infection, such as NRRL 28897 and ITEM 1149. A genomic approach trying to link these characteristics to the genetic background of the strains is warranted as this will guide our comprehension of virulence factors underlying pathogenicity across kingdoms.
Considering the similarities in defense systems of plants and humans [47,48,49,50,51,52], it is crucial to further explore the strategies evolved by F. musae that allow it to invade hosts belonging to different kingdoms and the underlying genetic determinants of infection. Indeed, Fusarium species are an interesting model to explore from the One Health perspective, given the complexity of these pathogen–host interactions [53].

5. Conclusions

We established here two relevant infection models, one involving banana fruits and the other one involving G. mellonella larvae, successfully demonstrating the cross-kingdom pathogenicity of F. musae and providing a solid procedure to demonstrate the virulence of F. musae strains in different infection models.

Supplementary Materials

The following supporting information can be downloaded at https://www.mdpi.com/article/10.3390/jof11020090/s1, Table S1: In vitro temperature assay of F. musae. The table represents average values of diameters expressed in cm of the colonies measured five days after incubation at 25 °C and 37 °C in solid V8 media. Three replicates were performed for each strain at each condition. * Two replicates were performed for these strains.

Author Contributions

Conceptualization, M.P., G.V.V. and V.T.; methodology, V.T., A.R.-S., E.V., M.S., G.V.V. and M.P.; investigation, V.T.; resources, P.C., K.L., G.V.V. and M.P.; data curation, V.T.; writing—original draft preparation, V.T.; writing—review and editing, V.T., A.R.-S., E.V., M.S., P.C., K.L., G.V.V. and M.P.; supervision, G.V.V. and M.P.; funding acquisition, P.C., G.V.V. and M.P. All authors have read and agreed to the published version of the manuscript.

Funding

V.T. is funded by the PhD school of Food Systems of the University of Milan and KU Leuven FLOF. The project is funded by the European Union Next Generation EU, Prin2022 Project “Taklpat”—CUP G53D23002720006. E.V. acknowledges an aspirant mandate from the Flemish Research Foundation (FWO, 1SF2224N).

Institutional Review Board Statement

Not applicable.

Informed Consent Statement

Not applicable.

Data Availability Statement

Raw data are available upon request to the corresponding author.

Acknowledgments

We thank Cristina Pizzatti for the technical support.

Conflicts of Interest

The authors declare no conflicts of interest.

References

  1. Van Hove, F.; Waalwijk, C.; Logrieco, A.; Munaut, F.; Moretti, A. Gibberella musae (Fusarium musae) sp. nov., a recently discovered species from banana is sister to F. verticillioides. Mycologia 2011, 103, 570–585. [Google Scholar] [CrossRef] [PubMed]
  2. Molnár, O.; Bartók, T.; Szécsi, Á. Occurrence of Fusarium verticillioides and Fusarium musae on banana fruits marketed in Hungary. Acta Microbiol. Immunol. Hung. 2015, 62, 109–119. [Google Scholar] [CrossRef]
  3. Kamel, M.A.M.; Cortesi, P.; Saracchi, M. Etiological agents of crown rot of organic bananas in Dominican Republic. Postharvest Biol. Technol. 2016, 120, 112–120. [Google Scholar] [CrossRef]
  4. Hirata, T.; Kimishima, E.; Aoki, T.; Nirenberg, H.I.; O’Donnell, K. Morphological and molecular characterization of Fusarium verticillioides from rotten banana imported into Japan. Mycoscience 2001, 42, 155–166. [Google Scholar] [CrossRef]
  5. Shi, W.; Tan, Y.; Wang, S.; Gardiner, D.M.; De Saeger, S.; Liao, Y.; Wang, C.; Fan, Y.; Wang, Z.; Wu, A. Mycotoxigenic potentials of Fusarium species in various culture matrices revealed by mycotoxin profiling. Toxins 2017, 9, 6. [Google Scholar] [CrossRef] [PubMed]
  6. Esposto, M.C.; Prigitano, A.; Tortorano, A.M. Fusarium musae as cause of superficial and deep-seated human infections. J. Mycol. Médicale 2016, 26, 403–405. [Google Scholar] [CrossRef]
  7. Triest, D. Banana fruits affected by Fusarium post-harvest disease as source of human fusariosis. Acta Microbiol. Immunol. Hung. 2016, 63, 359–360. [Google Scholar] [CrossRef]
  8. Triest, D.; Hendrickx, M. Postharvest disease of banana caused by Fusarium musae: A public health concern? PLoS Pathog. 2016, 12, e1005940. [Google Scholar] [CrossRef]
  9. Triest, D.; Piérard, D.; De Cremer, K.; Hendrickx, M. Fusarium musae infected banana fruits as potential source of human fusariosis: May occur more frequently than we might think and hypotheses about infection. Commun. Integr. Biol. 2016, 9, e1162934. [Google Scholar] [CrossRef]
  10. O’Donnell, K.; Sarver, B.A.J.; Brandt, M.; Chang, D.C.; Noble-Wang, J.; Park, B.J.; Sutton, D.A.; Benjamin, L.; Lindsley, M.; Padhye, A.; et al. Phylogenetic diversity and microsphere array-based genotyping of human pathogenic Fusaria, including isolates from the multistate contact lens-associated U.S. keratitis outbreaks of 2005 and 2006. J. Clin. Microbiol. 2007, 45, 2235–2248. [Google Scholar] [CrossRef] [PubMed]
  11. Grimes, D.J. Koch’s Postulates—Then and Now. Microbe Mag. 2006, 1, 223–228. [Google Scholar] [CrossRef]
  12. Bhunjun, C.S.; Phillips, A.J.L.; Jayawardena, R.S.; Promputtha, I.; Hyde, K.D. Importance of molecular data to identify fungal plant pathogens and guidelines for pathogenicity testing based on Koch’s postulates. Pathogens 2021, 10, 1096. [Google Scholar] [CrossRef] [PubMed]
  13. Van Baarlen, P.; Van Belkum, A.; Summerbell, R.C.; Crous, P.W.; Thomma, B.P.H.J. Molecular mechanisms of pathogenicity: How do pathogenic microorganisms develop cross-kingdom host jumps? FEMS Microbiol. Rev. 2007, 31, 239–277. [Google Scholar] [CrossRef] [PubMed]
  14. Kim, J.-S.; Yoon, S.-J.; Park, Y.-J.; Kim, S.-Y.; Ryu, C.-M. Crossing the kingdom border: Human diseases caused by plant pathogens. Environ. Microbiol. 2020, 22, 2485–2495. [Google Scholar] [CrossRef]
  15. Fallon, J.; Kelly, J.; Kavanagh, K. Galleria mellonella as a model for fungal pathogenicity testing. In Host-Fungus Interactions; Brand, A.C., MacCallum, D.M., Eds.; Humana Press: Totowa, NJ, USA, 2012; Volume 845, pp. 469–485. [Google Scholar] [CrossRef]
  16. Pereira, T.C.; Rossoni, R.D.; Ribeiro, F.d.C.; de Menezes, R.T.; Junqueira, J.C.; Scorzoni, L. Recent Advances in the Use of Galleria mellonella model to study immune responses against human pathogens. J. Fungi 2018, 4, 128. [Google Scholar] [CrossRef]
  17. Singkum, P.; Suwanmanee, S.; Pumeesat, P.; Luplertlop, N. A powerful in vivo alternative model in scientific research: Galleria mellonella. Acta Microbiol. Immunol. Hung. 2019, 66, 31–55. [Google Scholar] [CrossRef] [PubMed]
  18. Vanhoffelen, E.; Michiels, L.; Brock, M.; Lagrou, K.; Reséndiz-Sharpe, A.; Vande Velde, G. Powerful and Real-Time Quantification of Antifungal Efficacy against Triazole-Resistant and-Susceptible Aspergillus fumigatus Infections in Galleria mellonella by longitudinal bioluminescence imaging. Microbiol. Spectr. 2023, 11, e00825-23. [Google Scholar] [CrossRef] [PubMed]
  19. Vanhoffelen, E.; Vermoesen, L.; Michiels, L.; Lagrou, K.; Reséndiz-Sharpe, A.; Vande Velde, G. Sensitive bioluminescence imaging of cryptococcosis in Galleria mellonella improves antifungal screening under in vivo conditions. Virulence 2024, 15, 2327883. [Google Scholar] [CrossRef]
  20. Moretti, A.; Mule, G.; Susca, A.; González-Jaén, M.; Logrieco, A. Toxin Profile, Fertility and AFLP Analysis of Fusarium verticillioides from Banana Fruits. Eur. J. Plant Pathol. 2004, 110, 601–609. [Google Scholar] [CrossRef]
  21. Loh, J.M.; Adenwalla, N.; Wiles, S.; Proft, T. Galleria mellonella larvae as an infection model for group A streptococcus. Virulence 2013, 4, 419–428. [Google Scholar] [CrossRef]
  22. Ho, J.; Tumkaya, T.; Aryal, S.; Choi, H.; Claridge-Chang, A. Moving beyond P Values: Data Analysis with Estimation Graphics. Nat. Methods 2019, 16, 565–566. [Google Scholar] [CrossRef] [PubMed]
  23. Goedhart, J. SuperPlotsOfData—A web app for the transparent display and quantitative comparison of continuous data from different conditions. Mol. Biol. Cell 2021, 32, 470–474. [Google Scholar] [CrossRef] [PubMed]
  24. Gauthier, G.M.; Keller, N.P. Crossover fungal pathogens: The biology and pathogenesis of fungi capable of crossing kingdoms to infect plants and humans. Fungal Genet. Biol. 2013, 61, 146–157. [Google Scholar] [CrossRef]
  25. Tava, V.; Prigitano, A.; Cortesi, P.; Esposto, M.C.; Pasquali, M. Fusarium musae from diseased bananas and human patients: Susceptibility to fungicides used in clinical and agricultural settings. J. Fungi 2021, 7, 784. [Google Scholar] [CrossRef]
  26. Degradi, L.; Tava, V.; Prigitano, A.; Esposto, M.C.; Tortorano, A.M.; Saracchi, M.; Kunova, A.; Cortesi, P.; Pasquali, M. Exploring mitogenomes diversity of Fusarium musae from banana fruits and human patients. Microorganisms 2022, 10, 1115. [Google Scholar] [CrossRef] [PubMed]
  27. Degradi, L.; Tava, V.; Kunova, A.; Cortesi, P.; Saracchi, M.; Pasquali, M. Telomere to telomere genome assembly of Fusarium musae F31, causal agent of crown rot disease of banana. Mol. Plant Microbe Interact. 2021, 34, 1455–1457. [Google Scholar] [CrossRef] [PubMed]
  28. Capilla, J.; Clemons, K.V.; Stevens, D.A. Animal models: An important tool in mycology. Med. Mycol. 2007, 45, 657–684. [Google Scholar] [CrossRef]
  29. Fuchs, B.B.; O’Brien, E.; El Khoury, J.B.; Mylonakis, E. Methods for using Galleria mellonella as a model host to study fungal pathogenesis. Virulence 2010, 1, 475–482. [Google Scholar] [CrossRef] [PubMed]
  30. Desalermos, A.; Fuchs, B.B.; Mylonakis, E. Selecting an invertebrate model host for the study of fungal pathogenesis. PLoS Pathog. 2012, 8, e1002451. [Google Scholar] [CrossRef]
  31. Swearengen, J.R. Choosing the right animal model for infectious disease research. Anim. Models Exp. Med. 2018, 1, 100–108. [Google Scholar] [CrossRef]
  32. Junqueira, J.; Mylonakis, E. Current status and trends in alternative models to study fungal pathogens. J. Fungi 2019, 5, 12. [Google Scholar] [CrossRef]
  33. Brennan, M.; Thomas, D.Y.; Whiteway, M.; Kavanagh, K. Correlation between virulence of Candida albicans mutants in mice and Galleria mellonella larvae. FEMS Immunol. Med. Microbiol. 2002, 34, 153–157. [Google Scholar] [CrossRef]
  34. Mylonakis, E.; Moreno, R.; El Khoury, J.B.; Idnurm, A.; Heitman, J.; Calderwood, S.B.; Ausubel, F.M.; Diener, A. Galleria mellonella as a model system to study Cryptococcus neoformans pathogenesis. Infect. Immun. 2005, 73, 3842–3850. [Google Scholar] [CrossRef] [PubMed]
  35. Kavanagh, K.; Fallon, J.P. Galleria mellonella larvae as models for studying fungal virulence. Fungal Biol. Rev. 2010, 24, 79–83. [Google Scholar] [CrossRef]
  36. Slater, J.L.; Gregson, L.; Denning, D.W.; Warn, P.A. Pathogenicity of Aspergillus fumigatus mutants assessed in Galleria mellonella matches that in mice. Med. Mycol. 2011, 49, S107–S113. [Google Scholar] [CrossRef] [PubMed]
  37. Trevijano-Contador, N.; Zaragoza, O. Immune response of Galleria mellonella against human fungal pathogens. J. Fungi 2018, 5, 3. [Google Scholar] [CrossRef]
  38. Gomez-Lopez, A.; Forastiero, A.; Cendejas-Bueno, E.; Gregson, L.; Mellado, E.; Howard, S.; Livermore, J.; Hope, W.; Cuenca-Estrella, M. An invertebrate model to evaluate virulence in Aspergillus fumigatus: The role of azole resistance. Med. Mycol. 2014, 52, 311–319. [Google Scholar] [CrossRef]
  39. Binder, U.; Maurer, E.; Lass-Flörl, C. Galleria mellonella: An invertebrate model to study pathogenicity in correctly defined fungal species. Fungal Biol. 2016, 120, 288–295. [Google Scholar] [CrossRef] [PubMed]
  40. Champion, O.L.; Wagley, S.; Titball, R.W. Galleria mellonella as a model host for microbiological and toxin research. Virulence 2016, 7, 840–845. [Google Scholar] [CrossRef]
  41. Champion, O.L.; Titball, R.W.; Bates, S. Standardization of G. mellonella larvae to provide reliable and reproducible results in the study of fungal pathogens. J. Fungi 2018, 4, 108. [Google Scholar] [CrossRef]
  42. Kryukov, V.Y.; Yaroslavtseva, O.N.; Whitten, M.M.A.; Tyurin, M.V.; Ficken, K.J.; Greig, C.; Melo, N.R.; Glupov, V.V.; Dubovskiy, I.M.; Butt, T.M. Fungal infection dynamics in response to temperature in the lepidopteran insect Galleria mellonella. Insect Sci. 2018, 25, 454–466. [Google Scholar] [CrossRef] [PubMed]
  43. Carvajal, S.K.; Alvarado, M.; Rodríguez, Y.M.; Parra-Giraldo, C.M.; Varón, C.; Morales-López, S.E.; Rodríguez, J.Y.; Gómez, B.L.; Escandón, P. Pathogenicity Assessment of Colombian Strains of Candida auris in the Galleria mellonella Invertebrate Model. J. Fungi 2021, 7, 401. [Google Scholar] [CrossRef] [PubMed]
  44. Coleman, J.J.; Muhammed, M.; Kasperkovitz, P.V.; Vyas, J.M.; Mylonakis, E. Fusarium pathogenesis investigated using Galleria mellonella as a heterologous host. Fungal Biol. 2011, 115, 1279–1289. [Google Scholar] [CrossRef]
  45. Navarro Velasco, G.; Prados-Rosales, R.; Ortiz-Urquiza, A.; Quesada-Moraga, E.; Pietro, A. Galleria mellonella as model host for the trans-kingdom pathogen Fusarium oxysporum. Fungal Genet. Biol. 2011, 48, 1124–1129. [Google Scholar] [CrossRef]
  46. Khalaf, M. Screening of Fusarium isolates pathogenicity in vitro by using the larvae of Galleria mellonella L. Decis. Sci. 2023, 38, 19–28. [Google Scholar]
  47. Kessel, L.; Johnson, L.; Arvidsson, H.; Larsen, M. The relationship between body and ambient temperature and corneal temperature. Investig. Ophthalmol. Vis. Sci. 2010, 51, 6593–6597. [Google Scholar] [CrossRef]
  48. Keizer, E.M.; Valdes, I.D.; Forn-Cuni, G.; Klijn, E.; Meijer, A.H.; Hillman, F.; Wösten, H.A.B.; de Cock, H. Variation of virulence of five Aspergillus fumigatus isolates in four different infection models. PLoS ONE 2021, 16, e0252948. [Google Scholar] [CrossRef]
  49. Binder, U.; Arastehfar, A.; Schnegg, L.; Hörtnagl, C.; Hilmioğlu-Polat, S.; Perlin, D.S.; Lass-Flörl, C. Efficacy of LAMB against emerging azole- and multidrug-resistant Candida parapsilosis isolates in the Galleria mellonella model. J. Fungi 2020, 6, 377. [Google Scholar] [CrossRef]
  50. Sexton, A.C.; Howlett, B.J. Parallels in fungal pathogenesis on plant and animal hosts. Eukaryot. Cell 2006, 5, 1941–1949. [Google Scholar] [CrossRef]
  51. Wright, C.L.; Kavanagh, O. Galleria mellonella as a novel in vivo model to screen natural product-derived modulators of innate immunity. Appl. Sci. 2022, 12, 6587. [Google Scholar] [CrossRef]
  52. Nag, P.; Paul, S.; Shriti, S.; Das, S. Defence response in plants and animals against a common fungal pathogen, Fusarium oxysporum. Curr. Res. Microb. Sci. 2022, 3, 100135. [Google Scholar] [CrossRef] [PubMed]
  53. Sáenz, V.; Alvarez-Moreno, C.; Pape, P.L.; Restrepo, S.; Guarro, J.; Ramírez, A.M.C. A One Health perspective to recognize Fusarium as important in clinical practice. J. Fungi 2020, 6, 235. [Google Scholar] [CrossRef] [PubMed]
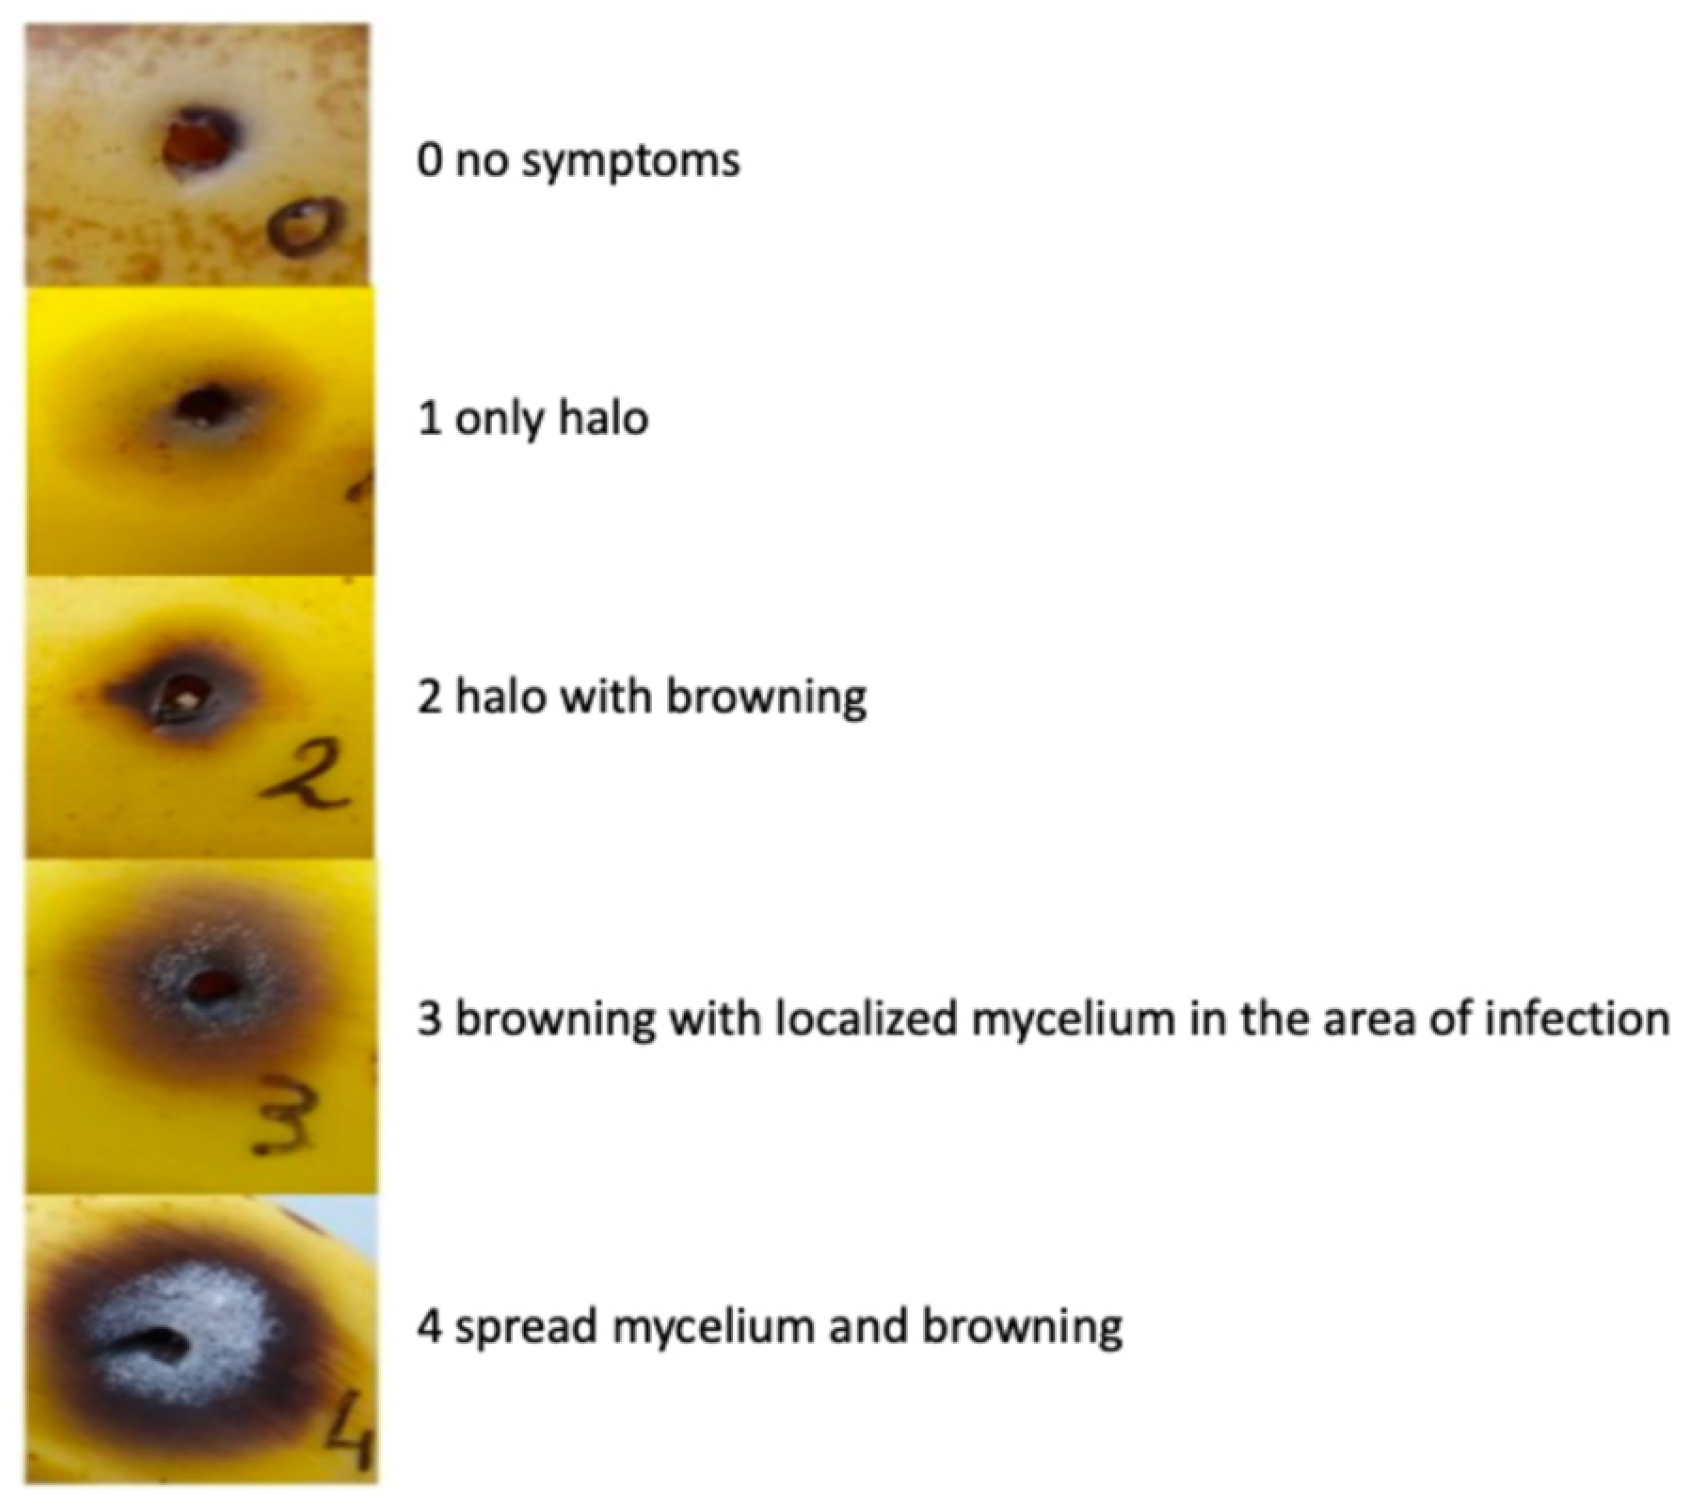
Figure 1. Scale of browning in banana fruits. Each spot was awarded a number from 0 to 4 based on halo, browning, and mycelium formation in order to assess the level of disease caused by each strain on bananas.
Jof 11 00090 g001
Figure 2. Visual representation of the symptoms observed in banana fruits. Formation of brown spots surrounding the point of toothpick insertion in bananas after 10 days of infection with 105 conidia/mL of strains F31 (A) and IUM 11-0508 (B). No symptoms are visible in infection with H2O (C). No external symptoms were observed in bananas at 10 days post inoculation with F. oxysporum (D).
Jof 11 00090 g002
Figure 3. Disease severity in banana fruits caused by our collection of F. musae strains. Graphs were made with the data analysis framework Estimation Stats with default parameters; H2O was used as shared control. (A) Disease severity indexes of strains isolated from bananas. (B) Disease severity indexes of strains isolated from human patients. In both (A) and (B), the upper graphs refer to the distribution of the disease severity indexes, and the bottom graphs refer to the mean differences in value between samples inoculated with F. musae spores and with H2O, with error bars indicating a 95% confidence level. Each dot indicates a single measure.
Jof 11 00090 g003
Figure 4. Comparison between infection in banana fruits with F. oxysporum and F. musae. Graphs were made using the data analysis framework Estimation Stats with default parameters; Fusarium oxysporum f.sp. lycopersici R1 strain was used as shared control. (A) Disease severity indexes of strains isolated from banana. (B) Disease severity indexes of strains isolated from human patients. In both (A) and (B), the upper graphs refer to the distribution of the disease severity indexes, and the bottom graphs refer to the mean difference in value between samples inoculated with F. musae spores and with F. oxysporum spores, with error bars indicating a 95% confidence level. Each dot indicates a single measure.
Jof 11 00090 g004
Figure 5. Temperature assay for G. mellonella infection. The virulence of seven representative strains is represented as health score at 24 °C (A), 28 °C (B), and 37 °C (C). Each color corresponds to a strain. Infection was initiated on day 0 and monitored for seven days. N = 10 larvae were infected per strain with 1 × 10⁵ conidia/mL, and sham infection was performed using PBS as a negative control. Mean and SD are represented in the graph. The statistics compare strains against the PBS. ns = nonsignificant; ** = p > 0.005.
Jof 11 00090 g005
Figure 6. Visual examples of symptoms appearing in larvae of G. mellonella following infection with F. musae strains. Larvae were infected with 1 × 10³ conidia/larva in a volume of 10 μL of strain F31; injection with PBS was used as negative control. Representative pictures on day of infection and three days after infection are shown here (A). Symptoms observed during disease progression assessment: cocoon formation (B); complete melanization and consequent death (C); and appearance of a single dark spot (D).
Jof 11 00090 g006
Figure 7. Disease severity in G. mellonella caused by our collection of F. musae strains calculated for each larva. Graphs were made with the data analysis framework estimation stats with default parameters; PBS is used as shared control. (A) Disease severity indexes of strains isolated from banana. (B) Disease severity indexes of strains isolated from human patients. In both (A) and (B), the upper graphs refer to the distribution of the disease severity indexes, and the bottom graphs refer to the mean difference in value between samples inoculated with F. musae spores and with PBS, with error bars indicating a 95% confidence level. Each dot indicates a single measure.
Jof 11 00090 g007
Figure 8. Infection in G. mellonella larvae with F. musae strains and F. oxysporum. The graph was made with the data analysis framework estimation stats with default parameters; Fusarium oxysporum f.sp. lycopersici R1 strain was used as shared control. (A) Disease severity indexes of strains isolated from banana. (B) Disease severity indexes of strains isolated from human patients. In both (A) and (B), the upper graphs refer to the distribution of the disease severity indexes, and the bottom graphs refer to the mean difference in value between samples inoculated with F. musae spores and with F. oxysporum spores, with error bars indicating a 95% confidence level. Each dot indicates a single measure.
Jof 11 00090 g008
Figure 9. Survival plot of F. musae infection in G. mellonella larvae. Each color corresponds to a strain. Infection was initiated on day 0 and monitored for 7 days; 10 larvae were infected per strain, and average values for each timepoint are represented. Injection with PBS is used as negative control. Mean and SD are represented in the graph. The statistics compare all strains against the PBS. ns = nonsignificant; * = p > 0.05; ** = p > 0.005; *** = p > 0.0005; **** = p < 0.0001.
Jof 11 00090 g009
Figure 10. Superplot of virulence of our strains in two hosts. Overall indexes are represented in yellow when related to banana infection and in blue when related to G. mellonella. Small dots represent single infection points on bananas or single larvae; bigger dots represent mean values. Infection with strain F31 is considered as a reference. Data obtained from the infection with the entire collection of strains are normalized by dividing for the mean value obtained from infection scoring of the strain F31.
Jof 11 00090 g010
Table 1. F. musae collection. For each strain, the country, the host from which it was isolated, and the reference to first description are indicated. a Five strains isolated from bananas and b four strains isolated from human patients were obtained from the ARS Culture Collection database. c Two human strains and d one banana strain were obtained from the Belgian coordinated collections of Microorganisms collection. e Four banana strains were obtained from the Institute of Food Production Sciences in Bari, Italy. f Three strains belonged to the University of Milan.
StrainCountryHost (Tissue)Reference
F31 f
(DSMZ 112727)
Dominican RepublicBanana (fruit)[3]
IUM 11-0507 fGreeceHuman (blood)[6]
IUM 11-0508 fGreeceHuman (cornea)[6]
NRRL 28893 aMexicoBanana (fruit)[1]
NRRL 28895 aMexicoBanana[4]
NRRL 28897 aMexicoBanana[4]
NRRL 43601 bMaryland, USAHuman (skin)[10]
NRRL 43604 bOhio, USAHuman (nasal sinus)[10]
NRRL 43658 bMinnesota, USAHuman (contact lens)[10]
NRRL 43682 bMinnesota, USAHuman (cornea)[10]
NRRL 25673 aGuatemalaBanana (fruit)[1]
(MUCL 53204)
NRRL 25059 aHondurasBanana (fruit)[1]
(CBS 624.87, MUCL 52574)
IHEM 20180 cBrussels, BelgiumHuman (sinus biopsy)[5]
IHEM 19881 cBrest, FranceHuman (shoulder biopsy)[9]
ITEM 1121 ePanamaBanana (fruit)[9]
(MUCL 52573)
ITEM 1142 eEcuadorBanana (fruit)[1]
(MUCL 53196)
ITEM 1149 ePanamaBanana (fruit)[1]
(MUCL 52201)
ITEM 1250 eCanary IslandsBanana (fruit)[1]
(MUCL 53203)
MUCL 51371 dPhilippinesBanana (fruit)[1]
Table 2. Health scoring system for G. mellonella. Representation of the category and scores used to assess the level of disease caused by each strain in G. mellonella [21]. The disease scoring of each larva at every timepoint is the sum of scores obtained for each category.
CategoryDescriptionScore
ActivityNo activity0
Minimal activity on stimulation1
Active when stimulated2
Active without stimulation3
Cocoon formationNo cocoon0
Partial cocoon0.5
Full cocoon1
MelanizationComplete melanization (black)0
Dark spots on brown wax worm1
>3 spots on beige wax worm2
<3 spots on beige wax worm3
No melanization4
SurvivalDead0
Alive1
TOTALSUM
Disclaimer/Publisher’s Note: The statements, opinions and data contained in all publications are solely those of the individual author(s) and contributor(s) and not of MDPI and/or the editor(s). MDPI and/or the editor(s) disclaim responsibility for any injury to people or property resulting from any ideas, methods, instructions or products referred to in the content.