
Portable Electronic Nose for Analyzing the Smell of Nasal Secretions in Calves: Toward Noninvasive Diagnosis of Infectious Bronchopneumonia


Abstract
1. Introduction
2. Materials and Methods
2.1. Ethics Statement
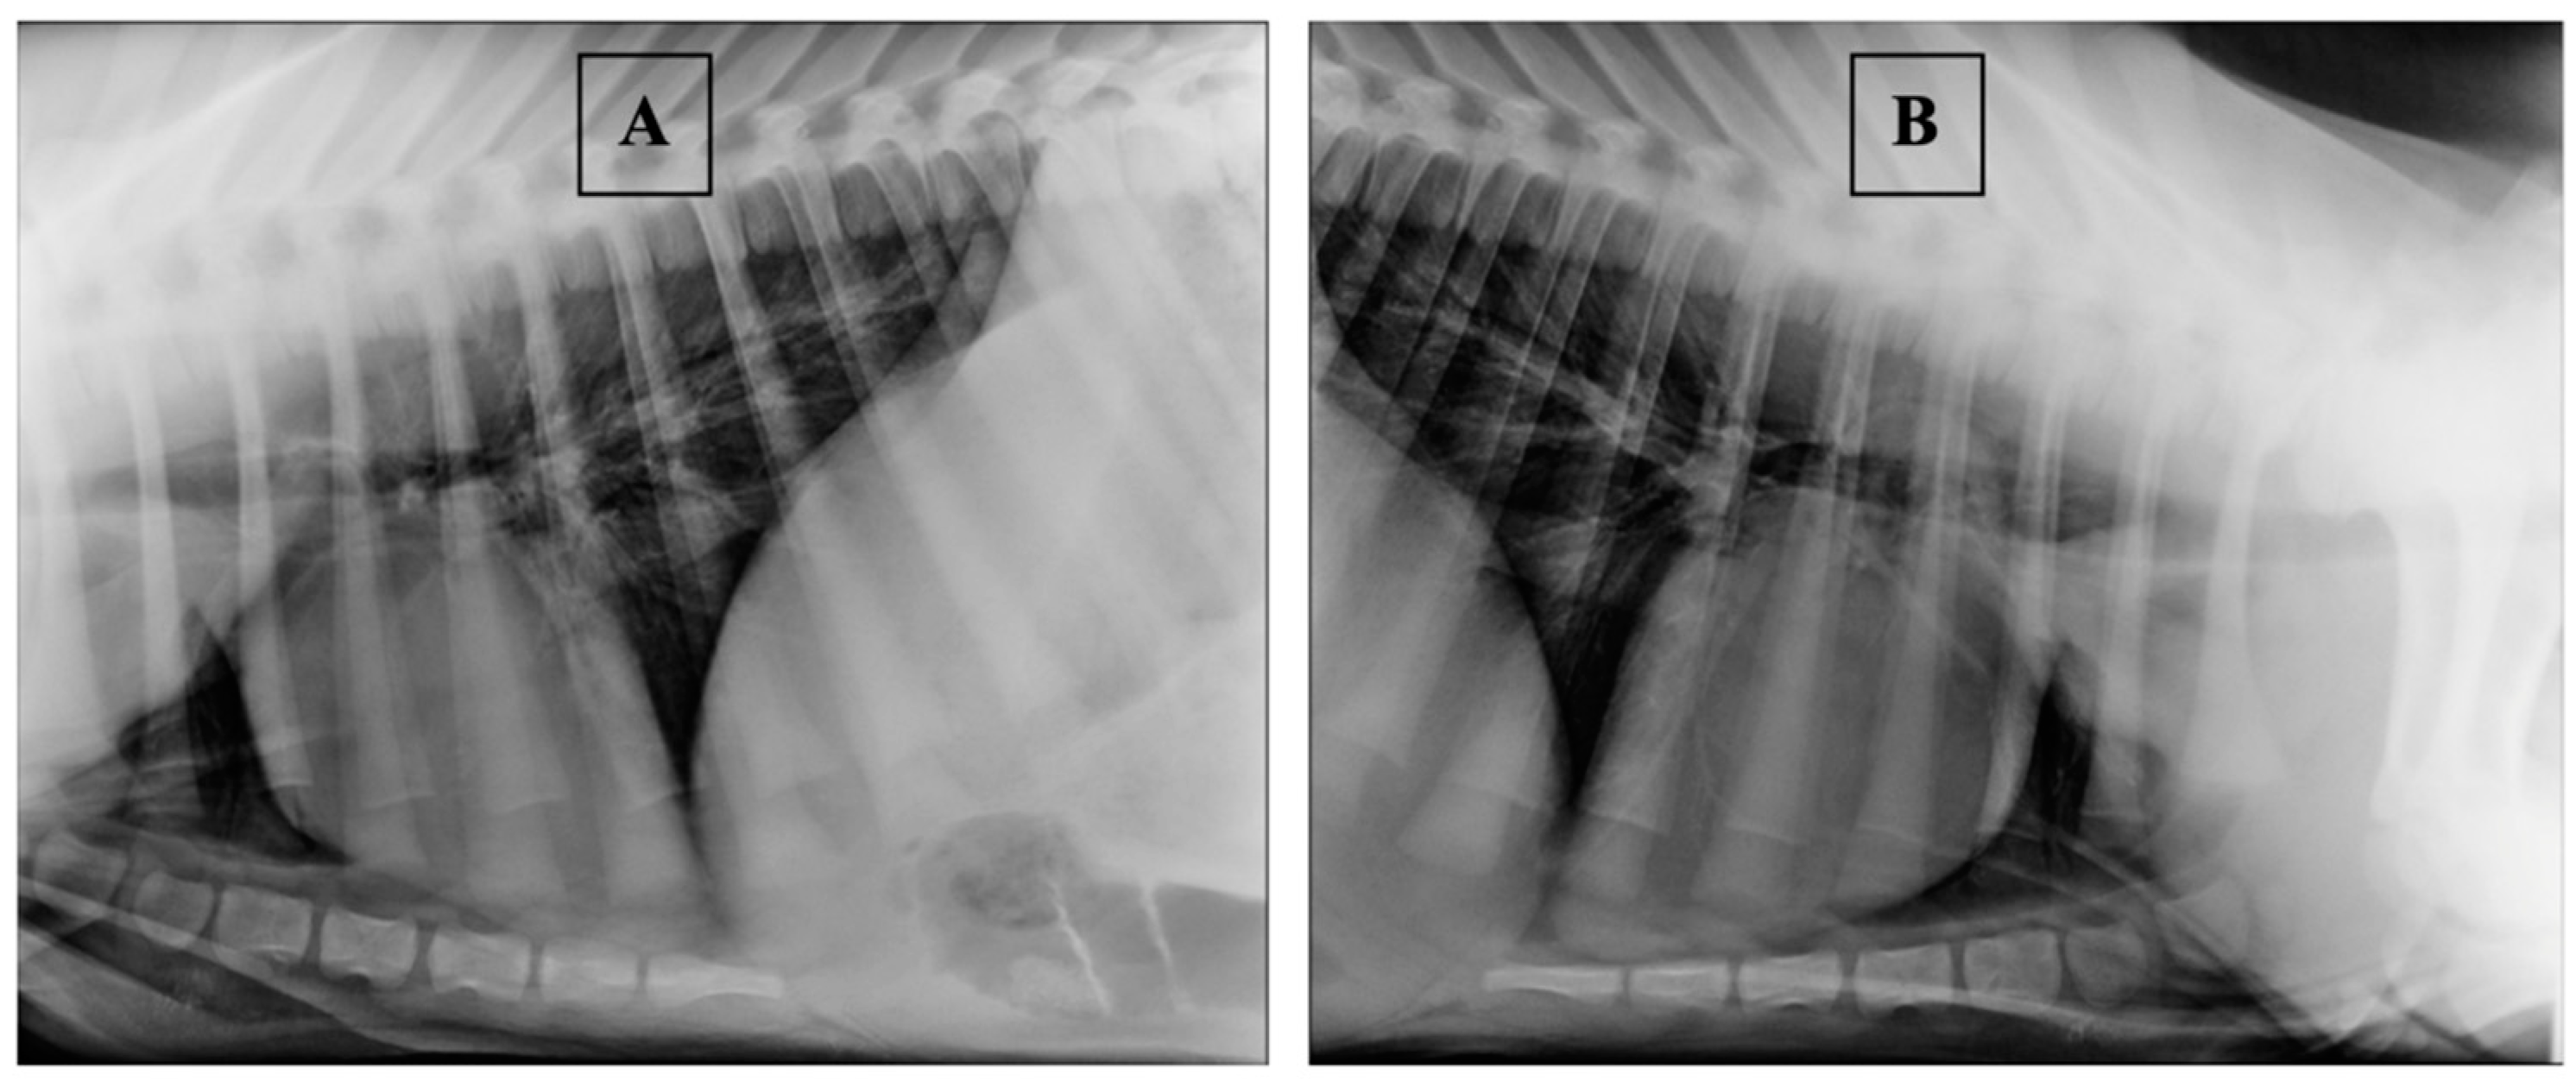
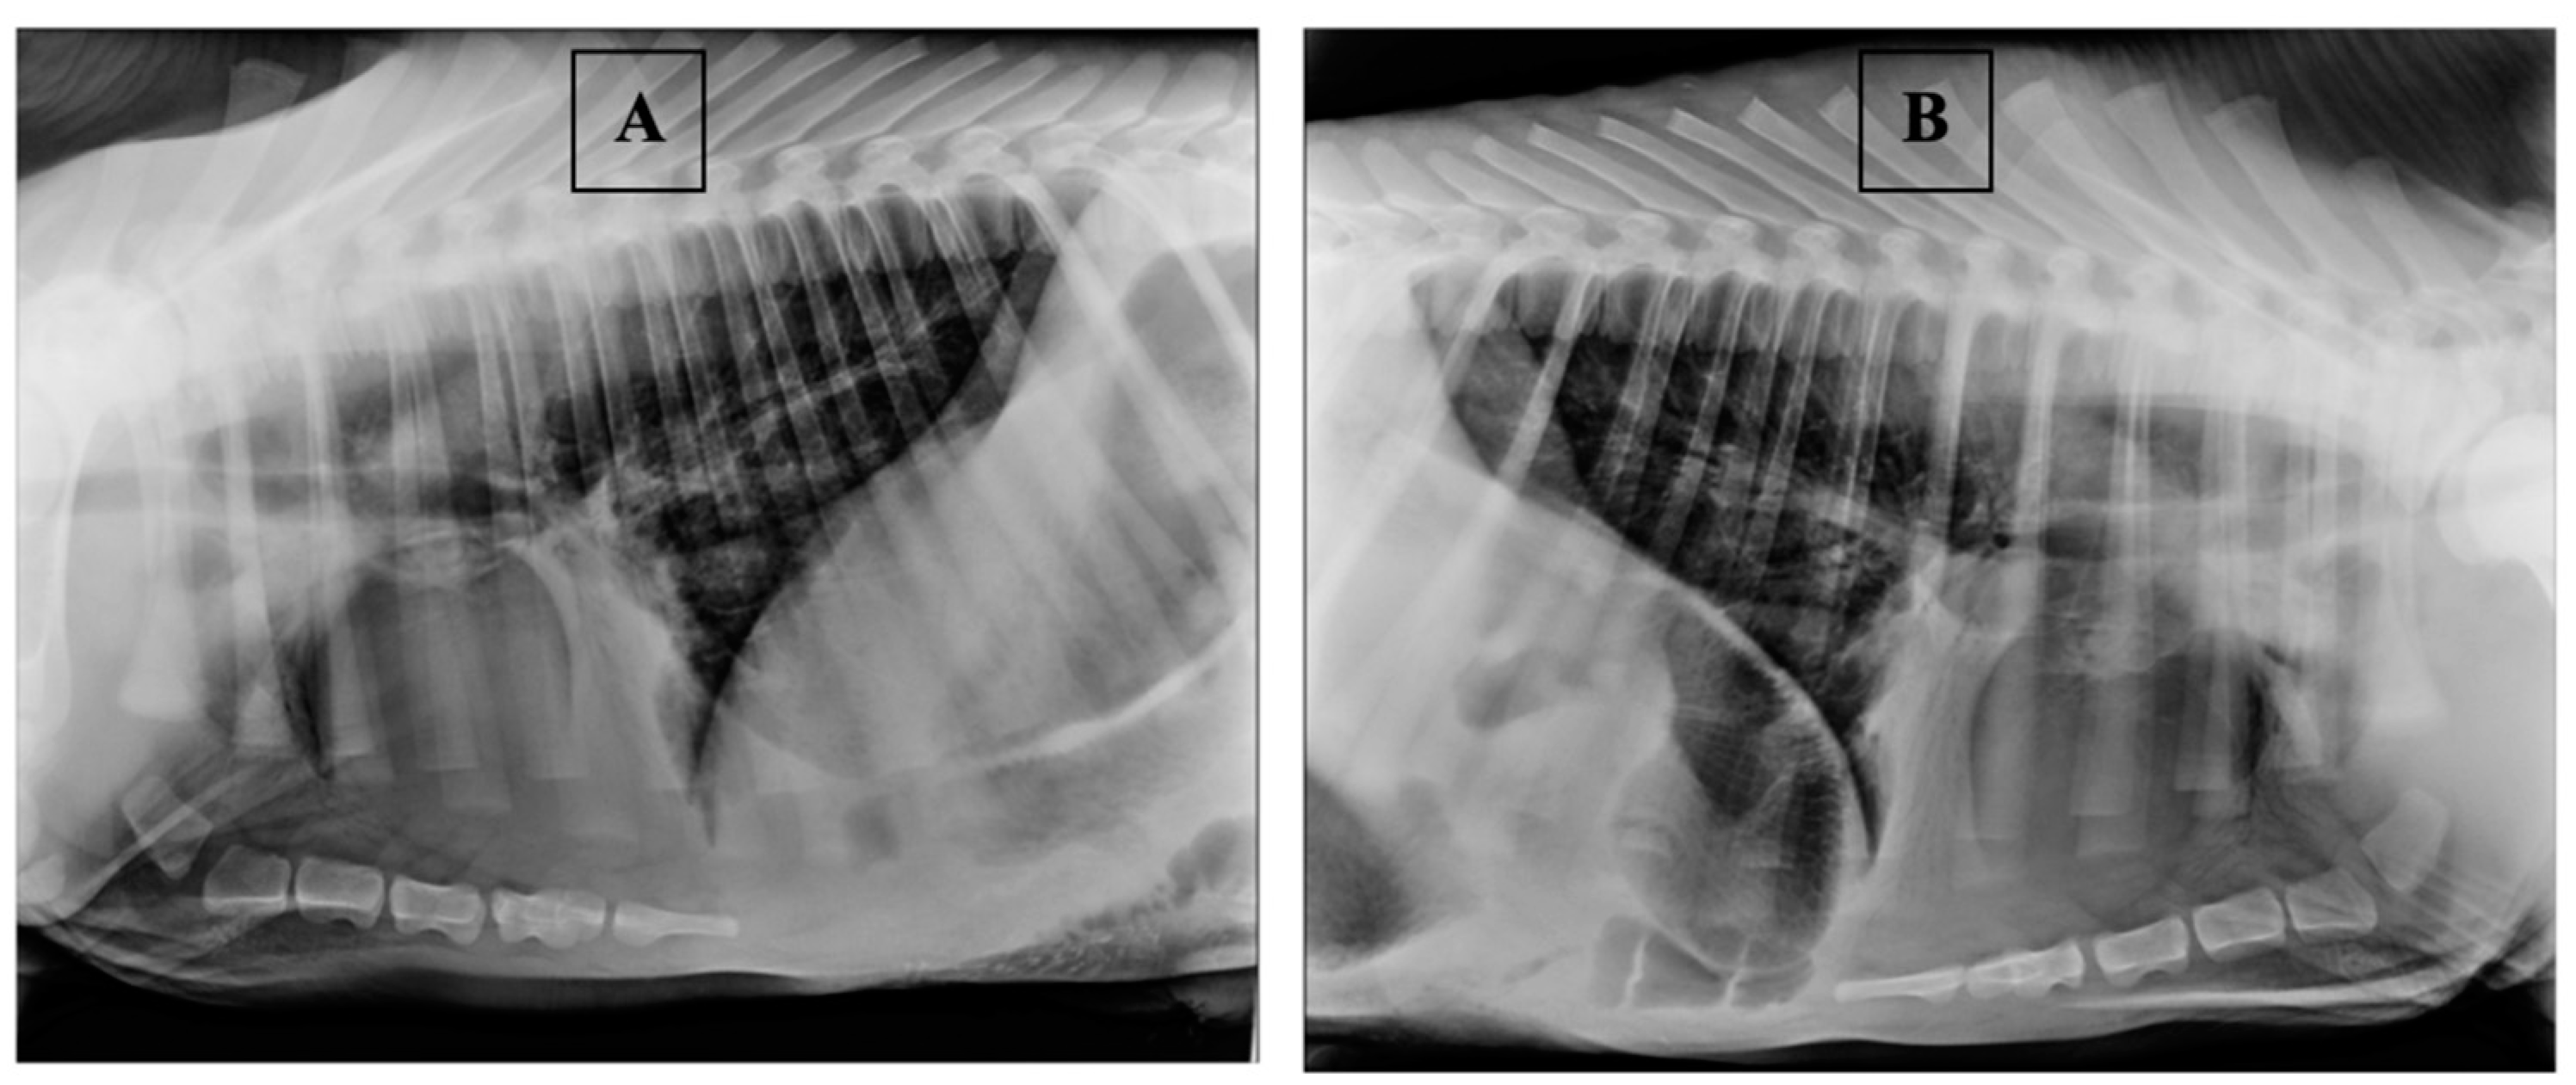
2.2. Animal Materials and Study Design
2.3. Collection of Samples
2.4. Volatile Organic Compounds Analyses
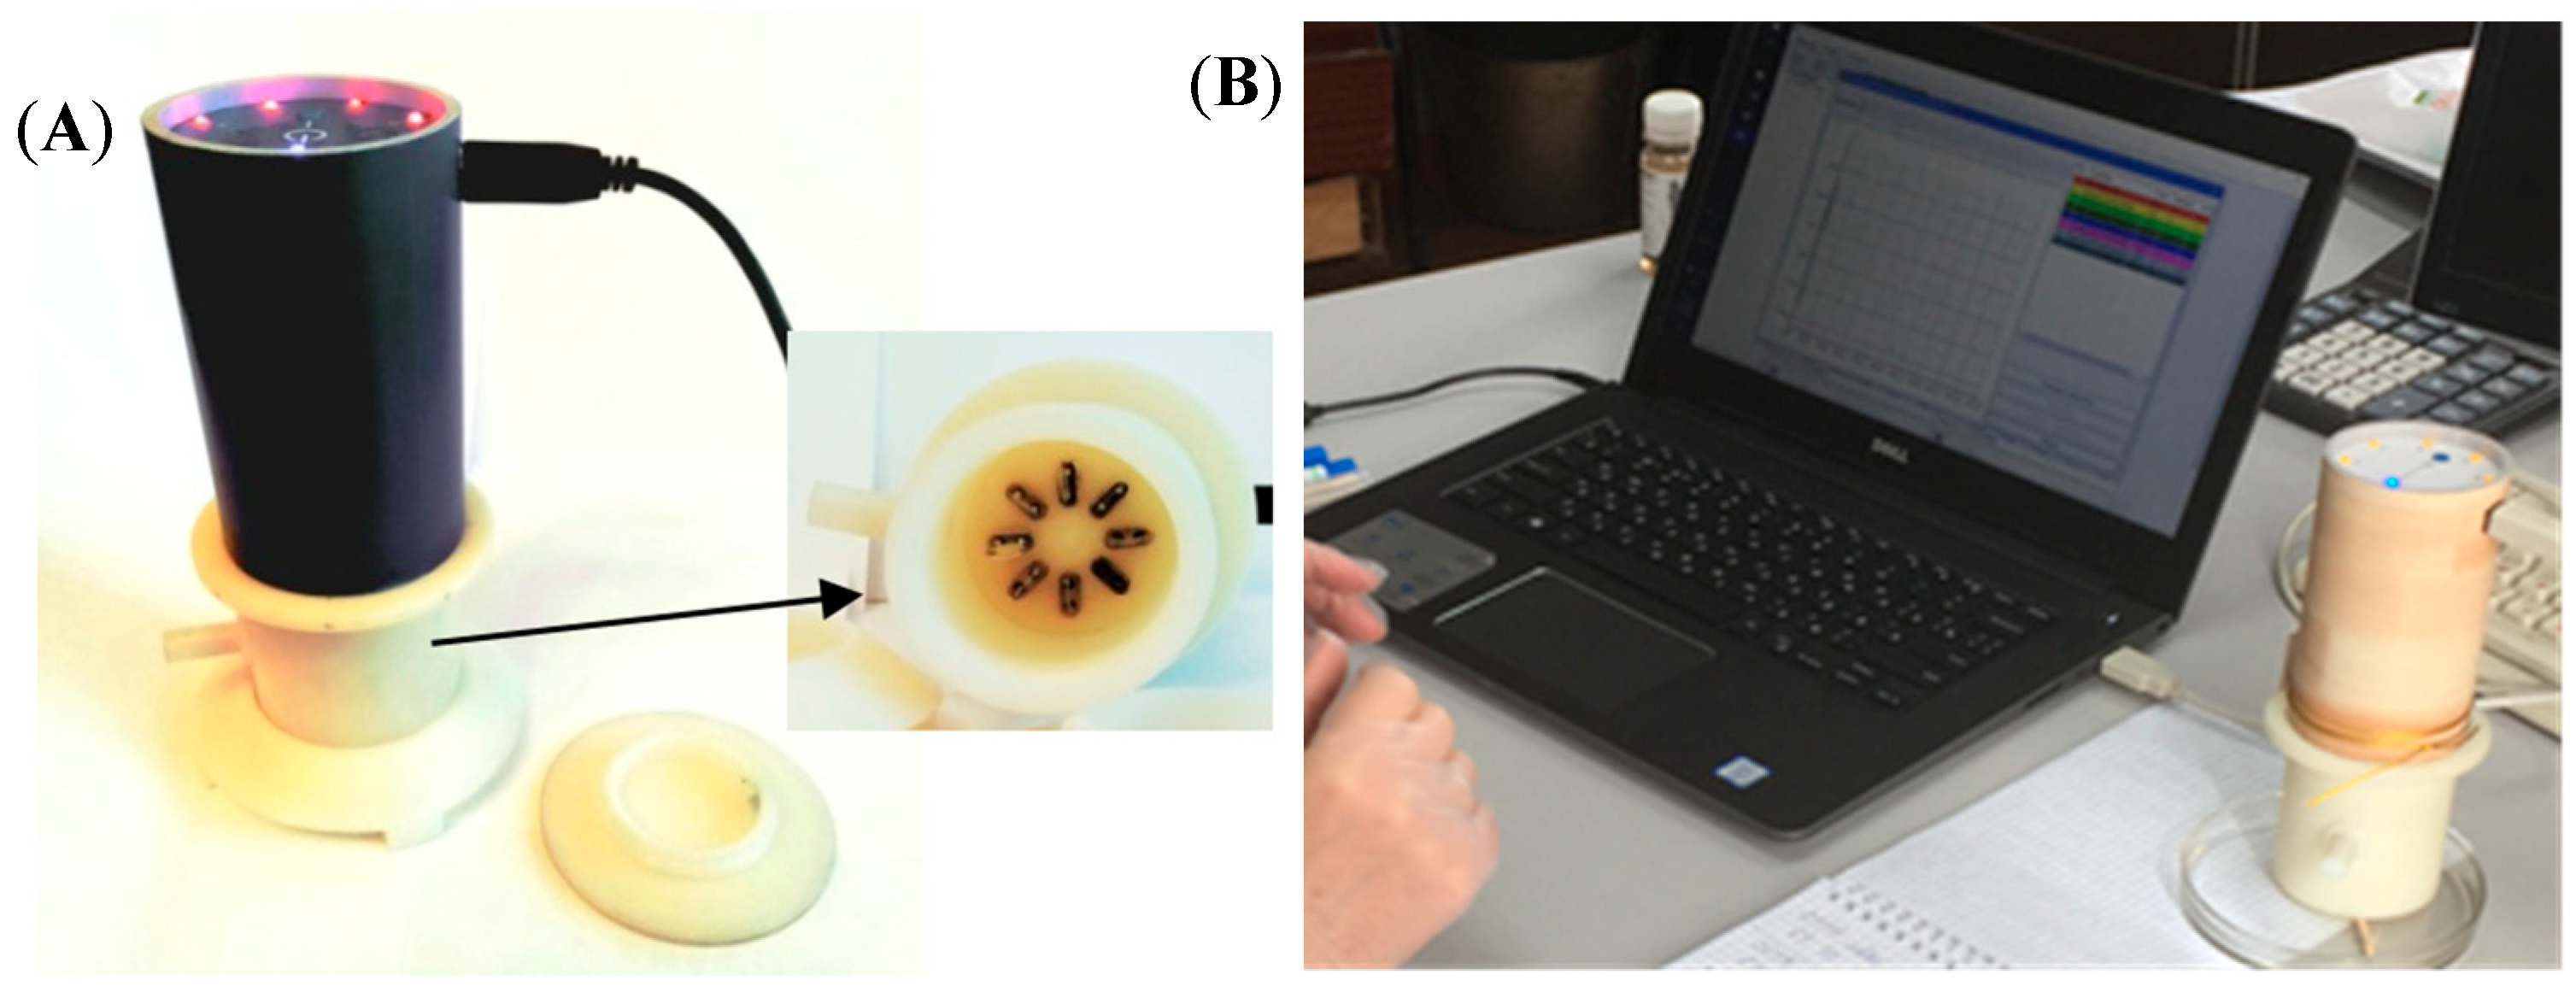
2.4.1. Device and Sensor Array Characteristics
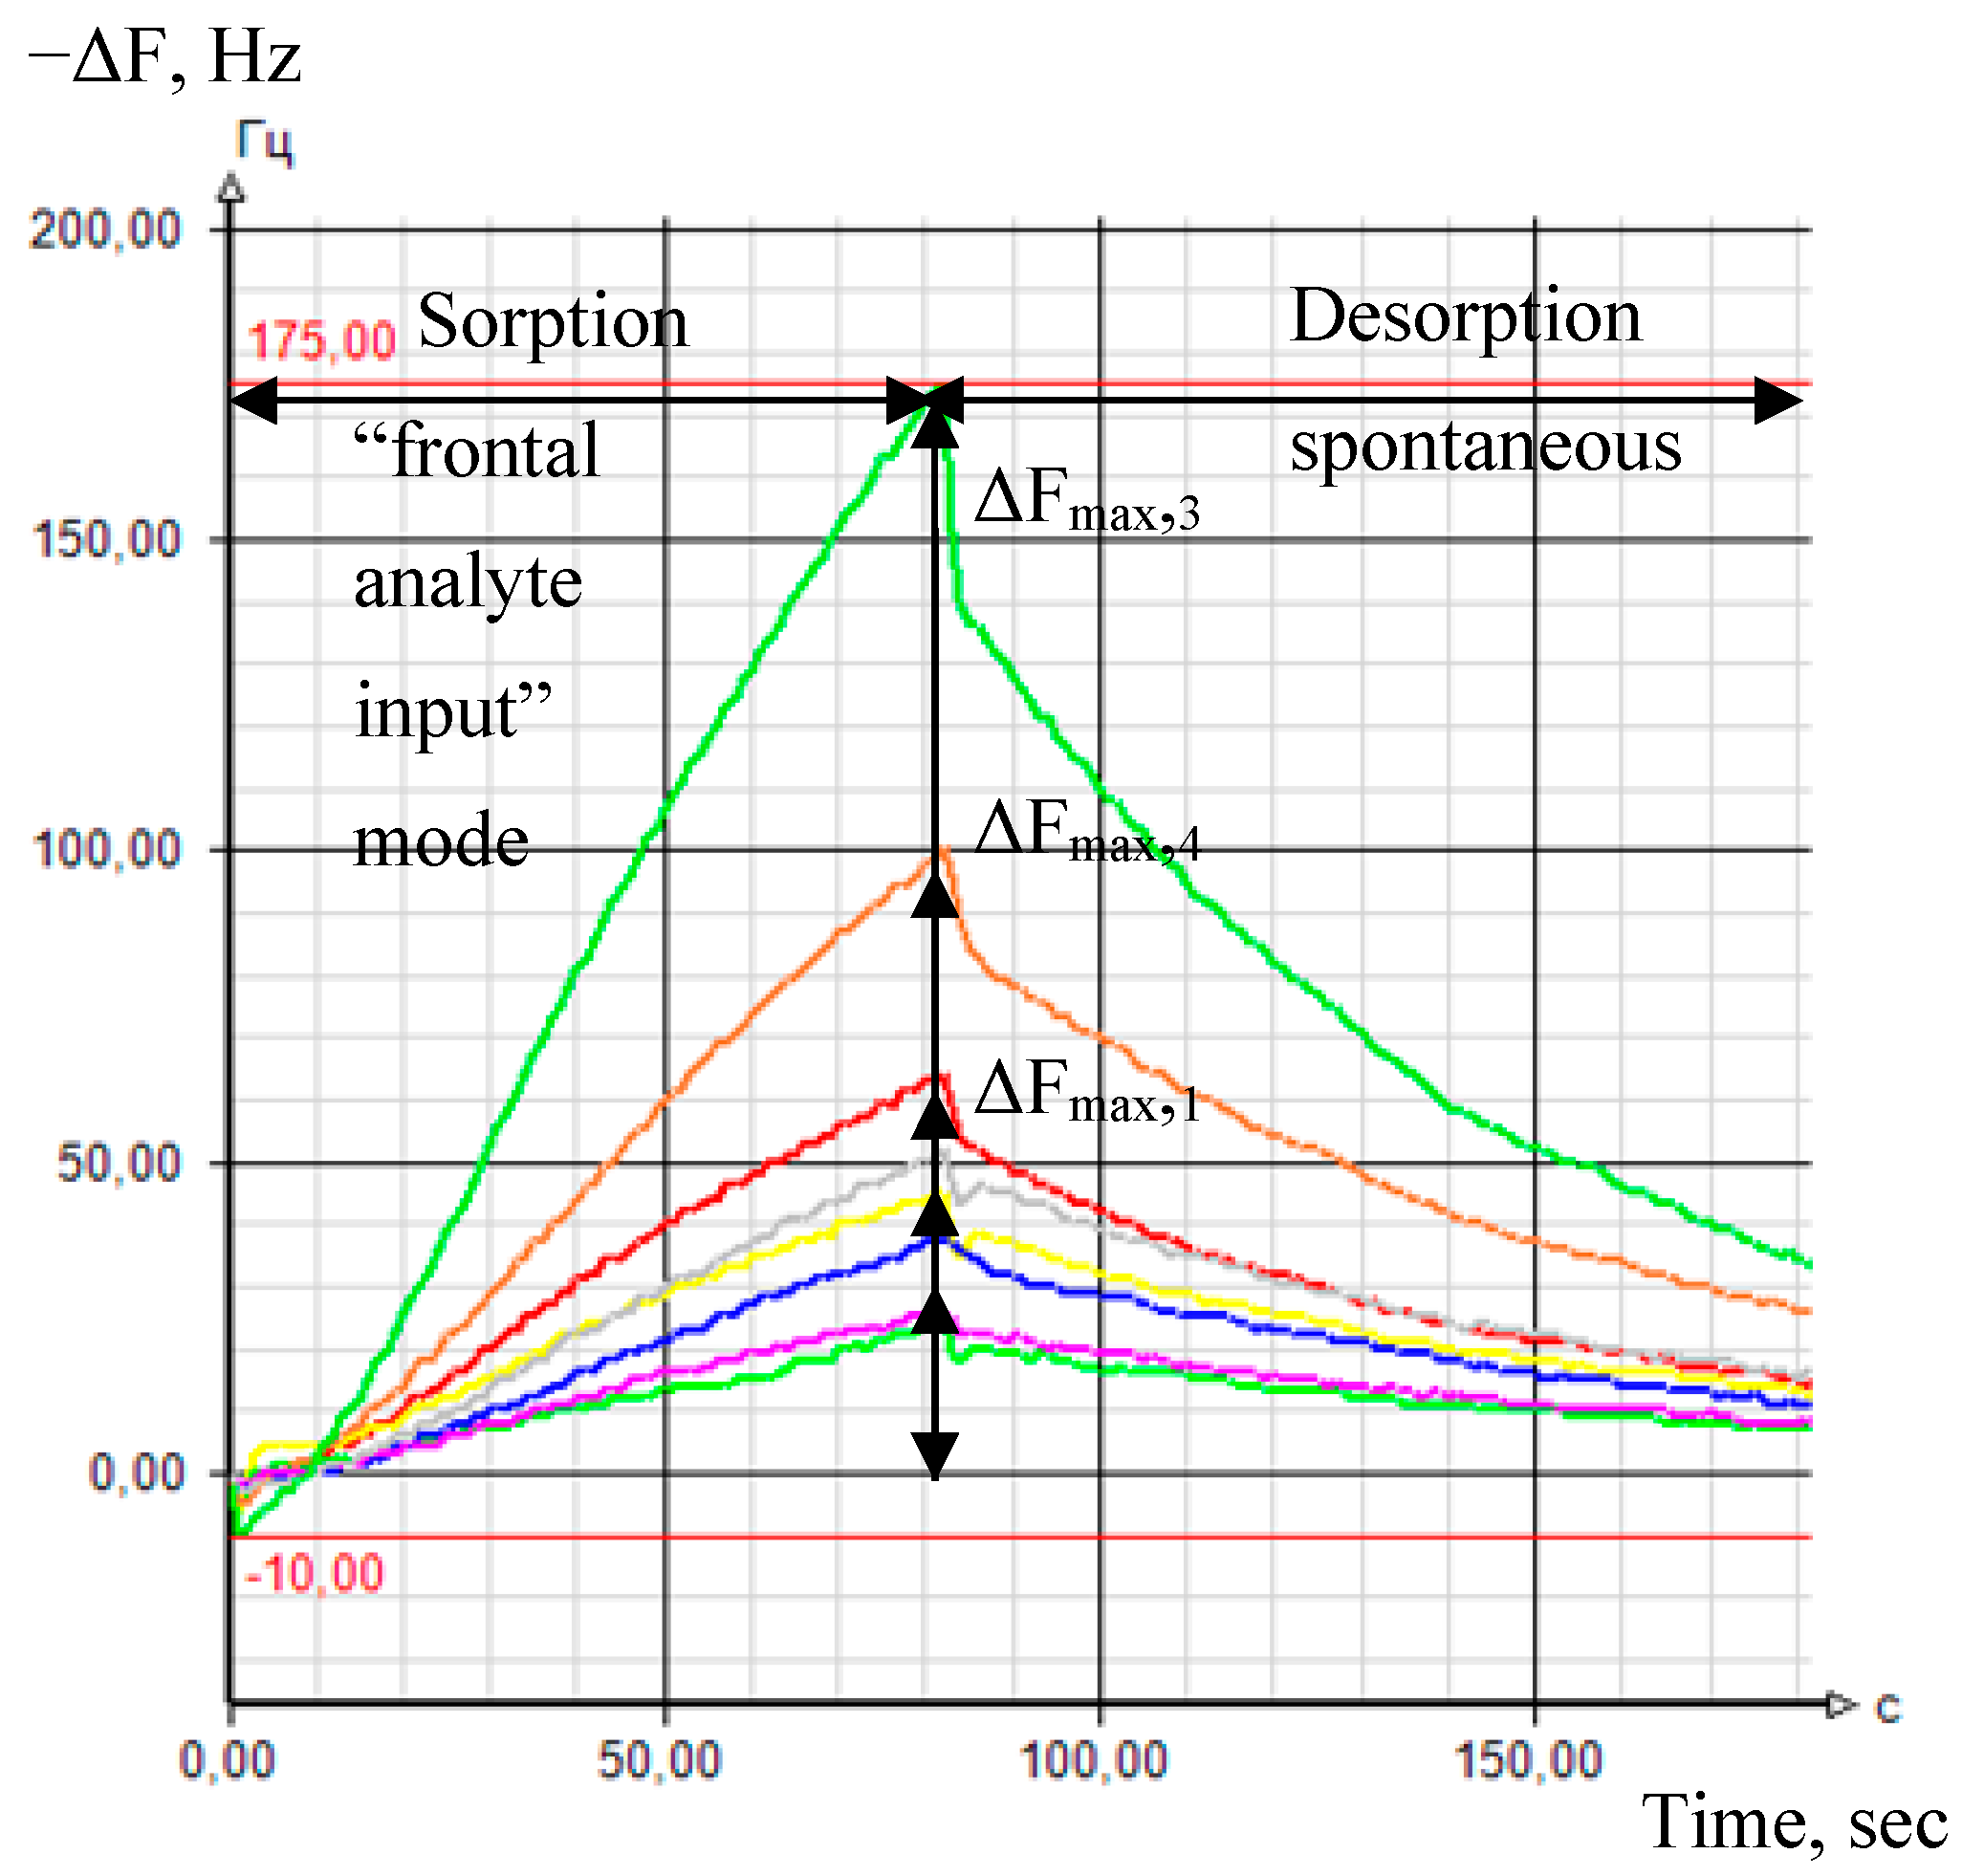
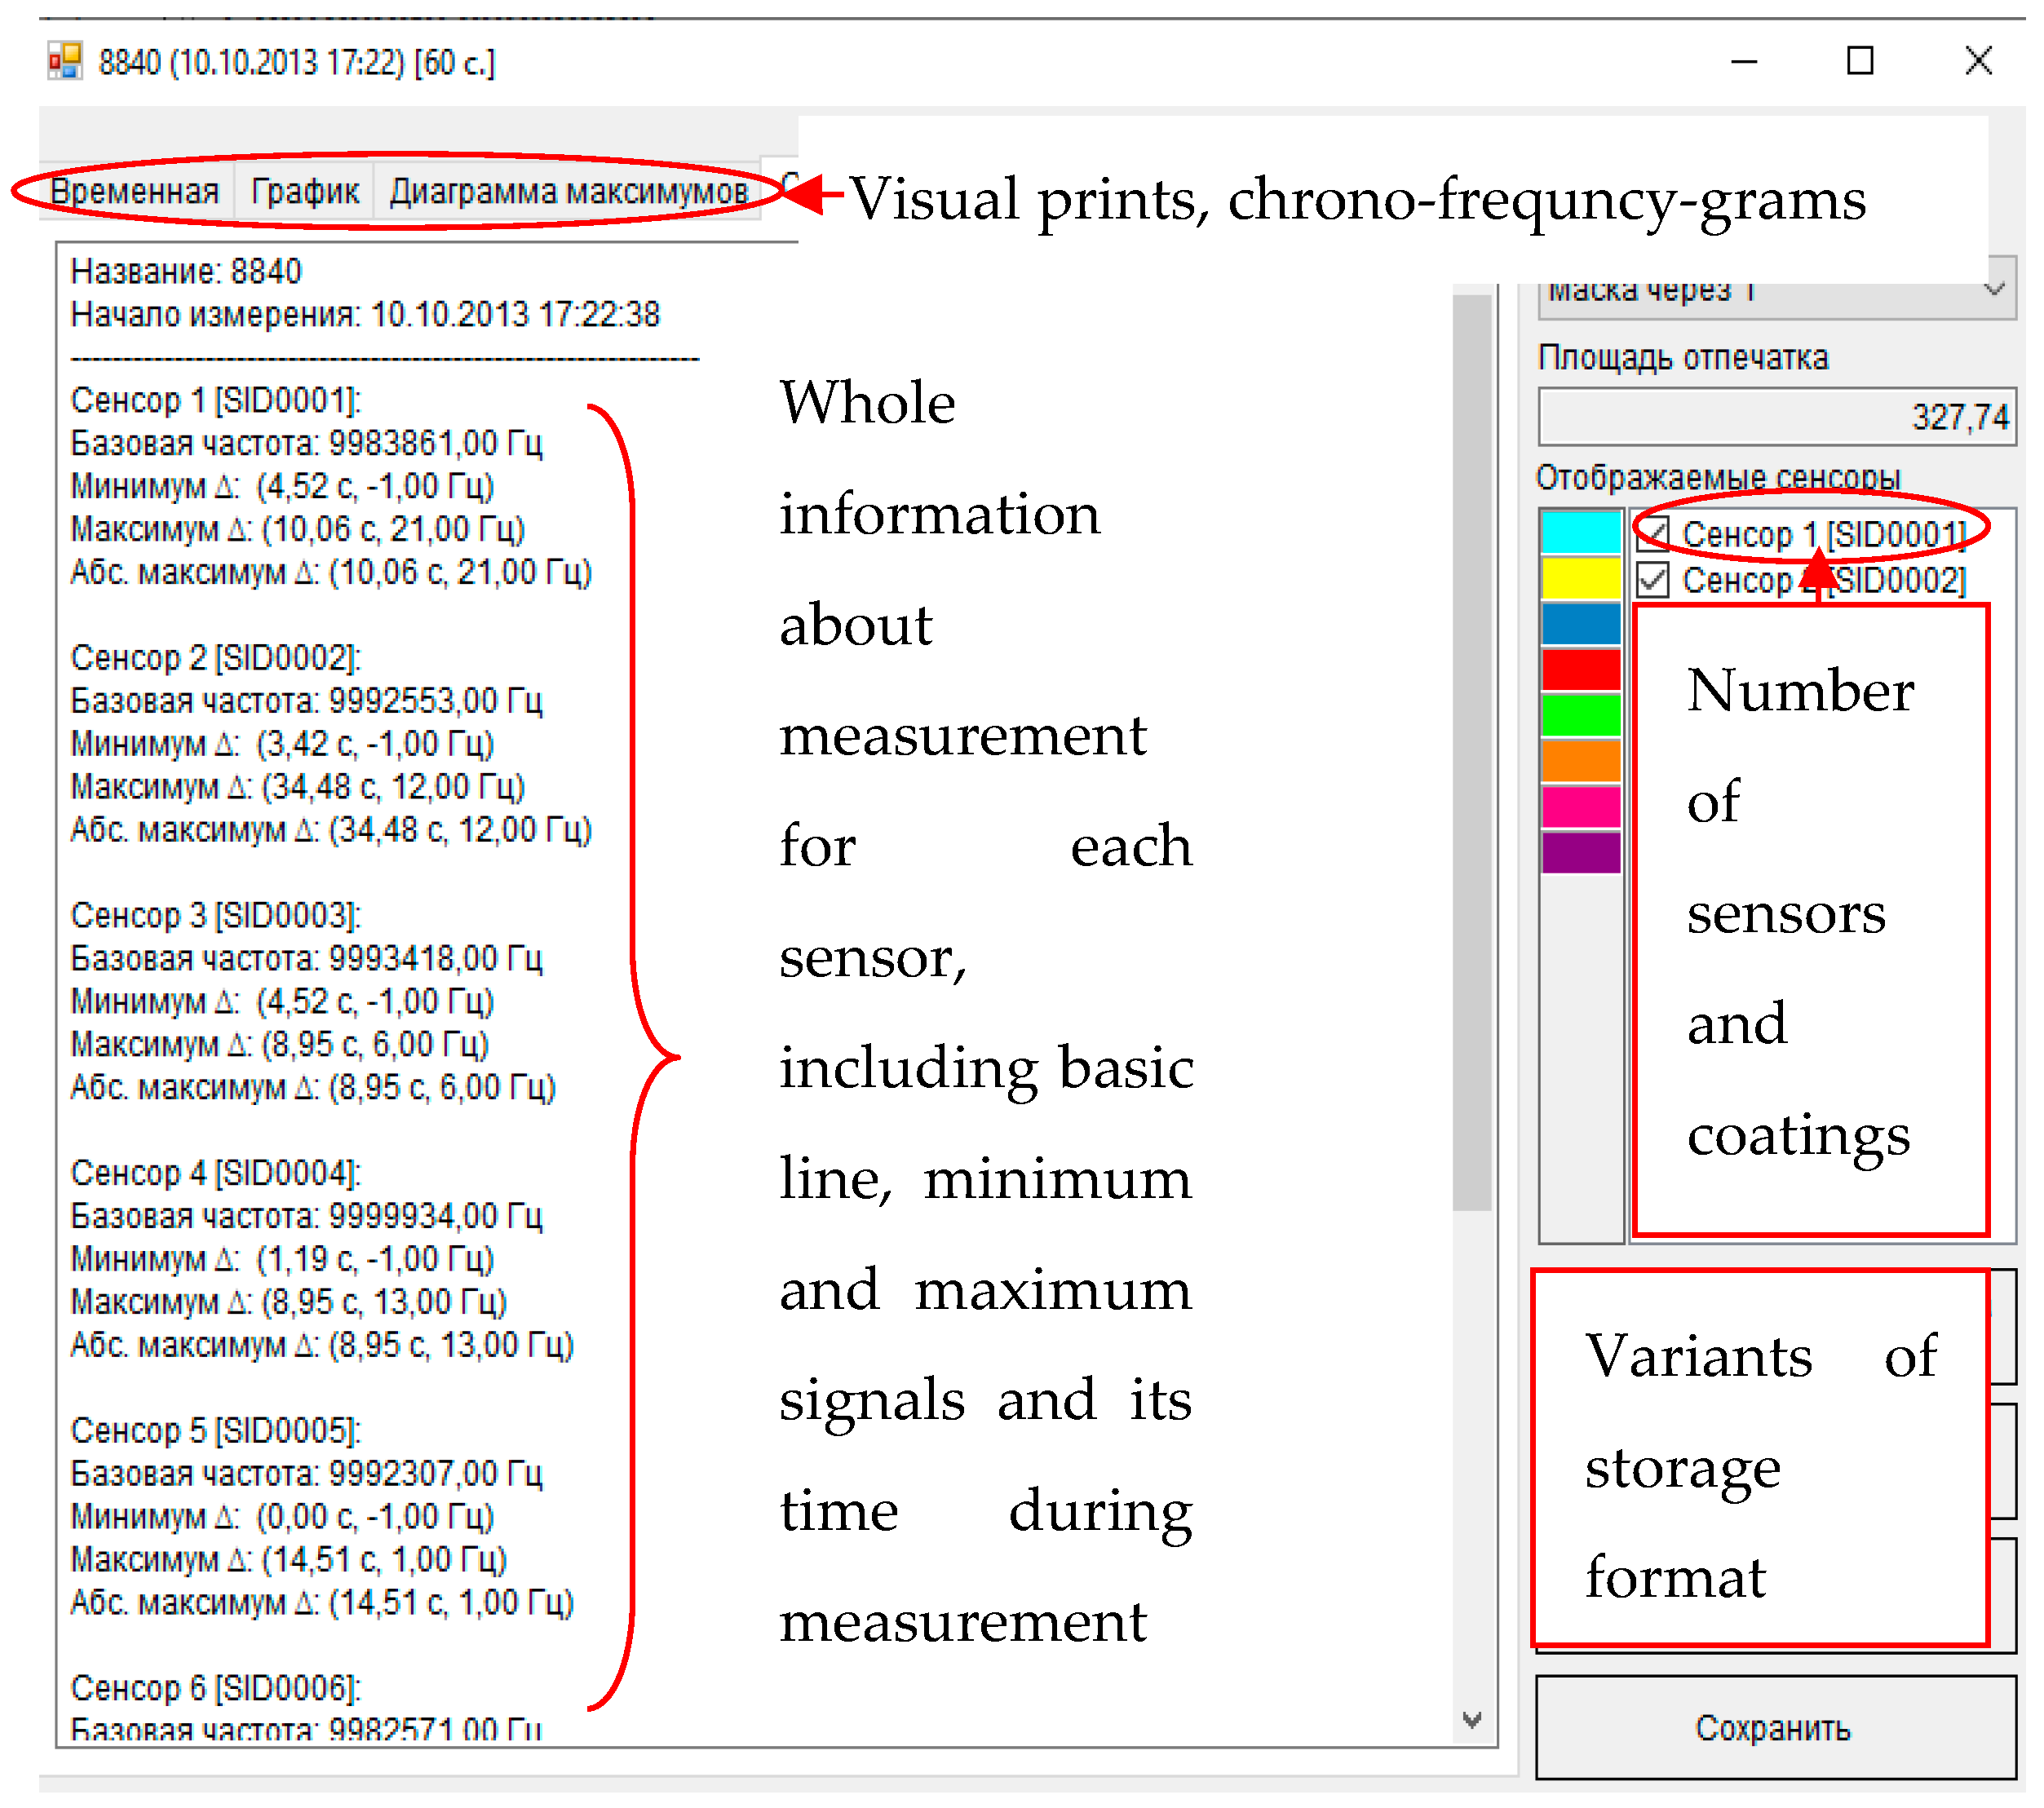
2.4.2. Output Data of Sensor Arrays
2.4.3. Measurement Mode
2.5. Algorithm of Classification
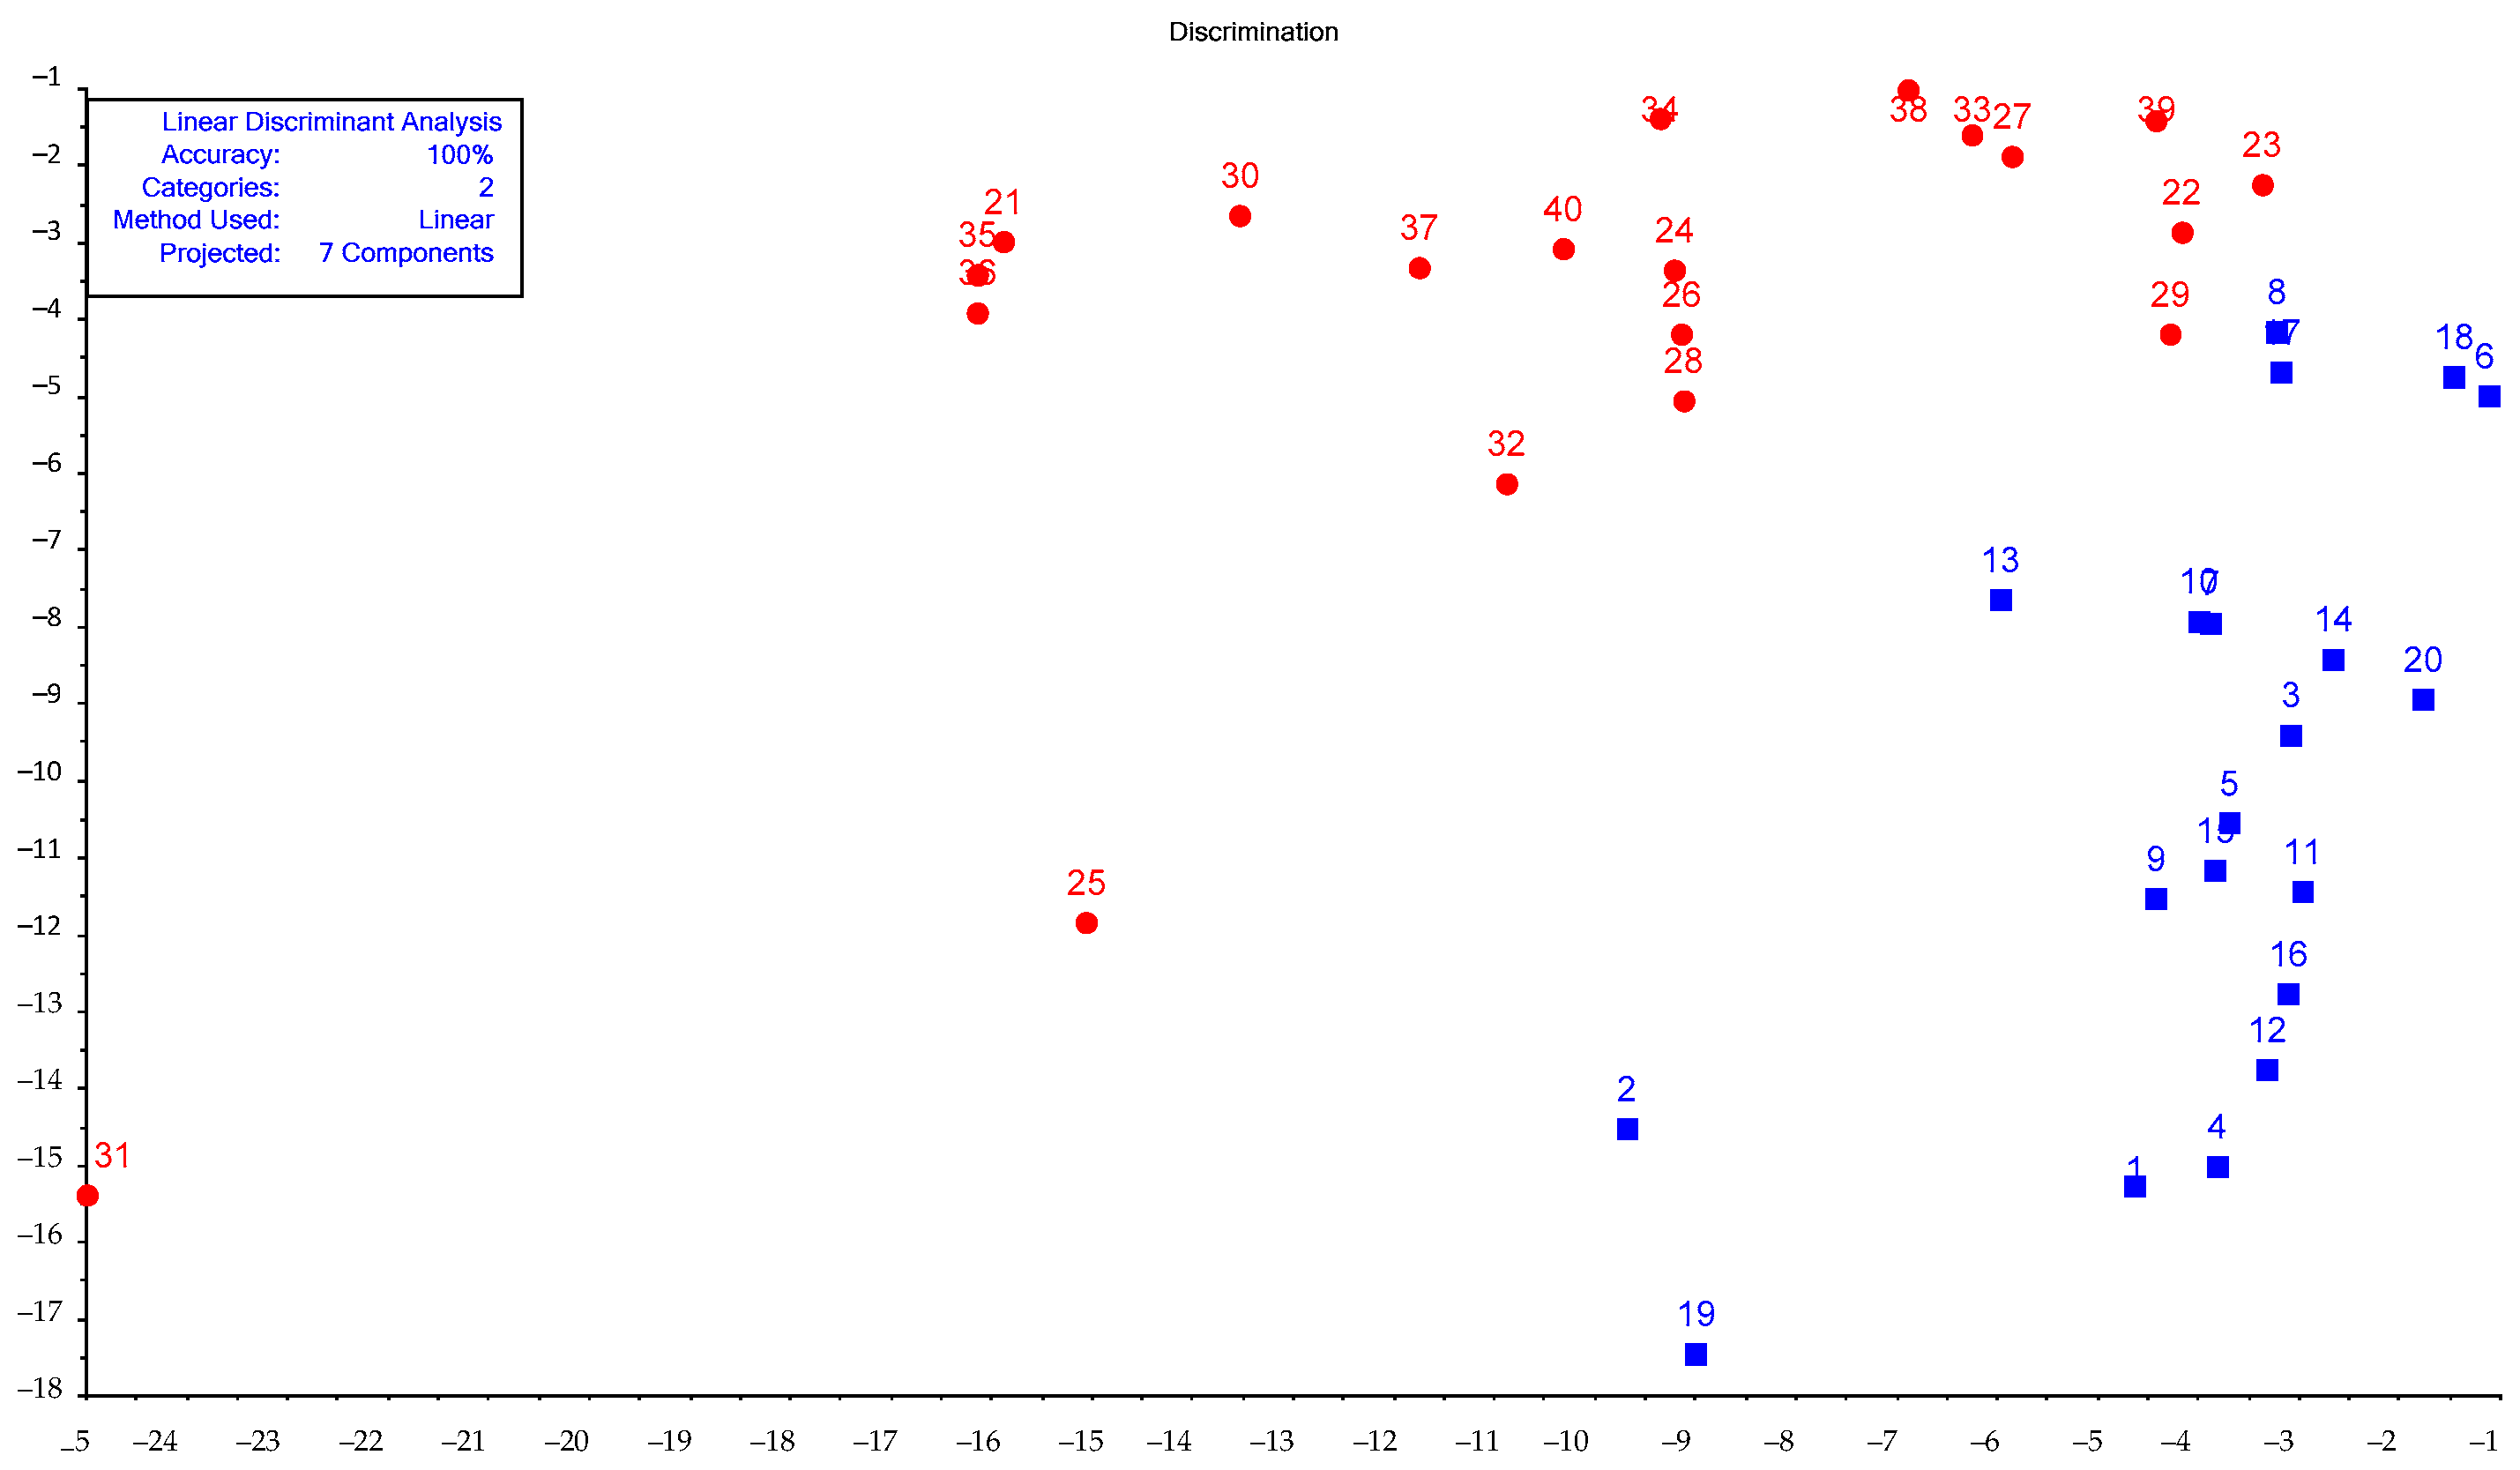
3. Results
4. Discussion
5. Conclusions
Supplementary Materials
Author Contributions
Funding
Institutional Review Board Statement
Informed Consent Statement
Conflicts of Interest
References
- Fulton, R.W. Bovine respiratory disease research (1983–2009). Anim. Health Res. Rev. 2009, 10, 131–139. [Google Scholar] [CrossRef] [PubMed]
- Guterbock, W.M. The impact of BRD: The current dairy experience. Anim. Health Res. Rev. 2014, 15, 130–134. [Google Scholar] [CrossRef]
- Peel, D.S. The Effect of Market Forces on Bovine Respiratory Disease. Vet. Clin. N. Am. Food Anim. Pract. 2020, 36, 497–508. [Google Scholar] [CrossRef]
- Shabunin, S.V.; Shakhov, A.G.; Chernitskiy, A.E.; Zolotarev, A.I.; Retsky, M.I. Respiratory diseases of calves: A modern approach to the problem. Veterinariya 2015, 5, 3–13. [Google Scholar]
- Dubrovsky, S.A.; van Eenennaam, A.L.; Karle, B.M.; Rossitto, P.V.; Lehenbauer, T.W.; Aly, S.S. Bovine respiratory disease (BRD) cause-specific and overall mortality in preweaned calves on California dairies: The BRD 10K study. J. Dairy Sci. 2019, 102, 7320–7328. [Google Scholar] [CrossRef]
- Bach, A. Associations between several aspects of heifer development and dairy cow survivability to second lactation. J. Dairy Sci. 2011, 94, 1052–1057. [Google Scholar] [CrossRef]
- Stanton, A.L.; Kelton, D.F.; LeBlanc, S.J.; Wormuth, J.; Leslie, K.E. The effect of respiratory disease and a preventative antibiotic treatment on growth, survival, age at first calving, and milk production of dairy heifers. J. Dairy Sci. 2012, 95, 4950–4960. [Google Scholar] [CrossRef]
- Van der Fels-Klerx, H.J.; Martin, S.W.; Nielen, M.; Huirne, R.B.M. Effects on productivity and risk factors of Bovine Respiratory Disease in dairy heifers; a review for the Netherlands. NJAS Wageningen J. Life Sci. 2002, 50, 27–45. [Google Scholar] [CrossRef]
- Caswell, J.L.; Hewson, J.; Slavić, Ð.; DeLay, J.; Bateman, K. Laboratory and Postmortem Diagnosis of Bovine Respiratory Disease. Vet. Clin. N. Am. Food Anim. Pract. 2012, 28, 419–441. [Google Scholar] [CrossRef] [PubMed]
- Buczinski, S.; Pardon, B. Bovine Respiratory Disease Diagnosis: What Progress Has Been Made in Clinical Diagnosis? Vet. Clin. N. Am. Food Anim. Pract. 2020, 36, 399–423. [Google Scholar] [CrossRef]
- Neibergs, H.L.; Seabury, C.M.; Wojtowicz, A.J.; Wang, Z.; Scraggs, E.; Kiser, J.N.; Neupane, M.; Womack, J.E.; van Eenennaam, A.; Hagevoort, G.R.; et al. Susceptibility loci revealed for bovine respiratory disease complex in pre-weaned Holstein calves. BMC Genom. 2014, 15, 1164. [Google Scholar] [CrossRef]
- Neupane, M.; Kiser, J.N.; Neibergs, H.L. Gene set enrichment analysis of SNP data in dairy and beef cattle with bovine respiratory disease. Anim. Genet. 2018, 49, 527–538. [Google Scholar] [CrossRef]
- Earley, B.; Buckham, S.K.; Gupta, S. Invited review: Relationship between cattle transport, immunity and respiratory disease. Animal 2017, 11, 486–492. [Google Scholar] [CrossRef] [PubMed]
- Ollivett, T.L. How Does Housing Influence Bovine Respiratory Disease in Dairy and Veal Calves? Vet. Clin. N. Am. Food Anim. Pract. 2020, 36, 385–398. [Google Scholar] [CrossRef] [PubMed]
- Roland, L.; Drillich, M.; Klein-Jöbstl, D.; Iwersen, M. Invited review: Influence of climatic conditions on the development, performance, and health of calves. J. Dairy Sci. 2016, 99, 2438–2452. [Google Scholar] [CrossRef]
- Murray, G.M.; O’Neill, R.G.; More, S.J.; McElroy, M.C.; Earley, B.; Cassidy, J.P. Evolving views on bovine respiratory disease: An appraisal of selected key pathogens—Part 1. Vet. J. 2016, 217, 95–102. [Google Scholar] [CrossRef] [PubMed]
- Pardon, B.; Buczinski, S. Bovine Respiratory Disease Diagnosis: What Progress Has Been Made in Infectious Diagnosis? Vet. Clin. N. Am. Food Anim. Pract. 2020, 36, 425–444. [Google Scholar] [CrossRef] [PubMed]
- Lima, S.F.; Teixeira, A.G.; Higgins, C.H.; Lima, F.S.; Bicalho, R.C. The upper respiratory tract microbiome and its potential role in bovine respiratory disease and otitis media. Sci. Rep. 2016, 6, 29050. [Google Scholar] [CrossRef] [PubMed]
- Zeineldin, M.; Lowe, J.; Aldridge, B. Contribution of the Mucosal Microbiota to Bovine Respiratory Health. Trends Microbiol. 2019, 27, 753–770. [Google Scholar] [CrossRef]
- Fulton, R.W.; Confer, A.W. Laboratory test descriptions for bovine respiratory disease diagnosis and their strengths and weaknesses: Gold standards for diagnosis, do they exist? Can. Vet. J. 2012, 53, 754–761. [Google Scholar]
- Booker, C.W.; Lubbers, B.V. Bovine Respiratory Disease Treatment Failure: Impact and Potential Causes. Vet. Clin. N. Am. Food Anim. Pract. 2020, 36, 487–496. [Google Scholar] [CrossRef]
- Chernitskiy, A.; Shabunin, S.; Kuchmenko, T.; Safonov, V. On-farm diagnosis of latent respiratory failure in calves. Turk. J. Vet. Anim. Sci. 2019, 43, 707–715. [Google Scholar] [CrossRef]
- Fernández, M.; Ferreras, M.d.C.; Giráldez, F.J.; Benavides, J.; Pérez, V. Production Significance of Bovine Respiratory Disease Lesions in Slaughtered Beef Cattle. Animals 2020, 10, 1170. [Google Scholar] [CrossRef] [PubMed]
- Blakebrough-Hall, C.; Dona, A.; D’occhio, M.J.; McMeniman, J.; González, L.A. Diagnosis of Bovine Respiratory Disease in feedlot cattle using blood 1H NMR metabolomics. Sci. Rep. 2020, 10, 115. [Google Scholar] [CrossRef] [PubMed]
- Buczinski, S.; Forté, G.; Francoz, D.; Bélanger, A.M. Comparison of Thoracic Auscultation, Clinical Score, and Ultrasonography as Indicators of Bovine Respiratory Disease in Preweaned Dairy Calves. J. Vet. Intern. Med. 2014, 28, 234–242. [Google Scholar] [CrossRef] [PubMed]
- Mang, A.V.; Buczinski, S.; Booker, C.W.; Timsit, E. Evaluation of a Computer-aided Lung Auscultation System for Diagnosis of Bovine Respiratory Disease in Feedlot Cattle. J. Vet. Intern. Med. 2015, 29, 1112–1116. [Google Scholar] [CrossRef]
- Basoglu, A.; Baspinar, N.; Tenori, L.; Vignoli, A.; Yildiz, R. Plasma metabolomics in calves with acute bronchopneumonia. Metabolomics 2016, 12, 128. [Google Scholar] [CrossRef]
- Maurer, D.L.; Koziel, J.A.; Engelken, T.J.; Cooper, V.L.; Funk, J.L. Detection of Volatile Compounds Emitted from Nasal Secretions and Serum: Towards Noninvasive Identification of Diseased Cattle Biomarkers. Separations 2018, 5, 18. [Google Scholar] [CrossRef]
- Goldansaz, S.A.; Guo, A.C.; Sajed, T.; Steele, M.A.; Plastow, G.S.; Wishart, D.S. Livestock metabolomics and the livestock metabolome: A systematic review. PLoS ONE 2017, 12, e0177675. [Google Scholar] [CrossRef]
- Xia, J.; Broadhurst, D.I.; Wilson, M.; Wishart, D.S. Translational biomarker discovery in clinical metabolomics: An introductory tutorial. Metabolomics 2013, 9, 280–299. [Google Scholar] [CrossRef]
- Wilson, A.D. Applications of Electronic-Nose Technologies for Noninvasive Early Detection of Plant, Animal and Human Diseases. Chemosensors 2018, 6, 45. [Google Scholar] [CrossRef]
- Yáñez-Sedeño, P.; Campuzano, S.; Pingarrón, J.M. Screen-Printed Electrodes: Promising Paper and Wearable Transducers for (Bio)Sensing. Biosensors 2020, 10, 76. [Google Scholar] [CrossRef] [PubMed]
- Wilson, A.D. Noninvasive Early Disease Diagnosis by Electronic-Nose and Related VOC-Detection Devices. Biosensors 2020, 10, 73. [Google Scholar] [CrossRef] [PubMed]
- Cathcart, M.P.; Love, S.; Hughes, K.J. The application of exhaled breath gas and exhaled breath condensate analysis in the investigation of the lower respiratory tract in veterinary medicine: A review. Vet. J. 2012, 191, 282–291. [Google Scholar] [CrossRef] [PubMed]
- Reinhold, P.; Knobloch, H. Exhaled breath condensate: Lessons learned from veterinary medicine. J. Breath Res. 2010, 4, 17001. [Google Scholar] [CrossRef]
- Kuchmenko, T.A.; Shuba, A.A.; Umarkhanov, R.U.; Chernitskii, A.E. Evaluation of correlation of signals of “electronic nose” for nasal mucus and exhaled breath condensate of calves with clinical and laboratory indicators. Anal. Kontrol 2019, 23, 557–562. [Google Scholar] [CrossRef]
- Kuchmenko, T.A.; Shuba, A.A.; Umarkhanov, R.U.; Drozdova, E.V.; Chernitskii, A.E. Application of a Piezoelectric Nose to Assessing the Respiratory System in Calves by Volatile Compounds. J. Anal. Chem. 2020, 75, 645–652. [Google Scholar] [CrossRef]
- Carrillo, J.; Duran, C. Fast Identification of Bacteria for Quality Control of Drinking Water through a Static Headspace Sampler Coupled to a Sensory Perception System. Biosensors 2019, 9, 23. [Google Scholar] [CrossRef]
- Ihde, M.H.; Pridmore, C.F.; Bonizzoni, M. Pattern-Based Recognition Systems: Overcoming the Problem of Mixtures. Anal. Chem. 2020, 92, 16213–16220. [Google Scholar] [CrossRef] [PubMed]
- Jha, S.K.; Yadava, R.D.S.; Hayashi, K.; Patel, N. Recognition and sensing of organic compounds using analytical methods, chemical sensors, and pattern recognition approaches. Chemom. Intell. Lab. Syst. 2019, 185, 18–31. [Google Scholar] [CrossRef]
- Jiang, H.; He, Y.C.; Chen, Q.S. Qualitative identification of the edible oil storage period using a homemade portable electronic nose combined with multivariate analysis. J. Sci. Food Agric. 2021, 10975. [Google Scholar] [CrossRef]
- Kuchmenko, T.A.; Shuba, A.A.; Tyurkin, I.A.; Bityukova, V.V. Estimation of the state of biological samples by the composition of the headspace using a multisensor system. J. Anal. Chem. 2014, 69, 485–494. [Google Scholar] [CrossRef]
- Kuchmenko, T.A.; Shuba, A.A.; Bityukova, V.V.; Matveeva, N.A. Application of a Chemical Sensor Array to Assessing the Presence of Neoplasms by Blood Smell. J. Anal. Chem. 2018, 73, 91–101. [Google Scholar] [CrossRef]
- McGuirk, S.M. Disease management of dairy calves and heifers. Vet. Clin. N. Am. Food Anim. Pract. 2008, 24, 139–153. [Google Scholar] [CrossRef]
- Poulsen, K.P.; McGuirk, S.M. Respiratory disease of the bovine neonate. Vet. Clin. N. Am. Food Anim. Pract. 2009, 25, 121–137. [Google Scholar] [CrossRef]
- Chernitskiy, A.E.; Safonov, V.A. Early detection of bovine respiratory disease in calves by induced cough. In Proceedings of the IOP Conference Series: Earth and Environmental Science, Krasnoyarsk, Russian Federation, 18–20 November 2020; Volume 677, p. 42047. [Google Scholar] [CrossRef]
- Constable, P.D.; Hinchcliff, K.W.; Done, S.H.; Gruenberg, W. Diseases of the respiratory system. In Veterinary Medicine: A Textbook of the Diseases of Cattle, Horses, Sheep, Pigs and Goats, 11th ed.; Saunders Elsevier: St. Louis, MO, USA, 2017; pp. 845–1094. ISBN 978-0-7020-5246-0. [Google Scholar]
- Morgan, J.P. Radiography of the bovine. In Techniques of Veterinary Radiography, 5th ed.; Wiley-Blackwell: Oxford, UK, 1993; pp. 384–432. ISBN 978-0-8138-1727-9. [Google Scholar]
- Farrow, C.S. Bovine pneumonia. Its radiographic appearance. Vet. Clin. N. Am. Food Anim. Pract. 1999, 15, 301–358. [Google Scholar] [CrossRef]
- Fowler, J.; Stieger-Vanegas, S.M.; Vanegas, J.A.; Bobe, G.; Poulsen, K.P. Comparison of Thoracic Radiography and Computed Tomography in Calves with Naturally Occurring Respiratory Disease. Front. Vet. Sci. 2017, 4, 101. [Google Scholar] [CrossRef] [PubMed]
- Korenman, Y.I.; Popova, N.N.; Kuchmenko, T.A.; Suleimanov, S.M. Effect of the morphology of polyethylene glycol esters on the distribution of C-1-C-4 carboxylic acids in the gas phase-sorbent system. Russ. J. Phys. Chem. 2006, 80, 1993–1998. [Google Scholar] [CrossRef]
- Korenman, Y.I.; Popova, N.N.; Kuchmenko, T.A. Determination of formic and acetic acids in air by piezoelectric microweighing. Russ. J. Appl. Chem. 2007, 80, 955–959. [Google Scholar] [CrossRef]
- Korenman, Y.I.; Popova, N.N.; Kuchmenko, T.A. Determination of C-1-C-3 carboxylic acids in air using a sensor. J. Anal. Chem. 2008, 63, 85–89. [Google Scholar] [CrossRef]
- Kuchmenko, T.A.; Asanova, Y.A.; Molchanov, V.I.; Semenyakina, N.V. Effect of solvent on the adsorption of benzene vapors by dicyclohexane-18-crown-6 thin films. J. Anal. Chem. 2009, 64, 354–360. [Google Scholar] [CrossRef]
- Kuchmenko, T.A.; Mishina, A.A. Sorption specifics of volatile amines on thin films of acid-base indicators. J. Anal. Chem. 2011, 66, 701–708. [Google Scholar] [CrossRef]
- Shuba, A.A.; Kuchmenko, T.A.; Samoilova, E.I.; Bel’skikh, N.V. Selection of a Piezoelectric Sensor Array for Detecting Volatile Organic Substances in Water. Mosc. Univ. Chem. Bull. 2016, 71, 68–75. [Google Scholar] [CrossRef]
- Kuchmenko, T.A. Electronic nose based on nanoweights, expectation and reality. Pure Appl. Chem. 2017, 89, 1587–1601. [Google Scholar] [CrossRef]
- Shuba, A.; Kuchmenko, T.; Umarkhanov, R.; Chernitskiy, A. Portable E-nose for Diagnostic of Inflammation and Diverse Variation in Health Status of Humans and Animals. In Proceedings of the Fifth International Conference on Advances in Sensors, Actuators, Metering and Sensing (ALLSENSORS 2020), Valencia, Spain, 21–25 November 2020; pp. 56–62. [Google Scholar]
- Kuchmenko, T.A.; Lisitskaya, R.P.; Bobrova, O.S. Using a Multi-Sensor Gas Analyzer for Investigating the Change in the Aroma of an Agar Matrix with Natural Ingredients. J. Anal. Chem. 2010, 65, 195–201. [Google Scholar] [CrossRef]
- Kuchmenko, T.A.; Shuba, A.A.; Belskikh, N.V. The identification parameters of organic substances in multisensors piezoquartz microbalance. Anal. Kontrol 2012, 16, 151–161. [Google Scholar]
- GOST 58144-2018 Russia. Protect.gost.ru. Available online: http://protect.gost.ru/document.aspx?control=7&id=230905 (accessed on 7 January 2021).
- Garcia, R.A.; Morales, V.; Martiín, S.; Vilches, E.; Toledano, A. Volatile Organic Compounds Analysis in Breath Air in Healthy Volunteers and Patients Suffering Epidermoid Laryngeal Carcinomas. Chromatographia 2014, 77, 501–509. [Google Scholar] [CrossRef]
- Machado, R.F.; Laskowski, D.; Deffenderfer, O.; Burch, T.; Zheng, S.; Mazzone, P.J.; Mekhail, T.; Jennings, C.; Stoller, J.K.; Pyle, J.; et al. Detection of lung cancer by sensor array analyses of exhaled breath. Am. J. Respir. Crit. Care Med. 2005, 171, 1286–1291. [Google Scholar] [CrossRef] [PubMed]
- Turner, C.; Španěl, P.; Smith, D. A longitudinal study of ammonia, acetone and propanol in the exhaled breath of 30 subjects using selected ion flow tube mass spectrometry, SIFT-MS. Physiol. Meas. 2006, 27, 321–337. [Google Scholar] [CrossRef]
- Turner, C.; Španěl, P.; Smith, D. A longitudinal study of ethanol and acetaldehyde in the exhaled breath of healthy volunteers using selected-ion flow-tube mass spectrometry. Rapid Commun. Mass Spectrom. 2006, 20, 61–68. [Google Scholar] [CrossRef]
- Kuchmenko, T.A.; Shuba, A.A. Informative nature of the electronic nose output signals based on the piezoelectric sensors. Anal. i Kontrol 2017, 21, 72–84. [Google Scholar] [CrossRef][Green Version]
- Vershinin, V.I. Methodology of Computer-Assisted Identification of Substances Using Information Retrieval Systems. J. Anal. Chem. 2000, 55, 417–425. [Google Scholar] [CrossRef]
- Cao, S.; Sun, J.Y.; Yuan, X.Y.; Deng, W.H.; Zhong, B.L.; Chun, J. Characterization of Volatile Organic Compounds of Healthy and Huanglongbing-Infected Navel Orange and Pomelo Leaves by HS-GC-IMS. Molecules 2020, 25, 4119. [Google Scholar] [CrossRef] [PubMed]
- Hu, Y.Y.; Wang, H.; Kong, B.H.; Wang, Y.; Chen, Q. The succession and correlation of the bacterial community and flavour characteristics of Harbin dry sausages during fermentation. LWT 2021, 138, 110689. [Google Scholar] [CrossRef]
- Wilson, A.D. Application of Electronic-Nose Technologies and VOC-Biomarkers for the Noninvasive Early Diagnosis of Gastrointestinal Diseases. Sensors 2018, 18, 2613. [Google Scholar] [CrossRef]
- Zheng, X.C.; Ge, Z.K.; Lin, K.; Zhang, D.D.; Chen, Y.; Xiao, J.; Wang, B.; Shi, X.W. Dynamic changes in bacterial microbiota succession and flavour development during milk fermentation of Kazak artisanal cheese. Int. Dairy J. 2021, 113, 104878. [Google Scholar] [CrossRef]


| Sample | Rectal Temperature, °C | Cough Score | Wisconsin Respiratory Scoring Chart (WI Clinical Score) | Group of Calves |
|---|---|---|---|---|
| 1 | 38.1 | 0 | 0 | Healthy |
| 2 | 38.7 | 0 | 1 | Healthy |
| 3 | 38.6 | 0 | 1 | Healthy |
| 4 | 38.7 | 0 | 1 | Healthy |
| 5 | 38.7 | 0 | 1 | Healthy |
| 6 | 38.8 | 0 | 1 | Healthy |
| 7 | 38.8 | 0 | 1 | Healthy |
| 8 | 38.7 | 0 | 1 | Healthy |
| 9 | 38.3 | 0 | 2 | Healthy |
| 10 | 38.9 | 0 | 2 | Healthy |
| 11 | 39.2 | 0 | 2 | Healthy |
| 12 | 38.8 | 0 | 2 | Healthy |
| 13 | 39.3 | 0 | 2 | Healthy |
| 14 | 39.4 | 0 | 2 | Healthy |
| 15 | 39.0 | 0 | 2 | Healthy |
| 16 | 39.3 | 0 | 2 | Healthy |
| 17 | 39.2 | 0 | 2 | Healthy |
| 18 | 38.3 | 0 | 2 | Healthy |
| 19 | 39.1 | 0 | 2 | Healthy |
| 20 | 39.4 | 0 | 2 | Healthy |
| 21 | 39.6 | 3 | 6 | Sick |
| 22 | 38.6 | 2 | 4 | Sick |
| 23 | 38.3 | 3 | 4 | Sick |
| 24 | 38.8 | 3 | 4 | Sick |
| 25 | 38.9 | 3 | 5 | Sick |
| 26 | 39.4 | 1 | 4 | Sick |
| 27 | 39.3 | 3 | 5 | Sick |
| 28 | 39.4 | 3 | 5 | Sick |
| 29 | 38.4 | 3 | 6 | Sick |
| 30 | 38.9 | 3 | 7 | Sick |
| 31 | 38.8 | 3 | 7 | Sick |
| 32 | 39.3 | 3 | 7 | Sick |
| 33 | 39.3 | 3 | 7 | Sick |
| 34 | 38.9 | 3 | 7 | Sick |
| 35 | 39.0 | 3 | 7 | Sick |
| 36 | 39.8 | 3 | 7 | Sick |
| 37 | 39.4 | 3 | 8 | Sick |
| 38 | 38.4 | 3 | 8 | Sick |
| 39 | 40.0 | 3 | 8 | Sick |
| 40 | 41.7 | 3 | 10 | Sick |
| Sample | Rectal Temperature, °C | Cough Score | WI Clinical Score | Group of Calves |
|---|---|---|---|---|
| 41 | 38.8 | 0 | 1 | Healthy |
| 42 | 38.9 | 0 | 2 | Healthy |
| 43 | 39.4 | 0 | 3 | Healthy |
| 44 | 38.6 | 0 | 3 | Healthy |
| 45 | 39.0 | 0 | 3 | Healthy |
| 46 | 38.8 | 3 | 4 | Sick |
| 47 | 38.3 | 3 | 4 | Sick |
| 48 | 38.5 | 2 | 4 | Sick |
| 49 | 38.6 | 3 | 4 | Sick |
| 50 | 38.5 | 3 | 5 | Sick |
| Number of a Sensor in an Array | Sorbent | Origin |
|---|---|---|
| The first set | ||
| 1, 8 | Carboxylated carbon nanotubes of different masses (1–5 μg) | Institute for Extra Pure Materials of the Russian Academy of Sciences, Russia, Moscow region, Chernogolovka |
| 2, 7 | Zirconium nitrate of different masses (1–5 μg) | Reachem, Moscow Russia, (puriss.) |
| 3 | Dicyclohexane-18-crown-6 | Alfa Aesar, Ward Hill, USA, p.a. |
| 4, 5 | Hydroxyapatite of different masses (1–5 μg) | Own technique of synthesis |
| 6 | Polyethylene glycol succinate | Reachem, Moscow Russia, (puriss.) |
| The second set | ||
| 1 | Polyethylene glycol 2000 | Alfa Aesar, Ward Hill, USA, p.a. |
| 2 | Dicyclohexano-18-crown-6 | Alfa Aesar, Ward Hill, USA, p.a. |
| 3 | Methyl orange | Reachem, Moscow Russia, (puriss.) |
| 4 | Triton X-100 | Alfa Aesar, Ward Hill, USA, p.a. |
| 5 | Bromocresol blue | Reachem, Moscow Russia, (puriss.) |
| 6 | Multiwalled carbon nanotubes | Institute for Extra Pure Materials of the Russian Academy of Sciences, Russia, Moscow region, Chernogolovka |
| 7 | Polyethylene glycol sebacinate | Reachem, Moscow Russia, (puriss.) |
| 8 | Tween-80 | Reachem, Moscow Russia, (puriss.) |
| Parameter | Values for Identification Ai/j ± d * | Identified Substances |
|---|---|---|
| A1/4(1) | 0.95 ± 0.15 | Carboxylic acids C2–C4 |
| A1/5(1) | 0.85 ± 0.04 | Triethylamine, cyclopentylamine |
| 1.50 ± 0.50 | Methylbenzaldehyde, benzaldehyde, formic acid | |
| A2/4(1) | 1.00 ± 0.10 | Ethyl acetate, methylpropanone, acetone |
| 1.80 ± 0.40 | Aliphatic, cyclic amines of normal and isomeric structure | |
| A2/5(1) | 1.65 ± 0.35 | 4-methylbenzaldehyde, benzaldehyde, acetone, formic acid |
| 3.5 ± 1.0 | Cyclohexanone, m-methylcyclohexanone, cyclopentanone, 2-methylhexanone, acetaldehyde, C2–C5 alcohols of normal and isomeric structure | |
| A2/6(1) | 2.75 ± 0.75 | Ketones, alcohols, carboxylic acids C2–C4 |
| 1.50 ± 0.20 | Methylbenzaldehyde, benzaldehyde, water, 2-thiophenecarbaldehyde | |
| A4/6(1) | 5.0 ± 0.2 | Ethanol |
| A4/8(1) | 0.25 ± 0.11 | Ketones, alcohols, benzaldehyde, methylbenzaldehyde, ethyl acetate, acetaldehyde |
| 0.75 ± 0.15 | Water, methylamine |
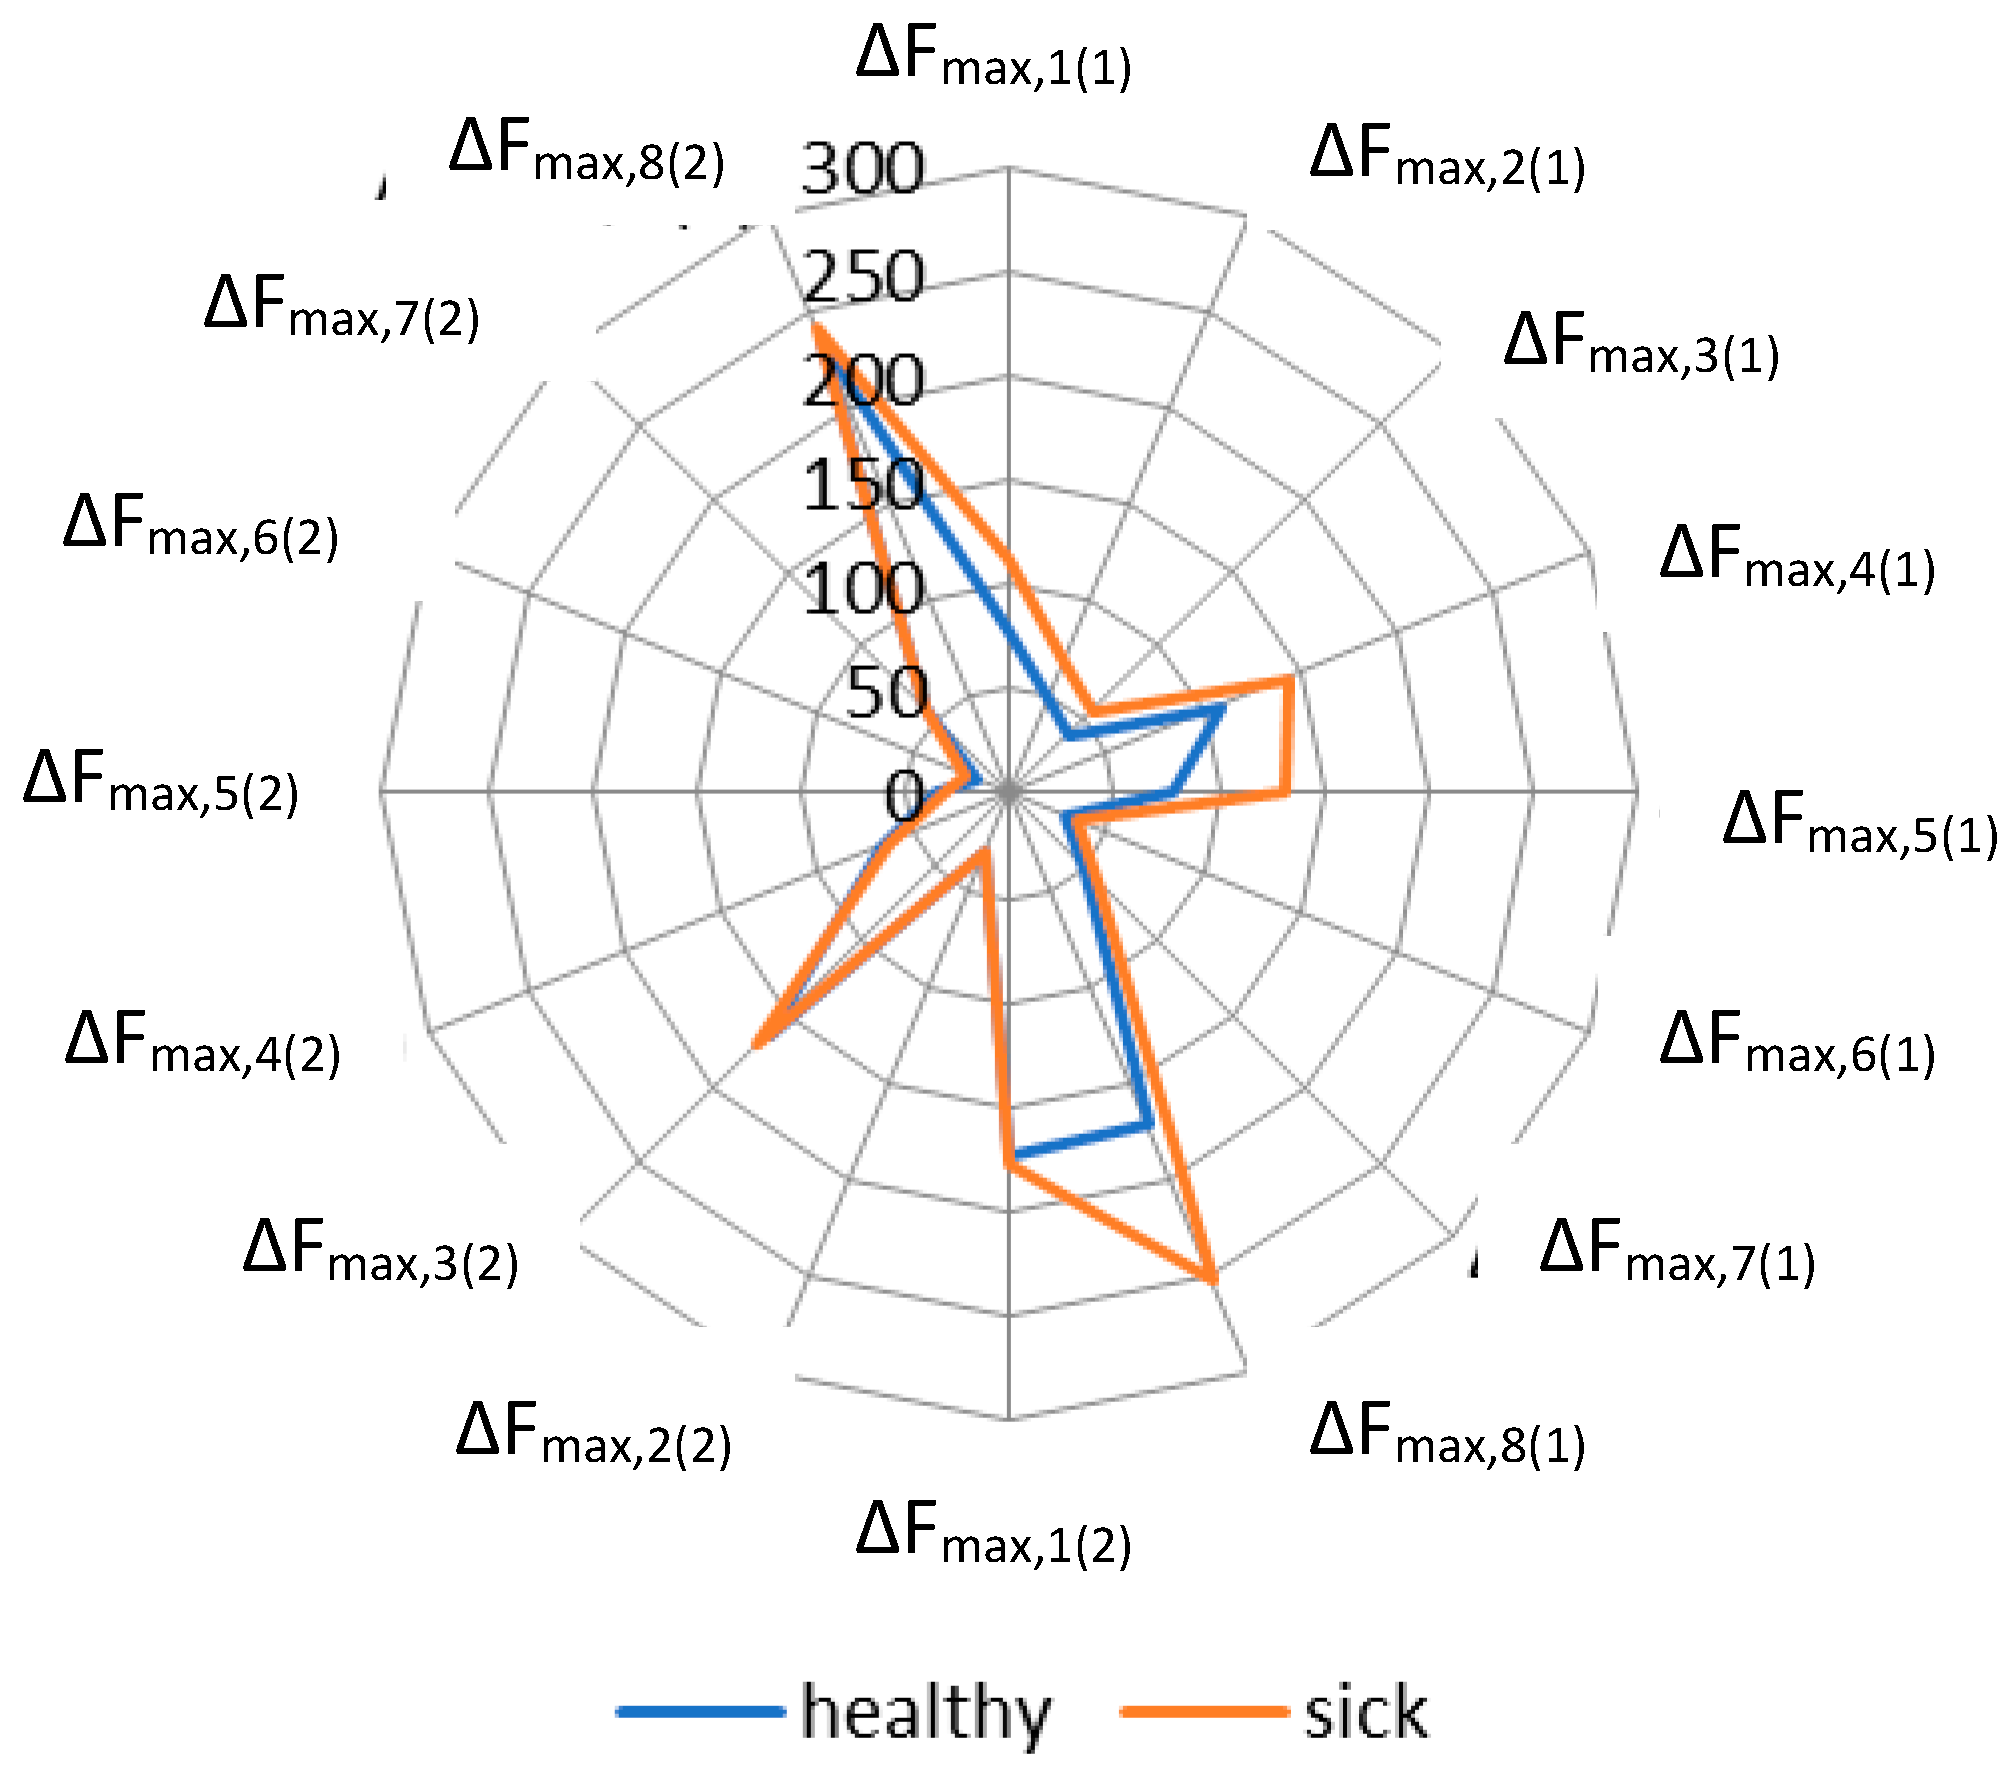
| Coatings | Healthy | Sick | Coatings | Healthy | Sick |
|---|---|---|---|---|---|
| Carboxylated carbon nanotubes 1 * | 15 | 45 | Polyethylene glycol 2000 | 25 | 27 |
| Zirconium nitrate 1 | 16 | 45 | Dicyclohexano-18-crown-6 | 22 | 27 |
| Dicyclohexane-18-crown-6 | 18 | 59 | Methyl orange | 32 | 36 |
| Hydroxyapatite 1 | 23 | 47 | Triton X-100 | 24 | 30 |
| Hydroxyapatite 2 | 23 | 61 | Bromocresol blue | 23 | 45 |
| Polyethylene glycol succinate | 19 | 31 | Multiwalled carbon nanotubes | 42 | 47 |
| Zirconium nitrate 2 | 17 | 21 | Polyethylene glycol sebacinate | 24 | 30 |
| Carboxylated carbon nanotubes 2 | 19 | 58 | Tween 80 | 30 | 25 |
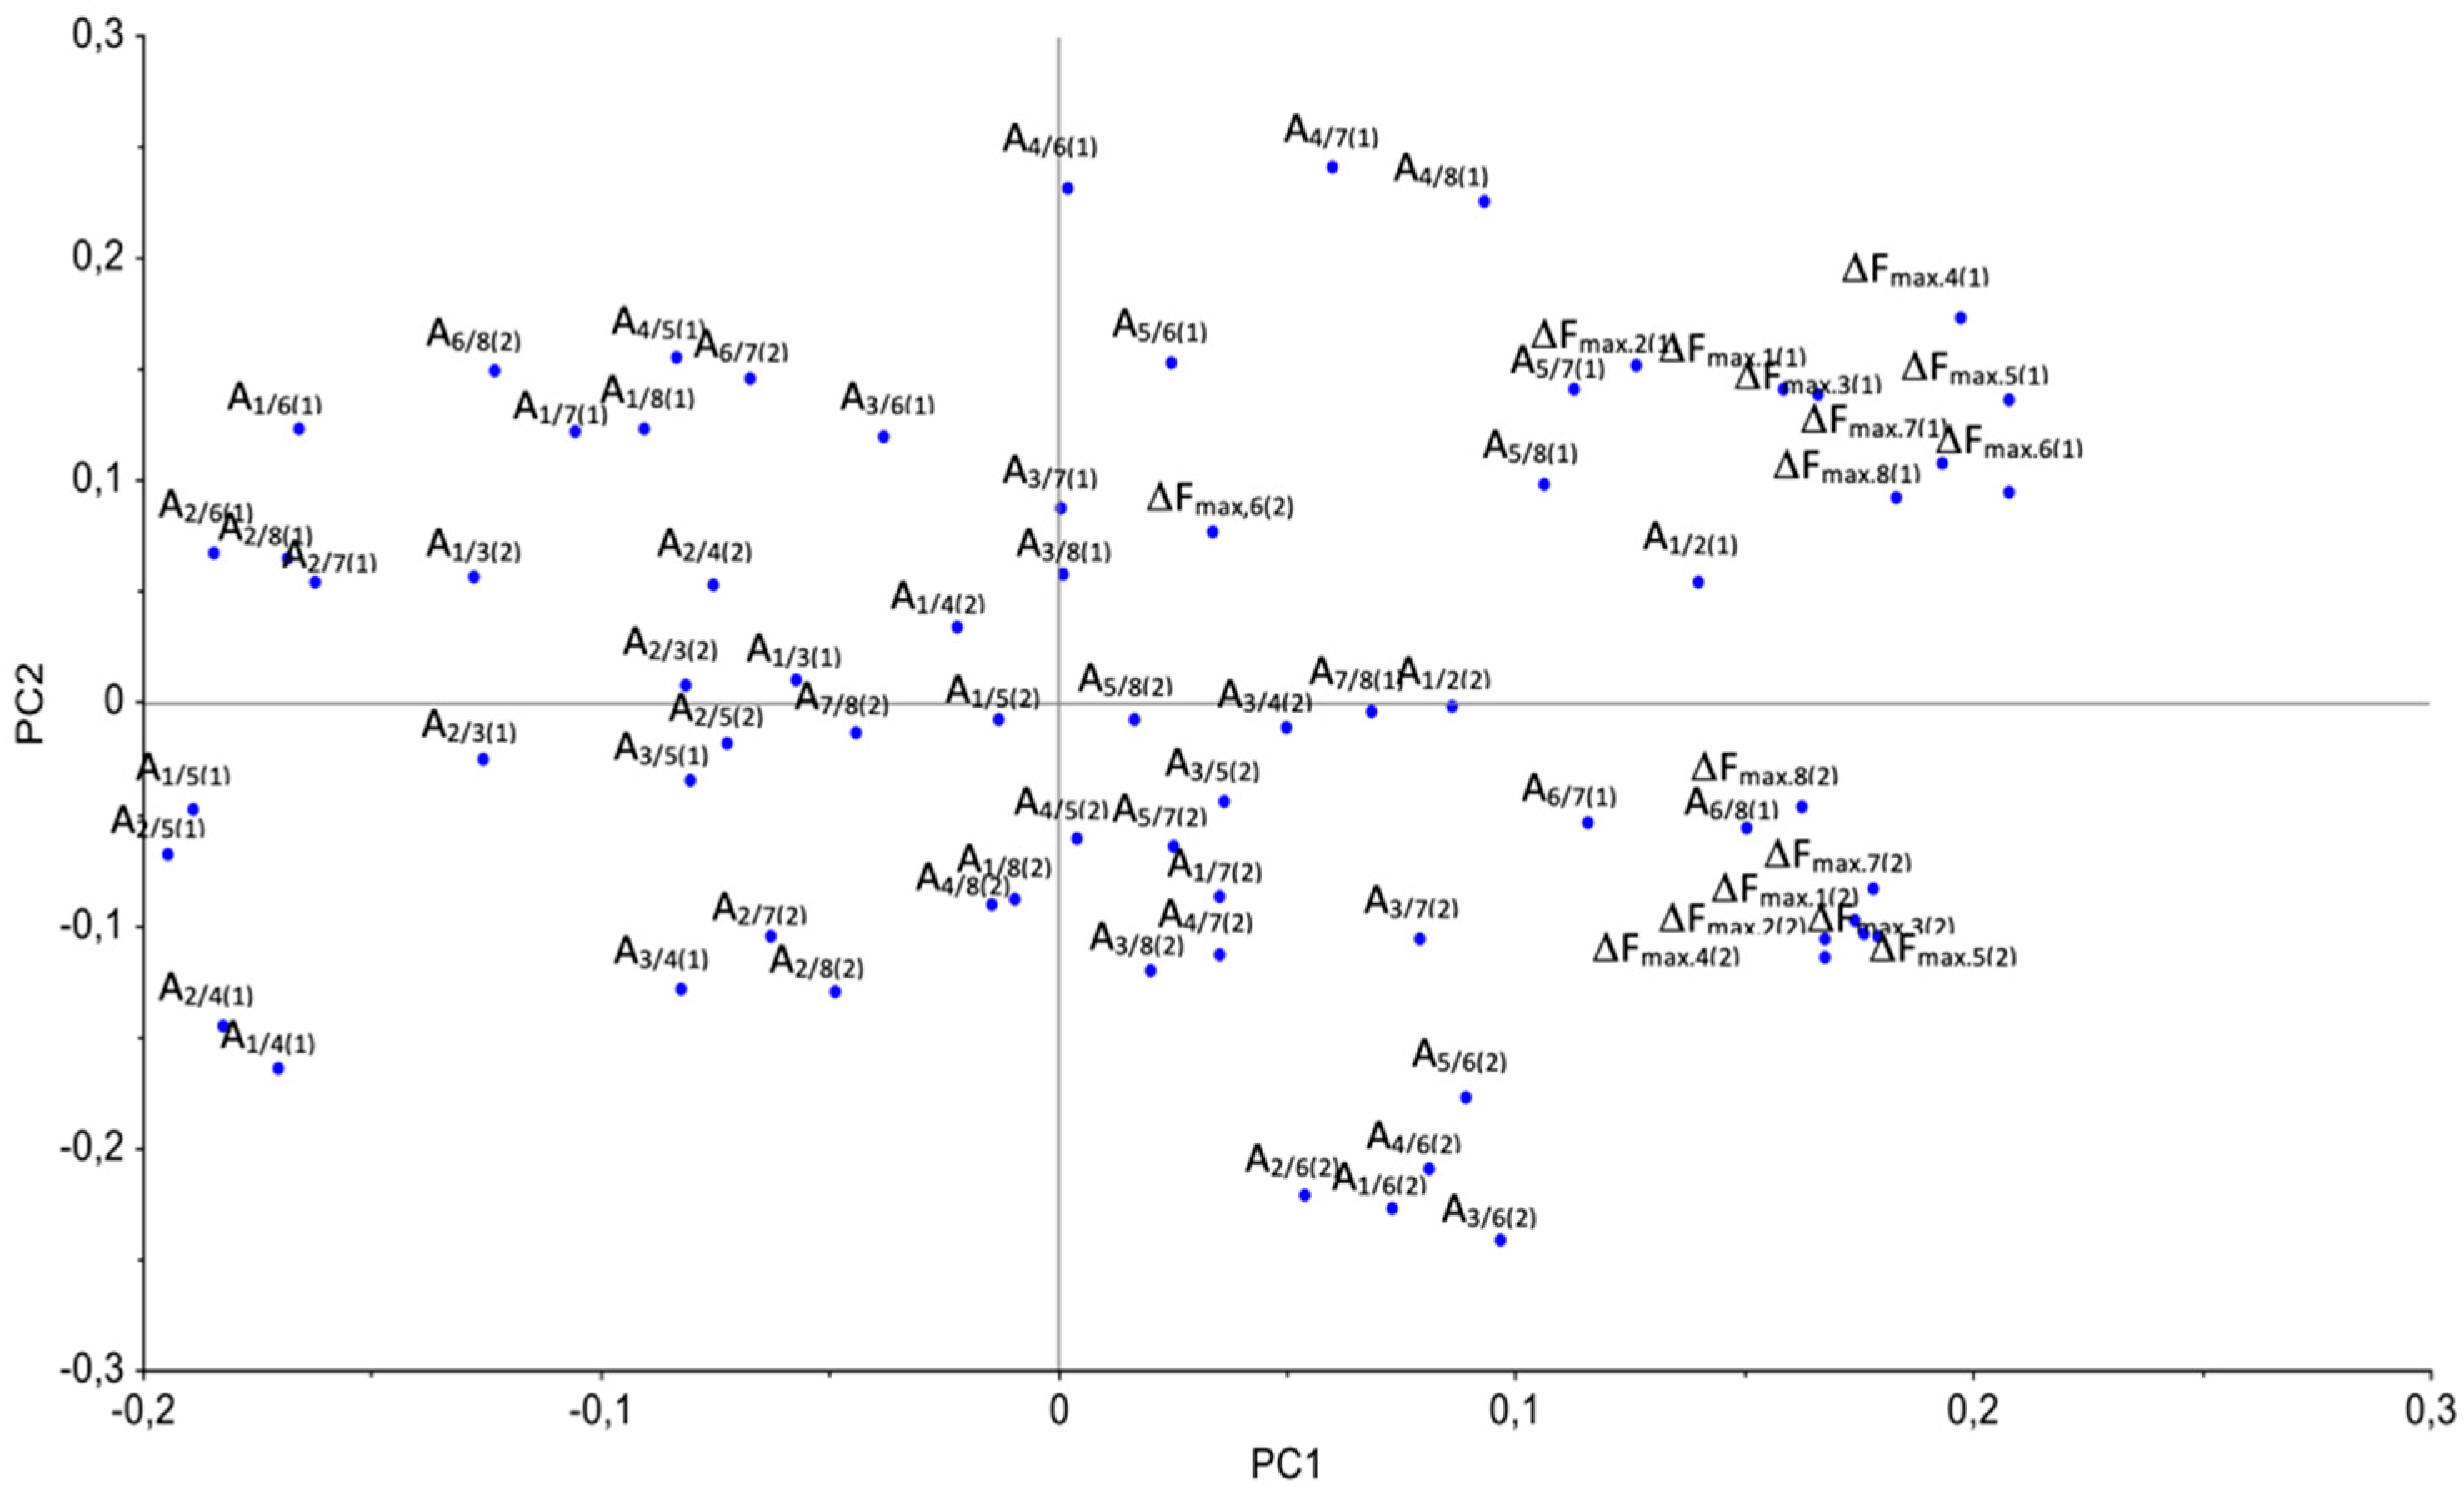
| PC | ΔFmax,1(1) | ΔFmax,2(1) | ΔFmax,3(1) | ΔFmax,4(1) | ΔFmax,5(1) | ΔFmax,6(1) | ΔFmax,7(1) | ΔFmax,8(1) |
|---|---|---|---|---|---|---|---|---|
| 3 | 0.059 | 0.061 | 0.054 | 0.071 | 0.111 | 0.114 | 0.110 | 0.040 |
| 4 | 0.186 | 0.179 | 0.102 | 0.090 | 0.141 | 0.124 | 0.140 | 0.144 |
| 5 | −0.104 | −0.172 | −0.096 | −0.066 | −0.061 | −0.127 | −0.120 | −0.112 |
| 6 | 0.107 | 0.052 | 0.122 | 0.084 | 0.066 | 0.144 | 0.114 | 0.112 |
| 7 | 0.045 | 0.043 | −0.095 | 0.032 | 0.031 | 0.035 | 0.056 | 0.110 |
| PC | ΔFmax,1(2) | ΔFmax,2(2) | ΔFmax,3(2) | ΔFmax,4(2) | ΔFmax,5(2) | ΔFmax,6(2) | ΔFmax,7(2) | ΔFmax,8(2) |
| 3 | −0.169 | −0.145 | −0.186 | −0.148 | −0.112 | −0.215 | −0.163 | −0.206 |
| 4 | 0.048 | 0.045 | 0.049 | −0.015 | −0.015 | 0.102 | 0.025 | 0.012 |
| 5 | −0.073 | −0.078 | −0.057 | −0.074 | −0.141 | −0.151 | −0.135 | −0.076 |
| 6 | −0.140 | −0.169 | −0.119 | −0.144 | −0.197 | −0.151 | −0.186 | −0.168 |
| 7 | 0.006 | −0.004 | −0.004 | 0.008 | −0.016 | 0.008 | 0.026 | 0.094 |
| PC | A1/2(1) | A1/3(1) | A1/4(1) | A1/5(1) | A1/6(1) | A1/7(1) | A1/8(1) | A2/3(1) |
| 3 | −0.009 | 0.057 | −0.051 | −0.123 | −0.077 | −0.125 | −0.027 | 0.036 |
| 4 | 0.036 | 0.115 | 0.211 | 0.087 | 0.124 | 0.116 | 0.257 | 0.060 |
| 5 | 0.139 | 0.031 | −0.137 | −0.139 | 0.106 | 0.090 | 0.087 | −0.069 |
| 6 | 0.201 | −0.062 | 0.099 | 0.168 | −0.081 | −0.010 | −0.091 | −0.148 |
| 7 | 0.014 | 0.286 | 0.044 | −0.012 | 0.061 | −0.043 | −0.108 | 0.241 |
| PC | A2/4(1) | A2/5(1) | A2/6(1) | A2/7(1) | A2/8(1) | A3/4(1) | A3/5(1) | A3/6(1) |
| 3 | −0.019 | −0.075 | −0.072 | −0.115 | 0.002 | −0.066 | −0.141 | −0.145 |
| 4 | 0.156 | 0.080 | 0.071 | 0.058 | 0.119 | 0.052 | −0.068 | −0.037 |
| 5 | −0.186 | −0.179 | −0.001 | −0.032 | −0.038 | −0.146 | −0.146 | 0.023 |
| 6 | −0.034 | −0.007 | −0.195 | −0.156 | −0.192 | 0.128 | 0.165 | −0.011 |
| 7 | 0.050 | 0.036 | 0.026 | 0.001 | −0.067 | −0.288 | −0.290 | −0.296 |
| PC | A3/7(1) | A3/8(1) | A4/5(1) | A4/6(1) | A4/7(1) | A4/8(1) | A5/6(1) | A5/7(1) |
| 3 | −0.147 | −0.106 | −0.114 | −0.067 | −0.063 | −0.027 | 0.039 | 0.029 |
| 4 | −0.039 | 0.002 | −0.146 | −0.133 | −0.129 | −0.091 | 0.047 | 0.038 |
| 5 | 0.007 | 0.007 | −0.021 | 0.182 | 0.152 | 0.112 | 0.260 | 0.193 |
| 6 | 0.061 | 0.034 | 0.070 | −0.117 | −0.068 | −0.069 | −0.239 | −0.159 |
| 7 | −0.288 | −0.278 | −0.040 | 0.042 | −0.070 | −0.084 | 0.043 | −0.057 |
| PC | A5/8(1) | A6/7(1) | A6/8(1) | A7/8(1) | A1/2(2) | A1/3(2) | A1/4(2) | A1/5(2) |
| 3 | 0.118 | −0.005 | 0.076 | 0.090 | −0.195 | 0.173 | −0.041 | −0.194 |
| 4 | 0.168 | −0.044 | 0.006 | 0.096 | 0.041 | 0.010 | 0.285 | 0.191 |
| 5 | 0.177 | −0.028 | 0.005 | 0.017 | −0.008 | −0.054 | 0.006 | 0.218 |
| 6 | −0.185 | 0.117 | 0.049 | −0.013 | 0.085 | −0.025 | −0.039 | 0.152 |
| 7 | −0.090 | −0.085 | −0.124 | −0.050 | 0.025 | −0.008 | −0.049 | 0.052 |
| PC | A1/6(2) | A1/7(2) | A1/8(2) | A2/3(2) | A2/4(2) | A2/5(2) | A2/6(2) | A2/7(2) |
| 3 | 0.057 | −0.072 | 0.106 | 0.176 | 0.097 | −0.080 | 0.126 | 0.090 |
| 4 | 0.068 | 0.117 | 0.125 | 0.061 | 0.235 | 0.211 | 0.046 | 0.138 |
| 5 | 0.127 | 0.193 | 0.072 | 0.040 | −0.015 | 0.237 | 0.150 | 0.141 |
| 6 | −0.074 | 0.154 | −0.092 | 0.117 | −0.108 | 0.141 | −0.042 | 0.098 |
| 7 | 0.006 | −0.089 | −0.195 | 0.068 | −0.072 | 0.065 | −0.016 | −0.003 |
| PC | A2/8(2) | A3/4(2) | A3/5(2) | A3/6(2) | A3/7(2) | A3/8(2) | A4/5(2) | A4/6(2) |
| 3 | 0.178 | −0.170 | −0.243 | 0.007 | −0.158 | 0.006 | −0.156 | 0.075 |
| 4 | 0.147 | 0.280 | 0.139 | 0.066 | 0.081 | 0.110 | −0.051 | −0.050 |
| 5 | 0.103 | 0.012 | 0.192 | 0.131 | 0.155 | 0.083 | 0.186 | 0.138 |
| 6 | 0.013 | 0.015 | 0.168 | −0.101 | 0.141 | −0.110 | 0.182 | −0.037 |
| 7 | 0.009 | −0.113 | 0.055 | −0.027 | −0.057 | −0.156 | 0.124 | 0.005 |
| PC | A4/7(2) | A4/8(2) | A5/6(2) | A5/7(2) | A5/8(2) | A6/7(2) | A6/8(2) | A7/8(2) |
| 3 | −0.014 | 0.135 | 0.158 | 0.194 | 0.171 | −0.046 | 0.067 | 0.152 |
| 4 | −0.163 | 0.009 | −0.045 | −0.068 | 0.041 | −0.009 | 0.064 | 0.143 |
| 5 | 0.114 | 0.096 | 0.010 | −0.084 | −0.047 | −0.058 | −0.041 | −0.091 |
| 6 | 0.115 | −0.040 | −0.076 | 0.042 | −0.122 | 0.078 | −0.027 | −0.035 |
| 7 | 0.001 | −0.172 | −0.110 | −0.152 | −0.310 | 0.045 | −0.178 | −0.031 |
| Sample | Healthy | Sick | Class |
|---|---|---|---|
| 41 | −3.78309 | −4.73564 | Healthy |
| 42 | −2.84562 | −5.31232 | Healthy |
| 43 | −5.18519 | −7.68487 | Healthy |
| 44 | −2.90384 | −4.85101 | Healthy |
| 45 | −2.07818 | −6.70706 | Healthy |
| 46 | −5.69716 | −4.79414 | Sick |
| 47 | −9.11309 | −5.06497 | Sick |
| 48 | −13.2564 | −4.44323 | Sick |
| 49 | −13.2564 | −4.44323 | Sick |
| 50 | −6.79918 | −2.24365 | Sick |
Publisher’s Note: MDPI stays neutral with regard to jurisdictional claims in published maps and institutional affiliations. |
© 2021 by the authors. Licensee MDPI, Basel, Switzerland. This article is an open access article distributed under the terms and conditions of the Creative Commons Attribution (CC BY) license (https://creativecommons.org/licenses/by/4.0/).
Share and Cite
Kuchmenko, T.; Shuba, A.; Umarkhanov, R.; Chernitskiy, A. Portable Electronic Nose for Analyzing the Smell of Nasal Secretions in Calves: Toward Noninvasive Diagnosis of Infectious Bronchopneumonia. Vet. Sci. 2021, 8, 74. https://doi.org/10.3390/vetsci8050074
Kuchmenko T, Shuba A, Umarkhanov R, Chernitskiy A. Portable Electronic Nose for Analyzing the Smell of Nasal Secretions in Calves: Toward Noninvasive Diagnosis of Infectious Bronchopneumonia. Veterinary Sciences. 2021; 8(5):74. https://doi.org/10.3390/vetsci8050074
Chicago/Turabian StyleKuchmenko, Tatiana, Anastasiia Shuba, Ruslan Umarkhanov, and Anton Chernitskiy. 2021. "Portable Electronic Nose for Analyzing the Smell of Nasal Secretions in Calves: Toward Noninvasive Diagnosis of Infectious Bronchopneumonia" Veterinary Sciences 8, no. 5: 74. https://doi.org/10.3390/vetsci8050074
APA StyleKuchmenko, T., Shuba, A., Umarkhanov, R., & Chernitskiy, A. (2021). Portable Electronic Nose for Analyzing the Smell of Nasal Secretions in Calves: Toward Noninvasive Diagnosis of Infectious Bronchopneumonia. Veterinary Sciences, 8(5), 74. https://doi.org/10.3390/vetsci8050074