
Comparative Evaluation of Diagnostic Tests for Brucellosis in Humans and Animals: A Meta-Analytical Approach

 ,
,  ,
,  , ,
, ,  and
and
Simple Summary
Abstract
1. Introduction
2. Materials and Methods
2.1. Review Assessment Protocol
2.2. Literature Search Strategy
2.3. Inclusion and Exclusion Criteria
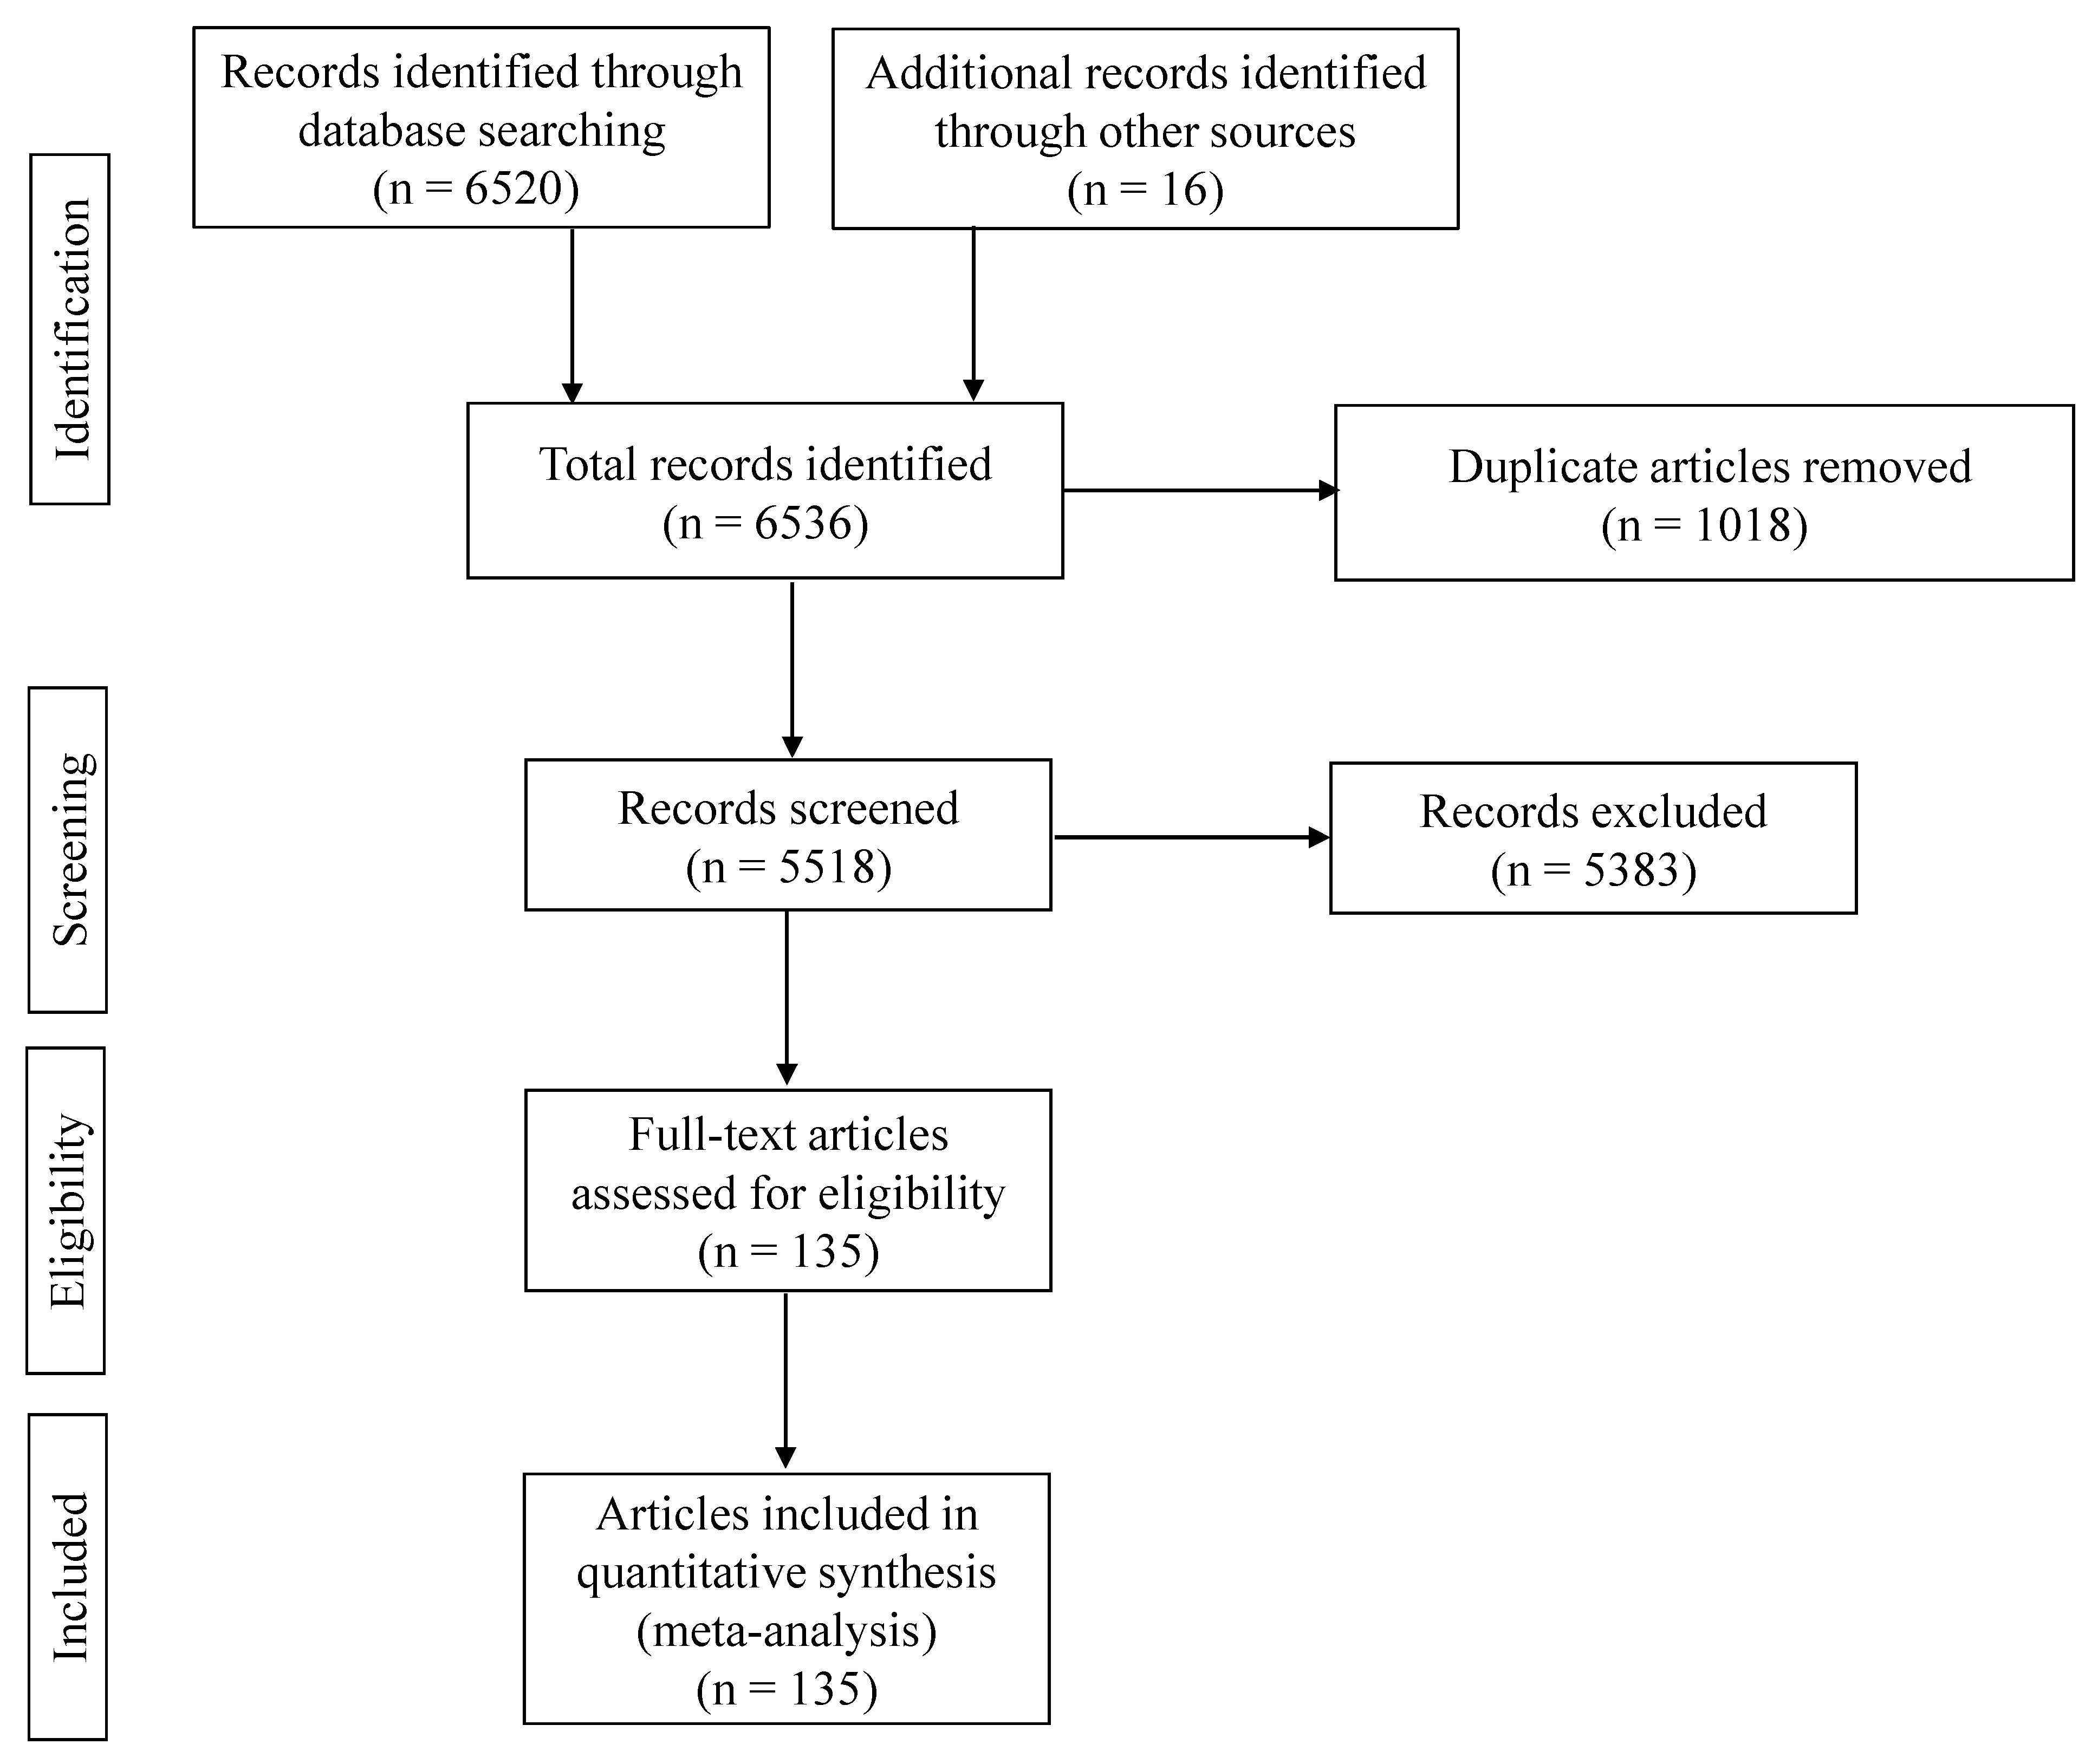
2.4. Research Articles Included
2.5. Data Extraction and Quality Assessment
2.6. Statistical Analysis
2.6.1. Reference Standard
2.6.2. Heterogeneity Assessment
2.6.3. Graphical Summaries
2.6.4. Subgroup Meta-Analysis by Study Quality
2.6.5. Sensitivity Analysis
2.7. Publication Bias
3. Results
3.1. Comparison of Diagnostic Tests for Brucellosis
3.1.1. Human Medicine
- Comparison with RBPT
- Comparison across test groups
3.1.2. Veterinary Medicine
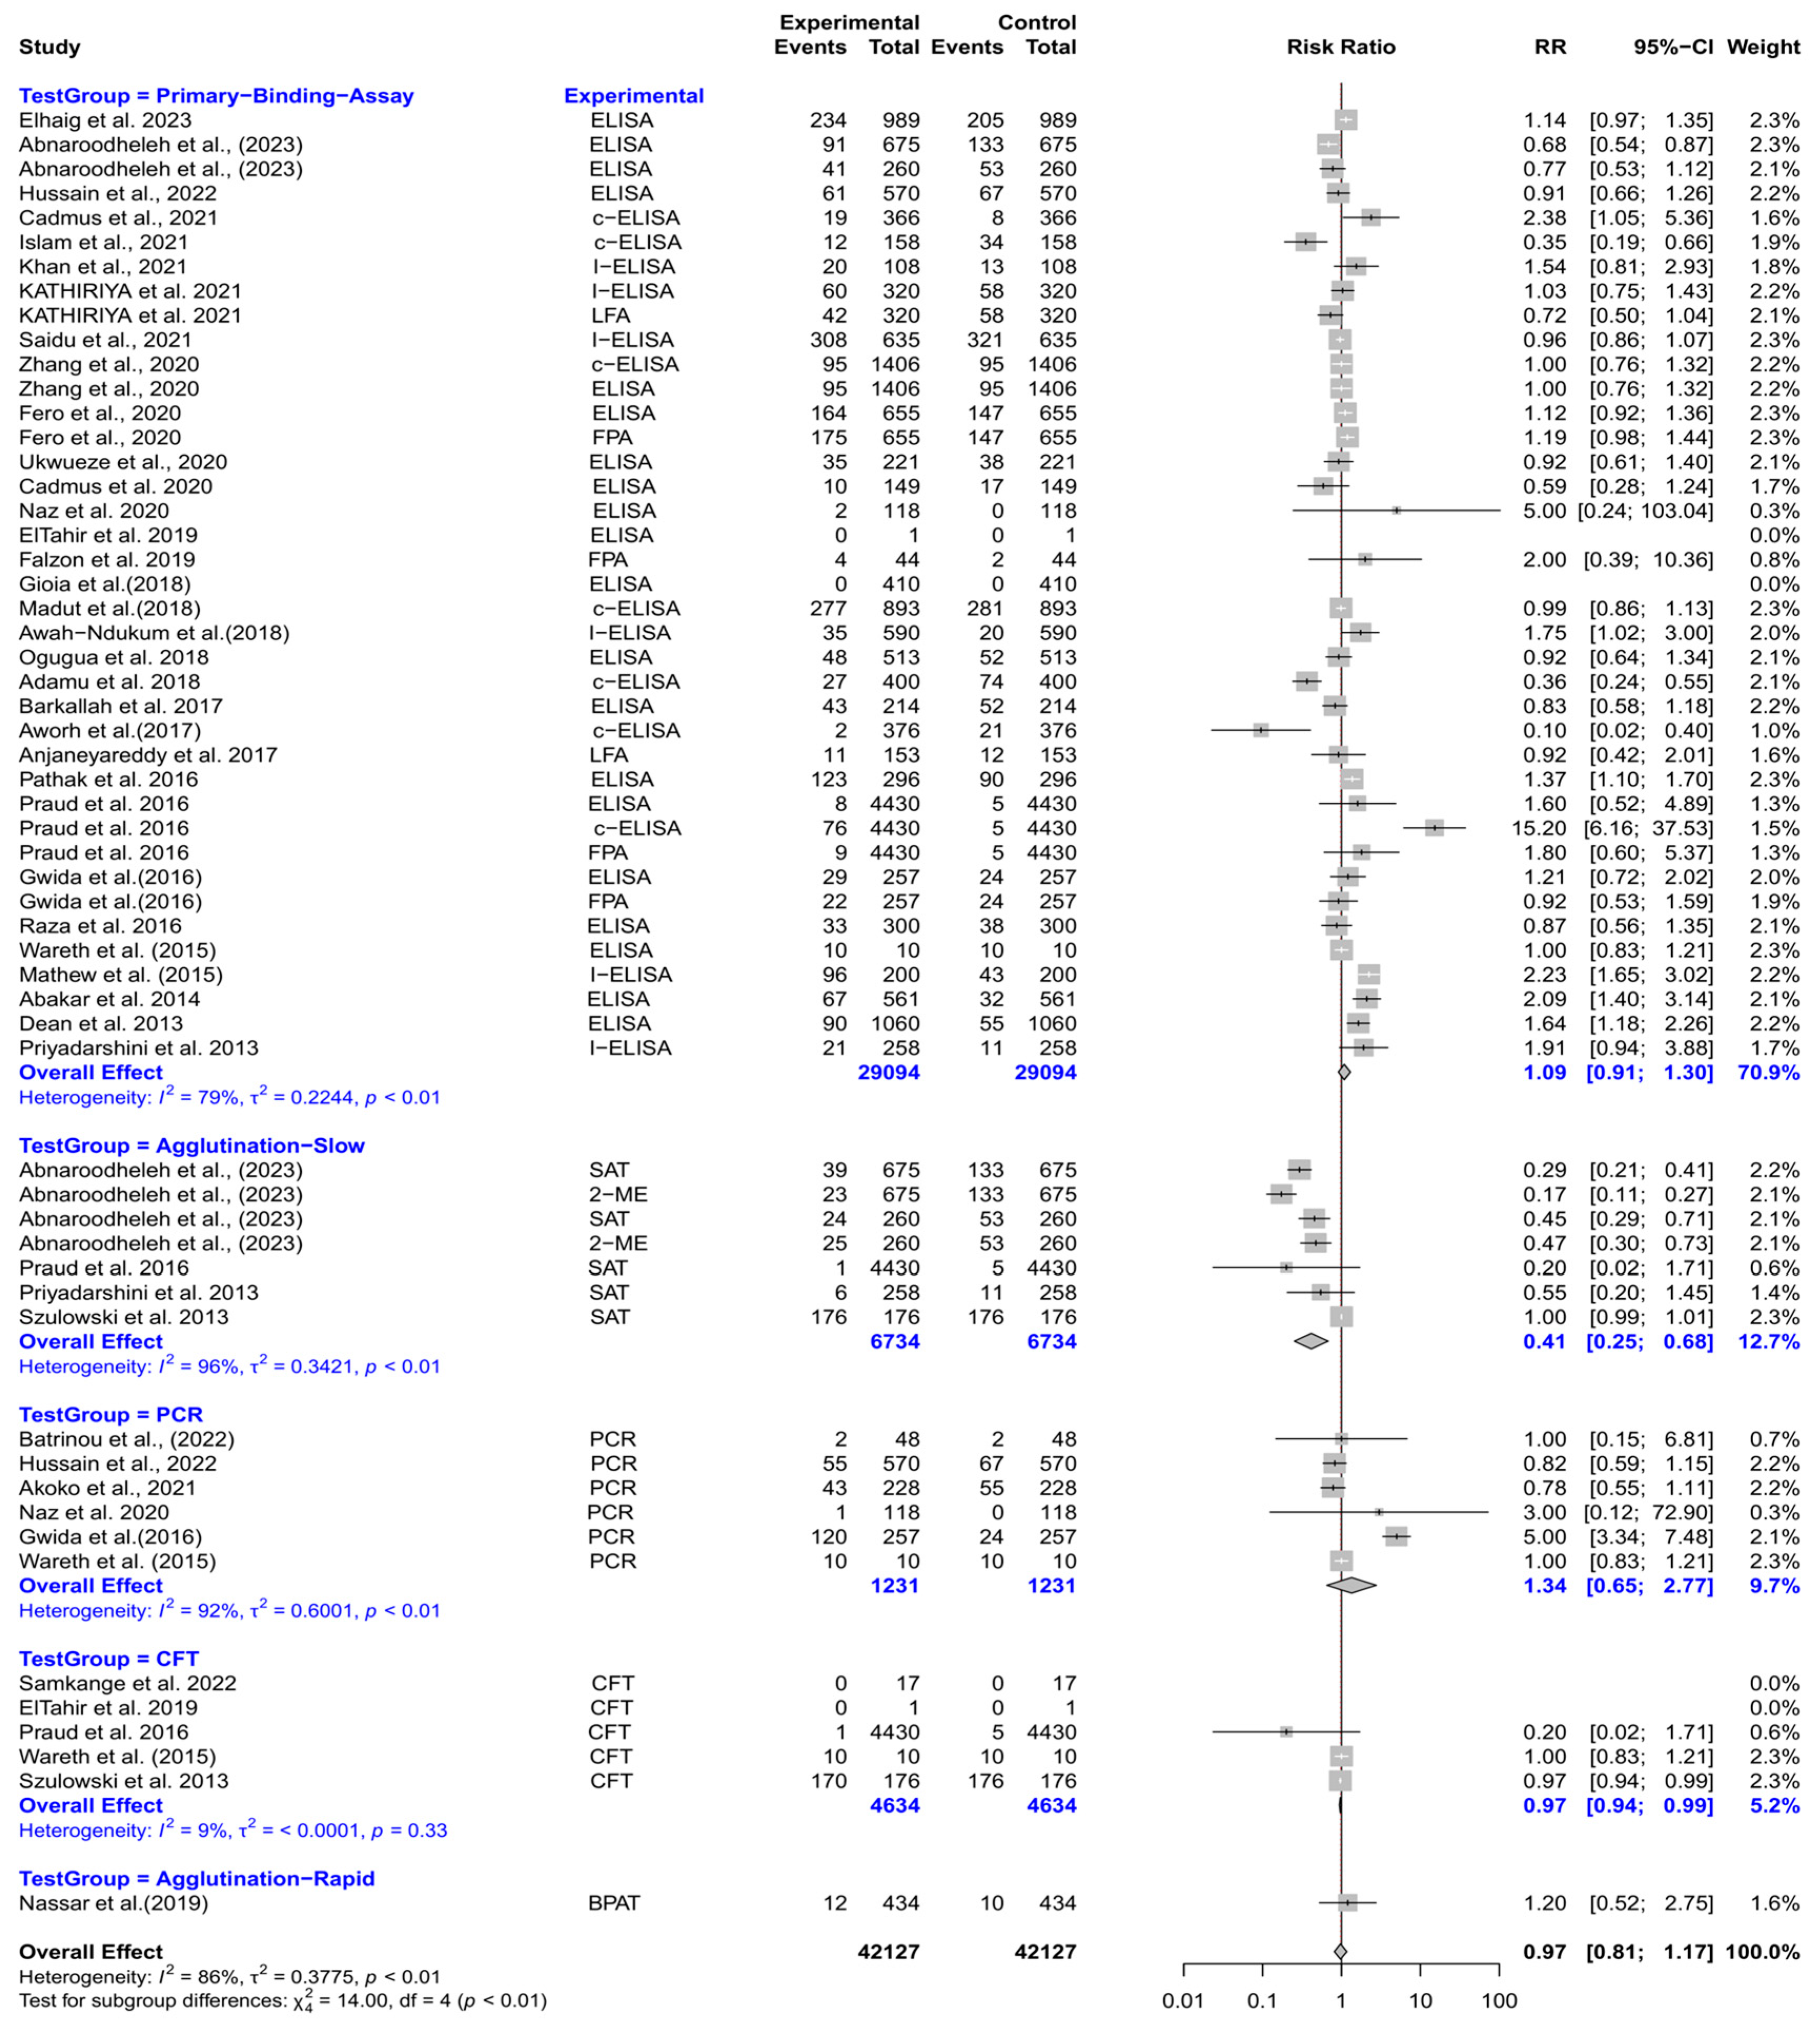
Cattle
- Comparison with RBPT
- Comparison across test groups
Buffaloes
- Comparison with RBPT
- Comparison across test groups
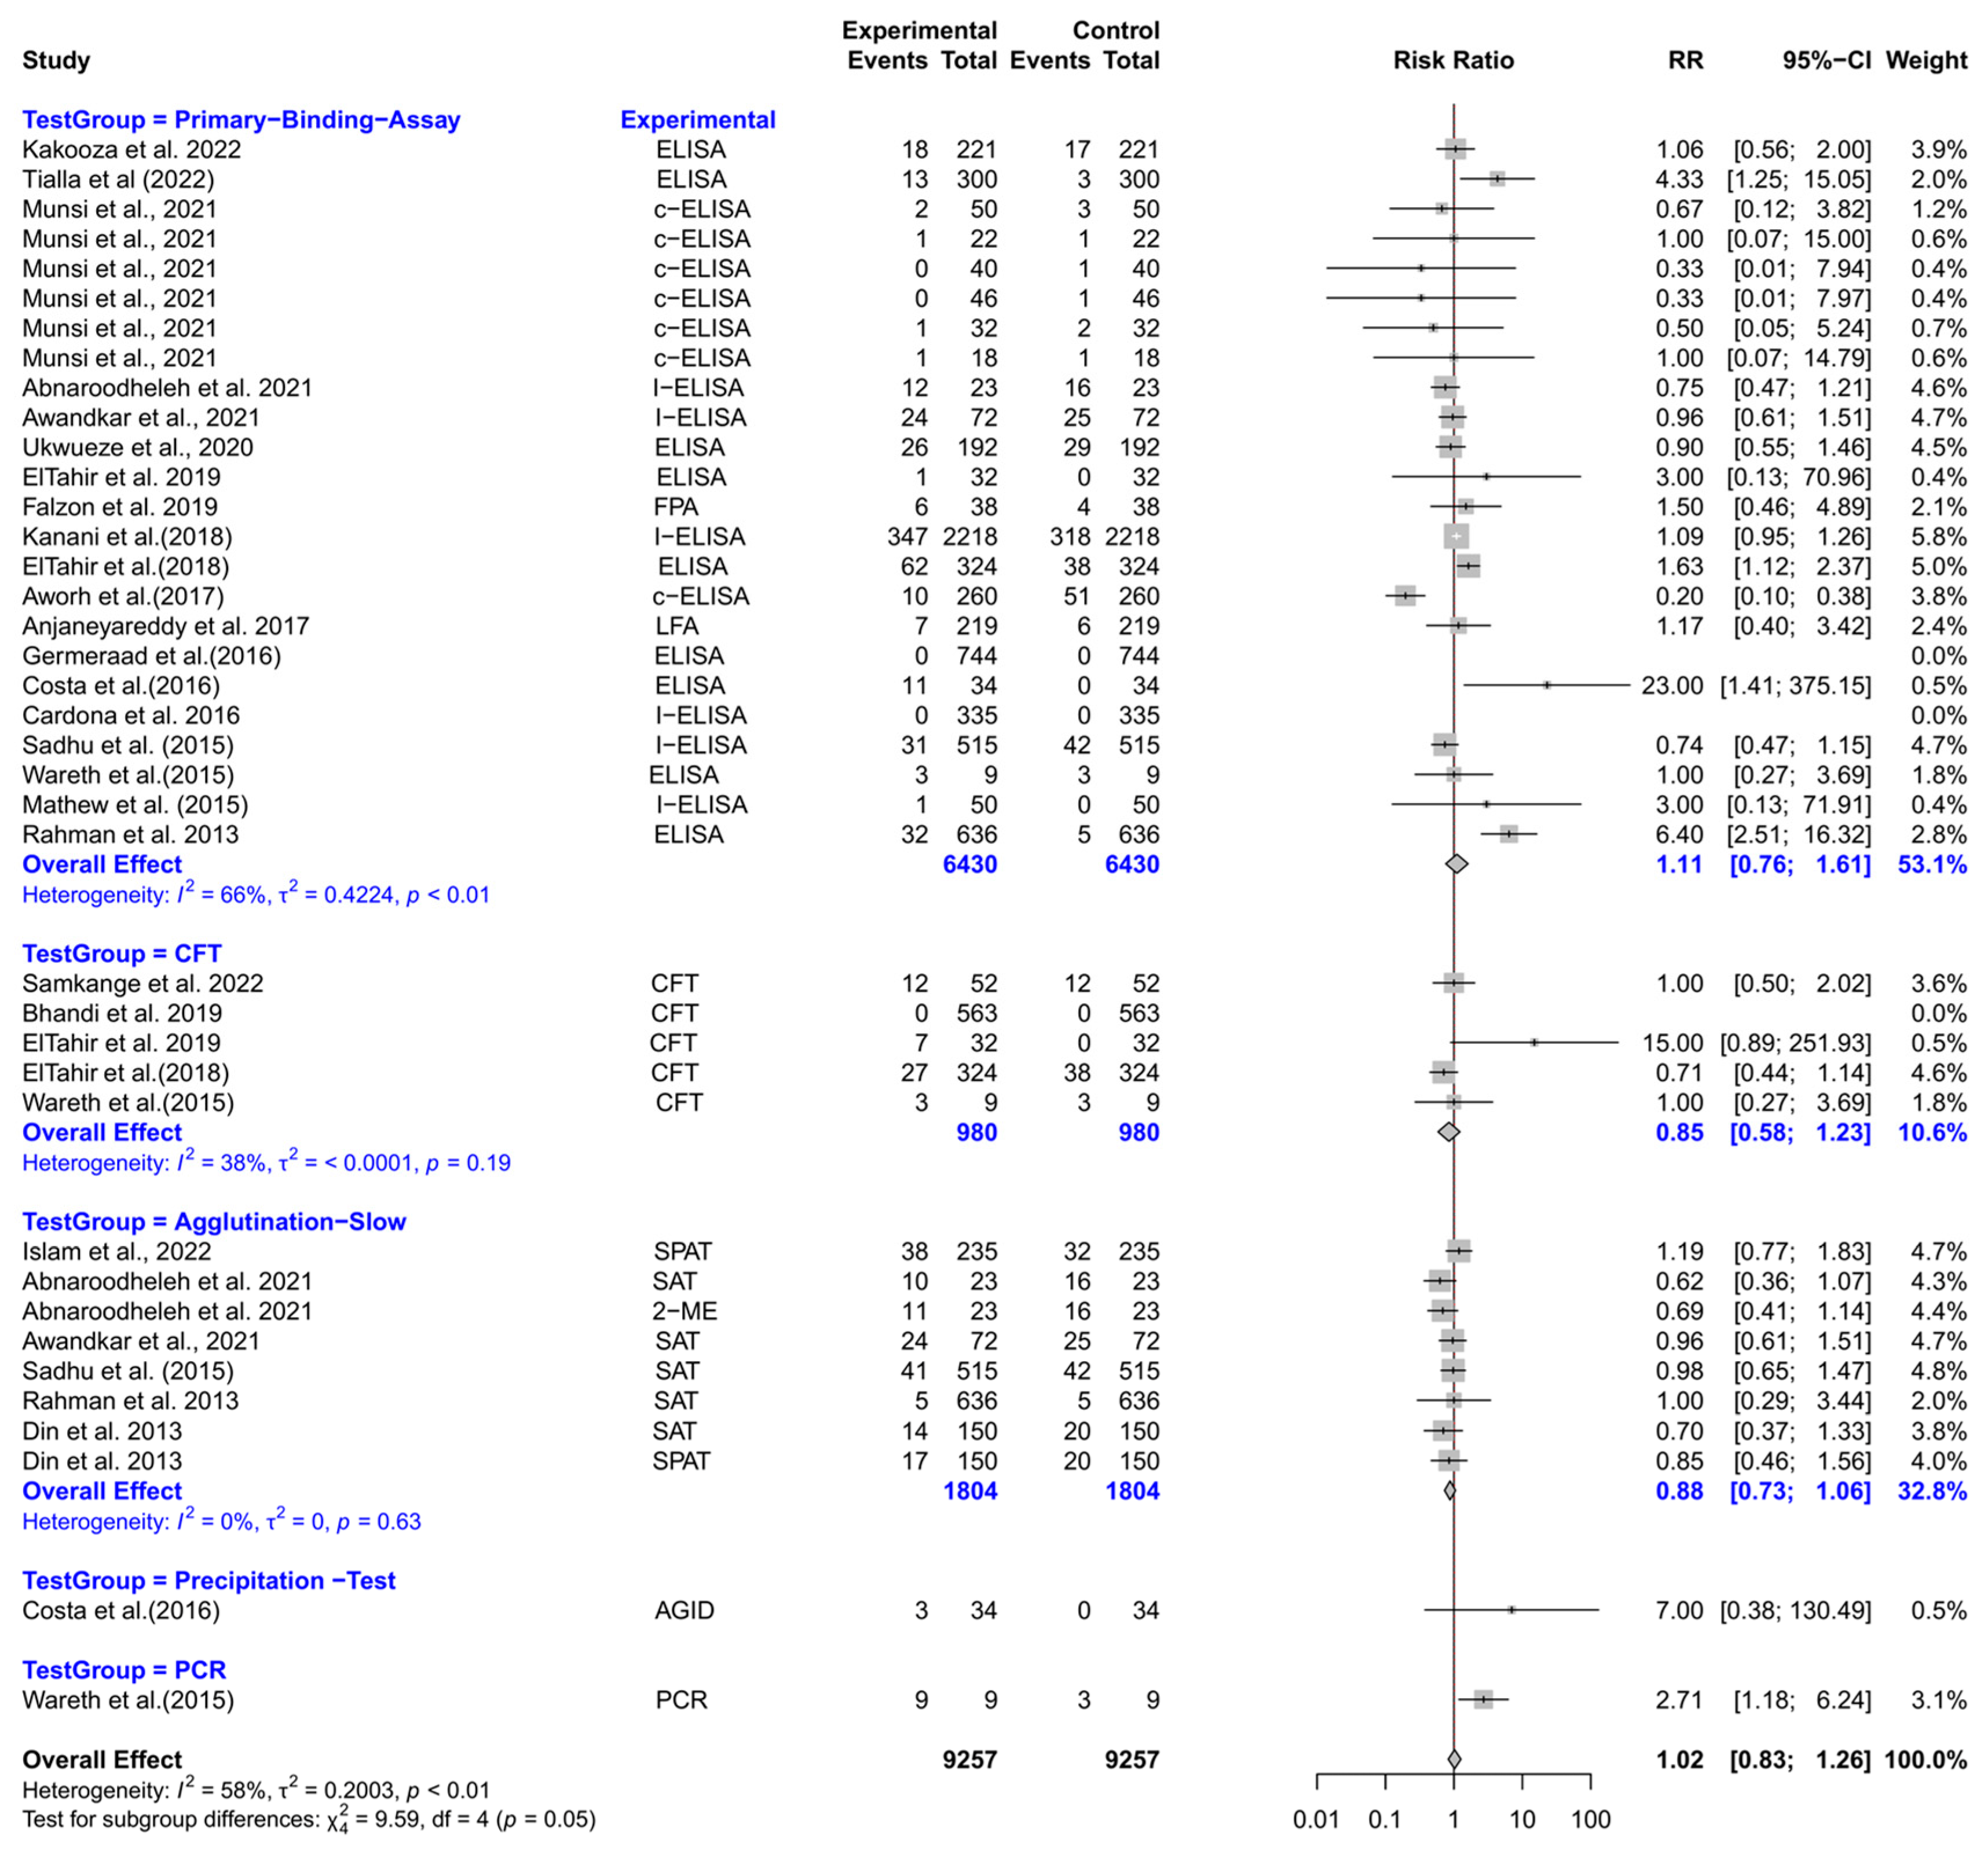
Goats
- Comparison with RBPT
- Comparison across test groups
Sheep
- Comparison with RBPT
- Comparison across test groups
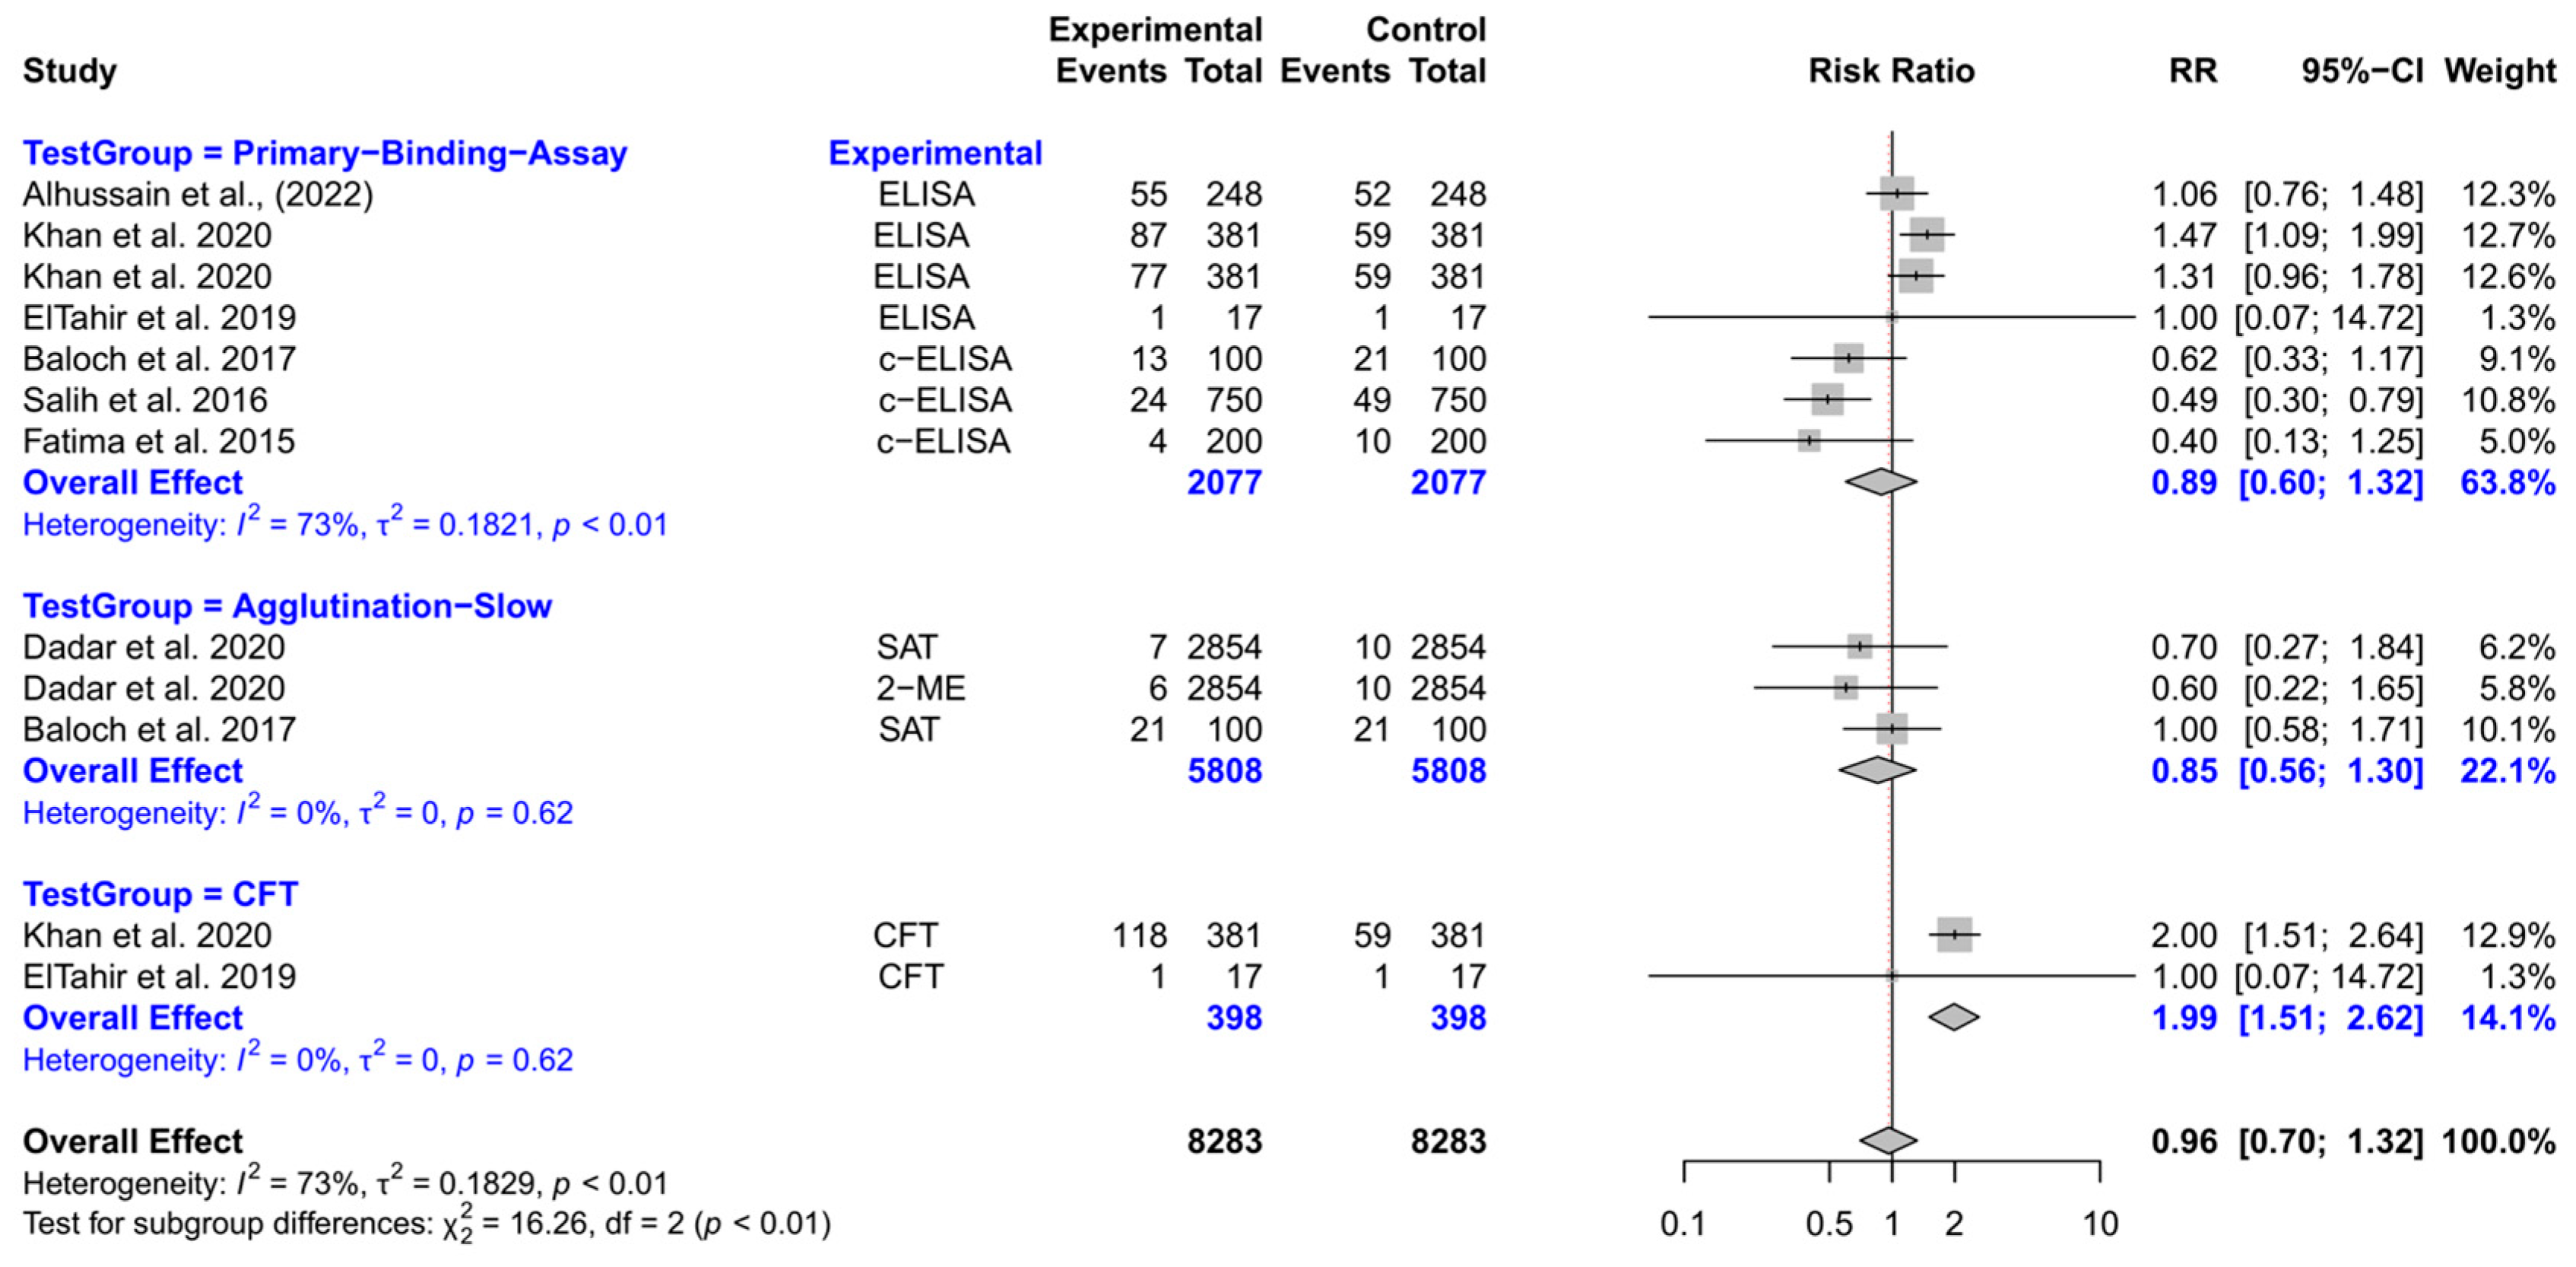
Camels
- Comparison with RBPT
Multi-Species Analysis (Ruminants)
- Comparison with RBPT
- Comparison across test groups
Pigs
- Comparison with RBPT
Dogs
- Comparison with RBPT
- Comparison across test groups
3.2. Study Quality Assessment
3.3. Subgroup Meta-Analysis by Study Quality
3.4. Sensitivity Analysis
4. Discussion
5. Conclusions
6. Limitations
Supplementary Materials
Author Contributions
Funding
Institutional Review Board Statement
Informed Consent Statement
Data Availability Statement
Conflicts of Interest
References
- Fretin, D.; Fauconnier, A.; Köhler, S.; Halling, S.; Léonard, S.; Nijskens, C.; Ferooz, J.; Lestrate, P.; Delrue, R.M.; Danese, I.; et al. The sheathed flagellum of Brucella melitensis is involved in persistence in a murine model of infection. Cell. Microbiol. 2005, 7, 687–698. [Google Scholar] [CrossRef]
- Saavedra, M.J.; Ballem, A.; Queiroga, C.; Fernandes, C. Etiology: The Genus Brucella. In Brucellosis in Goats and Sheep: An Endemic and Re-Emerging Old Zoonosis in the 21st Century; Nova Science Publishers: Hauppauge, NY, USA, 2019; pp. 21–58. [Google Scholar]
- Khan, A.U.; Sayour, A.E.; Melzer, F.; El-Soally, S.; Elschner, M.C.; Shell, W.S.; Moawad, A.A.; Mohamed, S.A.; Hendam, A.; Roesler, U.; et al. Seroprevalence and Molecular Identification of Brucella spp. in Camels in Egypt. Microorganisms 2020, 8, 1035. [Google Scholar] [CrossRef] [PubMed]
- Weese, J.S.; Weese, H.E. Brucellosis in humans caused by Brucella canis: A scoping review. Can. Vet. J. 2025, 66, 327–334. [Google Scholar]
- Carvalho Neta, A.V.; Mol, J.P.; Xavier, M.N.; Paixão, T.A.; Lage, A.P.; Santos, R.L. Pathogenesis of bovine brucellosis. Vet. J. 2010, 184, 146–155. [Google Scholar] [CrossRef]
- Gul, S.; Khan, A. Epidemiology and epizootology of brucellosis: A review. Pak. Vet. J. 2007, 27, 145. [Google Scholar]
- Akinyemi, K.O.; Fakorede, C.O.; Amisu, K.O.; Wareth, G. Human and Animal Brucellosis in Nigeria: A Systemic Review and Meta-Analysis in the Last Twenty-One Years (2001–2021). Vet. Sci. 2022, 9, 384. [Google Scholar] [CrossRef]
- Maxie, G. Jubb, Kennedy & Palmer’s Pathology of Domestic Animals; Elsevier Health Sciences: New York, NY, USA, 2015; Volume 3. [Google Scholar]
- Godfroid, J.; Garin-Bastuji, B.; Saegerman, C.; Blasco, J.M. Brucellosis in terrestrial wildlife. Rev. Sci. Tech. 2013, 32, 27–42. [Google Scholar] [CrossRef]
- Meltzer, E.; Sidi, Y.; Smolen, G.; Banai, M.; Bardenstein, S.; Schwartz, E. Sexually transmitted brucellosis in humans. Clin. Infect. Dis. 2010, 51, e12–e15. [Google Scholar] [CrossRef]
- González-Espinoza, G.; Arce-Gorvel, V.; Mémet, S.; Gorvel, J.P. Brucella: Reservoirs and Niches in Animals and Humans. Pathogens 2021, 10, 186. [Google Scholar] [CrossRef]
- Bai, Y.; Urushadze, L.; Osikowicz, L.; McKee, C.; Kuzmin, I.; Kandaurov, A.; Babuadze, G.; Natradze, I.; Imnadze, P.; Kosoy, M. Molecular Survey of Bacterial Zoonotic Agents in Bats from the Country of Georgia (Caucasus). PLoS ONE 2017, 12, e0171175. [Google Scholar] [CrossRef]
- Ma, R.; Li, C.; Gao, A.; Jiang, N.; Feng, X.; Li, J.; Hu, W. Evidence-practice gap analysis in the role of tick in brucellosis transmission: A scoping review. Infect. Dis. Poverty 2024, 13, 3. [Google Scholar] [CrossRef] [PubMed]
- Urge, B.; Tadele, M.; Siyoum, T. Infestation of ectoparasites in dairy calves reared by smallholder farmers in central areas of Ethiopia. Biomed. J. Sci. Tech. Res. 2020, 10, 20016–20020. [Google Scholar] [CrossRef]
- Enright, F.M. The pathogenesis and pathobiology of Brucella infection in domestic animals. Anim. Brucell. 1990, 301, 320. [Google Scholar]
- Suresh, K.P.; Patil, S.S.; Nayak, A.; Dhanze, H.; Rajamani, S.; Shivamallu, C.; Cull, C.A.; Amachawadi, R.G. Prevalence of brucellosis in livestock of African and Asian continents: A systematic review and meta-analysis. Front. Vet. Sci. 2022, 9, 923657. [Google Scholar] [CrossRef]
- Deka, R.P.; Magnusson, U.; Grace, D.; Lindahl, J. Bovine brucellosis: Prevalence, risk factors, economic cost and control options with particular reference to India- a review. Infect. Ecol. Epidemiol. 2018, 8, 1556548. [Google Scholar] [CrossRef]
- Capparelli, R.; Parlato, M.; Iannaccone, M.; Roperto, S.; Marabelli, R.; Roperto, F.; Iannelli, D. Heterogeneous shedding of Brucella abortus in milk and its effect on the control of animal brucellosis. J. Appl. Microbiol. 2009, 106, 2041–2047. [Google Scholar] [CrossRef]
- Pereira, C.R.; Cotrim de Almeida, J.V.F.; Cardoso de Oliveira, I.R.; Faria de Oliveira, L.; Pereira, L.J.; Zangerônimo, M.G.; Lage, A.P.; Dorneles, E.M.S. Occupational exposure to Brucella spp.: A systematic review and meta-analysis. PLoS Negl. Trop. Dis. 2020, 14, e0008164. [Google Scholar] [CrossRef]
- Kydyshov, K.; Usenbaev, N.; Sharshenbekov, A.; Aitkuluev, N.; Abdyraev, M.; Chegirov, S.; Kazybaeva, J.; Brangsch, H.; Melzer, F.; Neubauer, H.; et al. Brucellosis in Humans and Animals in Kyrgyzstan. Microorganisms 2022, 10, 1293. [Google Scholar] [CrossRef]
- Wareth, G.; Dadar, M.; Ali, H.; Hamdy, M.E.R.; Al-Talhy, A.M.; Elkharsawi, A.R.; Tawab, A.; Neubauer, H. The perspective of antibiotic therapeutic challenges of brucellosis in the Middle East and North African countries: Current situation and therapeutic management. Transbound. Emerg. Dis. 2022, 69, e1253–e1268. [Google Scholar] [CrossRef]
- Mantur, B.; Amarnath, S.; Shinde, R. Review of clinical and laboratory features of human brucellosis. Indian J. Med. Microbiol. 2007, 25, 188. [Google Scholar] [CrossRef]
- Skendros, P.; Pappas, G.; Boura, P. Cell-mediated immunity in human brucellosis. Microbes Infect. 2011, 13, 134–142. [Google Scholar] [CrossRef] [PubMed]
- Bodur, H.; Erbay, A.; Akinci, E.; Colpan, A.; Cevik, M.A.; Balaban, N. Neurobrucellosis in an endemic area of brucellosis. Scand. J. Infect. Dis. 2003, 35, 94–97. [Google Scholar] [CrossRef]
- Sohn, A.H.; Probert, W.S.; Glaser, C.A.; Gupta, N.; Bollen, A.W.; Wong, J.D.; Grace, E.M.; McDonald, W.C. Human neurobrucellosis with intracerebral granuloma caused by a marine mammal Brucella spp. Emerg. Infect. Dis. 2003, 9, 485–488. [Google Scholar] [CrossRef]
- McDonald, W.L.; Jamaludin, R.; Mackereth, G.; Hansen, M.; Humphrey, S.; Short, P.; Taylor, T.; Swingler, J.; Dawson, C.E.; Whatmore, A.M.; et al. Characterization of a Brucella sp. strain as a marine-mammal type despite isolation from a patient with spinal osteomyelitis in New Zealand. J. Clin. Microbiol. 2006, 44, 4363–4370. [Google Scholar] [CrossRef]
- Di Bonaventura, G.; Angeletti, S.; Ianni, A.; Petitti, T.; Gherardi, G. Microbiological Laboratory Diagnosis of Human Brucellosis: An Overview. Pathogens 2021, 10, 1623. [Google Scholar] [CrossRef] [PubMed]
- Khan, A.U.; Melzer, F.; Hendam, A.; Sayour, A.E.; Khan, I.; Elschner, M.C.; Younus, M.; Ehtisham-Ul-Haque, S.; Waheed, U.; Farooq, M.; et al. Seroprevalence and Molecular Identification of Brucella spp. in Bovines in Pakistan-Investigating Association With Risk Factors Using Machine Learning. Front. Vet. Sci. 2020, 7, 594498. [Google Scholar] [CrossRef]
- Becker, G.N.; Tuon, F.F. Comparative study of IS711 and bcsp31-based polymerase chain reaction (PCR) for the diagnosis of human brucellosis in whole blood and serum samples. J. Microbiol. Methods 2021, 183, 106182. [Google Scholar] [CrossRef]
- Smirnova, E.; Vasin, A.; Sandybaev, N.; Klotchenko, S.; Plotnikova, M.; Chervyakova, O.; Sansyzbay, A.; Kiselev, O. Current methods of human and animal brucellosis diagnostics. Adv. Infect. Dis. 2013, 3, 177. [Google Scholar] [CrossRef]
- Yagupsky, P.; Morata, P.; Colmenero, J.D. Laboratory Diagnosis of Human Brucellosis. Clin. Microbiol. Rev. 2019, 33, 10–1128. [Google Scholar] [CrossRef]
- Araj, G.F. Update on laboratory diagnosis of human brucellosis. Int. J. Antimicrob. Agents 2010, 36 (Suppl. 1), S12–S17. [Google Scholar] [CrossRef]
- Godfroid, J.; Nielsen, K.; Saegerman, C. Diagnosis of brucellosis in livestock and wildlife. Croat. Med. J. 2010, 51, 296–305. [Google Scholar] [CrossRef] [PubMed]
- Gómez, M.; Nieto, J.; Rosa, C.; Geijo, P.; Escribano, M.; Munoz, A.; López, C. Evaluation of seven tests for diagnosis of human brucellosis in an area where the disease is endemic. Clin. Vaccine Immunol. 2008, 15, 1031–1033. [Google Scholar] [CrossRef]
- Andrade, R.S.; Oliveira, M.M.; Bueno Filho, J.S.S.; Ferreira, F.; Godfroid, J.; Lage, A.P.; Dorneles, E.M.S. Accuracy of serological tests for bovine brucellosis: A systematic review and meta-analysis. Prev. Vet. Med. 2024, 222, 106079. [Google Scholar] [CrossRef] [PubMed]
- O’Grady, D.; Byrne, W.; Kelleher, P.; O’Callaghan, H.; Kenny, K.; Heneghan, T.; Power, S.; Egan, J.; Ryan, F. A comparative assessment of culture and serology in the diagnosis of brucellosis in dairy cattle. Vet. J. 2014, 199, 370–375. [Google Scholar] [CrossRef]
- Freire, M.L.; Machado de Assis, T.S.; Silva, S.N.; Cota, G. Diagnosis of human brucellosis: Systematic review and meta-analysis. PLoS Negl. Trop. Dis. 2024, 18, e0012030. [Google Scholar] [CrossRef]
- Khaliq, M.S.; Mushtaq, M.H.; Rehman, A. A systematic review and meta-analysis study to evaluate the accuracy of various PCR methods for diagnosing brucellosis in animals and humans. Heliyon 2025, 11, e42728. [Google Scholar] [CrossRef]
- Bossuyt, P.M.; Deeks, J.J.; Leeflang, M.M.; Takwoingi, Y.; Flemyng, E. Evaluating medical tests: Introducing the Cochrane Handbook for Systematic Reviews of Diagnostic Test Accuracy. Cochrane Database Syst. Rev. 2023, 7, Ed000163. [Google Scholar] [CrossRef]
- Moher, D.; Liberati, A.; Tetzlaff, J.; Altman, D.G. Preferred reporting items for systematic reviews and meta-analyses: The PRISMA Statement. Open Med. 2009, 3, e123–e130. [Google Scholar]
- Moola, S.; Munn, Z.; Tufanaru, C.; Aromataris, E.; Sears, K.; Sfetcu, R.; Currie, M.; Qureshi, R.; Mattis, P.; Lisy, K.; et al. Chapter 7: Systematic reviews of etiology and risk. In JBI Manual for Evidence Synthesis; Aromataris, E., Munn, Z., Eds.; JBI: Adelaide, Australia, 2020. [Google Scholar]
- Poester, F.P.; Nielsen, K.; Samartino, L.E.; Yu, W.L. Diagnosis of brucellosis. Open Vet. Sci. J. 2010, 4, 46–60. [Google Scholar] [CrossRef]
- Waringa, N.M.A.; Waiboci, L.W.; Bebora, L.; Kinyanjui, P.W.; Kosgei, P.; Kiambi, S.; Osoro, E. Human brucellosis in Baringo County, Kenya: Evaluating the diagnostic kits used and identifying infecting Brucella species. PLoS ONE 2023, 18, e0269831. [Google Scholar] [CrossRef]
- Alumasa, L.; Thomas, L.F.; Amanya, F.; Njoroge, S.M.; Moriyón, I.; Makhandia, J.; Rushton, J.; Fèvre, E.M.; Falzon, L.C. Hospital-based evidence on cost-effectiveness of brucellosis diagnostic tests and treatment in Kenyan hospitals. PLoS Negl. Trop. Dis. 2021, 15, e0008977. [Google Scholar] [CrossRef] [PubMed]
- Almashhadany, D.A.; Fetehallah Zefenkey, Z.; Naji Ahmed Odhah, M. Epidemiological study of human brucellosis among febrile patients in Erbil-Kurdistan region, Iraq. J. Infect. Dev. Ctries. 2022, 16, 1185–1190. [Google Scholar] [CrossRef] [PubMed]
- Yang, H.; Zhang, G.; Luo, P.; He, Z.; Hu, F.; Li, L.; Allain, J.P.; Li, C.; Wang, W. Detection of Brucellae in peripheral blood mononuclear cells for monitoring therapeutic efficacy of brucellosis infection. Antimicrob. Resist. Infect. Control 2019, 8, 154. [Google Scholar] [CrossRef]
- Getahun, T.K.; Urge, B.; Mamo, G. Seroprevalence of human brucellosis in selected sites of Central Oromia, Ethiopia. PLoS ONE 2022, 17, e0269929. [Google Scholar] [CrossRef]
- Obaidat, M.M.; Malania, L.; Arner, R.J.; Roess, A.A. Seroprevalence and risk factors for Brucella infections in Jordan. Am. J. Trop. Med. Hyg. 2022, 107, 576. [Google Scholar] [CrossRef]
- Islam, B.; Rahman, H.U.; Islam, Z.U.; Rehman, S.U.; Rashid, A. Seroepidemiological analysis of brucellosis in goat and household animal keepers of District Swat. Egypt. J. Vet. Sci. 2022, 53, 49–55. [Google Scholar] [CrossRef]
- Govindasamy, K.; Thompson, P.N.; Harris, B.N.; Rossouw, J.; Abernethy, D.A.; Etter, E.M.C. Bovine Brucellosis in Gauteng, South Africa: Seroprevalence amongst Cattle Handlers and Variables Associated with Seropositive Cattle Herds, 2014–2016. Pathogens 2021, 10, 1547. [Google Scholar] [CrossRef]
- Chaudhari, S.P.; Kalorey, D.R.; Awandkar, S.P.; Kurkure, N.V.; Narang, R.; Kashyap, R.S.; Rahi, M.; Barbuddhe, S.B. Journey towards National Institute of One Health in India. Indian J. Med. Res. 2021, 153, 320–326. [Google Scholar] [CrossRef]
- Proch, V.; Singh, B.B.; Schemann, K.; Gill, J.P.S.; Ward, M.P.; Dhand, N.K. Risk factors for occupational Brucella infection in veterinary personnel in India. Transbound. Emerg. Dis. 2018, 65, 791–798. [Google Scholar] [CrossRef]
- Sharma, H.K.; Kotwal, S.K.; Singh, D.K.; Malik, M.A.; Kumar, A.; Rajagunalan; Singh, M. Seroprevalence of human brucellosis in and around Jammu, India, using different serological tests. Vet. World 2016, 9, 742–746. [Google Scholar] [CrossRef]
- Germeraad, E.A.; Hogerwerf, L.; Faye-Joof, T.; Goossens, B.; van der Hoek, W.; Jeng, M.; Lamin, M.; Manneh, I.L.; Nwakanma, D.; Roest, H.I.; et al. Low Seroprevalence of Brucellosis in Humans and Small Ruminants in the Gambia. PLoS ONE 2016, 11, e0166035. [Google Scholar] [CrossRef]
- Mangalgi, S.S.; Sajjan, A.G.; Mohite, S.T.; Gajul, S. Brucellosis in Occupationally Exposed Groups. J. Clin. Diagn. Res. 2016, 10, Dc24–Dc27. [Google Scholar] [CrossRef] [PubMed]
- Mangalgi, S.S.; Sajjan, A.G.; Mohite, S.T.; Kakade, S.V. Serological, Clinical, and Epidemiological Profile of Human Brucellosis in Rural India. Indian J. Community Med. 2015, 40, 163–167. [Google Scholar] [CrossRef]
- Yüksekkaya, S.; Aras, Z.; Uçan, U.S. Investigation of Brucella canis Seroprevalence in Brucellosis Suspected Cases. Mikrobiyol. Bul. 2013, 47, 152–157. [Google Scholar] [CrossRef] [PubMed]
- Priyadarshini, A.; Sarangi, L.; Palai, T.; Panda, H.; Mishra, R.; Behera, P. Brucellosis in cattle and occupationally exposed human beings: A serosurvey in Odisha, India. J. Pure Appl. Microbiol. 2013, 7, 3255–3260. [Google Scholar]
- Din, A.; Khan, S.; Ahmad, I.; Rind, R.; Hussain, T.; Shahid, M.; Ahmed, S. A study on the seroprevalence of brucellosis in human and goat populations of district Bhimber, Azad Jammu and Kashmir. J. Anim. Plant Sci. 2013, 23, 113–118. [Google Scholar]
- Yousaf, R.; Khan, I.; Shehzad, W.; Hussain, R.; Ali, S.; Neubauer, H.; Wareth, G. Seroprevalence and Molecular Detection of Brucellosis in Hospitalized Patients in Lahore Hospitals, Pakistan. Infect. Dis. Rep. 2021, 13, 166–172. [Google Scholar] [CrossRef]
- Mahmood, R.; Ali, T.; Waheed, U.; Asif, M.; Khan, Q.M. Application of serum based PCR and fluorescence polarization assay for diagnosis of brucellosis among people occupationally at risk to disease. Int. J. Agric. Biol. 2016, 18, 377–384. [Google Scholar] [CrossRef]
- Cadmus, S.; Salam, S.P.; Adesokan, H.K.; Akporube, K.; Ola-Daniel, F.; Awosanya, E.J. Seroprevalence of brucellosis and Q fever infections amongst pastoralists and their cattle herds in Sokoto State, Nigeria. PLoS ONE 2021, 16, e0254530. [Google Scholar] [CrossRef]
- Ghugey, S.L.; Setia, M.S.; Deshmukh, J.S. Human brucellosis: Seroprevalence and associated exposure factors among the rural population in Nagpur, Maharashtra, India. J. Family Med. Prim. Care 2021, 10, 1028–1033. [Google Scholar] [CrossRef]
- Yusuf, A.A.; Hassan-Kadle, A.A.; Ibrahim, A.M.; Hassan-Kadle, M.A.; Yasin, A.M.; Khojaly, M.; Garcia, J.L.; Vieira, R.F.C. Prevalence of Anti-Toxoplasma gondii and Anti-Brucella Spp. Antibodies in Pregnant Women From Mogadishu, Somalia. Front. Reprod. Health 2021, 3, 672885. [Google Scholar] [CrossRef] [PubMed]
- Lukambagire, A.S.; Mendes, Â.J.; Bodenham, R.F.; McGiven, J.A.; Mkenda, N.A.; Mathew, C.; Rubach, M.P.; Sakasaka, P.; Shayo, D.D.; Maro, V.P.; et al. Performance characteristics and costs of serological tests for brucellosis in a pastoralist community of northern Tanzania. Sci. Rep. 2021, 11, 5480. [Google Scholar] [CrossRef] [PubMed]
- Holt, H.R.; Bedi, J.S.; Kaur, P.; Mangtani, P.; Sharma, N.S.; Gill, J.P.S.; Singh, Y.; Kumar, R.; Kaur, M.; McGiven, J.; et al. Epidemiology of brucellosis in cattle and dairy farmers of rural Ludhiana, Punjab. PLoS Negl. Trop. Dis. 2021, 15, e0009102. [Google Scholar] [CrossRef]
- Munyua, P.; Osoro, E.; Hunsperger, E.; Ngere, I.; Muturi, M.; Mwatondo, A.; Marwanga, D.; Ngere, P.; Tiller, R.; Onyango, C.O.; et al. High incidence of human brucellosis in a rural Pastoralist community in Kenya, 2015. PLoS Negl. Trop. Dis. 2021, 15, e0009049. [Google Scholar] [CrossRef]
- Mangtani, P.; Berry, I.; Beauvais, W.; Holt, H.R.; Kulashri, A.; Bharti, S.; Sagar, V.; Nguipdop-Djomo, P.; Bedi, J.; Kaur, M.; et al. The prevalence and risk factors for human Brucella species infection in a cross-sectional survey of a rural population in Punjab, India. Trans. R. Soc. Trop. Med. Hyg. 2020, 114, 255–263. [Google Scholar] [CrossRef] [PubMed]
- Madut, N.A.; Muwonge, A.; Nasinyama, G.W.; Muma, J.B.; Godfroid, J.; Jubara, A.S.; Muleme, J.; Kankya, C. The sero-prevalence of brucellosis in cattle and their herders in Bahr el Ghazal region, South Sudan. PLoS Negl. Trop. Dis. 2018, 12, e0006456. [Google Scholar] [CrossRef]
- Awah-Ndukum, J.; Mouiche, M.M.M.; Kouonmo-Ngnoyum, L.; Bayang, H.N.; Manchang, T.K.; Poueme, R.S.N.; Kouamo, J.; Ngu-Ngwa, V.; Assana, E.; Feussom, K.J.M.; et al. Seroprevalence and risk factors of brucellosis among slaughtered indigenous cattle, abattoir personnel and pregnant women in Ngaoundéré, Cameroon. BMC Infect. Dis. 2018, 18, 611. [Google Scholar] [CrossRef]
- Shirima, G.M.; Kunda, J.S. Prevalence of brucellosis in the human, livestock and wildlife interface areas of Serengeti National Park, Tanzania. Onderstepoort J. Vet. Res. 2016, 83, a1032. [Google Scholar] [CrossRef]
- Dean, A.S.; Bonfoh, B.; Kulo, A.E.; Boukaya, G.A.; Amidou, M.; Hattendorf, J.; Pilo, P.; Schelling, E. Epidemiology of brucellosis and q Fever in linked human and animal populations in northern togo. PLoS ONE 2013, 8, e71501. [Google Scholar] [CrossRef]
- Aworh, M.K.; Okolocha, E.; Kwaga, J.; Fasina, F.; Lazarus, D.; Suleman, I.; Poggensee, G.; Nguku, P.; Nsubuga, P. Human brucellosis: Seroprevalence and associated exposure factors among abattoir workers in Abuja, Nigeria—2011. Pan Afr. Med. J. 2013, 16, 103. [Google Scholar] [CrossRef]
- Niaz, S.; Raqeeb, A.; Khan, A.; Nasreen; Amir, S.; Zhu, L.; Kumar, S. Status of human brucellosis in district Malakand, Khyber Pakhtunkhwa, Pakistan. J. Infect. Public Health 2021, 14, 423–427. [Google Scholar] [CrossRef]
- Rahbarnia, L.; Farajnia, S.; Naghili, B.; Saeedi, N. Comparative Evaluation of Nested Polymerase Chain Reaction for Rapid Diagnosis of Human Brucellosis. Arch. Razi Inst. 2021, 76, 203–211. [Google Scholar] [CrossRef]
- Keramat, F.; Majzobi, M.M.; Poorolajal, J.; Ghane, Z.Z.; Adabi, M. Seroprevalence of Brucellosis in Human Immunodeficiency Virus Infected Patients in Hamadan, Iran. Osong Public Health Res. Perspect. 2017, 8, 282–288. [Google Scholar] [CrossRef] [PubMed]
- Khan, M.Z.; Tahir Usman, T.U.; Ummer Sadique, U.S.; Qureshi, M.S.; Hassan, M.F.; Muhammad Shahid, M.S.; Adnan Khan, A.K. Molecular characterization of Brucella abortus and Brucella melitensis in cattle and humans at the North West of Pakistan. Pak. Vet. J. 2017, 37, 360–363. [Google Scholar]
- Purwar, S.; Metgud, S.C.; Mutnal, M.B.; Nagamoti, M.B.; Patil, C.S. Utility of Serological Tests in the Era of Molecular Testing for Diagnosis of Human Brucellosis in Endemic Area with Limited Resources. J. Clin. Diagn. Res. 2016, 10, Dc26–Dc29. [Google Scholar] [CrossRef] [PubMed]
- Asif, M.; Waheed, U.; Farooq, M.; Ali, T.; Khan, Q.M. Frequency of Brucellosis in High Risk Human Groups in Pakistan Detected through Polymerase Chain Reaction and its Comparison with Conventional Slide Agglutination Test. Int. J. Agric. Biol. 2014, 16, 986–990. [Google Scholar]
- Peeridogaheh, H.; Golmohammadi, M.G.; Pourfarzi, F. Evaluation of ELISA and Brucellacapt tests for diagnosis of human Brucellosis. Iran. J. Microbiol. 2013, 5, 14–18. [Google Scholar]
- Alam, M.; Paul, S.K.; Haque, N.; Ahmad, F.U.; Mazid, R.; Al Amin, M.M.; Aziz, M.A.; Paul, A.; Ahmed, S.; Nasreen, S.A.; et al. Seropositivity of Human Brucellosis among Patients with Pyrexia of Unknown Origin on Both Risk and Non-Risk Group of Individuals and Molecular Detection by Real-time PCR. Mymensingh Med. J. 2021, 30, 936–942. [Google Scholar]
- Kalule, J.B.; Tomusange, J.; Namatovu, T. Serological detection of brucellosis among febrile, malaria-negative children and domesticated dogs in an urban African setting. Afr. J. Lab. Med. 2020, 9, 864. [Google Scholar] [CrossRef]
- Tschopp, R.; Gebregiorgis, A.; Tassachew, Y.; Andualem, H.; Osman, M.; Waqjira, M.W.; Hattendorf, J.; Mohammed, A.; Hamid, M.; Molla, W.; et al. Integrated human-animal sero-surveillance of Brucellosis in the pastoral Afar and Somali regions of Ethiopia. PLoS Negl. Trop. Dis. 2021, 15, e0009593. [Google Scholar] [CrossRef]
- Mubanga, M.; Mfune, R.L.; Kothowa, J.; Mohamud, A.S.; Chanda, C.; McGiven, J.; Bumbangi, F.N.; Hang’ombe, B.M.; Godfroid, J.; Simuunza, M.; et al. Brucella Seroprevalence and Associated Risk Factors in Occupationally Exposed Humans in Selected Districts of Southern Province, Zambia. Front. Public. Health 2021, 9, 745244. [Google Scholar] [CrossRef] [PubMed]
- Damke, S.S.; Damke, S.G. Seroprevalence of Brucella agglutinins in patients with pyrexia of unknown origin attending a tertiary care rural hospital. J. Evol. Med. 2020, 3, 162–165. [Google Scholar]
- DHASON, T.; SUBRAMANIAN, M.; MANI, A.; AURLENE, N. Seroprevalence of Anti-Brucella Antibodies IgG and IgM in Acute Polyarthritis in a Tertiary Care Center in Southern India. J. Clin. Diagn. Res. 2019, 13, 6. [Google Scholar] [CrossRef]
- Elhaig, M.M.; Wahdan, A. Seroprevalence, associated risk factors, and molecular detection of bovine brucellosis in rural areas of Egypt. Comp. Immunol. Microbiol. Infect. Dis. 2023, 95, 101971. [Google Scholar] [CrossRef] [PubMed]
- Abnaroodheleh, F.; Emadi, A.; Dashtipour, S.; Jamil, T.; Mousavi Khaneghah, A.; Dadar, M. Shedding rate of Brucella spp. in the milk of seropositive and seronegative dairy cattle. Heliyon 2023, 9, e15085. [Google Scholar] [CrossRef]
- Hussain, S.; Hussain, A.; Aziz, M.U.; Song, B.; Zeb, J.; Hasib, F.M.Y.; Li, J.; Rehman, A.; George, D.; Cabezas-Cruz, A.; et al. First serological evidence of Q fever in large ruminants and its associated risk factors in Punjab, Pakistan. Sci. Rep. 2022, 12, 17278. [Google Scholar] [CrossRef]
- Islam, S.; Barua, S.R.; Moni, S.P.; Islam, A.; Rahman, A.; Chowdhury, S. Seroprevalence and risk factors for bovine brucellosis in the Chittagong Metropolitan Area of Bangladesh. Vet. Med. Sci. 2021, 7, 86–98. [Google Scholar] [CrossRef]
- Khan, M.R.; Rehman, A.; Khalid, S.; Ahmad, M.U.D.; Avais, M.; Sarwar, M.; Awan, F.N.; Melzer, F.; Neubauer, H.; Jamil, T. Seroprevalence and Associated Risk Factors of Bovine Brucellosis in District Gujranwala, Punjab, Pakistan. Animals 2021, 11, 1744. [Google Scholar] [CrossRef]
- Kathiriya, J.B.; Shah, N.M.; Trangadia, B.J.; Bhedi, K.R.; Sindhi, S.H.; Montagnaro, S. Evaluation of lateral flow assay as a field test for sero-diagnosis of bovine brucellosis. Indian J. Anim. Sci. 2021, 91, 1050–1053. [Google Scholar] [CrossRef]
- Saidu, A.S.; Mahajan, N.K.; Musallam, I.I.; Holt, H.R.; Guitian, J. Epidemiology of bovine brucellosis in Hisar, India: Identification of risk factors and assessment of knowledge, attitudes, and practices among livestock owners. Trop. Anim. Health Prod. 2021, 53, 450. [Google Scholar] [CrossRef]
- Zhang, H.; Deng, X.; Cui, B.; Shao, Z.; Zhao, X.; Yang, Q.; Song, S.; Wang, Z.; Wang, Y.; Wang, Y.; et al. Abortion and various associated risk factors in dairy cow and sheep in Ili, China. PLoS ONE 2020, 15, e0232568. [Google Scholar] [CrossRef] [PubMed]
- Fero, E.; Juma, A.; Koni, A.; Boci, J.; Kirandjiski, T.; Connor, R.; Wareth, G.; Koleci, X. The seroprevalence of brucellosis and molecular characterization of Brucella species circulating in the beef cattle herds in Albania. PLoS ONE 2020, 15, e0229741. [Google Scholar] [CrossRef] [PubMed]
- Ukwueze, K.O.; Ishola, O.O.; Dairo, M.D.; Awosanya, E.J.; Cadmus, S.I. Seroprevalence of brucellosis and associated factors among livestock slaughtered in Oko-Oba abattoir, Lagos State, southwestern Nigeria. Pan Afr. Med. J. 2020, 36, 53. [Google Scholar] [CrossRef]
- Cadmus, S.I.; Akporube, K.A.; Ola-Daniel, F.; Adelakun, O.D.; Akinseye, V.O. Seroprevalence and associated factors of brucellosis and Q-fever in cattle from Ibarapa area, Oyo State, South-western Nigeria. Pan Afr. Med. J. 2020, 36, 370. [Google Scholar] [CrossRef]
- Naz, S.; Azeem, M.; Hafeez, M.; Ashraf, K.; Asif, K.; Ali, A.; Ashfaq, H.; Shehzad, W.; Imran, M.; Tayyub, M. Comparison of molecular and serological tests for detection of Brucella abortus in asymptomatic bovine breeding bulls. JAPSJ. Anim. Plant Sci. 2020, 30. [Google Scholar]
- ElTahir, Y.; Al-Farsi, A.; Al-Marzooqi, W.; Al-Toobi, A.; Gaafar, O.M.; Jay, M.; Corde, Y.; Bose, S.; Al-Hamrashdi, A.; Al-Kharousi, K.; et al. Investigation on Brucella infection in farm animals in Saham, Sultanate of Oman with reference to human brucellosis outbreak. BMC Vet. Res. 2019, 15, 378. [Google Scholar] [CrossRef]
- Falzon, L.C.; Traoré, S.; Kallo, V.; Assamoi, J.B.; Bonfoh, B.; Schelling, E. Evaluation of the Fluorescence Polarization Assay as a Rapid On-Spot Test for Ruminant Brucellosis in Côte d’Ivoire. Front. Vet. Sci. 2019, 6, 287. [Google Scholar] [CrossRef] [PubMed]
- Gioia, G.; Vinueza, R.L.; Cruz, M.; Jay, M.; Corde, Y.; Marsot, M.; Zanella, G. Estimating the probability of freedom from bovine brucellosis in the Galapagos Islands. Epidemiol. Infect. 2018, 147, e9. [Google Scholar] [CrossRef]
- Ogugua, A.J.; Akinseye, V.O.; Cadmus, E.O.; Jolaoluwa Awosanya, E.A.; Alabi, P.I.; Idowu, O.S.; Akinade, S.A.; Dale, E.J.; Perrett, L.; Taylor, A.; et al. Prevalence and risk factors associated with bovine brucellosis in herds under extensive production system in southwestern Nigeria. Trop. Anim. Health Prod. 2018, 50, 1573–1582. [Google Scholar] [CrossRef]
- Adamu, S.G.; Kabir, J.; Umoh, J.U.; Raji, M.A. Seroprevalence of brucellosis and Q fever (Coxiellosis) in cattle herds in Maigana and Birnin Gwari agro-ecological zone of Kaduna State, Nigeria. Trop. Anim. Health Prod. 2018, 50, 1583–1589. [Google Scholar] [CrossRef]
- Barkallah, M.; Gharbi, Y.; Zormati, S.; Karkouch, N.; Mallek, Z.; Gautier, M.; Gdoura, R.; Fendri, I. A mixed methods study of ruminant brucellosis in central-eastern Tunisia. Trop. Anim. Health Prod. 2017, 49, 39–45. [Google Scholar] [CrossRef] [PubMed]
- Aworh, M.K.; Okolocha, E.C.; Awosanya, E.J.; Fasina, F.O. Sero-prevalence and intrinsic factors associated with Brucella infection in food animals slaughtered at abattoirs in Abuja, Nigeria. BMC Res. Notes 2017, 10, 499. [Google Scholar] [CrossRef] [PubMed]
- Anjaneyareddy, K.B.; Muniveerappa, V.B.; ISLOOR, S.; Gowda, L.; Kamran, C.; Gomes, A.R.; Kalleshamurthy, T.; Shankaranarayana, P.B.; Shome, R. Comparative evaluation of blood based lateral flow assay for diagnosis of brucellosis in livestock species. Indian J. Anim. Sci. 2017, 87, 1068–1070. [Google Scholar] [CrossRef]
- Pathak, A.D.; Dubal, Z.B.; Karunakaran, M.; Doijad, S.P.; Raorane, A.V.; Dhuri, R.B.; Bale, M.A.; Chakurkar, E.B.; Kalorey, D.R.; Kurkure, N.V.; et al. Apparent seroprevalence, isolation and identification of risk factors for brucellosis among dairy cattle in Goa, India. Comp. Immunol. Microbiol. Infect. Dis. 2016, 47, 1–6. [Google Scholar] [CrossRef]
- Praud, A.; Durán-Ferrer, M.; Fretin, D.; Jaÿ, M.; O’Connor, M.; Stournara, A.; Tittarelli, M.; Travassos Dias, I.; Garin-Bastuji, B. Evaluation of three competitive ELISAs and a fluorescence polarisation assay for the diagnosis of bovine brucellosis. Vet. J. 2016, 216, 38–44. [Google Scholar] [CrossRef]
- Gwida, M.; El-Ashker, M.; Melzer, F.; El-Diasty, M.; El-Beskawy, M.; Neubauer, H. Use of serology and real time PCR to control an outbreak of bovine brucellosis at a dairy cattle farm in the Nile Delta region, Egypt. Ir. Vet. J. 2015, 69, 3. [Google Scholar] [CrossRef]
- Wareth, G.; Melzer, F.; Tomaso, H.; Roesler, U.; Neubauer, H. Detection of Brucella abortus DNA in aborted goats and sheep in Egypt by real-time PCR. BMC Res. Notes 2015, 8, 212. [Google Scholar] [CrossRef]
- Mathew, C.; Stokstad, M.; Johansen, T.B.; Klevar, S.; Mdegela, R.H.; Mwamengele, G.; Michel, P.; Escobar, L.; Fretin, D.; Godfroid, J. First isolation, identification, phenotypic and genotypic characterization of Brucella abortus biovar 3 from dairy cattle in Tanzania. BMC Vet. Res. 2015, 11, 156. [Google Scholar] [CrossRef]
- Abakar, M.F.; Naré, N.B.; Schelling, E.; Hattendorf, J.; Alfaroukh, I.O.; Zinsstag, J. Seroprevalence of Rift Valley fever, Q fever, and brucellosis in ruminants on the southeastern shore of Lake Chad. Vector Borne Zoonotic Dis. 2014, 14, 757–762. [Google Scholar] [CrossRef]
- Szulowski, K.; Iwaniak, W.; Weiner, M.; Złotnicka, J. Brucella suis biovar 2 isolations from cattle in Poland. Ann. Agric. Environ. Med. 2013, 20, 672–675. [Google Scholar]
- Batrinou, A.; Strati, I.F.; Tsantes, A.G.; Papaparaskevas, J.; Dimou, I.; Vourvidis, D.; Kyrma, A.; Antonopoulos, D.; Halvatsiotis, P.; Houhoula, D. The Importance of Complementary PCR Analysis in Addition to Serological Testing for the Detection of Transmission Sources of Brucella spp. in Greek Ruminants. Vet. Sci. 2022, 9, 193. [Google Scholar] [CrossRef]
- Akoko, J.M.; Pelle, R.; Lukambagire, A.S.; Machuka, E.M.; Nthiwa, D.; Mathew, C.; Fèvre, E.M.; Bett, B.; Cook, E.A.J.; Othero, D.; et al. Molecular epidemiology of Brucella species in mixed livestock-human ecosystems in Kenya. Sci. Rep. 2021, 11, 8881. [Google Scholar] [CrossRef]
- Samkange, A.; van der Westhuizen, J.; Voigts, A.S.; Chitate, F.; Kaatura, I.; Khaiseb, S.; Hikufe, E.H.; Kabajani, J.; Bishi, A.S.; Mbiri, P.; et al. Investigation of the outbreaks of abortions and orchitis in livestock in Namibia during 2016–2018. Trop. Anim. Health Prod. 2022, 54, 346. [Google Scholar] [CrossRef] [PubMed]
- Kakooza, S.; Watuwa, J.; Ipola, P.A.; Munyiirwa, D.F.N.; Kayaga, E.; Nabatta, E.; Mahero, M.; Ssajjakambwe, P.; Kaneene, J.B. Seromonitoring of brucellosis in goats and sheep slaughtered at an abattoir in Kampala, Uganda. J. Vet. Diagn. Investig. 2022, 34, 964–967. [Google Scholar] [CrossRef] [PubMed]
- Tialla, D. The first study on seroprevalence and risk factors for zoonotic transmission of ovine and caprine brucellosis in the Province of Bam, Burkina Faso. Vet. World 2022, 15, 262–267. [Google Scholar] [CrossRef]
- Munsi, M.N.; Akther, S.; Rahman, M.H.; Hassan, M.Z.; Ali, M.Z.; Ershaduzzaman, M. Seroprevalence of Brucellosis in goats in some selected areas of Bangladesh. J. Adv. Vet. Anim. Res. 2021, 8, 123–128. [Google Scholar] [CrossRef]
- Abnaroodheleh, F.; Emadi, A.; Dadar, M. Seroprevalence of brucellosis and chlamydiosis in sheep and goats with history of abortion in Iran. Small Rumin. Res. 2021, 202, 106459. [Google Scholar] [CrossRef]
- Awandkar, S.; Kale, S.; Sonekar, C.; Gabhane, G.; Chaudhari, S.; Kurkure, N. Gynaecological disorders associated with Brucella melitensis in goat flocks with potential risk of occupational zoonoses in Central India. Curr. Sci. 2021, 120, 1912–1916. [Google Scholar] [CrossRef]
- Kanani, A.; Dabhi, S.; Patel, Y.; Chandra, V.; Kumar, O.R.V.; Shome, R. Seroprevalence of brucellosis in small ruminants in organized and unorganized sectors of Gujarat state, India. Vet. World 2018, 11, 1030–1036. [Google Scholar] [CrossRef]
- ElTahir, Y.; Al Toobi, A.G.; Al-Marzooqi, W.; Mahgoub, O.; Jay, M.; Corde, Y.; Al Lawati, H.; Bose, S.; Al Hamrashdi, A.; Al Kharousi, K.; et al. Serological, cultural and molecular evidence of Brucella melitensis infection in goats in Al Jabal Al Akhdar, Sultanate of Oman. Vet. Med. Sci. 2018, 4, 190–205. [Google Scholar] [CrossRef]
- Costa, L.F.; Pessoa, M.S.; Guimarães, L.B.; Faria, A.K.; Morão, R.P.; Mol, J.P.; Garcia, L.N.; Almeida, A.C.; Gouveia, A.M.; Silva, M.X.; et al. Serologic and molecular evidence of Brucella ovis infection in ovine and caprine flocks in the State of Minas Gerais, Brazil. BMC Res. Notes 2016, 9, 190. [Google Scholar] [CrossRef] [PubMed]
- Linderot de Cardona, K.; De Gracia Scanapieco, A.; Braun, P.G. First results on small ruminant brucellosis and tuberculosis and caprine arthritis-encephalitis in El Salvador. Trop. Anim. Health Prod. 2016, 48, 1083–1087. [Google Scholar] [CrossRef]
- Sadhu, D.B.; Panchasara, H.H.; Chauhan, H.C.; Sutariya, D.R.; Parmar, V.L.; Prajapati, H.B. Seroprevalence and comparison of different serological tests for brucellosis detection in small ruminants. Vet. World 2015, 8, 561–566. [Google Scholar] [CrossRef] [PubMed]
- Rahman, A.K.; Saegerman, C.; Berkvens, D.; Fretin, D.; Gani, M.O.; Ershaduzzaman, M.; Ahmed, M.U.; Emmanuel, A. Bayesian estimation of true prevalence, sensitivity and specificity of indirect ELISA, Rose Bengal Test and Slow Agglutination Test for the diagnosis of brucellosis in sheep and goats in Bangladesh. Prev. Vet. Med. 2013, 110, 242–252. [Google Scholar] [CrossRef]
- Bhandi, S.; Pfukenyi, D.M.; Matope, G.; Murondoti, A.; Tivapasi, M.; Ndengu, M.; Scacchia, M.; Bonfini, B.; De Garine-Wichatitsky, M. Brucellosis and chlamydiosis seroprevalence in goats at livestock-wildlife interface areas of Zimbabwe. Onderstepoort J. Vet. Res. 2019, 86, e1–e9. [Google Scholar] [CrossRef]
- Sonekar, C.P.; Kale, S.; Bhoyar, S.; Paliwal, N.; Shinde, S.V.; Awandkar, S.P.; Khan, W.; Chaudhari, S.P.; Kurkure, N.V. Brucellosis in migratory sheep flock from Maharashtra, India. Trop. Anim. Health Prod. 2018, 50, 91–96. [Google Scholar] [CrossRef] [PubMed]
- Shome, R.; Sahay, S.; Triveni, K.; Krithiga, N.; Shome, B.; Rahman, H. Evidence of ovine brucellosis due to Brucella ovis and Brucella melitensis in Karnataka, India. Indian J. Anim. Sci. 2018, 88, 522–525. [Google Scholar] [CrossRef]
- Fiasconaro, M.; Mannelli, A.; Rappazzo, E.; Aronica, V.; Ferrara, M.C.; Vesco, G.; Presti, V.D.M.L. Field evaluation of fluorescence polarization assay, and comparison with competitive ELISA for the detection of antibodies against Brucella melitensis in sheep in Sicily, Italy. Small Rumin. Res. 2015, 130, 252–255. [Google Scholar] [CrossRef]
- Alhussain, H.; Zughaier, S.M.; Gawish, A.; Mahmoud, M.H.; Yassine, H.M.; Al Thani, A.; Obied, T.E.; Al-Zeyara, A.M.; Eltai, N.O. Seroprevalence of camel brucellosis in Qatar. Trop. Anim. Health Prod. 2022, 54, 351. [Google Scholar] [CrossRef]
- Baloch, A.S.; Rasheed, A.; Rind, R.; Sahito, J.K.; Buriro, R.; Ayoob, M.F.; Dewani, P. Seroprevalence of brucellosis in camels in Sindh, Pakistan. Pak. J. Zool. 2017, 49, 367–369. [Google Scholar] [CrossRef]
- Salih, M.E.; Shuaib, Y.A.; Suliman, S.E.; Abdalla, M.A. Seroprevalence and risk factors of brucellosis in camels in and around Alzulfi, Saudi Arabia. J. Camel Pract. Res. 2016, 23, 265–275. [Google Scholar] [CrossRef]
- Dadar, M.; Alamian, S. Isolation of Brucella melitensis from seronegative camel: Potential implications in brucellosis control. Prev. Vet. Med. 2020, 185, 105194. [Google Scholar] [CrossRef]
- Fatima, S.; Khan, I.; Nasir, A.; Younus, M.; Saqib, M.; Melzer, F.; Neubauer, H.; El-Adawy, H. Serological, molecular detection and potential risk factors associated with camel brucellosis in Pakistan. Trop. Anim. Health Prod. 2016, 48, 1711–1718. [Google Scholar] [CrossRef]
- Cetaruk, E.W. Brucella Species (Brucellosis) Attack. In Ciottone’s Disaster Medicine; Elsevier: Amsterdam, The Netherlands, 2024; pp. 751–753. [Google Scholar]
- OIE. Brucellosis (infection with Brucella abortus, B. melitensis and B. suis). In Manual of Diagnostic Tests and Vaccines for Terrestrial Animals; World Organisation for Animal Health Paris: Paris, France, 2022. [Google Scholar]
- Godfroid, J.; Al Dahouk, S.; Pappas, G.; Roth, F.; Matope, G.; Muma, J.; Marcotty, T.; Pfeiffer, D.; Skjerve, E. A “One Health” surveillance and control of brucellosis in developing countries: Moving away from improvisation. Comp. Immunol. Microbiol. Infect. Dis. 2013, 36, 241–248. [Google Scholar] [CrossRef]
- Praud, A.; Champion, J.L.; Corde, Y.; Drapeau, A.; Meyer, L.; Garin-Bastuji, B. Assessment of the diagnostic sensitivity and specificity of an indirect ELISA kit for the diagnosis of Brucella ovis infection in rams. BMC Vet. Res. 2012, 8, 68. [Google Scholar] [CrossRef] [PubMed]
- Ahmed, E.M.; Naguib, D.; Mazeed, A.M.; Ahmed, A.E.; El-tarabili, R.M. Comparative Diagnostic Efficacy of Commonly used Serological Assays for Brucellosis. Pak. Vet. J. 2023, 43, 665–670. [Google Scholar]
- Xu, N.; Qu, C.; Sai, L.; Wen, S.; Yang, L.; Wang, S.; Yang, H.; Liu, H.; Wang, G. Evaluating the efficacy of serological testing of clinical specimens collected from patients with suspected brucellosis. PLoS Negl. Trop. Dis. 2023, 17, e0011131. [Google Scholar] [CrossRef]
- Legesse, A.; Mekuriaw, A.; Gelaye, E.; Abayneh, T.; Getachew, B.; Weldemedhin, W.; Tesgera, T.; Deresse, G.; Birhanu, K. Comparative evaluation of RBPT, I-ELISA, and CFT for the diagnosis of brucellosis and PCR detection of Brucella species from Ethiopian sheep, goats, and cattle sera. BMC Microbiol. 2023, 23, 216. [Google Scholar] [CrossRef] [PubMed]
- Nielsen, K. Diagnosis of brucellosis by serology. Vet. Microbiol. 2002, 90, 447–459. [Google Scholar] [CrossRef]
- Jain-Gupta, N.; Waldrop, S.G.; Tenpenny, N.M.; Witonsky, S.G.; Boyle, S.M.; Sriranganathan, N. Rough Brucella neotomae provides protection against Brucella suis challenge in mice. Vet. Microbiol. 2019, 239, 108447. [Google Scholar] [CrossRef]
- Nielsen, K.; Yu, W. Serological diagnosis of brucellosis. Prilozi 2010, 31, 65–89. [Google Scholar] [PubMed]
- Kaltungo, B.; Saidu, S.; Sackey, A.; Kazeem, H. A review on diagnostic techniques for brucellosis. Afr. J. Biotechnol. 2014, 13, 7C9F42D42549. [Google Scholar]
- Al Dahouk, S.; Nöckler, K. Implications of laboratory diagnosis on brucellosis therapy. Expert Rev. Anti-Infect. Ther. 2011, 9, 833–845. [Google Scholar] [CrossRef]
- Alton, G.G.; Jones, L.M.; Angus, R.; Verger, J. Techniques for the Brucellosis Laboratory; Institut National de la recherche Agronomique (INRA): Paris, France, 1988. [Google Scholar]
- Araj, G.F.; Lulu, A.R.; Mustafa, M.Y.; Khateeb, M.I. Evaluation of ELISA in the diagnosis of acute and chronic brucellosis in human beings. Epidemiol. Infect. 1986, 97, 457–469. [Google Scholar] [CrossRef] [PubMed]
- Meena, D.S.; Sharma, L.; Bishnoi, J.; Soni, M.; Jeph, N.K.; Galav, V.; Sharma, S.K. Serological and molecular prevalence of Brucella spp. among livestock species in Rajasthan, India. Front. Vet. Sci. 2023, 10, 1157211. [Google Scholar] [CrossRef]
- Erdenebaatar, J.; Bayarsaikhan, B.; Yondondorj, A.; Watarai, M.; Shirahata, T.; Jargalsaikhan, E.; Kawamoto, K.; Makino, S. Epidemiological and serological survey of brucellosis in Mongolia by ELISA using sarcosine extracts. Microbiol. Immunol. 2004, 48, 571–577. [Google Scholar] [CrossRef]
- Díaz, R.; Casanova, A.; Ariza, J.; Moriyón, I. The Rose Bengal Test in human brucellosis: A neglected test for the diagnosis of a neglected disease. PLoS Negl. Trop. Dis. 2011, 5, e950. [Google Scholar] [CrossRef]
- Dieckhaus, K.D.; Kyebambe, P.S. Human Brucellosis in Rural Uganda: Clinical Manifestations, Diagnosis, and Comorbidities at Kabale Regional Referral Hospital, Kabale, Uganda. Open Forum Infect. Dis. 2017, 4, ofx237. [Google Scholar] [CrossRef]
- Greiner, M.; Verloo, D.; de Massis, F. Meta-analytical equivalence studies on diagnostic tests for bovine brucellosis allowing assessment of a test against a group of comparative tests. Prev. Vet. Med. 2009, 92, 373–381. [Google Scholar] [CrossRef]
- Xu, N.; Wang, W.; Chen, F.; Li, W.; Wang, G. ELISA is superior to bacterial culture and agglutination test in the diagnosis of brucellosis in an endemic area in China. BMC Infect. Dis. 2020, 20, 11. [Google Scholar] [CrossRef]
- Franco, M.P.; Mulder, M.; Gilman, R.H.; Smits, H.L. Human brucellosis. Lancet Infect. Dis. 2007, 7, 775–786. [Google Scholar] [CrossRef] [PubMed]
- Kiros, A.; Asgedom, H.; Abdi, R.D. A review on bovine brucellosis: Epidemiology, diagnosis and control options. ARC J. Anim. Vet. Sci. (AJAVS) 2016, 2, 8–21. [Google Scholar]
- Sareyyüpoğlu, B.; Cantekin, Z.; Müştak, H.K. Investigation of Brucella antibodies in bovine sera by rose bengal plate test (RBPT), serum agglutination test (SAT), microagglutination test (MAT) and 2-mercaptoethanol-microagglutination (2-ME-MAT) test. Ank. Üniversitesi Vet. Fakültesi Derg. 2010, 57, 157–160. [Google Scholar]
- Gall, D.; Nielsen, K. Serological diagnosis of bovine brucellosis: A review of test performance and cost comparison. Rev. Sci. Tech. 2004, 23, 989–1002. [Google Scholar] [CrossRef] [PubMed]
- Moreno, E.; Blasco, J.M.; Moriyón, I. Facing the Human and Animal Brucellosis Conundrums: The Forgotten Lessons. Microorganisms 2022, 10, 942. [Google Scholar] [CrossRef]
- Seleem, M.N.; Boyle, S.M.; Sriranganathan, N. Brucellosis: A re-emerging zoonosis. Vet. Microbiol. 2010, 140, 392–398. [Google Scholar] [CrossRef]
- Alikhani, M.Y.; Hashemi, S.H.; Naseri, Z.; Farajnia, S.; PEERI, D.H. Diagnosis of human brucellosis by blood culture (BACTEC) and PCR method via whole blood and serum. Jundishapur J. Microbiol. 2013, 6, 248. [Google Scholar] [CrossRef]
- Ghorbani, A.; Rabbani Khorasgani, M.; Zarkesh-Esfahani, H.; Sharifiyazdi, H.; Kashani, A.D.; Emami, H. Comparison of serology, culture, and PCR for detection of brucellosis in slaughtered camels in Iran. Comp. Clin. Pathol. 2013, 22, 913–917. [Google Scholar] [CrossRef]
- Khan, A.U.; Melzer, F.; Sayour, A.E.; Shell, W.S.; Linde, J.; Abdel-Glil, M.; El-Soally, S.; Elschner, M.C.; Sayour, H.E.M.; Ramadan, E.S.; et al. Whole-Genome Sequencing for Tracing the Genetic Diversity of Brucella abortus and Brucella melitensis Isolated from Livestock in Egypt. Pathogens 2021, 10, 759. [Google Scholar] [CrossRef]
- Abdel-Hamid, N.H.; Beleta, E.I.M.; Kelany, M.A.; Ismail, R.I.; Shalaby, N.A.; Khafagi, M.H.M. Validation of real-time polymerase chain reaction versus conventional polymerase chain reaction for diagnosis of brucellosis in cattle sera. Vet. World 2021, 14, 144–154. [Google Scholar] [CrossRef]
- Dal, T.; Kara, S.S.; Cikman, A.; Balkan, C.E.; Acıkgoz, Z.C.; Zeybek, H.; Uslu, H.; Durmaz, R. Comparison of multiplex real-time polymerase chain reaction with serological tests and culture for diagnosing human brucellosis. J. Infect. Public Health 2019, 12, 337–342. [Google Scholar] [CrossRef]
- Hosein, H.; Abdel-Raouf, A.; Madkour, B.; Mazeed, A.; Rouby, S. Comparative assessment of sensitivity and specificity of some diagnostic procedures of brucellosis using different approaches. Adv. Anim. Vet. Sci. 2021, 9, 2176–2183. [Google Scholar] [CrossRef]
- Paweska, J.T.; Potts, A.D.; Harris, H.J.; Smith, S.J.; Viljoen, G.J.; Dungu, B.; Brett, O.L.; Bubb, M.; Prozesky, L. Validation of an indirect enzyme-linked immunosorbent assay for the detection of antibody against Brucella abortus in cattle sera using an automated ELISA workstation. Onderstepoort J. Vet. Res. 2002, 69, 61–77. [Google Scholar] [PubMed]
- MacMillan, A.P.; Greiser-Wilke, I.; Moennig, V.; Mathias, L.A. A competition enzyme immunoassay for brucellosis diagnosis. Dtsch. Tierarztl. Wochenschr. 1990, 97, 83–85. [Google Scholar] [PubMed]
- Praud, A.; Gimenez, O.; Zanella, G.; Dufour, B.; Pozzi, N.; Antras, V.; Meyer, L.; Garin-Bastuji, B. Estimation of sensitivity and specificity of five serological tests for the diagnosis of porcine brucellosis. Prev. Vet. Med. 2012, 104, 94–100. [Google Scholar] [CrossRef] [PubMed]
- Nielsen, K.; Gall, D.; Smith, P.; Balsevicius, S.; Garrido, F.; Ferrer, M.D.; Biancifiori, F.; Dajer, A.; Luna, E.; Samartino, L.; et al. Comparison of serological tests for the detection of ovine and caprine antibody to Brucella melitensis. Rev. Sci. Tech. 2004, 23, 979–987. [Google Scholar] [CrossRef] [PubMed]
- de Glanville, W.A.; Conde-Álvarez, R.; Moriyón, I.; Njeru, J.; Díaz, R.; Cook, E.A.J.; Morin, M.; Bronsvoort, B.M.C.; Thomas, L.F.; Kariuki, S.; et al. Poor performance of the rapid test for human brucellosis in health facilities in Kenya. PLoS Negl. Trop. Dis. 2017, 11, e0005508. [Google Scholar] [CrossRef]
- Kiambi, S.G.; Fèvre, E.M.; Omolo, J.; Oundo, J.; de Glanville, W.A. Risk factors for acute human brucellosis in Ijara, north-eastern Kenya. PLoS Negl. Trop. Dis. 2020, 14, e0008108. [Google Scholar] [CrossRef]
- Macías Luaces, L.; Boll, K.; Klose, C.; Domogalla-Urbansky, J.; Müller, M.; Eisenberger, D.; Riehm, J.M. Seroprevalence of Brucella Infection in Wild Boars (Sus. scrofa) of Bavaria, Germany, 2019 to 2021 and Associated Genome Analysis of Five B. suis Biovar 2 Isolates. Microorganisms 2023, 11, 478. [Google Scholar] [CrossRef]
- Al-Afifi, A.H.; Alewy Almashhadany, D.; Al-Azazi, A.S.H.; Khalaf, A.M.; Naji Ahmed Odhah, M.; Al-Gabri, N.A. Prevalence of Brucella spp. in milk from aborted and non-aborted animals in Dhamar governorate, Yemen. Ital. J. Food Saf. 2022, 11, 10370. [Google Scholar] [CrossRef]
- Al-Marzooqi, W.; Elshafie, E.I.; Al-Toobi, A.; Al-Hamrashdi, A.; Al-Kharousi, K.; El-Tahir, H.; Jay, M.; Corde, Y.; ElTahir, Y. Seroprevalence and Risk Factors of Brucellosis in Ruminants in Dhofar Province in Southern Oman. Vet. Med. Int. 2022, 2022, 3176147. [Google Scholar] [CrossRef] [PubMed]
- ZareBidaki, M.; Allahyari, E.; Zeinali, T.; Asgharzadeh, M. Occurrence and risk factors of brucellosis among domestic animals: An artificial neural network approach. Trop. Anim. Health Prod. 2022, 54, 62. [Google Scholar] [CrossRef] [PubMed]
- Šerić-Haračić, S.; Velić, L.; Šaljić, E.; Čengić, B.; Tandir, F.; Hadžimusić, N. Agreement Among Rose Bengal, Complement Fixation Test, and iELISA in Diagnostic Discrimination of Sheep and Goat Brucellosis (Brucella melitensis). Acta Vet. Eurasia 2022, 48, 30–34. [Google Scholar]
- Barreto, J.V.P.; Oliveira, P.A.M.; Pertile, S.F.N.; Sbizera, M.C.R.; Rego, F.C.A.; Queiroz, G.R.; Cunha Filho, L.F.C. Non-agreement between 2 serologic techniques for detecting antibody to Brucella ovis in naturally infected sheep. J. Vet. Diagn. Investig. 2022, 34, 164–166. [Google Scholar] [CrossRef]
- Saber Marouf, A.; Hanifian, S.; Shayegh, J. Prevalence of Brucella spp. in raw milk and artisanal cheese tested via real-time qPCR and culture assay. Int. J. Food Microbiol. 2021, 347, 109192. [Google Scholar] [CrossRef] [PubMed]
- Zhou, Y.; Meng, Y.; Ren, Y.; Liu, Z.; Li, Z. A Retrospective Survey of the Abortion Outbreak Event Caused by Brucellosis at a Blue Fox Breeding Farm in Heilongjiang Province, China. Front. Vet. Sci. 2021, 8, 666254. [Google Scholar] [CrossRef]
- Govindasamy, K.; Etter, E.M.C.; Harris, B.N.; Rossouw, J.; Abernethy, D.A.; Thompson, P.N. Knowledge of Brucellosis, Health-Seeking Behaviour, and Risk Factors for Brucella Infection amongst Workers on Cattle Farms in Gauteng, South Africa. Pathogens 2021, 10, 1484. [Google Scholar] [CrossRef]
- Galluzzo, P.; Migliore, S.; Cascio, S.; Barreca, S.; Alfano, M.; Tagliarini, A.; Candela, A.; Piraino, C.; Galuppo, L.; Condorelli, L.; et al. Diagnostic Findings in a Confirmed Outbreak of Brucella ovis Infection in a Traditional Sheep Farm in Sicily (South-Italy). Pathogens 2021, 10, 1472. [Google Scholar] [CrossRef]
- Yeni, D.K.; Doğan, A. Evaluation of the analytical efficiency of Real-Time PCR in the diagnosis of Brucellosis in cattle and sheep. Kafkas Üniv. Vet. Fakültesi Derg. 2021, 27, 503–509. [Google Scholar]
- Suárez-Esquivel, M.; Ruiz-Villalobos, N.; Hidalgo-Jara, W.; Chacón-Díaz, C.; Zúñiga-Pereira, A.M.; Masís-Mora, M.; Fernández-Fernández, E.; Hernández-Mora, G.; Barquero-Calvo, E.; Chaves-Olarte, E.; et al. Canine brucellosis in Costa Rica reveals widespread Brucella canis infection and the recent introduction of foreign strains. Vet. Microbiol. 2021, 257, 109072. [Google Scholar] [CrossRef]
- Nawaz, M.; Khan, I.; Shakeel, M.; Yousaf, A.; Naseer, Z.; Zohaib, A.; Ullah, Q. Bovine and caprine brucellosis detected by milk indirect ELISA and milk ring test in Islamabad Capital Territory, Pakistan. Pak. J. Zool. 2021, 53, 391–394. [Google Scholar] [CrossRef]
- Camargo-Castañeda, A.M.; Stranahan, L.W.; Edwards, J.F.; Garcia-Gonzalez, D.G.; Roa, L.; Avila-Granados, L.M.; Hensel, M.E.; Arenas-Gamboa, A.M. Characterization of epididymal and testicular histologic lesions and use of immunohistochemistry and PCR on formalin-fixed tissues to detect Brucella canis in male dogs. J. Vet. Diagn. Investig. 2021, 33, 352–356. [Google Scholar] [CrossRef] [PubMed]
- Mol, J.P.S.; Guedes, A.C.B.; Eckstein, C.; Quintal, A.P.N.; Souza, T.D.; Mathias, L.A.; Haddad, J.P.A.; Paixão, T.A.; Santos, R.L. Diagnosis of canine brucellosis: Comparison of various serologic tests and PCR. J. Vet. Diagn. Investig. 2020, 32, 77–86. [Google Scholar] [CrossRef]
- Al-Sherida, Y.; El-Gohary, A.H.; Mohamed, A.; El-Diasty, M.; Wareth, G.; Neubauer, H.; Abdelkhalek, A. Sheep Brucellosis in Kuwait: A Large-Scale Serosurvey, Identification of Brucella Species and Zoonotic Significance. Vet. Sci. 2020, 7, 132. [Google Scholar] [CrossRef] [PubMed]
- Montagnaro, S.; D’Ambrosi, F.; Petruccelli, A.; Ferrara, G.; D’Alessio, N.; Iovane, V.; Veneziano, V.; Fioretti, A.; Pagnini, U. A Serological Survey of Brucellosis in Eurasian Wild Boar (Sus scrofa) in Campania Region, Italy. J. Wildl. Dis. 2020, 56, 424–428. [Google Scholar] [CrossRef] [PubMed]
- Leahy, E.; Shome, R.; Deka, R.P.; Sahay, S.; Grace, D.; Mazeri, S.; Lindahl, J.F. Risk factors for Brucella spp. and Coxiella burnetii infection among small ruminants in Eastern India. Infect. Ecol. Epidemiol. 2020, 10, 1783091. [Google Scholar] [CrossRef]
- Wainaina, M.; Aboge, G.O.; Omwenga, I.; Ngaywa, C.; Ngwili, N.; Kiara, H.; Wamwere-Njoroge, G.; Bett, B. Detection of Brucella spp. in raw milk from various livestock species raised under pastoral production systems in Isiolo and Marsabit Counties, northern Kenya. Trop. Anim. Health Prod. 2020, 52, 3537–3544. [Google Scholar] [CrossRef]
- Alamian, S.; Dadar, M. Brucella abortus contamination of camel milk in two Iranian regions. Prev. Vet. Med. 2019, 169, 104708. [Google Scholar] [CrossRef]
- Harms, N.J.; Jung, T.S.; Andrew, C.L.; Surujballi, O.P.; VanderKop, M.; Savic, M.; Powell, T. Health Status of Reintroduced Wood Bison (Bison bison athabascae): Assessing the Conservation Value of an Isolated Population in Northwestern Canada. J. Wildl. Dis. 2019, 55, 44–53. [Google Scholar] [CrossRef]
- Scotter, S.E.; Tryland, M.; Nymo, I.H.; Hanssen, L.; Harju, M.; Lydersen, C.; Kovacs, K.M.; Klein, J.; Fisk, A.T.; Routti, H. Contaminants in Atlantic walruses in Svalbard part 1: Relationships between exposure, diet and pathogen prevalence. Environ. Pollut. 2019, 244, 9–18. [Google Scholar] [CrossRef]
- Kumar, A.V.; Krishnaiah, N.; Rao, L.V.; Reddy, Y.N.; Reddy, K.K.; Narayana, B. Seroprevalence of brucellosis in buffaloes of Telangana state, India. Buffalo Bull. 2018, 37, 303–311. [Google Scholar]
- Yesilmen, S.; Yaman, T.; Sağsöz, H.; Bademkiran, S. Diagnosis of Q fever and Brucellosis in aborted ovine fetuses by microbiological, pathological and immunohistochemical methods. Acta Vet. 2018, 68, 168–177. [Google Scholar]
- Hussein, M.A.; Muhammid, H.A.; AL-Shemmari, I.G.; Jameel, Y.J. Efficacy of Different ELISA, Histopathology and PCR Assays for the Diagnosis of Ovine Brucellosis in Ram. J. Pure Appl. Microbiol. 2018, 12, 641–646. [Google Scholar] [CrossRef]
- Khan, T.I.; Ehtisham-ul-Haque, S.; Waheed, U.; Khan, I.; Younus, M.; Ali, S. Milk Indirect-ELISA and Milk Ring Test for Screening of Brucellosis in Buffaloes, Goats and Bulk Tank Milk Samples Collected from Two Districts of Punjab, Pakistan. Pak. Vet. J. 2018, 38, 105–108. [Google Scholar] [CrossRef]
- Hailat, N.; Khlouf, S.; Ababneh, M.; Brown, C. Pathological, Immunohistochemical and Molecular Diagnosis of Abortions in Small Ruminants in Jordan with Reference to Chlamydia abortus and Brucella melitensis. Pak. Vet. J. 2018, 38, 109–112. [Google Scholar] [CrossRef]
- Eckstein, C.; Moustacas, V.S.; Lopes, L.B.; da Silva Mol, J.P.; Gomes, S.C.; dos Santos, R.; de Castro, B.G.; Santos, R.L. Differential diagnosis of infectious reproductive diseases in sheep flocks of Mato Grosso State, Brazil. Small Rumin. Res. 2017, 153, 158–162. [Google Scholar] [CrossRef]
- Rahman, A.; Saegerman, C.; Berkvens, D.; Melzer, F.; Neubauer, H.; Fretin, D.; Abatih, E.; Dhand, N.; Ward, M.P. Brucella abortus is Prevalent in Both Humans and Animals in Bangladesh. Zoonoses Public Health 2017, 64, 394–399. [Google Scholar] [CrossRef]
- Alves, J.R.A.; de Souza Lima, G.M.; da Silva, J.D.; da Costa, D.F.; dos Santos, F.A.; dos Santos Higino, S.S.; de Azevedo, S.S.; Alves, C.J. Epidemiological characterization and risk factors associated with leptospirosis and brucellosis in small ruminants sold at animal fair in the Sertão Region of Pernambuco State, a semiarid Region of Northeastern Brazil. Semin. Ciênc. Agrár. 2017, 38, 1933–1945. [Google Scholar] [CrossRef]
- Altun, S.K.; Yiğin, A.; Gürbilek, S.E.; Gürbüz, S.; Demirci, M.; Keskin, O.; Tel, O.Y. An enzyme-linked immunosorbent assay for Brucella specific antibody and real-time PCR for detecting Brucella spp. in milk and cheese in Şanlıurfa, Turkey. Pak. Vet. J. 2017, 37, 39–42. [Google Scholar]
- Azam, A. Molecular Diagnosis of Brucella Zoonosis as Blood Transfusion Hazard in Metropolitan Population of Lahore and Okara; University of Veterinary and Animal Sciences: Lahore, Pakistan, 2017. [Google Scholar]
- Raza, A. Seroprevalence of Brucellosis in Dairy Cattle in Three Selected Districts of Punjab, Pakistan; University of Veterinary and Animal Sciences: Lahore, Pakistan, 2016. [Google Scholar]
- Tanner, M.; Inlameia, O.; Michel, A.; Maxlhuza, G.; Pondja, A.; Fafetine, J.; Macucule, B.; Zacarias, M.; Manguele, J.; Moiane, I.C.; et al. Bovine Tuberculosis and Brucellosis in Cattle and African Buffalo in the Limpopo National Park, Mozambique. Transbound. Emerg. Dis. 2015, 62, 632–638. [Google Scholar] [CrossRef]
- Barlozzari, G.; Franco, A.; Macrì, G.; Lorenzetti, S.; Maggiori, F.; Dottarelli, S.; Maurelli, M.; Di Giannatale, E.; Tittarelli, M.; Battisti, A.; et al. First report of Brucella suis biovar 2 in a semi free-range pig farm, Italy. Vet. Ital. 2015, 51, 151–154. [Google Scholar] [CrossRef] [PubMed]
- Shah, S.T.H. Sero-Prevalence of Brucellosis in Sheep in Hazara Region; University of Veterinary and Animal Sciences: Lahore, Pakistan, 2015. [Google Scholar]
- Wu, Q.; McFee, W.E.; Goldstein, T.; Tiller, R.V.; Schwacke, L. Real-time PCR assays for detection of Brucella spp. and the identification of genotype ST27 in bottlenose dolphins (Tursiops truncatus). J. Microbiol. Methods 2014, 100, 99–104. [Google Scholar] [CrossRef] [PubMed]
- Wareth, G.; Melzer, F.; Elschner, M.C.; Neubauer, H.; Roesler, U. Detection of Brucella melitensis in bovine milk and milk products from apparently healthy animals in Egypt by real-time PCR. J. Infect. Dev. Ctries. 2014, 8, 1339–1343. [Google Scholar] [CrossRef]
- Martino, P.E.; Stanchi, N.O.; Silvestrini, M.; Brihuega, B.; Samartino, L.; Parrado, E. Seroprevalence for selected pathogens of zoonotic importance in wild nutria (Myocastor coypus). Eur. J. Wildl. Res. 2014, 60, 551–554. [Google Scholar] [CrossRef]
- Gul, S.T.; Khan, A.; Ahmad, M.; Hussain, I. Seroprevalence of Brucellosis and Associated Hematobiochemical Changes in Pakistani Horses. Pak. J. Agric. Sci. 2013, 50, 745–750. [Google Scholar]


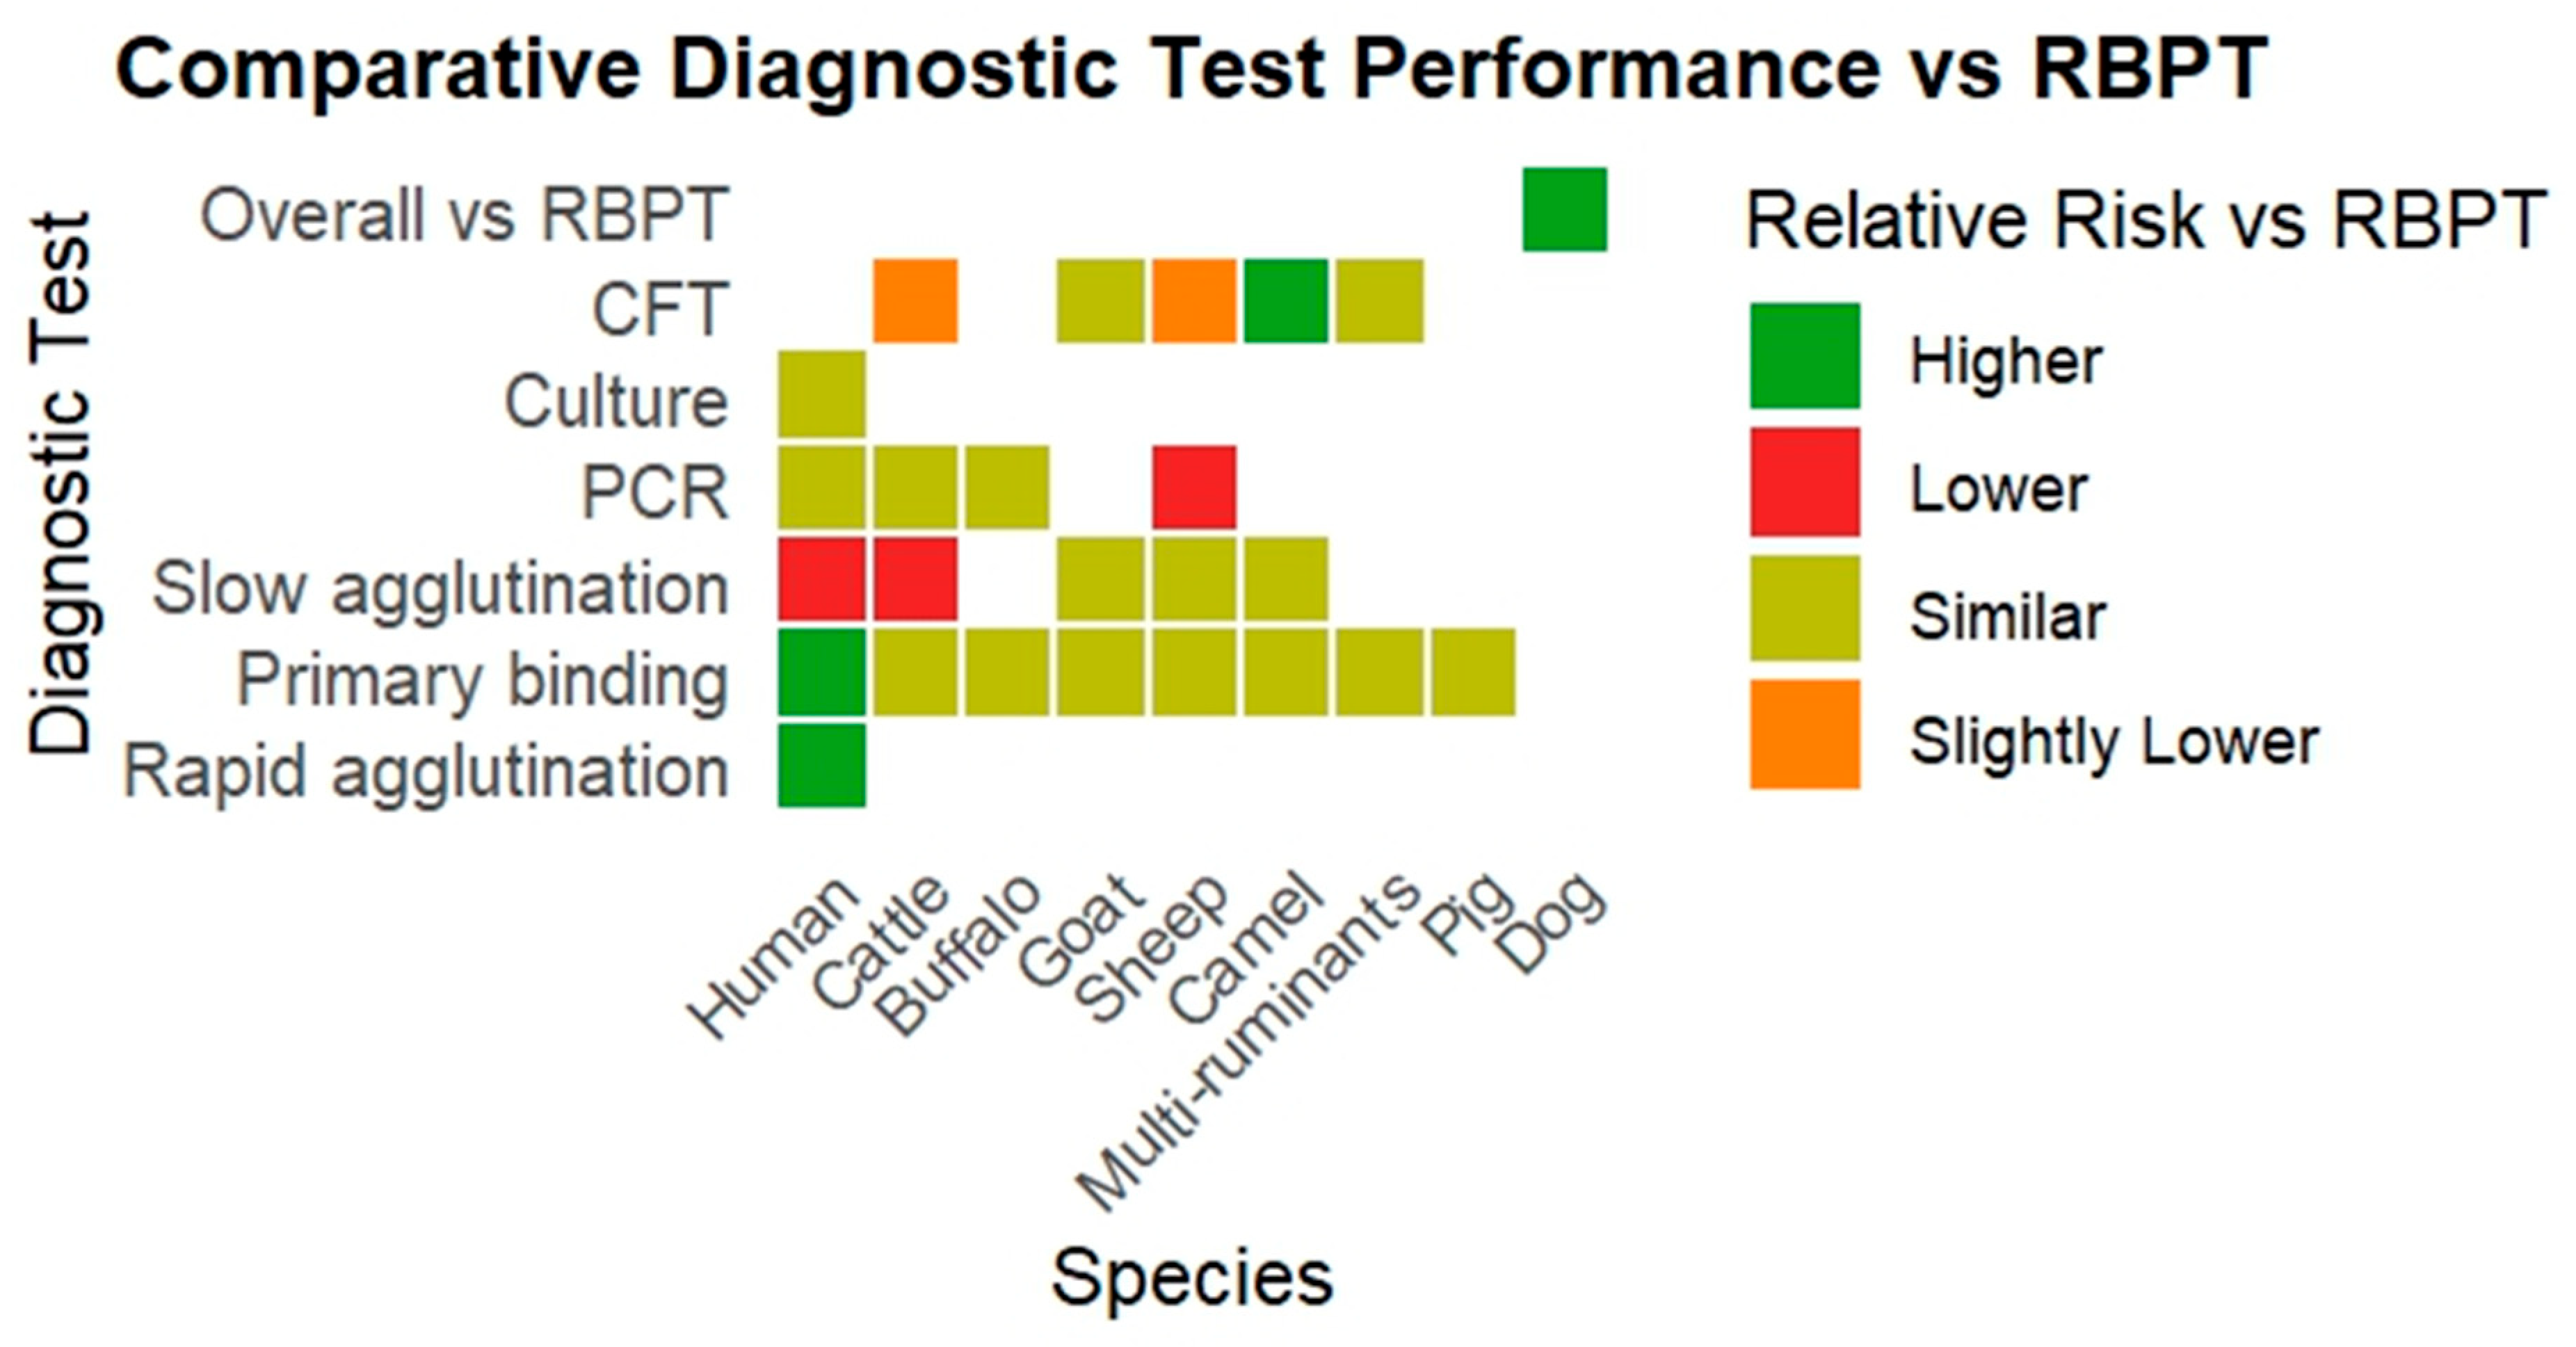
| Species | Test Group Compared to RBPT | RR (95% CI) | I2 (%) | Interpretation |
|---|---|---|---|---|
| Human | Rapid agglutination tests | 3.43 (1.78–6.59) | 18 | Higher risk |
| Human | Primary binding assays | 1.75 (1.35–2.26) | 73 | Higher risk |
| Human | Slow agglutination tests | 0.68 (0.48–0.96) | 90 | Lower risk |
| Human | PCR | 1.45 (0.27–7.80) | 95 | Similar risk |
| Human | Culture | 0.21 (0.02–2.85) | 96 | Similar risk |
| Cattle | Slow agglutination tests | 0.41 (0.25–0.68) | 96 | Lower risk |
| Cattle | CFT | 0.97 (0.94–0.99) | 9 | Slightly lower risk |
| Cattle | Primary binding assays | 1.09 (0.91–1.30) | 79 | Similar risk |
| Cattle | PCR | 1.34 (0.65–2.77) | 92 | Similar risk |
| Buffalo | Primary binding assays | 1.11 (0.91–1.34) | 0 | Similar risk |
| Buffalo | PCR | 11.16 (0.77–160.85) | 68 | Similar risk |
| Goat | Primary binding assays | 1.11 (0.76–1.61) | 66 | Similar risk |
| Goat | CFT | 0.85 (0.58–1.23) | 38 | Similar risk |
| Goat | Slow agglutination tests | 0.88(0.73–1.06) | 0 | Similar risk |
| Sheep | Primary binding assays | 1.05 (0.91–1.23) | 72 | Similar risk |
| Sheep | PCR | 0.56 (0.32–0.98) | 42 | Lower risk |
| Sheep | Slow agglutination tests | 0.92 (0.73–1.15) | 0 | Similar risk |
| Sheep | CFT | 0.97 (0.95–0.99) | 0 | Slightly lower risk |
| Camel | Primary binding assays | 0.89 (0.60–1.32) | 73 | Similar risk |
| Camel | Slow agglutination tests | 0.85 (0.56–1.30) | 0 | Similar risk |
| Camel | CFT | 1.99 (1.51–2.62) | 0 | Higher risk |
| Multi-species ruminants | CFT | 0.95 (0.78–1.15) | 15 | Similar risk |
| Multi-species ruminants | Primary binding assays | 1.04 (0.67–1.59) | 95 | Similar risk |
| Pig | Primary binding assays | 1.46 (0.48–4.48) | 94 | Similar risk |
| Dog | Overall comparison with RBPT | 1.70 (1.22–2.35) | 48 | Higher risk |
Disclaimer/Publisher’s Note: The statements, opinions and data contained in all publications are solely those of the individual author(s) and contributor(s) and not of MDPI and/or the editor(s). MDPI and/or the editor(s) disclaim responsibility for any injury to people or property resulting from any ideas, methods, instructions or products referred to in the content. |
© 2025 by the authors. Licensee MDPI, Basel, Switzerland. This article is an open access article distributed under the terms and conditions of the Creative Commons Attribution (CC BY) license (https://creativecommons.org/licenses/by/4.0/).
Share and Cite
Nazir, S.; Farooq, M.; Khan, R.; Khan, A.U.; Husnain, A.; Hassan, M.A.; El-Adawy, H.; Neubauer, H. Comparative Evaluation of Diagnostic Tests for Brucellosis in Humans and Animals: A Meta-Analytical Approach. Vet. Sci. 2025, 12, 638. https://doi.org/10.3390/vetsci12070638
Nazir S, Farooq M, Khan R, Khan AU, Husnain A, Hassan MA, El-Adawy H, Neubauer H. Comparative Evaluation of Diagnostic Tests for Brucellosis in Humans and Animals: A Meta-Analytical Approach. Veterinary Sciences. 2025; 12(7):638. https://doi.org/10.3390/vetsci12070638
Chicago/Turabian StyleNazir, Shahid, Muhammad Farooq, Raheel Khan, Aman Ullah Khan, Ali Husnain, Muhammad Ali Hassan, Hosny El-Adawy, and Heinrich Neubauer. 2025. "Comparative Evaluation of Diagnostic Tests for Brucellosis in Humans and Animals: A Meta-Analytical Approach" Veterinary Sciences 12, no. 7: 638. https://doi.org/10.3390/vetsci12070638
APA StyleNazir, S., Farooq, M., Khan, R., Khan, A. U., Husnain, A., Hassan, M. A., El-Adawy, H., & Neubauer, H. (2025). Comparative Evaluation of Diagnostic Tests for Brucellosis in Humans and Animals: A Meta-Analytical Approach. Veterinary Sciences, 12(7), 638. https://doi.org/10.3390/vetsci12070638