Article

Starch Digestion Characteristics of Different Starch Sources and Their Effects on Goslings’ Apparent Nutrient Utilization

1
Joint International Research Laboratory of Agriculture and Agri-Product Safety of Ministry of Education of China, Yangzhou University, Yangzhou 225009, China
2
Taizhou Fengda Agriculture and Animal Husbandry Technology Co., Ltd., Taizhou 225300, China
3
College of Animal Science and Technology, Yangzhou University, Yangzhou 225009, China
*
Author to whom correspondence should be addressed.
Vet. Sci. 2025, 12(7), 630; https://doi.org/10.3390/vetsci12070630
Submission received: 15 May 2025 / Revised: 27 June 2025 / Accepted: 29 June 2025 / Published: 1 July 2025
(This article belongs to the Section Veterinary Physiology, Pharmacology, and Toxicology)

Simple Summary

Starch serves as a primary energy source in poultry nutrition, hydrolyzed into glucose to meet metabolic requirements. Its digestion is influenced by intrinsic factors, particularly the particle size and structural properties. These variations in starch creation directly determine its digestibility kinetics, subsequently governing postprandial blood glucose responses and the efficiency of crude protein and amino acid utilization in geese. Consequently, elucidating the interplay between starch digestion and protein metabolism is fundamental for understanding goose nutrition science and formulating diets that optimize health, growth, and nutrient efficiency.

Abstract

This study used integrated in vitro and in vivo approaches to investigate how the starch source (glutinous rice, indica rice, maize, or high-amylose rice) influences starch digestion kinetics and, consequently, the apparent nutrient utilization and amino acid metabolism in goslings. Four diets were formulated using glutinous rice, indica rice, maize, and high-amylose rice, and in vitro digestion and animal experiments were carried out. The data showed the particle sizes of the four starches: glutinous rice ≈ indica rice < corn < amylose. The glutinous rice starch grain is a porous polyhedron with an angular surface, the corn starch grain is an ellipsoid with a smooth surface, the indica rice starch grain is a polyhedron with a smooth and compact surface, and the high-amylose starch grain is an irregular polyhedron with a smooth surface. Starch digestibility was relatively stable for the indica and corn-based diets, and starch digestibility was higher for the indica rice diet compared to the corn- and high-amylose starch-based diets. The utilization of Asp, Ser, Glu, Gly, and Phe was higher for the glutinous rice diet compared to the maize and high-amylose diets. Furthermore, with this diet, the availability of Thr and Ala was observed to be higher than with the indica rice and high-amylose diets. In conclusion, the particle size and structure of starch from different sources (glutinous rice, indica rice, corn, and high-amylose rice) were different, significantly affecting the starch digestion rate. The glutinous rice diet enables a fast digestion rate for starch, which is rapidly digested in the proximal intestine. The inadequate supply of glucose in the distal intestine enhances the oxidative energy supply from dietary amino acids in that region, thereby improving the apparent digestibility of both starch and crude protein.

1. Introduction

Starch is the main constituent of poultry diets. The physicochemical properties, molecular composition, morphological structure, and particle size of starch from different dietary sources vary significantly, which affects nutrient utilization rates in poultry [1]. These differences also lead to variable starch digestibility within the intestine, where rapidly digestible starch can trigger sharp postprandial blood glucose fluctuations [2]. Understanding these variations is crucial for precise dietary formulation. While starch digestion kinetics are frequently attributed to factors like chemical composition (amylose/amylopectin ratio) and physical structure (granule size, surface porosity) [3], with smaller granules digesting faster due to a greater enzyme-accessible surface area [4], it is essential to recognize the broader nutritional context.
The supplements in animal diets are complex and significantly influence physiological parameters beyond basic nutrition. For instance, yeast-based additives like Saccharomyces cerevisiae modulate hematological profiles (e.g., erythrocyte count, hemoglobin levels) and biochemical markers (e.g., liver enzymes, serum proteins) in ruminants, potentially enhancing growth performance and immune function (e.g., [5]). Similarly, enzyme supplements, organic acids, and probiotics are commonly used in poultry diets to improve digestibility, gut health, and productivity. However, these supplements carry risks if they are misformulated, including nutrient imbalances, toxicities (e.g., mycotoxin contamination), or gastrointestinal damage (e.g., gastric ulcers from certain acidifiers) [6,7]. Thus, a comprehensive dietary design must consider both primary nutrients and supplemental additives.
Starch, a main energy source in poultry diets, exhibits significant variation in its digestion kinetics depending on botanical origin and structural properties. Common starch sources like corn, wheat, barley, and rice differ in granule composition, amylose-to-amylopectin ratios, and interactions with non-starch components (e.g., protein matrices, fiber), all of which influence enzymatic accessibility and hydrolysis rates in the gastrointestinal tract [8]. In goslings, starch digestibility is further modulated by intrinsic physiological factors, including pancreatic enzyme activity (amylase), intestinal transit time, and the development of the gizzard’s grinding function. Additionally, dietary factors such as ingredient processing (e.g., gelatinization via heat treatment) and the presence of anti-nutritional compounds (e.g., phytate) can markedly influence starch hydrolysis efficiency [9]. Among cereal grains, rice stands out as a rapidly digestible starch source due to its low amylose content, minimal resistant starch, and the absence of viscosity-inducing β-glucans. This rapid digestibility may enhance proximal glucose absorption, but risks overwhelming metabolic capacity, potentially diverting nutrients away from growth [10]. Crucially, the rate of starch digestion directly impacts amino acid utilization: slow digestion sustains glucose release, sparing amino acids for protein synthesis, whereas rapid digestion may reduce glucose distally, forcing amino acid catabolism for energy—a wasteful metabolic pathway [11].
Despite rice’s prevalence in waterfowl diets, systematic comparisons of its starch digestion dynamics against other starch sources (e.g., corn, wheat) remain limited. This study therefore characterizes the starch digestion profiles of rice and common cereals in vitro, and evaluates their effects on apparent nutrient utilization in growing goslings, with emphasis on energy and nitrogen efficiency.

2. Materials and Methods

2.1. In Vitro Study

2.1.1. Extraction and Purification of Starch

We placed 5–10 g of four experimental feed powders (glutinous rice, indica rice, corn, and high-amylose starch) into a 50 mL centrifuge tube, added an appropriate amount of alkaline protease at a ratio of 50 mg/g, added 25 mL of NaOH solution (pH 9–10) at 42 °C, and shook the mixture for 24 h. Then homogenization was performed using a 200-mesh sieve. The filtrate material was centrifuged at 4000× g for 20 min, the supernatant was removed, and the yellow substance was scraped off of the surface. The starch precipitate was centrifuged with deionized water (ultrapure water) at 4000× g for 20 min, with this step repeated 3–4 times to wash away ions and impurities. Then the precipitate was washed 2~3 times with a 95% ethanol, methanol, and chloroform mixture (v/v = 1:1) and methanol and acetone (v/v = 1:1) 2~3 times for defatting. Finally, the extracted substance was dried at 70 °C (stirred well with a glass rod) with a 200-mesh sieve, collected, and sealed in a refrigerator at 4 °C for later use.
The ultrastructure of the sample was observed at the appropriate magnification and field of view using a field emission scanning electron microscope (Gemini SEM 300, Carl Zeiss, Oberkochen, Germany).

2.1.2. In Vitro Starch Digestion

Four kinds of experimental feeds were prepared using glutinous rice, indica rice, corn, and high-amylose rice as different starch sources (Table 1). Starch digestibility was measured using an in vitro Englyst test [11]. The procedure involved placing a test tube containing feed samples, glass balls, digestive enzymes, and incubation buffers in an oscillating water bath (37 °C; two tubes per sample). After incubating the samples for 12 time periods (0 min, 5 min, 10 min, 15 min, 20 min, 30 min, 45 min, 60 min, 90 min, 120 min, 180 min, and 240 min), they were aliquoted, and the glucose quantity was determined using a colorimetric method. The above operations were carried out according to the experiment conducted by Yang et al. [12].
According to the kit instructions, glucose standards of different concentration gradients were prepared, and the standard curve was plotted, y = 0.5345x + 0.0016 (R2 = 0.999), substituting x (OD value) to obtain y (glucose concentration).
Starch hydrolysis rate (%) = (G × 0.9)/m × 100
G indicates the amount of glucose produced after hydrolysis; 0.9 is the conversion coefficient of starch-hydrolyzed glucose; and m is the total starch content (mg).

2.2. In Vivo Study

2.2.1. Experimental Design

We obtained 240 healthy 35-day-old male Jiangnan White goslings from Changzhou Four Seasons Poultry Industry Co., Ltd. (Jintan, China). The birds were randomly allocated to four dietary treatment groups (n = 6 replicates/group; 10 birds/replicate). The geese received iso-energetic diets (Table 1) with different starch sources: GNR (glutinous rice; high amylopectin, negligible amylose), CRN (corn), INR (indica rice; high amylose), and CRN + AM (amylose-supplemented). The 33-day trial concluded when the goslings reached 68 days of age. Throughout the study, ad libitum access to feed and water was provided using plastic-lined pens with elevated feeders (70 cm height; 2 cm2 mesh openings) and semi-open cylindrical water tanks. The environmental conditions were maintained at 26.0 ± 3.0 °C, 65.5% ± 5.0% relative humidity, a 16 h light/dark cycle, and a stocking density of 0.5 m2/bird.

2.2.2. Continuous Blood Glucose Monitoring

On the 59th day of the experiment, a single goose exhibiting a body weight closest to the average was selected from each pen and transferred to an individual stainless-steel metabolic cage for continuous blood glucose monitoring. Blood glucose concentrations were measured following a fasting period and subsequently at 15, 30, 60, 120, 180, 240, and 300 min post-feeding. The rate of blood glucose increase (mg/dL/min) was calculated as the quotient of the change in the blood glucose concentration divided by the time elapsed between any two designated measurement points. All blood glucose measurements were performed using a commercial glucometer (Simcere Zaikang Jiangsu Pharmaceutical Co., Ltd., Nanjing, China).

2.2.3. Nutrient Utilization Rate

At 63 days of age, a single gosling per replicate was selected, which had an individual body weight closest to the group’s mean body weight. The selected geese were individually housed in metabolic cages (75 cm × 65 cm × 35 cm) featuring wire flooring. Each cage was equipped with an individual feeder and a self-service water system. A 3-day pretest period preceded the main trial, during which the birds had ad libitum access to feed and water. This was immediately followed by the 3-day main experimental period. Prior to initiating the main experiment, the geese underwent 24 h of fasting. They were then provided ad libitum access to their respective experimental diets. Feces were quantitatively collected over the subsequent 72 h using the total collection method [13]. The collected excreta were deposited into plastic trays; to preserve their nitrogen content, 10 mL of 10% hydrochloric acid was added per 100 g of fresh feces. Both the fecal samples and the corresponding experimental diet samples were dried in a forced-air oven at 65 °C. After drying, the samples were equilibrated to ambient moisture for 24 h under natural conditions, ground to pass completely through a 40-mesh sieve, and stored at −20 °C pending further analysis.

2.2.4. Determination Method

Starch quantification was performed using a commercial assay kit (Nanjing Jiancheng Bioengineering Institute, Nanjing, China), following the manufacturer’s protocol. Crude protein was determined via the Kjeldahl method using a FoodALYT D1000 Nitrogen Analyzer (FoodALYT, Bremen, Germany). Crude fat content was assessed via solvent extraction using a FoodALYT RD40 Fat Analyzer (FoodALYT, Germany). Amino acid analysis involved ion-exchange chromatography with post-column ninhydrin derivatization using a Hitachi L-8900 automatic amino acid analyzer (Tokyo, Japan), quantifying seventeen amino acids: aspartic acid (Asp), threonine (Thr), serine (Ser), glutamic acid (Glu), glycine (Gly), alanine (Ala), cysteine (Cys), valine (Val), methionine (Met), isoleucine (Ile), leucine (Leu), tyrosine (Tyr), phenylalanine (Phe), lysine (Lys), histidine (His), arginine (Arg), and proline (Pro).
The apparent utilization calculation method was as follows:
Utilization rate of a certain nutrient (%) = (Feed intake × Nutrient diet − Excreta output × Nutrient excreta)/Feed intake × Nutrient diet) × 100%

2.3. Statistical Analysis

The data were initially compiled using Microsoft Excel 2020. Further statistical analyses were executed using SPSS Statistics software (Version 20.0, SPSS Inc., Chicago, IL, USA). Blood glucose measurements underwent analysis via a repeated-measures analysis of variance (ANOVA) based on a randomized block design, utilizing a 4 (dietary treatments) × 7 (time periods) factorial model. This model assessed the influence of the primary starch sources (four dietary groups), the seven sampling times, and their potential interaction. When the ANOVA results indicated statistically significant effects (p < 0.05), Tukey’s honestly significant difference (HSD) test was applied for post hoc pairwise comparisons. All outcomes are expressed as the mean ± standard error of the mean (SEM).

3. Results

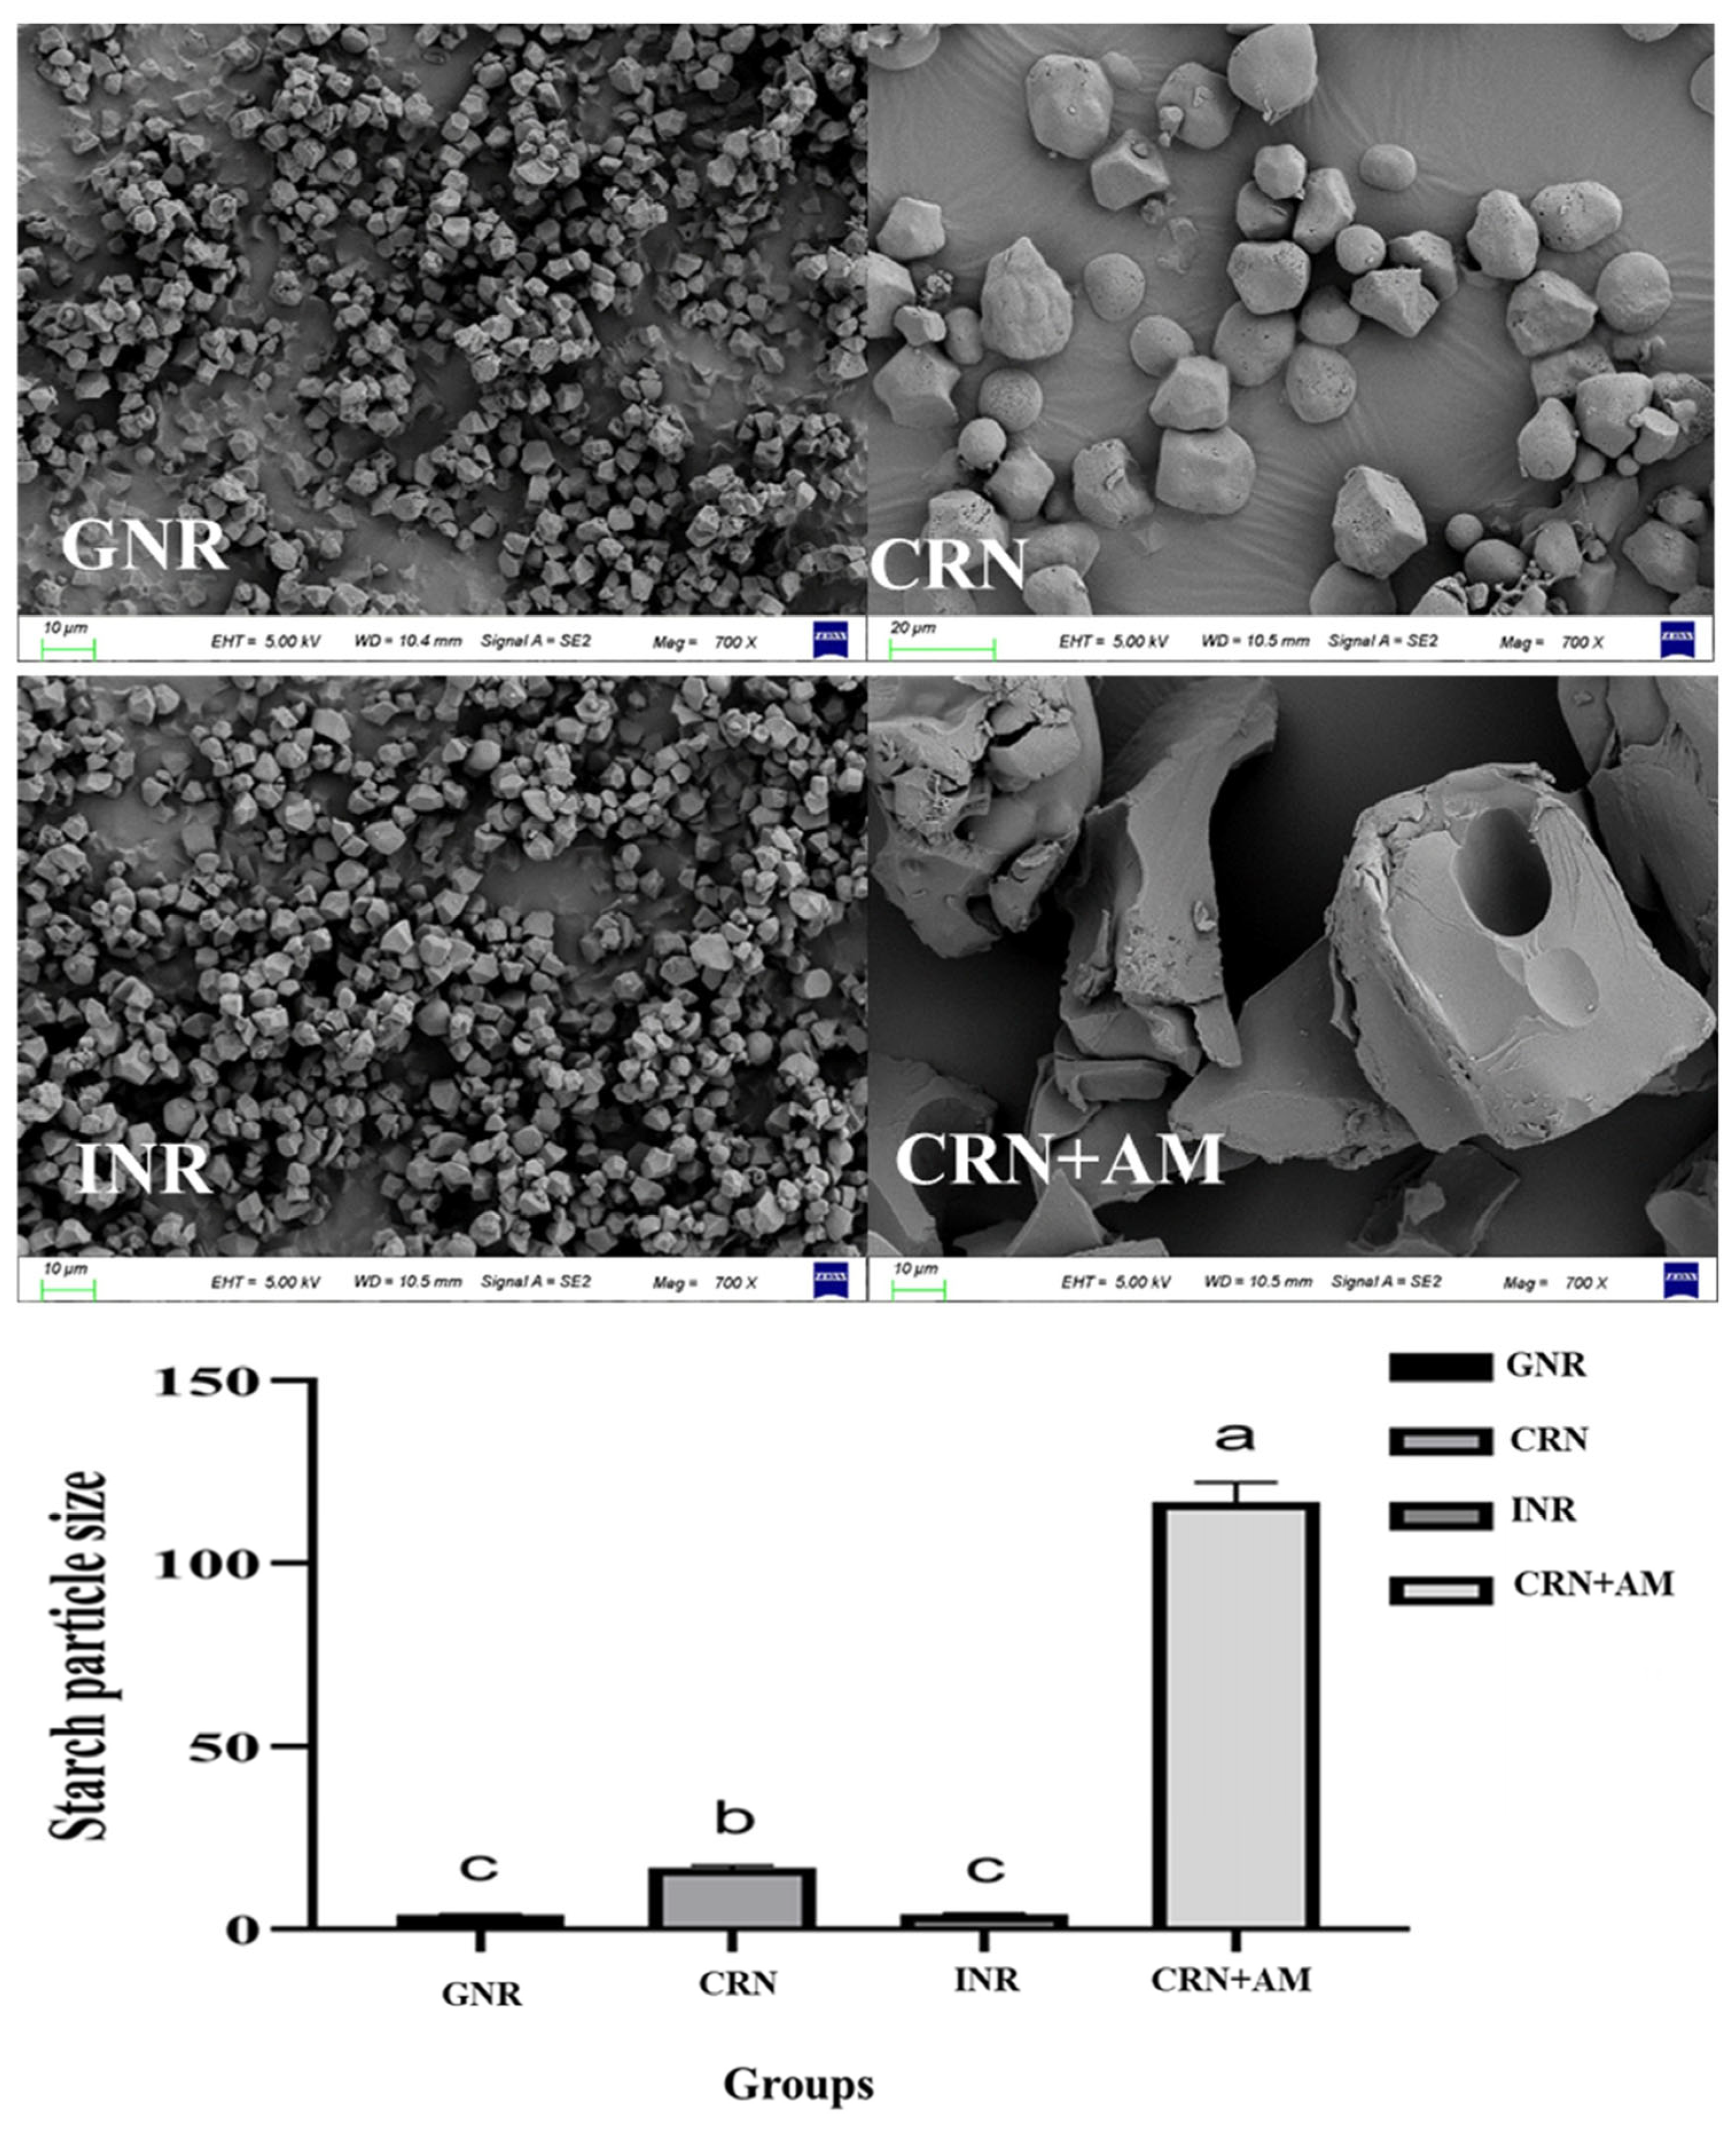
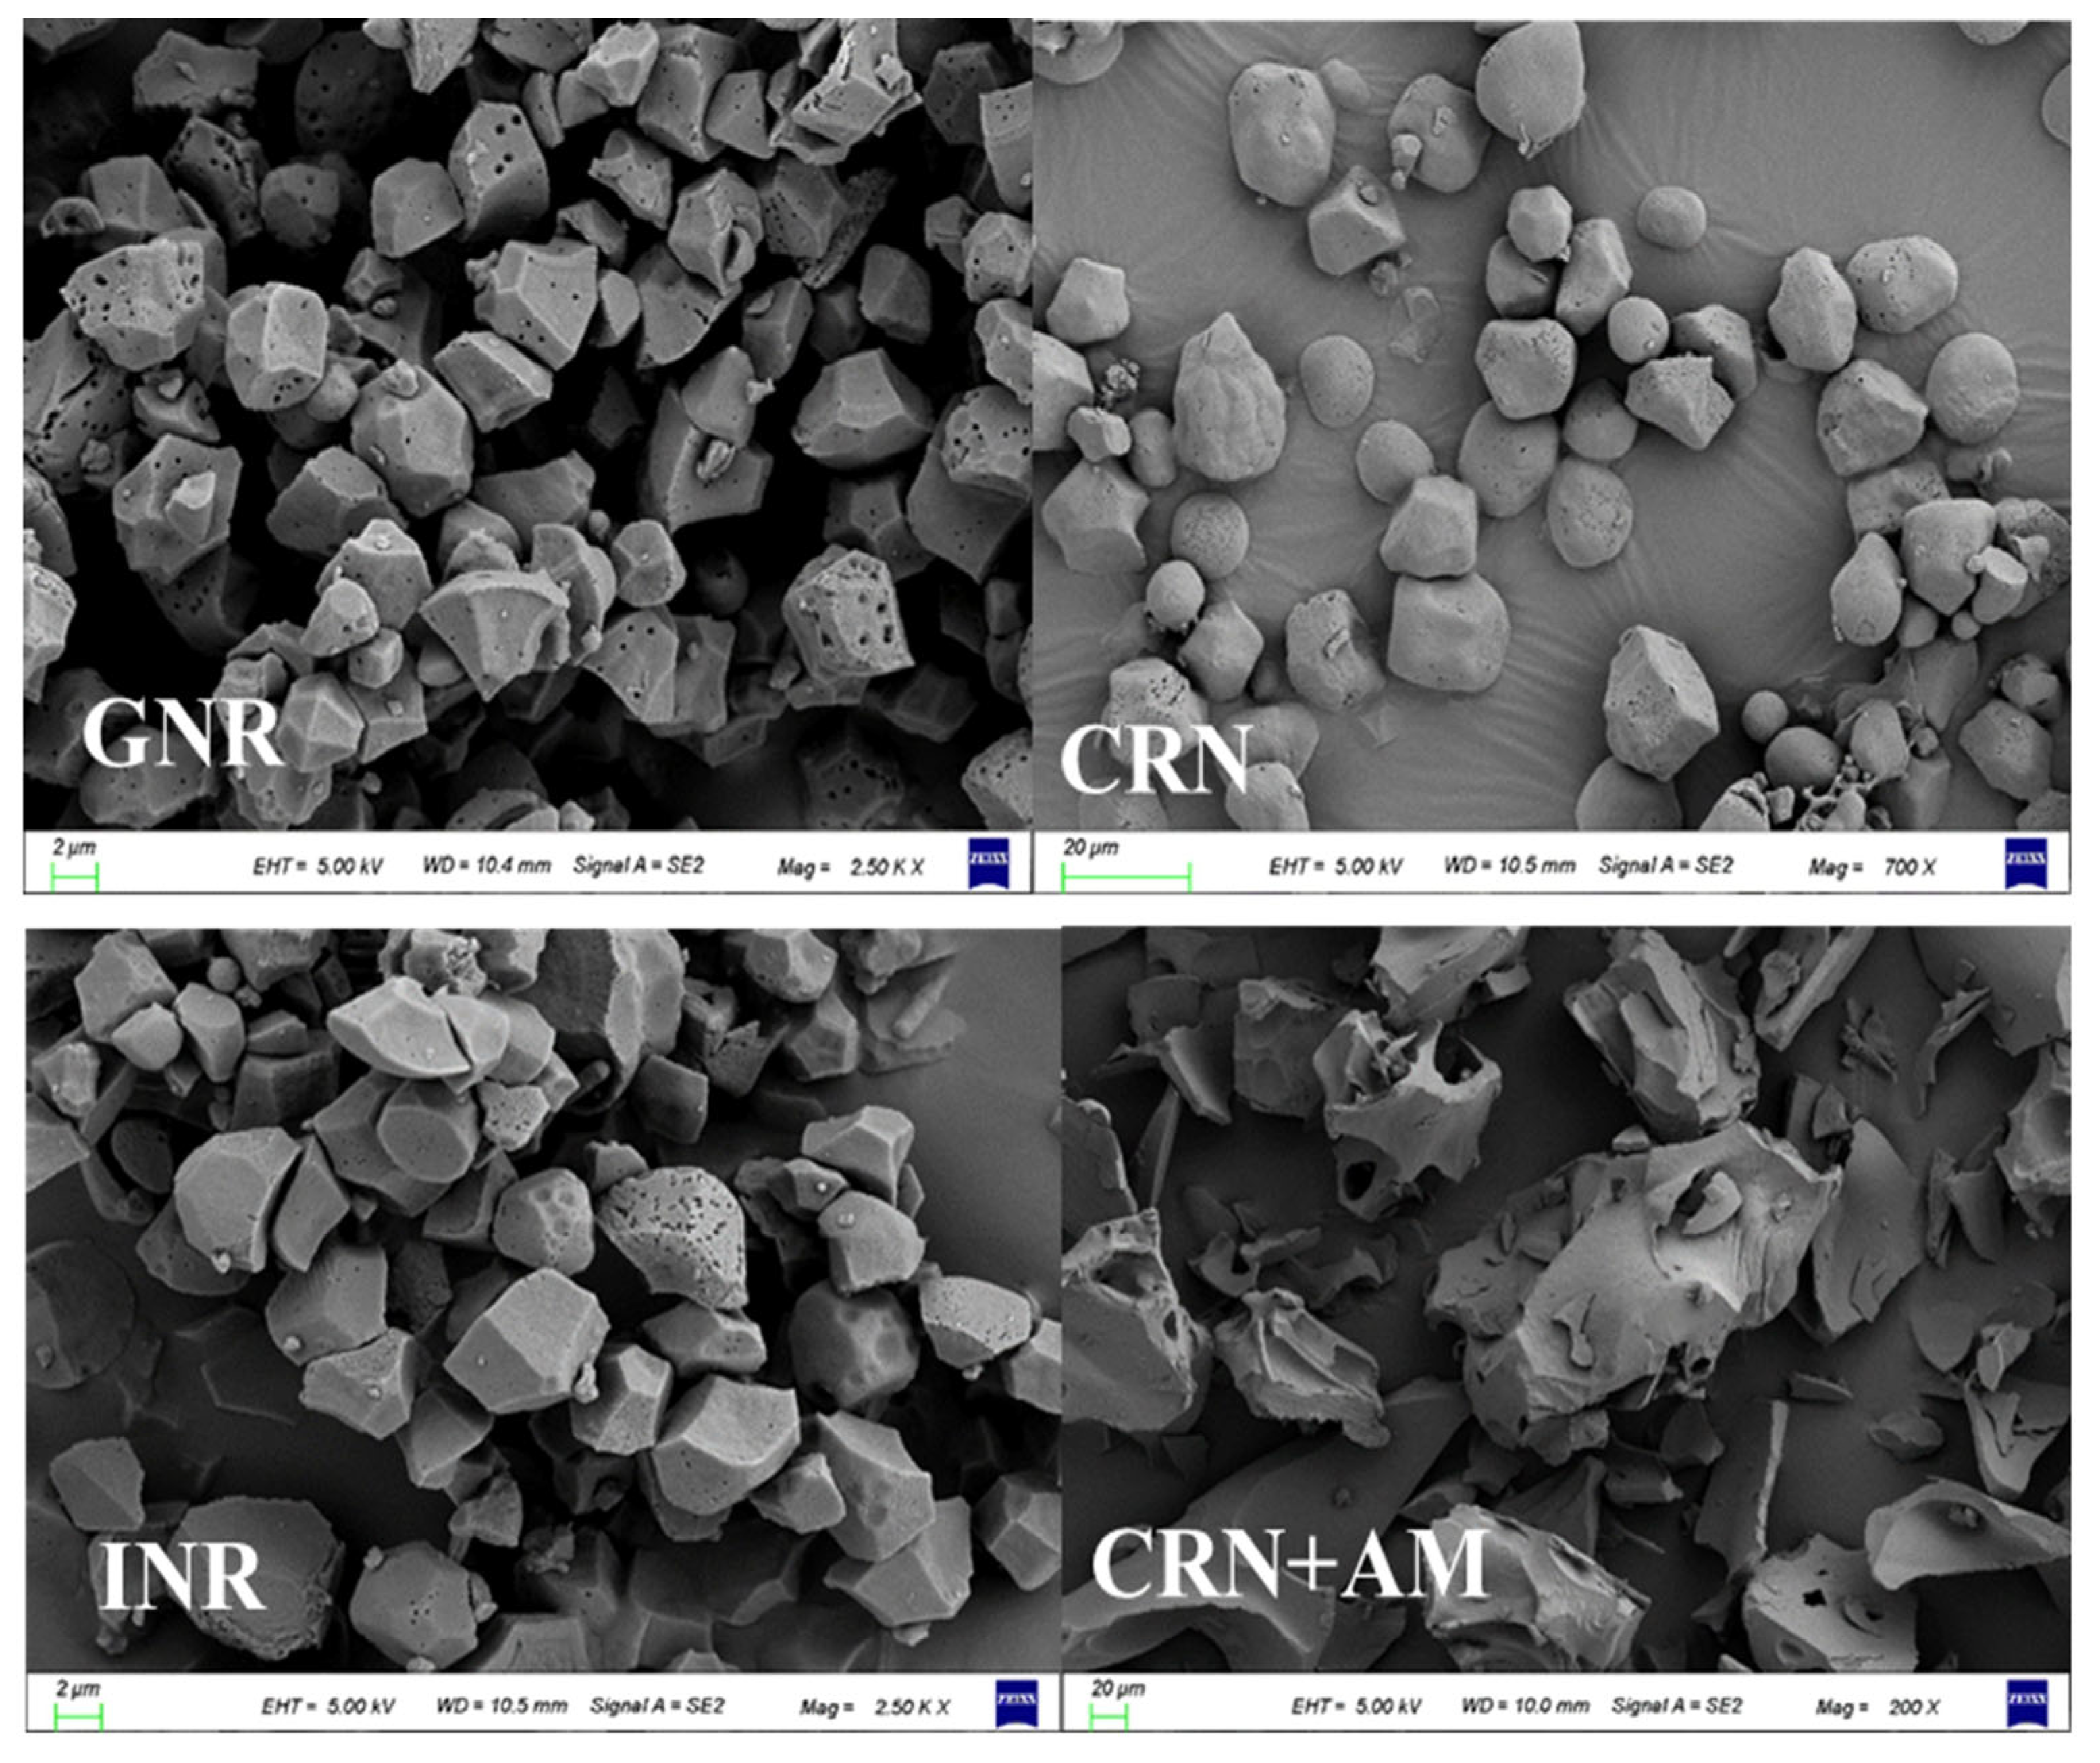
3.1. Starch Particle Size and Morphology

The results showed that the starch particle sizes differed among the dietary raw materials. The sizes of the starch grains from glutinous rice and indica rice were similar but smaller than the maize and high-amylose starch (p < 0.05). The maize starch particles were larger than those of the glutinous rice and indica rice but smaller than the high-amylose starch. The high-amylose starch particles were larger than the glutinous rice, indica rice, and maize starch particles, as shown in Figure 1. The grain morphology varied significantly as well. The glutinous rice starch grain was a porous polyhedron with an angular surface, the corn starch was an ellipsoid with a smooth surface, the indica rice starch was a polyhedron with a smooth and compact surface, and the high-amylose starch was an irregular polyhedron with a smooth surface (Figure 2).

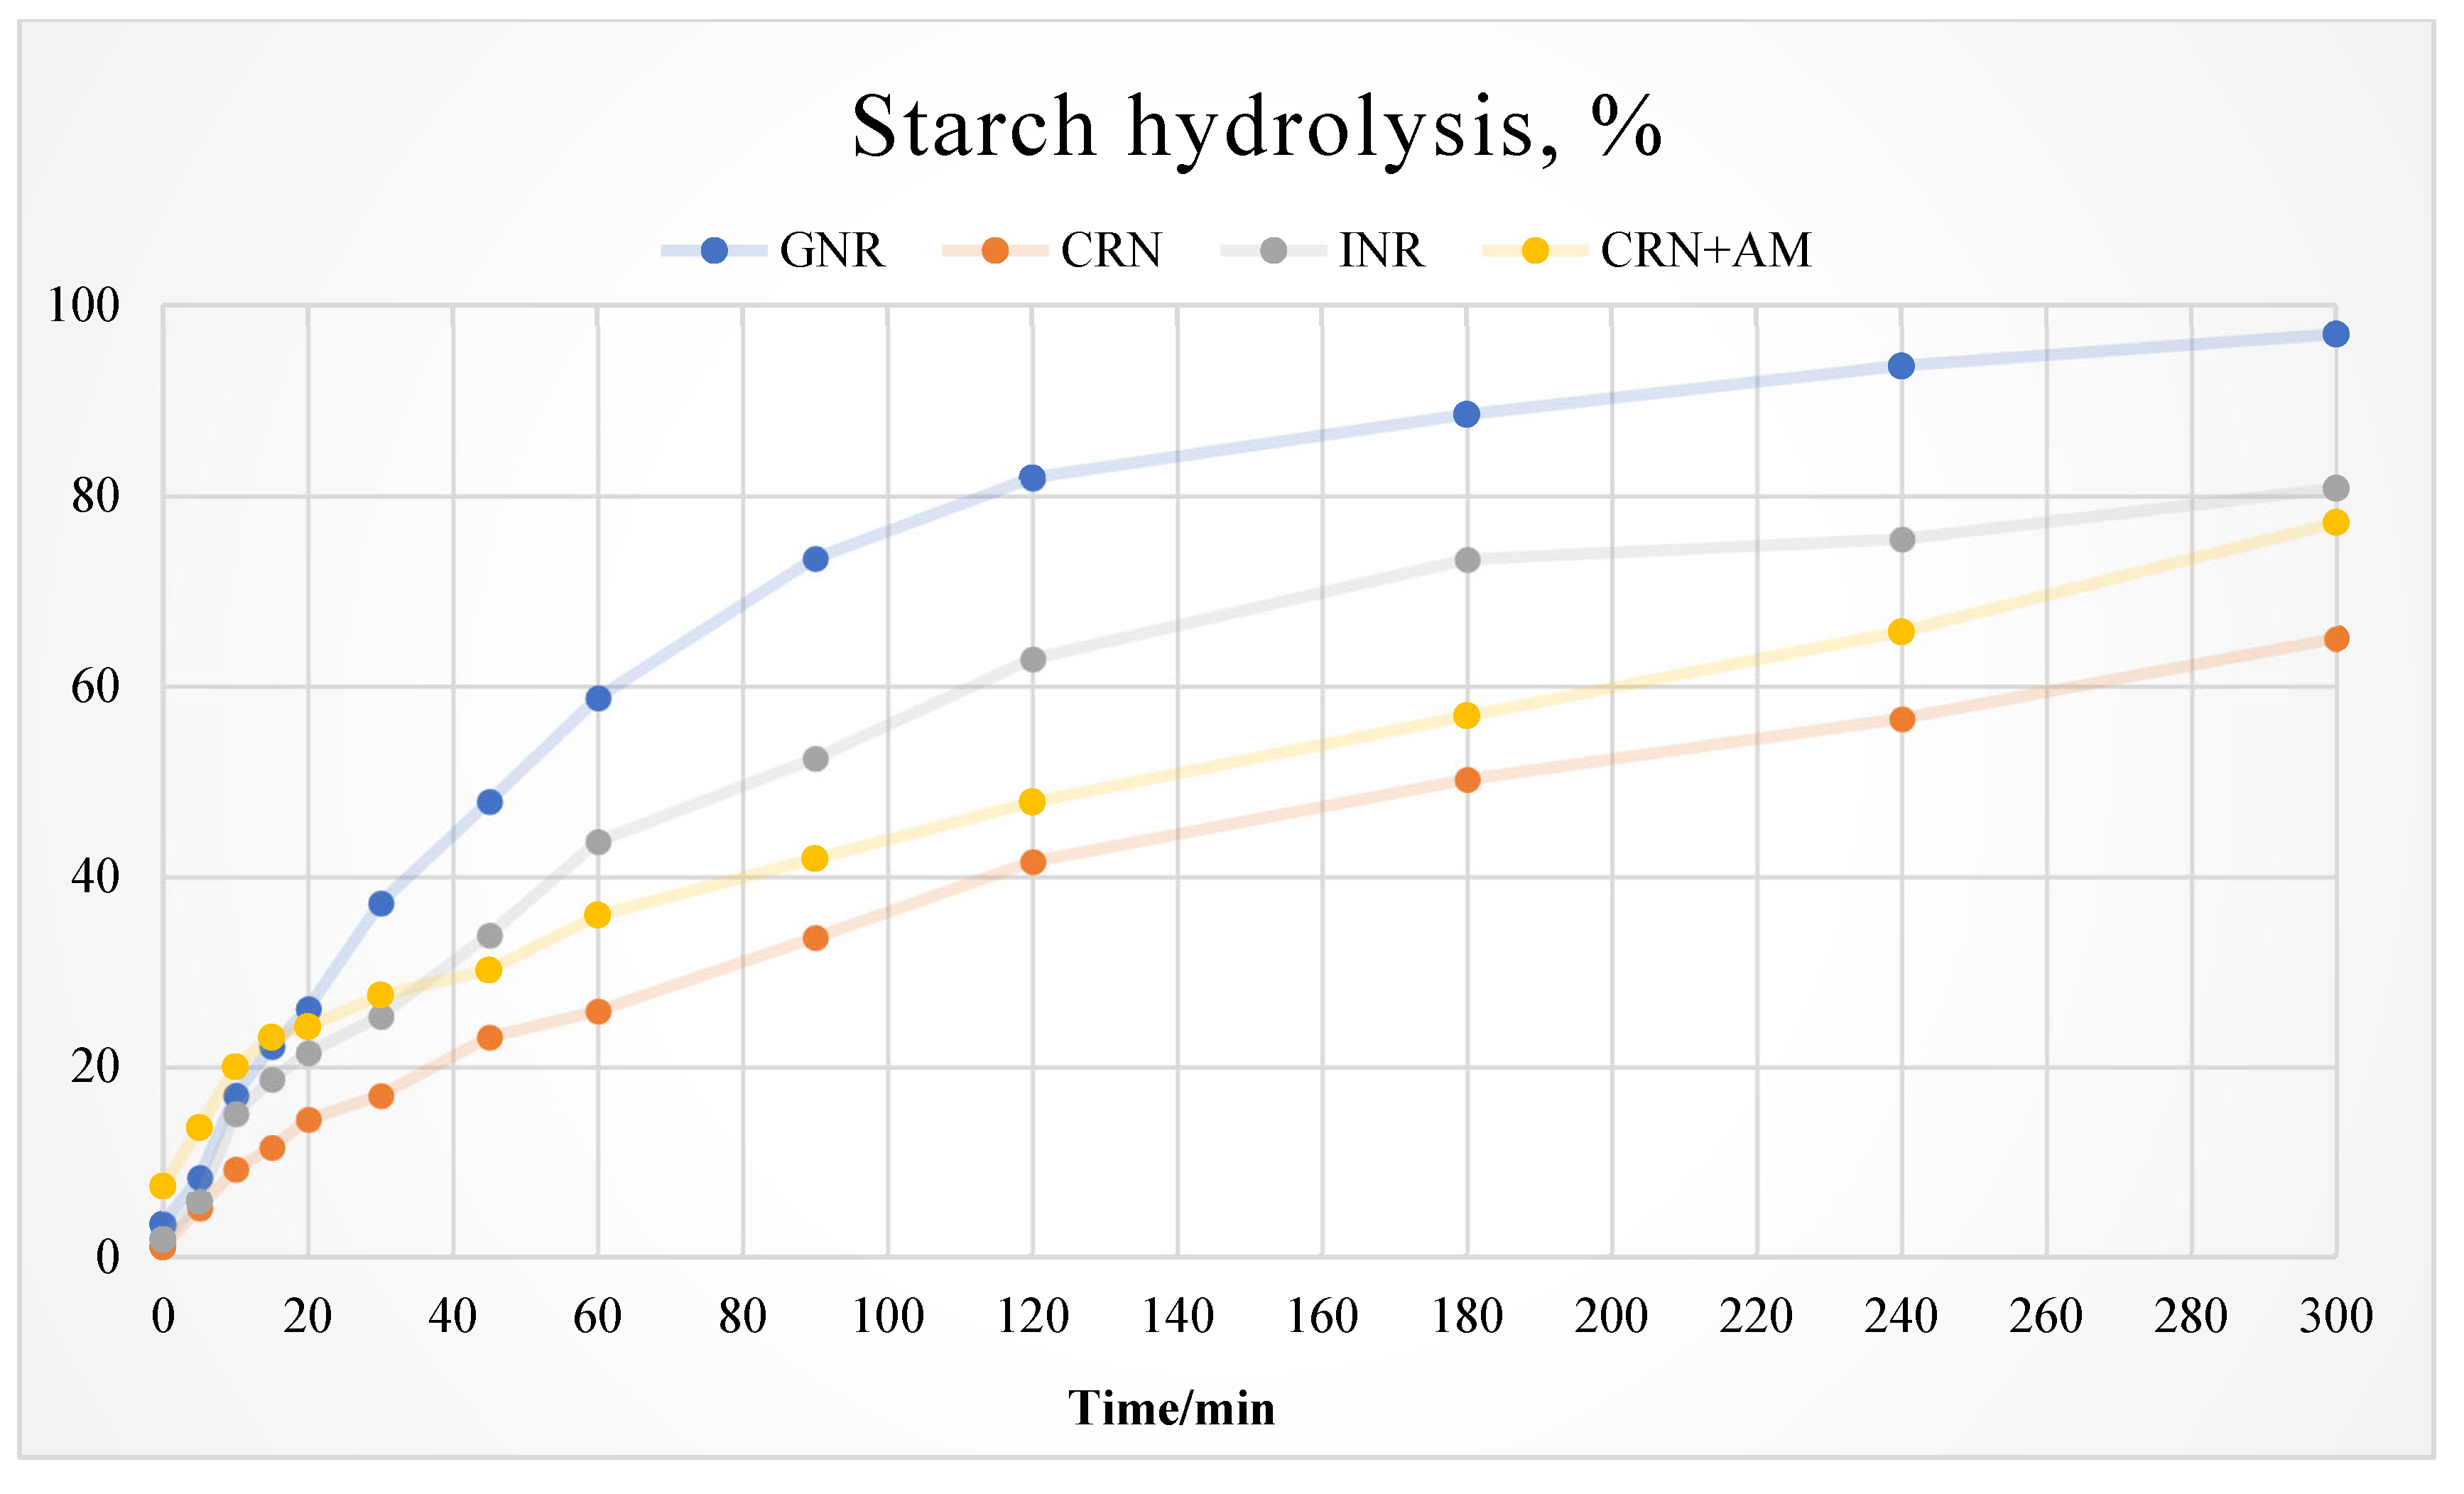
3.2. In Vitro Starch Digestion Rate

The experimental results showed that the rates of digestion of the different starch sources were significantly different. The digestibility of the starch in the glutinous feed grain was very high, with a significant variation rate. Digestibility was relatively stable for the indica- and corn-based diets, although the rate of digestion of the indica rice diet was higher than that of the corn and high amylose-based diets, as shown in Figure 3.

3.3. In Vivo Blood Glucose Monitoring

The time after feeding significantly affected the speed of blood glucose elevation (p < 0.05). The blood glucose concentration increased from fasting to 30 min after feeding and decreased from 30 min to 300 min after feeding. The most pronounced surge in blood glucose concentration occurred 15 to 30 min after feeding (Table 2).
The dietary starch source effectively influenced the postprandial blood glucose response rate across the measured time intervals. Specifically, the glutinous rice group exhibited a comparatively higher rate of blood glucose concentration than the other groups during the 15- to 30-min interval postprandially (p < 0.05). Subsequently, between 30 and 60 min post-feeding, blood glucose concentrations began to decline in the glutinous rice, corn, and indica rice groups, while the rate of increase decelerated in the high-amylose rice group (Table 3).

3.4. Growth Performance

Compared to the high amylose starch group, the geese that consumed the corn or indica rice diets achieved a significantly greater body weight (BW) by day 63 (p < 0.05). However, no significant differences in the feed-to-gain ratio (F/G) were observed across dietary treatments, as reported previously [14].

3.5. Nutrient Digestibility

The glutinous rice group exhibited superior total starch digestibility compared to the groups consuming other starch sources (p < 0.05) and significantly higher crude protein utilization than the corn and high-amylose rice groups. Crude fat utilization remained unaffected by the starch source (p > 0.05) (Table 4).

3.6. Amino Acid Availability

The effects of diets incorporating different starch sources on amino acid availability in goslings are presented in Table 5. Statistical analysis revealed significant differences (p < 0.05) in the availability of the following amino acids: aspartic acid (Asp), threonine (Thr), serine (Ser), glutamic acid (Glu), glycine (Gly), alanine (Ala), valine (Val), methionine (Met), isoleucine (Ile), leucine (Leu), tyrosine (Tyr), phenylalanine (Phe), proline (Pro), and lysine (Lys). Specifically, goslings fed the glutinous rice-based diet exhibited significantly higher availability of Asp, Ser, Glu, Gly, and Phe compared to those that received corn-based or high-amylose rice-based diets. Furthermore, Thr and Ala availability was significantly greater in the glutinous rice group than the indica rice- or high-amylose rice-based groups. Methionine availability was higher in the goslings that consumed the corn and glutinous rice-based diets relative to those that consumed the indica rice- or high-amylose rice-based diets. Lysine availability was elevated in the indica and glutinous rice groups compared to the corn and high-amylose rice groups. Finally, proline utilization was significantly higher in the corn-based diet group than in all other groups.

4. Discussion

There are significant variations in the starch contained in different grains. The results of this experiment showed significant differences in the particle size, shape, and structure of starch grains from different cereals (Figure 1 and Figure 2). The size of the starch grains and their structure are important factors affecting starch digestion. Studies have shown that the larger the starch granule, the smaller its relative surface area, which reduces the effective contact area between starch and amylase, thereby decreasing enzymatic decomposition efficiency [14,15]. These structural variations are fundamentally linked to starch composition: glutinous rice (>99% amylopectin) exhibits branched-chain clustering that creates porous architectures, while indica rice (15–25% amylose) forms dense crystalline regions through linear polymer packing [16]. The hydrolysis of starch affects glucose uptake in the intestine, driving blood glucose dynamics [17,18]; Figure 1 and Figure 2 and Table 3 verify this conclusion. The small starch particles of glutinous and indica rice correlate with the rapid glycemic responses observed following the consumption of these types of rice. Critically, despite their similar granule sizes, the higher glycemic index of glutinous rice stems from its amylopectin-dominated composition, which enables porous surface structures [19], facilitating amylase penetration. Conversely, the amylose-rich composition of indica rice promotes tight granule organization with minimal surface stomata [20], impeding enzymatic hydrolysis.
In the in vitro digestion tests (Figure 3), we observed that the starch hydrolysis rate for the glutinous rice diet was unstable, showing a rapid increase followed by a rapid decrease. The digestion rates of the indica, corn, and high amylose rice diets were more stable, with the indica diet exhibiting high, consistent digestibility. This aligns with the in vivo blood glucose results (Table 3). However, starch hydrolysis kinetics diverged between the in vitro and in vivo systems: in vivo, blood glucose spiked 0–30 min post-feeding, while in vitro hydrolysis remained low during this period. Hasjim et al. [21] attributed this difference to in vivo complexities (mastication, intestinal motility, and enzyme regulation). We further propose that the amylose–lipid complexes formed during in vivo digestion [20,22] delay glucose absorption—a process that is not replicated in vitro—while salivary amylase rapidly erodes amylopectin surfaces in glutinous rice, accelerating early-stage glycemic responses [23].
Blood glucose is a critical postprandial metabolic indicator [21]. The results in Table 2 show time-dependent blood glucose change rates in the goslings: a rapid increase (0–30 min) followed by a decline after 30 min. This suggests that glucose-lowering mechanisms (e.g., insulin secretion [23]) surpass the glucose-raising capacity post-30 min, while intestinal glucose generation from starch hydrolysis dominates earlier phases [21,22].
Starch-derived glucose and amino acids serve as energy sources in the primary digestive tract [24]. A timely glucose supply reduces amino acid oxidation, sparing protein. Our results (Table 4) showed that the glutinous rice diet resulted in higher total starch and crude protein utilization. This aligns with the amylopectin-driven properties of glutinous rice: its small granule size and porous structure enhance digestibility [25], while the rapid front-loaded release of glucose in the proximal intestine spares amino acids from oxidation. Paradoxically, this creates distal glucose deficits [26,27], necessitating amino acid catabolism for energy, explaining why goslings fed the glutinous rice diet exhibited lower cysteine, proline, histidine, and arginine (Table 5) utilization. These exceptions may arise for [28] the following reasons: cysteine is prioritized for protein synthesis over oxidation due to disulfide bond formation [29]; proline‘s unique mitochondrial catabolism less tightly coupled to glucose availability [30]; and histidine/arginine are reserved for signaling molecule synthesis (e.g., histamine, nitric oxide) [31,32,33].
Thus, while most amino acids benefited from rapid glucose flux, these functionally distinct AAs were conserved for non-energy roles. The amylose–amylopectin ratio emerges as a master regulator of nutrient partitioning: high-amylopectin starches (glutinous rice) maximize proximal glucose flux but risk distal amino acid oxidation, and high-amylose starches (indica/corn) enable sustained glucose release, balancing AA utilization but limiting peak protein synthesis potential.

5. Conclusions

This study showed that the particle size and structure of starch from different sources (glutinous rice, corn, indica rice, and high-amylose rice) vary. The smaller the starch particle size and the looser the structure, the faster the hydrolysis process. The glutinous rice diet contains more rapidly digestible starch, which is quickly digested in the proximal intestine, and the inadequate supply of glucose in the distal intestine enhances the oxidative energy supply from dietary amino acids in that region, thereby improving the apparent digestibility of both starch and crude protein. Therefore, corn and indica rice are more suitable starch sources for providing energy to geese. However, further studying the differences and complementarity of starch and protein in intestinal digestion and rational utilization can improve gosling diets.

Author Contributions

Z.Y. and C.X.: designed research and analyzed data; J.L. and C.X.: performed the research; H.Y. and X.X.: investigation, methodology; Z.Y., Z.W., and C.X.: wrote the manuscript. All authors have read and agreed to the published version of the manuscript.

Funding

This work was financially supported by the China Agriculture Research System (CARS-42-11), the National Natural Science Foundation of China (32202680), and the Blue Project of Yangzhou University.

Institutional Review Board Statement

The study was conducted according to the guidelines of the Declaration of Helsinki and approved by the Institutional Animal Care and Use Committee at Yangzhou University (approval number: SYXK [Su] 2021-0027; approval date: 26 February 2021).

Informed Consent Statement

Not applicable.

Data Availability Statement

The original contributions presented in this study are included in the article. Further inquiries can be directed to the corresponding author.

Conflicts of Interest

Jun Lin is an employee of Taizhou Fengda Agriculture and Animal Husbandry Technology Co., Ltd. The other authors have no conflicts of interests to declare.

References

  1. Punia, S. Barley Starch: Structure, Properties and in Vitro Digestibility—A Review. Int. J. Biol. Macromol. 2020, 155, 868–875. [Google Scholar] [CrossRef] [PubMed]
  2. Behall, K.M.; Hallfrisch, J. Plasma Glucose and Insulin Reduction after Consumption of Breads Varying in Amylose Content. Eur. J. Clin. Nutr. 2002, 56, 913–920. [Google Scholar] [CrossRef] [PubMed]
  3. Nadia, J.; Olenskyj, A.G.; Subramanian, P.; Hodgkinson, S.; Stroebinger, N.; Estevez, T.G.; Singh, R.P.; Singh, H.; Bornhorst, G.M. Influence of Food Macrostructure on the Kinetics of Acidification in the Pig Stomach after the Consumption of Rice- and Wheat-Based Foods: Implications for Starch Hydrolysis and Starch Emptying Rate. Food Chem. 2022, 394, 133410. [Google Scholar] [CrossRef] [PubMed]
  4. Yang, Z.; Zhang, Y.; Wu, Y.; Ouyang, J. Factors Influencing the Starch Digestibility of Starchy Foods: A Review. Food Chem. 2023, 406, 135009. [Google Scholar] [CrossRef]
  5. Nadia, J.; Bronlund, J.; Singh, R.P.; Singh, H.; Bornhorst, G.M. Structural Breakdown of Starch-Based Foods during Gastric Digestion and Its Link to Glycemic Response: In Vivo and in Vitro Considerations. Compr. Rev. Food Sci. Food Saf. 2021, 20, 2660–2698. [Google Scholar] [CrossRef]
  6. Qadir, N.; Wani, I.A. In-Vitro Digestibility of Rice Starch and Factors Regulating Its Digestion Process: A Review. Carbohydr. Polym. 2022, 291, 119600. [Google Scholar] [CrossRef]
  7. Hou, D.; Zhao, Q.; Yousaf, L.; Xue, Y.; Shen, Q. In Vitro Starch Digestibility and Estimated Glycemic Index of Mung Bean (Vigna radiata L.) as Affected by Endogenous Proteins and Lipids, and Exogenous Heat-Processing Methods. Plant Foods Hum. Nutr. 2020, 75, 547–552. [Google Scholar] [CrossRef]
  8. Chen, C.; Yin, Y.; Tu, Q.; Yang, H. Glucose and Amino Acid in Enterocyte: Absorption, Metabolism and Maturation. Front. Biosci.- Landmark 2018, 23, 1721–1739. [Google Scholar] [CrossRef]
  9. Pennisi, M.; Arfuso, F.; Giudice, E.; Giannetto, C.; Bruschetta, G.; Piccione, G.; Fiore, E. Saccharomyces Cerevisiae Diet Supplementation Influences Haematological Parameters in Healthy Steers. Large Anim. Rev. 2023, 29, 113–117. [Google Scholar]
  10. Van Den Borne, J.J.G.C.; Schrama, J.W.; Heetkamp, M.J.W.; Verstegen, M.W.A.; Gerrits, W.J.J. Synchronising the Availability of Amino Acids and Glucose Increases Protein Retention in Pigs. Animal 2007, 1, 666–674. [Google Scholar] [CrossRef]
  11. Englyst, H.N.; Kingman, S.M.; Cummings, J.H. Classification and Measurement of Nutritionally Important Starch Fractions. Eur. J. Clin. Nutr. 1992, 46, S33–S50. [Google Scholar] [PubMed]
  12. Yang, Z.; Xu, C.; Wang, W.; Xu, X.; Yang, H.M.; Wang, Z.Y.; Rose, S.P.; Pirgozliev, V. Dietary Amylose and Amylopectin Ratio Changes Starch Digestion and Intestinal Microbiota Diversity in Goslings. Br. Poult. Sci. 2022, 63, 691–700. [Google Scholar] [CrossRef] [PubMed]
  13. Yu, J.; Zhang, H.; Yang, H.M.; Wang, Z.Y. Effects of Dietary Paddy Rice on Growth Performance, Carcass Traits, Bare Skin Color, and Nutrient Digestibility in Geese. Poult. Sci. 2022, 101, 101865. [Google Scholar] [CrossRef] [PubMed]
  14. Xu, C.; Yang, Z.; Yang, Z.F.; He, X.X.; Zhang, C.Y.; Yang, H.M.; Rose, S.P.; Wang, Z.Y. Effects of Different Dietary Starch Sources on Growth and Glucose Metabolism of Geese. Poult. Sci. 2023, 102, 102362. [Google Scholar] [CrossRef]
  15. Liu, X.; Li, L.; Yu, J.; Copeland, L.; Wang, S.; Wang, S. In Vitro Digestibility of Starches with Different Crystalline Polymorphs at Low α-Amylase Activity to Substrate Ratio. Food Chem. 2021, 349, 129170. [Google Scholar] [CrossRef]
  16. Oh, J.H.; Chung, J.O.; Lee, C.Y.; Yun, Y.; Park, M.Y.; Hong, Y.D.; Kim, W.G.; Cha, H.Y.; Shin, K.S.; Hong, G.P.; et al. Characterized Polysaccharides from Green Tea Inhibited Starch Hydrolysis and Glucose Intestinal Uptake by Inducing Microstructural Changes of Wheat Starch. J. Agric. Food Chem. 2021, 69, 14075–14085. [Google Scholar] [CrossRef]
  17. Lee, Y.E.; Yoo, S.H.; Chung, J.O.; Park, M.Y.; Hong, Y.D.; Park, S.H.; Park, T.S.; Shim, S.M. Hypoglycemic Effect of Soluble Polysaccharide and Catechins from Green Tea on Inhibiting Intestinal Transport of Glucose. J. Sci. Food Agric. 2020, 100, 3979–3986. [Google Scholar] [CrossRef]
  18. Guo, L.; Zhang, J.; Hu, J.; Li, X.; Du, X. Susceptibility of Glutinous Rice Starch to Digestive Enzymes. Carbohydr. Polym. 2015, 128, 154–162. [Google Scholar] [CrossRef]
  19. Zhou, Y.; Meng, S.; Chen, D.; Zhu, X.; Yuan, H. Structure Characterization and Hypoglycemic Effects of Dual Modified Resistant Starch from Indica Rice Starch. Carbohydr. Polym. 2014, 103, 81–86. [Google Scholar] [CrossRef]
  20. Tatsumi, H.; Katano, H.; Ikeda, T. Kinetic Analysis of Glucoamylase-Catalyzed Hydrolysis of Starch Granules from Various Botanical Sources. Biosci. Biotechnol. Biochem. 2007, 71, 946–950. [Google Scholar] [CrossRef]
  21. Hasjim, J.; Lavau, G.C.; Gidley, M.J.; Gilbert, R.G. In Vivo and in Vitro Starch Digestion: Are Current in Vitro Techniques Adequate? Biomacromolecules 2010, 11, 3600–3608. [Google Scholar] [CrossRef] [PubMed]
  22. Lee, B.H.; Eskandari, R.; Jones, K.; Reddy, K.R.; Quezada-Calvillo, R.; Nichols, B.L.; Rose, D.R.; Hamaker, B.R.; Pinto, B.M. Modulation of Starch Digestion for Slow Glucose Release through “Toggling” of Activities of Mucosal α-Glucosidases. J. Biol. Chem. 2012, 287, 31929–31938. [Google Scholar] [CrossRef] [PubMed]
  23. He, W.; Wu, G. Oxidation of Amino Acids, Glucose, and Fatty Acids as Metabolic Fuels in Enterocytes of Developing Pigs. Amino Acids 2022, 54, 1025–1039. [Google Scholar] [CrossRef] [PubMed]
  24. He, W.; Furukawa, K.; Bailey, C.A.; Wu, G. Oxidation of Amino Acids, Glucose, and Fatty Acids as Metabolic Fuels in Enterocytes of Post-Hatching Developing Chickens. J. Anim. Sci. 2022, 100, skac053. [Google Scholar] [CrossRef]
  25. Tu, J.; Chen, Q.; Zhou, J.; Fan, Y.; Li, Y.; Ma, Y.; Zeng, X.; Qiao, S.; Cai, S. Characteristics of Amino Acid and Glucose Digestion and Metabolism in Energy and Protein Feedstuffs for Pigs. Animals 2025, 15, 1510. [Google Scholar] [CrossRef]
  26. Baslam, M.; Mitsui, T.; Sueyoshi, K.; Ohyama, T. Recent Advances in Carbon and Nitrogen Metabolism in C3 Plants. Int. J. Mol. Sci. 2021, 22, 318. [Google Scholar] [CrossRef]
  27. Weurding, R.E.; Enting, H.; Verstegen, M.W.A. The Effect of Site of Starch Digestion on Performance of Broiler Chickens. Anim. Feed Sci. Technol. 2003, 110, 175–184. [Google Scholar] [CrossRef]
  28. Lv, X.; Zhou, C.; Ran, T.; Jiao, J.; Liu, Y.; Tan, Z.; Tang, S.; Kang, J.; Xie, J.; Chen, L.; et al. Dietary Amylose:Amylopectin Ratio Influences the Expression of Amino Acid Transporters and Enzyme Activities for Amino Acid Metabolism in the Gastrointestinal Tract of Goats. Br. J. Nutr. 2022, 127, 1121–1131. [Google Scholar] [CrossRef]
  29. Zhu, J.; Schwörer, S.; Berisa, M.; Kyung, Y.J.; Ryu, K.W.; Yi, J.; Jiang, X.; Cross, J.R.; Thompson, C.B. Mitochondrial NADP(H) Generation Is Essential for Proline Biosynthesis. Science 2021, 372, 968–972. [Google Scholar] [CrossRef]
  30. Phang, J.M.; Liu, W.; Hancock, C.; Christian, K.J. The Proline Regulatory Axis and Cancer. Front. Oncol. 2012, 2, 60. [Google Scholar] [CrossRef]
  31. Silao, F.G.S.; Ward, M.; Ryman, K.; Wallström, A.; Brindefalk, B.; Udekwu, K.; Ljungdahl, P.O. Mitochondrial Proline Catabolism Activates Ras1/CAMP/PKA-Induced Filamentation in Candida Albicans. PLoS Genet. 2019, 15, e1007976. [Google Scholar] [CrossRef] [PubMed]
  32. Matsui, T.; Ichikawa, H.; Fujita, T.; Takemura, S.; Takagi, T.; Osada-Oka, M.; Minamiyama, Y. Histidine and Arginine Modulate Intestinal Cell Restitution via Transforming Growth Factor-Β1. Eur. J. Pharmacol. 2019, 850, 35–42. [Google Scholar] [CrossRef] [PubMed]
  33. Xie, L.; Liu, R.; Chen, X.; He, M.; Zhang, Y.; Chen, S. Micelles Based on Lysine, Histidine, or Arginine: Designing Structures for Enhanced Drug Delivery. Front. Bioeng. Biotechnol. 2021, 9, 744657. [Google Scholar] [CrossRef] [PubMed]
Figure 1. SEM showing starch particle sizes from different dietary source 1,2. 1 Different lowercase letters indicate significant differences among groups (p < 0.05). 2 GNR (glutinous rice; high amylopectin, negligible amylose), CRN (corn), INR (indica rice; high amylose), and CRN + AM (amylose-supplemented). Values represent the mean diameter in micrometers (μm).
Vetsci 12 00630 g001
Figure 2. SEM of morphological structure of starch granules from different dietary source 1. 1 GNR (glutinous rice; high amylopectin, negligible amylose), CRN (corn), INR (indica rice; high amylose), and CRN + AM (amylose-supplemented).
Vetsci 12 00630 g002
Figure 3. Starch digestion patterns of diets with different starch sources 1. 1 GNR (glutinous rice; high amylopectin, negligible amylose), CRN (corn), INR (indica rice; high amylose), and CRN + AM (amylose-supplemented).
Vetsci 12 00630 g003
Table 1. Energy and nutrient composition (dry basis).
Items 1Groups
GNRCRNINRCRN + AM
Ingredients, %
Corn-57.60-49.40
Indica rice--53.75-
Glutinous rice51.00---
Amylose---6.00
Soybean meal23.2024.2023.4525.00
Rice husk9.609.5010.109.30
Bran12.454.909.056.40
Stone powder1.101.100.901.20
Calcium hydrogen1.201.101.301.10
Salt0.300.300.300.30
Lysine-0.10-0.10
DL-methionine0.150.200.150.20
Premix 21.001.001.001.00
Total100.00100.00100.00100.00
Nutritional level 3
Energy (ME, MJ/kg)10.8610.8210.8010.80
Crude protein (%)15.9316.1816.0116.14
Crude fiber (%)6.866.876.836.80
Lysine (%)0.910.910.900.92
Methionine (%)0.410.430.420.43
Total phosphorus (%)0.610.590.600.61
Calcium (%)0.850.820.830.86
Total starch (%)37.9238.8439.7738.16
Amylose/Amylopectin ratio0.0210.3400.4560.568
1 GNR (glutinous rice; high amylopectin, negligible amylose), CRN (corn), INR (indica rice; high amylose), and CRN + AM (amylose-supplemented). 2 The vitamin–mineral premix, supplied at 1 kg per diet tonne, contained Vitamin A (9,000,000 IU), Vitamin D (300,000 IU), Vitamin E (1800 IU), Vitamin K (150 mg), Vitamin B1 (90 mg), Vitamin B2 (800 mg), Vitamin B6 (320 mg), Vitamin B12 (1.2 mg), nicotinic acid (4.5 g), pantothenic acid (1100 mg), folic acid (65 mg), biotin (5 mg), Fe (6 g as ferrous sulfate), Cu (1 g as copper sulfate), Mn (9.5 g as manganese sulfate), Zn (9 g as zinc sulfate), I (50 mg as potassium iodide), and Se (30 mg as sodium selenite). 3 The values reported for crude protein, calcium, total phosphorus, and total starch were determined analytically; all other compositional values are calculated estimates based on the formulated diet composition.
Table 2. Effects of diets with different starch sources and time after feeding on rate of blood glucose increase in goslings 1.
ItemBlood Glucose Increase Rate, mmol/L/min
Time, min
s~15 20.123 a
15~300.052 b
30~60−0.009 c
60~120−0.023 c
120~180−0.023 c
180~240−0.007 c
240~300−0.011 c
SEM0.005
Starch source
Glutinous rice diet0.020
Corn diet0.017
Indica rice diet0.015
High-amylose diet0.017
SEM0.005
p-value
Time<0.001
Linear<0.001
Quadratic<0.001
Starch source0.988
Time × Starch source<0.001
a,b,c Within each row, statistically distinct values (p < 0.05) are marked with differing lowercase superscript letters, while statistically similar values (p > 0.05) share identical superscript letters. 1 All data points represent mean values from six replicate measurements. The dash symbol (−) denotes a measured decrease. 2 “S~15” means from start of feeding to 15 min after feeding.
Table 3. Interactive effects of starch source and time after feeding on rate of blood glucose in goslings 1,2,3.
Time, minGroups, mmol/L/minSEMp-Value
GNRCRNINRCRN + AM
s~15 40.194 a0.089 b0.112 b0.098 b0.011<0.001
15~300.072 a0.050 b0.044 b0.042 b0.0040.013
30~60−0.038 c0.000 ab−0.010 b0.012 a0.005<0.001
60~120−0.034−0.018−0.016−0.0220.0060.759
120~180−0.0120.010−0.008−0.0160.0040.256
180~240−0.006−0.014−0.0100.0020.0050.714
240~300−0.012−0.020−0.006−0.0060.0050.691
1 GNR (glutinous rice; high amylopectin, negligible amylose), CRN (corn), INR (indica rice; high amylose), and CRN + AM (amylose-supplemented). 2 Within each row, statistically distinct values (p < 0.05) are marked with differing lowercase superscript letters, while statistically similar values (p > 0.05) share identical superscript letters. 3 All data points represent mean values from six replicate measurements. The dash symbol (−) denotes a measured decrease. 4 “S~15” means from the start of feeding to 15 min after feeding.
Table 4. Apparent nutrient digestibility in goslings fed diets with varying starch sources 1,2,3.
Item, %GroupsSEMp-Value
GNRCRNINRCRN + AM
Total starch92.24 a89.94 b90.01 b89.30 b0.3240.002
Crude protein87.64 a81.32 b85.30 ab81.44 b0.8820.015
Crude fat81.7683.4380.7383.230.8740.776
1 GNR (glutinous rice; high amylopectin, negligible amylose), CRN (corn), INR (indica rice; high amylose), and CRN + AM (amylose-supplemented). 2 Within each row, statistically distinct values (p < 0.05) are marked with differing lowercase superscript letters, while statistically similar values (p > 0.05) share identical superscript letters. 3 All data points represent mean values from six replicate measurements.
Table 5. Gosling amino acid digestibility responses to various starch diets 1,2,3.
Item, %GroupsSEMp-Value
GNRCRNINRCRN + AM
Asp91.79 a87.12 b89.66 ab87.69 b0.5650.004
Thr88.78 a86.12 ab85.77 b82.63 c0.6470.002
Ser91.82 a87.54 c90.10 ab88.12 bc0.5130.003
Glu93.66 a91.40 b92.27 ab90.99 b0.3540.024
Gly86.35 a80.08 bc83.21 ab75.88 c1.1370.001
Ala86.42 a84.93 ab81.94 b81.79 b0.6490.011
Cys75.1981.3867.9977.442.1170.146
Val88.01 a83.73 b83.96 b81.29 b0.7420.004
Met95.50 a94.75 a84.34 b84.54 b1.263<0.001
Ile91.61 a85.79 b87.28 b85.01 b0.7470.001
Leu90.97 a89.36 ab89.24 ab87.11 b0.4720.022
Tyr91.45 a89.34 a89.01 a80.22 b1.077<0.001
Phe92.30 a86.62 c90.13 ab88.22 bc0.6160.001
Lys90.76 a86.45 b89.81 a86.91 b0.5810.006
His96.7395.7694.8893.670.5010.163
Arg95.3892.4693.2595.200.5200.113
Pro86.17 b90.53 a81.24 c86.03 b0.9700.002
1 GNR (glutinous rice; high amylopectin, negligible amylose), CRN (corn), INR (indica rice; high amylose), and CRN + AM (amylose-supplemented). 2 Within each row, statistically distinct values (p < 0.05) are marked with differing lowercase superscript letters, while statistically similar values (p > 0.05) share identical superscript letters. 3 All data points represent mean values from six replicate measurements. Asp: aspartic; Thr: threonine; Ser: serine; Glu: glutamic; Gly: glycine; Ala: alanine; Cys: cysteine; Val: valine; Met: methionine; Ile: isoleucine; Leu: leucine; Tyr: tyrosine; Phe: phenylalanine; Lys: lysine; His: histidine; Arg: arginine; Pro: proline.
Disclaimer/Publisher’s Note: The statements, opinions and data contained in all publications are solely those of the individual author(s) and contributor(s) and not of MDPI and/or the editor(s). MDPI and/or the editor(s) disclaim responsibility for any injury to people or property resulting from any ideas, methods, instructions or products referred to in the content.

