Article

Quantifying Webpage Performance: A Comparative Analysis of TCP/IP and QUIC Communication Protocols for Improved Efficiency

by
Thyago Celso Cavalcante Nepomuceno
1,2,*,
Késsia Thais Cavalcanti Nepomuceno
3,
Fabiano Carlos da Silva
3 and
Silas Garrido Teixeira de Carvalho Santos
3
1
Department of Statistics, Federal University of Pernambuco, Av. Prof. Moraes Rego, 1235—Cidade Universitária, Recife 50670-902, Brazil
2
Department of Computer, Control, and Management Engineering Antonio Ruberti, Sapienza University of Rome, Piazzale Aldo Moro, 5, 00185 Roma, Italy
3
Center of Informatics, Federal University of Pernambuco, Av. Prof. Moraes Rego, 1235—Cidade Universitária, Recife 50670-902, Brazil
*
Author to whom correspondence should be addressed.
Data 2023, 8(8), 134; https://doi.org/10.3390/data8080134
Submission received: 22 July 2023 / Revised: 12 August 2023 / Accepted: 15 August 2023 / Published: 19 August 2023

Abstract

:
Browsing is a prevalent activity on the World Wide Web, and users usually demonstrate significant expectations for expeditious information retrieval and seamless transactions. This article presents a comprehensive performance evaluation of the most frequently accessed webpages in recent years using Data Envelopment Analysis (DEA) adapted to the context (inverse DEA), comparing their performance under two distinct communication protocols: TCP/IP and QUIC. To assess performance disparities, parametric and non-parametric hypothesis tests are employed to investigate the appropriateness of each website’s communication protocols. We provide data on the inputs, outputs, and efficiency scores for 82 out of the world’s top 100 most-accessed websites, describing how experiments and analyses were conducted. The evaluation yields quantitative metrics pertaining to the technical efficiency of the websites and efficient benchmarks for best practices. Nine websites are considered efficient from the point of view of at least one of the communication protocols. Considering TCP/IP, about 80.5% of all units (66 webpages) need to reduce more than 50% of their page load time to be competitive, while this number is 28.05% (23 webpages), considering QUIC communication protocol. In addition, results suggest that TCP/IP protocol has an unfavorable effect on the overall distribution of inefficiencies.

1. Introduction

The Internet is essential for keeping people and companies working every day, and it takes most of our cycle time and existing social and cultural habits. It is estimated that over half of the world’s population is using the Internet, increasing to over 69 percent among youth [1]. The perspective is that this number increases over time. The most common activity on the Internet is website navigation, which allows users to experience services, site features and retrieve different business information. Keeping the entire internet infrastructure with this expressive user number requires dynamic communication protocols and other fundamental technologies for internet operations.
Efficient webpages are essential because they directly impact the user experience, leading e-commerce companies to lose potential customers when they are unsatisfactory. Furthermore, the increasing number of users and data continuously leads the scientific community, companies, and researchers to investigate existing resources’ performance on webpages, creating new technologies to meet the high demand and the increasing numbers of users. Communication protocols such as the TCP/IP and Quick UDP Internet Connections (QUIC) are essential for transmitting data and information following predefined rules. Although TCP/IP is still widely used worldwide, QUIC was adopted as an official internet standard protocol, which is expected to become more popular.
One of the main differences between TCP/IP and QUIC is that TCP/IP is a connection-oriented protocol that requires a three-way handshake to establish a connection between the client and server, while QUIC is designed to reduce the connection establishment latency by using a modified handshake mechanism that combines connection establishment and encryption setup into a single step. Another important feature of QUIC compared to TCP/IP is the capability for multiplexing, allowing multiple data streams to be transmitted over a single connection simultaneously. Depending on the built network, companies might guarantee a strategic advantage by meeting high peaks during specific seasons using different communication protocols.
The time required to load a page, i.e., Page Load Time (PLT), is one of the most critical metrics affecting the final user experience and satisfaction. The page load time influences the time a user will remain on the website. Users frustrated with low page load time tend to resent and not reaccess it, and websites with longer delays are considered less attractive and more difficult to find [2]. According to a recent survey by the Aberdeen Group [3], it takes only 3 s delay for about 21% of desktop web customers and about 20% of mobile web customers to leave websites, resulting in potential lost revenues. Page load time also influences the recommendation of users about the website.
Faster websites create satisfied users, and improving site speed also reduces operating costs, as recognized by Google, which uses the PLT in its algorithm for web searching ranking [4], directing the users to websites with a lower load time. The importance of page load time on the Internet tends to increase more due to the massive amount of data being processed as page size and objects over time. This work evaluates the efficiency of the world’s most-accessed webpages in recent years based on an inverse perspective of Data Envelopment Analysis (DEA) frontier estimation. The DEA is a linear programming technique that does not require the predefining of a functional form (i.e., they are non-parametric by nature) designed by Charnes, Cooper, and Rhodes [5] in 1978 for multiple output/input configurations.
The DEA methodology for measuring the technical efficiency of decision units has increased exponentially in the number of methodological contributions, empirical applications, and computational development over the years [6,7,8]. Data Envelopment Analysis estimates a non-parametric efficiency frontier based on the determination of production possibilities in which Decision-Maker Units (DMUSs) are compared to each other in order to evaluate each decision unit efficiency as a ratio between the used resources and obtained results, which may contain the influence of exogenous factors [8,9]. The inverse perspective for the DEA frontier estimation considers outputs to be reduced (as bad outputs) and inputs to be increased proportionally.
Evaluating network communications and webpage ranking is an important subject [10,11,12,13]. Many DEA applications and evaluations of efficiency have settled on energy sectors [14,15,16], services [17,18], communications [19,20,21], and retail logistics and e-commerce domains [22]. The evaluation of websites, pages, and web services has been a point of interest in the literature with applications that support the construction of evaluation systems based on Alexa Rankings and users experience, reduction of page load time, and impact in terms of objects, images, and servers [23,24]. Meanwhile, to the best of our knowledge, despite the evident relevance, websites lack non-parametric efficiency assessments. Two instances of the use of DEA on webpages can be consulted in evaluating Jordan University webpages based on the perspectives of usability, design, and performance [25] and the operational efficiency of pages for e-commerce with a focus on service quality [26].
This work aims to measure the technical efficiency of websites by the ratio of website resources to page load time. This methodology is explained in Section 2.2. According to technical efficiency measures (the ratio of used resources to the produced results), the evaluation ranks webpages under two important communication protocols: TCP/IP and QUIC. Both are the options currently used by available web browsers. The page size and number of objects are considered as production inputs (website resources) used to pro- duce the output Page Load Time (PLT). The bigger the page size or the number of objects (inputs), the longer the webpage’s loading (output). Because we assume there are no additional costs by including more objects or increasing the page size, and the page load time is considered a bad output, DEA is applied in an inverse frontier perspective: efficient pages are those with the lowest PLT proportional to the number of objects and size. The inefficient pages aim for efficient ones for performance benchmarks. The results report the best-performing pages and quantitative potential for improvements to reach the efficient frontier.
The paper is organized as follows: the next section describes the theoretical methodology of the Data Envelopment Analysis adjusted to the context and the methodology used in conducting the experiments, that is, the evaluation scenario, the tools used, and how the experiments were performed. Section 3 presents and discusses the website’s efficiency results and differences from both communication protocol’s perspectives. The last section concludes by summarizing remarks and suggestions for future works.

2. Materials and Methods

The collection and analysis of experimental data were conducted based on a methodology composed of four main activities: (a) measurement planning, defining how and which metrics will be used; (b) measurements in a controlled environment, evaluating the configuration and operation of webpages; (c) Data Envelopment Analysis application and statistical treatments; and (d) discussion of the results. The adapted DEA methodology, the configuration of the experiments, metrics, and factors are detailed in the following subsections.
Common and consolidated tools by the software community were used in the experiments. For the execution of the experiments, the environment was configured to correspond to today’s internet as much as possible. As discussed by [13], using actual internet links can influence the connection dynamics, affecting the evaluation and producing unfair comparisons. Not rarely do the characteristics of the specific link differ from the typical conditions for some websites. In addition, using Google servers may be beneficial for QUIC-based processing (see some instances of such protocol performance evaluation in [27,28,29,30,31,32,33,34,35,36]). Based on the literature research, we established several configurations influencing and representing the real-world internet. The performed settings are described in Section 2.1. Section 2.2 discusses the adapted Data Envelopment Analysis model applied to this website assessment.

2.1. Testbed, Experiments and Factors

The following described environment here was designed to reflect the actual conditions of Internet traffic in the most reliable way possible. We considered the 100 most accessed websites in the world according to Alexa website ranking [37] to perform the experiments. The top 100 sites in Alexa provide a good internet representation because it displays the most accessed websites globally. We used the Google Big Query tool to retrieve this analysis’s inputs and output. However, it was not possible to collect information on the number of objects and page size for 18 pages from the 100 most accessed websites due to, among other factors, URL redirections or because they were no longer in operation. In addition, for these and other factors, some pages did not return the loading time during the access.
Eighty-two of the original units have all the information required for the analysis. This is sufficient to avoid the curse of dimensionality [38] and maintain the robustness of the analysis containing two inputs and one product. For this reason, we opted to work with 82 pages out of the 100 most accessed pages from which it was possible to extract all information for the analysis. The removed pages, with their respective positions based on Alexa’s report, were: yahoo.com (5th); t.co (34th); paypal.com (39th); google.com.tr (61st); office.com (63rd); diply.com (66th); bongacams.com (80th); googleusercontent.com (82nd); jd.com (84th); chinadaily.com.cn (89th); 360.com (90th); coccoc.com (91st); adnetworkperformance.com (93rd); haosou.com (95th); adobe.com (96th); china.com (97th); microsoftonline.com (99th); and whatsapp.com (100th).
The environment was set up on virtual machines using VMWare Player to reproduce the pages, which allowed paralleling several executions and ensuring the same configuration for all identical virtual machines. The operating system for these machines was Ubuntu 16.04. The browser was Google Chrome 54.0.28.40.100. The websites belong to different servers. Google BigQuery tool was used to understand how the content is organized and find the number of objects, which contains an extensive database of webpage information [39]. The Alexa pages were uploaded on Google BigQuery, and, through consultations, the inputs used in the data envelopment analysis experiments were retrieved, i.e., the number of objects and the size of these objects (page size) measured in bytes.
Creating a script to record and reproduce the pages using Mahimahi was necessary for the output. This tool records websites and reproduces them under an emulated network condition [40]. Using Mahimahi through virtual machines, it was possible to reproduce the websites and capture the page load time output. The webpages were loaded with 100 milliseconds RTT and 1% packet loss for both protocols. TCP/IP with HTTP 1.1 application protocol and QUIC with HTTP 2. These RTT and packet loss values were chosen based on the average values in [41]. The HAR file was captured from the page and the HAR file; the onLoad event was extracted to be used as page load time in the experiments.
Therefore, to carry out the data envelopment analysis, 82 sites were evaluated, considering the number of objects and page size as inputs and the OnLoad metric for page load time as the output. The mentioned inputs were chosen due to the capacity to produce (increasing) page load time, directly affecting the performance of websites performing well or poorly compared to the others. This analysis makes it possible to infer the best-performing pages needing improvements to reach the efficiency frontier.

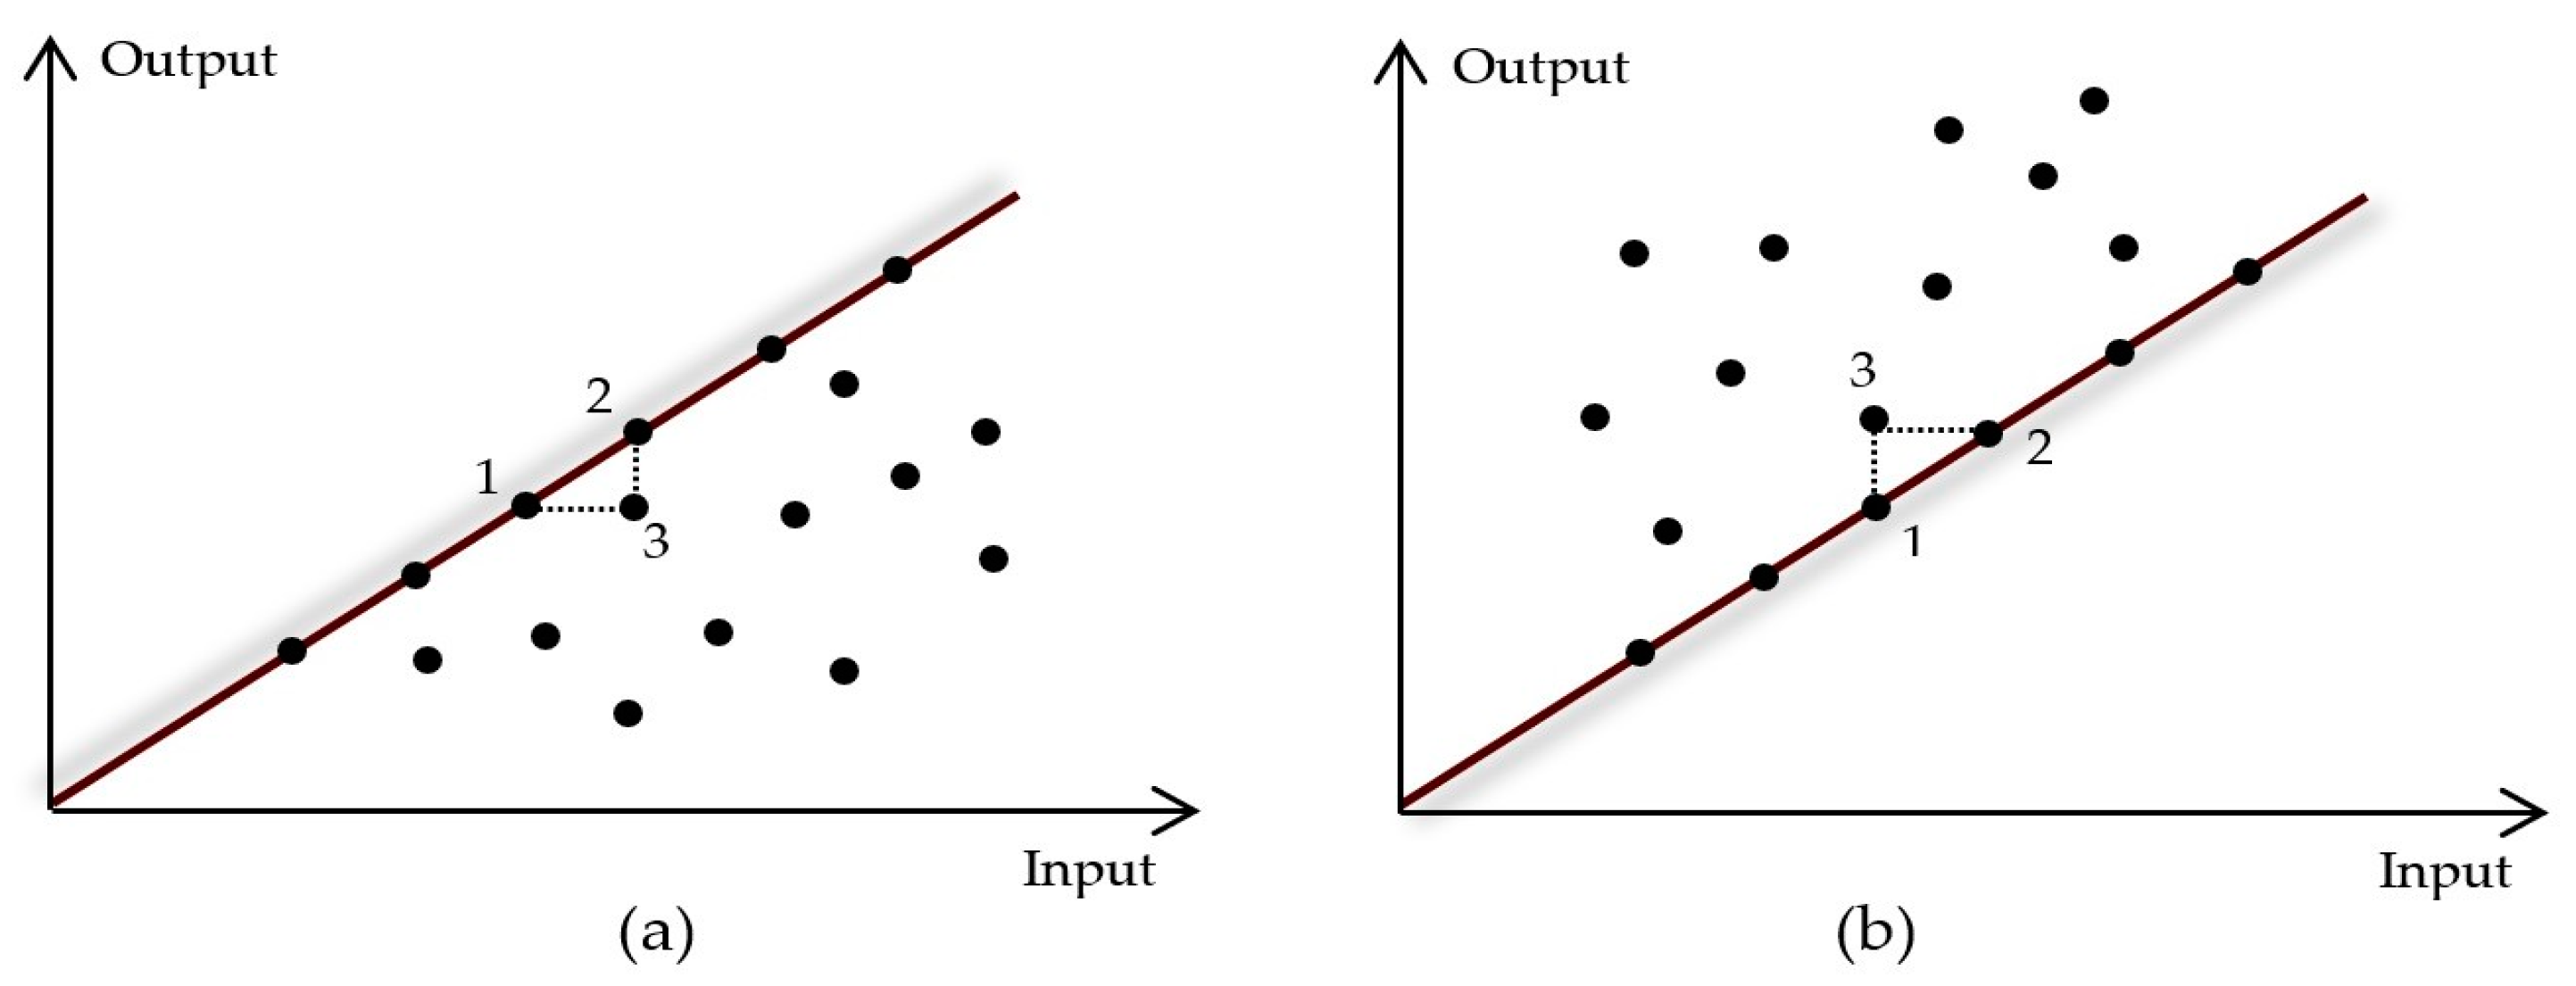
2.2. Data Envelopment Analysis

The traditional concept of technical efficiency, according to Shephard [42], Fare and Lovell [43], and Charnes and associates [5], is related to the maximum radial contraction or expansion that a decision-making unit (industries, companies, groups, people, machines, technologies) can obtain for production resources or products, respectively. Following this reasoning, a technically inefficient unit can become efficient by increasing its results (output) or reducing its resources (inputs), keeping similar production levels. In the first case, we have output-oriented models; in the second, input-oriented models. The efficiency measurement using the DEA technique comes from the ratio of outputs produced to the inputs consumed in a production process. It is a linear optimization mathematical programming technique with thousand of empirical applications and theoretical contributions over the past decades in all sectors of economic activity [6,7,8]. In this methodology, we can identify efficiency scores and potentials for improvement by solving the following dual form (considering the input-oriented case):
m i n   θ
S u b j e c t   t o : j = 1 n λ j x i j θ x i o | i = 1 ,   2 ,   3 ,   ,   m
j = 1 n λ j y r j y r o | r = 1 ,   2 ,   3 ,   ,   s
j = 1 n λ j = 1 | j = 1 ,   2 ,   3 ,   ,   n
λ j 0
where x i j is the input vector i = 1, 2, …, m used by each decision unit j; y r j is the output vector r = 1, 2, …, s produced by each decision unit j; λ j is the dual multiplier which translates the weighting contribution by each unit in the linear optimization and construction of the production frontier; and θ is the technical efficiency, which multiplied by the input vector of unit “o” under analysis ( x i o ) offers the optimal reduction which the unit must pursue to attain efficiency.
The linear formulation results in an efficiency score e = (1 − θ ), which varies from 0 to 1. Pages scoring 1 are technically efficient and benchmarks for best practices in reducing internet latency. Inefficient pages, for instance, scoring 0.8, need to improve their score by 0.2 to attain efficiency. This can be possible by expanding 20% of their results (output), keeping the same level of resources (input), or by reducing 20% of their resources, keeping the same results. Through a weight optimization process in the linear programming model (1), the methodology allows the construction of a non-parametric surface (frontier) by pairwise comparisons involving the data [32].
Figure 1a illustrates this reasoning for a general model under constant returns to scale. There are six efficient units (located along the straight line representing the efficiency frontier) and eleven inefficient units (enveloped by the linear combination of those six). The inefficient unit “3” can become efficient by either reducing its input proportionally to the same level as the efficient unit “1”, keeping the same output, or by expanding its output to the same level as the efficient unit “2”, keeping the same input usage (radial contractions and expansions).
Because the context of this evaluation regards a bad output, we aim at optimizing the result by reducing to the maximum possible page load time, PLT. Furthermore, because the inputs are assumed to be cost-free, we aim to obtain the maximum possible use of graphic and digital resources (size and number of objects), given the loading time restrictions. Thus, the linear programming input-oriented formulation defined in (1) can be adjusted to an inverse perspective:
m a x   φ
S u b j e c t   t o : j = 1 n λ j y r j y r o | r = 1 ,   2 ,   3 ,   ,   s
j = 1 n λ j x i j φ x i o | i = 1 ,   2 ,   3 ,   ,   m
j = 1 n λ j = 1 | j = 1 ,   2 ,   3 ,   ,   n
λ j 0
where x i j is the input vector i = 1, 2, …, m used by each decision unit j; y r j is the output vector r = 1, 2, …, s produced by each decision unit j; λ j is the dual multiplier which translates the weighting contribution by each unit in the linear optimization and construction of the production frontier; and φ is the technical inversed efficiency varying from 0 to 1, which multiplied by the input vector of unit “o” under analysis ( x i o ) offers the optimal expansion which the unit must pursue to attain efficiency. The interpretation of the parameters to the data in context is as follows: the efficient webpages in this model report φ = 1, which means that they operate with a low page load time using more objects and other graphical and digital resources compared to the others. In other words, they maximize the use of resources φ x i o (see the functional and second restriction in (2)), keeping the same level of page load time y r o (see the first restriction in (2)).
Alternatively, considering a slack-based additive model with both input and output orientation [44,45]:
m i n   φ e ( i = 1 m s i + r = 1 s s r )
S u b j e c t   t o : j = 1 n λ j y r j + s r = y r o | r = 1 ,   2 ,   3 ,   ,   s
j = 1 n λ j x i j s i = φ x i o | i = 1 ,   2 ,   3 ,   ,   m
λj ≥ 0,
j = 1 n λ j = 1 | j = 1 ,   2 ,   3 ,   ,   n
λj ≥ 0,
where s i and s r are the production slacks to be contracted or expanded.
This model provides the construction of an inverted non-parametric efficiency frontier enveloped by the inefficient unit’s data, as represented by Figure 1b. The efficiency score for each DMU ranging from 0 to 1 reflects the need for efficiency gains. Slacks in this model are interpreted in the opposite direction: Page Load Time (PLT) slacks measure what the page under evaluation wants to reduce instead of increasing (output). Slacks for page size or the number of objects represent what the page under evaluation is expected to expand compared to benchmark with similar technology. In the illustration of Figure 1b, the inefficient unit “3” may attain efficiency either by reducing the bad output to the efficient level of “1” or by expanding the page cost-free resources to the efficient level of unit “2”.

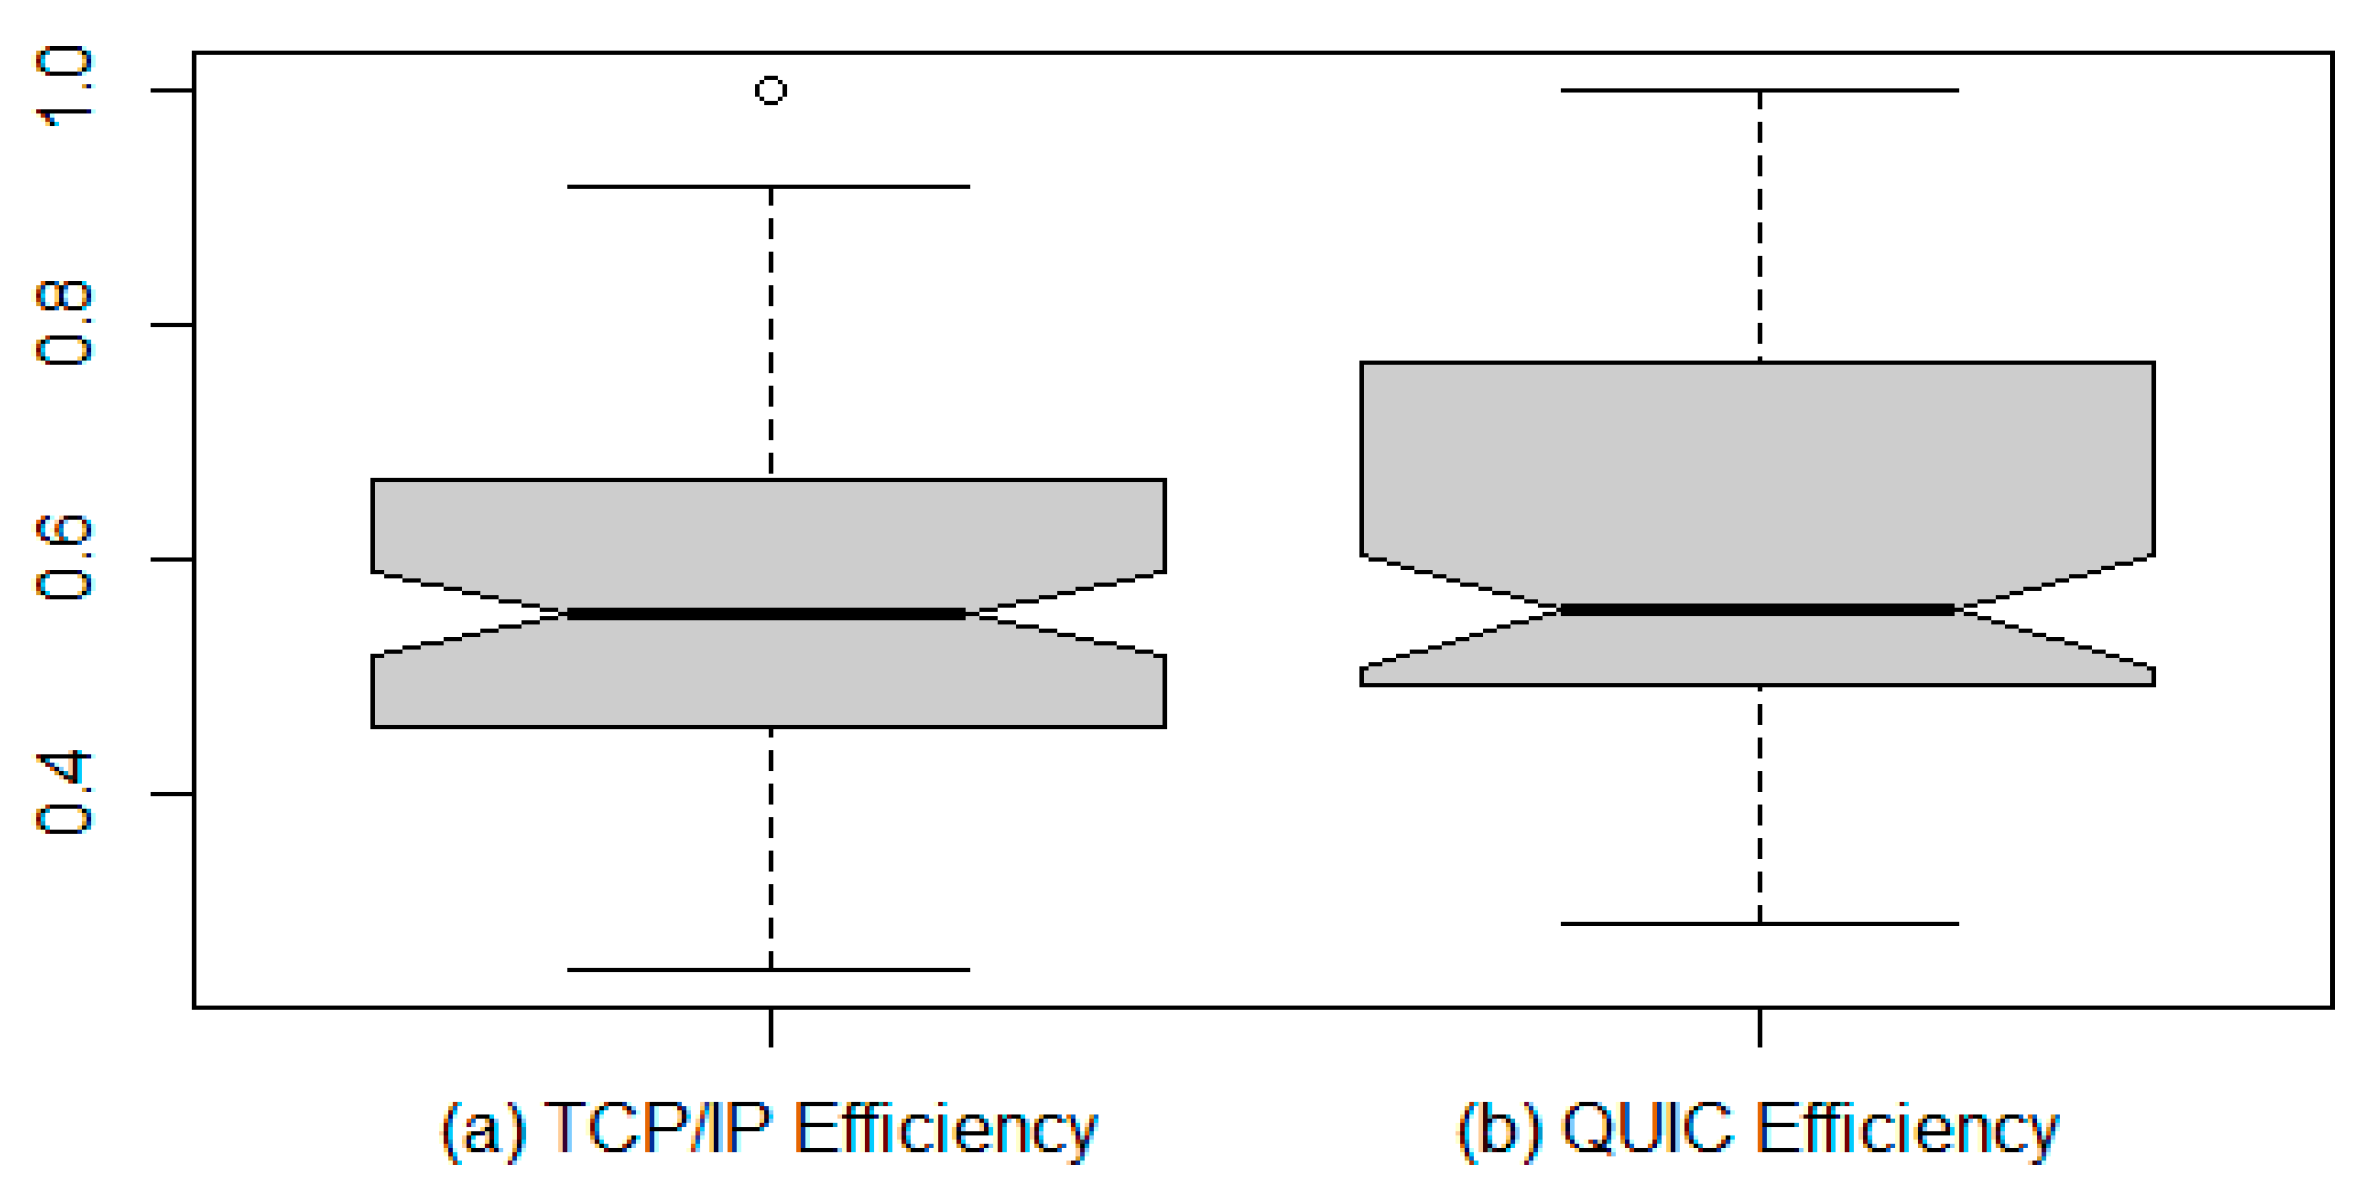
3. Results and Discussion

Table 1 reports the inputs, output, and respective efficiency scores (in percentage) derived from efficiency analysis of 82 out of the world’s top 100 most accessed websites. The PLT output and efficiency scores regard the TCP/IP (fourth and sixth) and QUIC (fifth and seventh). The first column presents the pages (Decision-Making Units—DMUs) ranked by the Efficiency column (built from the maximum value between the sixth and seventh columns). The number of objects and page size (in bytes) are reported as inputs on the second and third columns.
Nine websites are considered efficient from the point of view of at least one of the protocols: sina.com.cn, rakuten.co.jp, cntv.cn, bing.com, amazon.com, xinhuanet.com, cnn.com, imdb.com, and xvideos.com. The remaining 73 websites are considered inefficient under this methodology. About 80.5% of all units (66 webpages) need to reduce more than 50% of their page load time proportionally to the expansion of resources conditional to TCP/IP, compared to about 28.05% (23 webpages) conditional to QUIC. This may suggest that different communication protocols may affect the empirical distribution of inefficiencies. Nepomuceno et al. [10,46] argued that when exogenous factors have an unfavourable effect on the overall efficiency, the probability for a given unit to be located far from the efficient frontier (being less efficient) increases.
Conversely, when exogenous factors have a favorable effect on the overall efficiency, the probability for a given unit to be located far from the efficient frontier (being less efficient) decreases. In addition to the empirical distribution of the inefficiencies, about half the efficient units do not remain efficient for both communication protocols perspectives. Considering the different communication protocols as exogenous factors for the production of load time, this may suggest that different communication protocols may also affect the shape of the attainable frontier. Testing the separability condition as proposed by Daraio, Simar, and Wilson [47] may aid the broad understanding of communication protocols’ influence on the performance measurement of websites.
The overall additive technical efficiency is reinforced in three website units. For sina.com.cn, rakuten.co.jp, cntv.cn, we observe that the webpages are technically efficient for both protocols’ applications. This confirms the efficiency of these webpages. For the additional efficient and inefficient webpage units, there is a higher efficient rate favoring the QUIC communication protocol compared to the TCP/IP communication protocol, which supports the remark that most webpages are suitable for the most recent protocol.
Figure 2 illustrates the dispersion plot for investigating potential relations between TCP/IP and QUIC efficiency scores. A regression red line is included to facilitate the visualization. There is some weak evidence for a positive relationship between the efficiency scores conditional to the communication protocols (correlation = 0.6323), which means they walk in the same direction most of the time. Particular cases reporting high differences for specific page units may present an interesting topic for additional investigations.
Different communication protocols may have different effects on the empirical distribution of inefficiencies. This assertion has the additional statistical support of parametric and non-parametric hypothesis tests performed over the efficiency score comparing both approaches. Assuming equal variances and paired data, both two-sample Mann-Whitney and Student’s t-tests reject the null hypothesis of median and mean equality favouring the alternative for a negative difference between TCP/IP efficiency and QUIC efficiency, which means that the TCP/IP protocol has an unfavourable effect over the overall distribution of inefficiencies. In other words, keeping all the other factors constant, the probability for the same webpage to be located far from the efficient frontier (i.e., less efficient) increases using the TCP/IP protocol compared to QUIC. Figure 3 illustrates this comparison using notched boxplots to visualize potential differences.
Percentage changes in the combined input and output values measured by the inefficiency score provide the optimal contraction and expansion for each page in order to attain efficiency. This potential for improvement on the inputs and outputs is reported in Table 2 for the 20 least QUIC-efficient webpages considering both communication protocols’ perspectives. For instance, a webpage such as ask.com, which is 41.07% TCP/IP efficient and 31.98% QUIC-efficient, would require to expand about 59% objects and size (13.55 and 163,201.56 bytes) and reduce about 59% page load time (2.99 × 10³) considering the TCP/IP perspective. The same page in the QUIC perspective would require to expand of about 68% objects and size (15.64 and 188,359.93 bytes) and reduce about 68% page load time (6.76 × 10³). This performance improvement can be obtained through benchmarking best practices from the efficient pages with similar inputs to output configuration.
Figure 4 illustrates the non-parametric inverse efficient production frontier considering the TCP/IP (Figure 4a) and QUIC (Figure 4b) communication protocols constructed through the additive model under both orientations. The output (Y) axis represents the page load time in milliseconds. The input (X) axis represents the combination of the two inputs, number of objects, and page size. On both panels, frontiers are non-convex, and a VRS frontier is also included for comparison purposes concerning the piecewise additive efficiency frontier representation. The differences in the empirical distribution of inefficiencies and the shape of the production frontier suggest testing the separability condition of exogenous factors and using semi-parametric conditional frontier estimators [9,46,47,48,49,50].
In the visual representations, for one of the 77 TCP/IP inefficient pages or for one of the 75 QUIC inefficient pages (points on the left of the piecewise frontiers) to reach the efficiency frontier, it is either necessary to move to the right increasing the resources (objects and size) or move down decreasing the results (page load time) or a combination of both. Doing that, those pages go towards one of the five TCP/IP efficient benchmark points (amazon.com, sina.com.cn, bing.com, rakuten.co.jp, cntv.cn) located at the frontier of Figure 4a or towards one of the seven QUIC efficient points (sina.com.cn, akuten.co.jp, cntv.cn, xinhuanet.com, cnn.com, imdb.com, xvideos.com) on the boundary of the efficiency frontier of Figure 4b. This illustration of the inverse efficient production frontiers of TCP/IP and QUIC communication protocols using an additive model highlights the implications for efficiency enhancement and the necessity to consider various adjustments for inefficient pages, such as adaptability, multiplexing, and retransmission of lost packets.
The overall potential for improvements from the results (by summing all potential expansion in the resources and reduction in the page load time for all inefficient pages) reports the possibility of additional 1845.035 page objects and 29,540,758.37 bytes (29.54 MB) can be added to inefficient webpages’ capabilities, and about 2.48521 × 10⁵ (4.14 min) TCP/IP page load time and 2.97142 × 10⁵ (4.95 min) QUIC page load time can be saved in this request-response cycle. From a practical managerial perspective, such performance improvement can be obtained through benchmarking networking strategies from efficient pages with similar production configurations.

4. Conclusions

This work adapted the traditional non-parametric measure for technical efficiency to the context of website evaluation where resources are cost-free and the product, the page load time, is a bad output to be reduced instead of increased. This inverse frontier methodology assessed the efficiency of some of the world’s most-accessed websites from two communication protocol perspectives: TCP/IP and QUIC. The efficiency measures and hypothesis tests support the assertion that different communication protocols affect the empirical distribution of inefficiencies and the shape of the production frontier. For example, in the case of QUIC, the probability for a specific website to be located far from the efficient frontier (being less efficient) decreases, keeping everything else constant.
This study has adapted the conventional non-parametric efficiency measure to the unique context of websites’ evaluation, where resources are considered cost-free, and the objective is to minimize the detrimental output of page load time. Through the novel inverse frontier methodology, the technical efficiency of globally accessed websites has been assessed within TCP/IP and QUIC communication protocols. The obtained efficiency metrics and hypothesis tests underscore the significant impact of different communication protocols on inefficiency distribution and production frontier shape. Notably, in the case of QUIC, the likelihood of websites deviating considerably from the efficient frontier diminishes while holding other factors constant.
Furthermore, the study provides crucial efficiency metrics, benchmarks, avenues for enhancement, and rankings for comparative analysis. The analysis reveals substantial potential for improvement, suggesting the possibility of augmenting the capabilities of inefficient webpages by adding a significant number of objects and reducing page load time. These improvements translate to more efficient TCP/IP and QUIC page load times. The insights garnered from this work contribute significantly to enhancing website efficiency and user experience through informed network strategy benchmarking and replication.
Including specific setups for connection, jitter can be an interesting extension of the current analysis to investigate effects such as out-of-order packet delivery, increased latency, and even dropped packets, which can negatively impact real-time applications. Some interesting network strategies adopted by efficient websites can be benchmarked and reproduced by inefficient sites without reducing page size, objects, elements compression, or cache-reused content peers. Some instances are using Content Delivery Networks to reduce the distance between servers and users: minification (removing unnecessary code, white spaces, and comments); applying the minimum number of domains and non-nested tables; and reducing markups, redirects, and inline scripts.
Another interesting strategy, which does not affect the efficiency of the website but affects the user satisfaction, is optimizing the loading order of the webpage components, such as downloading first text content and any JavaScript required to display visual information so that users may have an apparent quicker response during the page loading. We hope to address many of those discussions in future evaluations.

Author Contributions

Conceptualization, T.C.C.N. and K.T.C.N.; methodology, T.C.C.N. and K.T.C.N.; software, T.C.C.N. and K.T.C.N.; validation, T.C.C.N., K.T.C.N. and S.G.T.d.C.S.; formal analysis T.C.C.N. and K.T.C.N.; investigation, T.C.C.N. and K.T.C.N.; resources, T.C.C.N. and K.T.C.N.; data curation, T.C.C.N. and K.T.C.N.; writing—original draft preparation, all authors; writing—review and editing, all authors; visualization, T.C.C.N. and K.T.C.N.; supervision, T.C.C.N.; project administration, T.C.C.N.; funding acquisition, T.C.C.N. All authors have read and agreed to the published version of the manuscript.

Funding

This research was funded by Conselho Nacional de Desenvolvimento Científico e Tecnológico (CNPq), Coordenação de Aperfeiçoamento de Pessoal de Nível Superior (CAPES) and Universidade Federal de Pernambuco (UFPE), granted by Edital de Apoio ao Pesquisador vinculado aos Programas de Pós-Graduação da UFPE number Edital PROPG nº 06/2022. The APC was funded by Universidade Federal de Pernambuco Edital PROPG nº 06/2022.

Institutional Review Board Statement

Not applicable.

Informed Consent Statement

Not applicable.

Data Availability Statement

Data are reported in this manuscript.

Acknowledgments

Authors acknowledge the support from family members, colleagues from the Networking and Telecommunications Research Group (GPRT-UFPE), and the Brazilian Coordination for the Improvement of Higher Education (CAPES).

Conflicts of Interest

The authors declare no conflict of interest.

References

  1. International Telecommunication Union. Measuring Digital Development: Facts and Figures. Available online: https://www.itu.int/en/ITU-D/Statistics/Documents/facts/FactsFigures2020.pdf (accessed on 22 July 2023).
  2. Selvidge, P. How Long Is Too Long to Wait for a Website to Load. Usability News 1999, 1, 1–3. [Google Scholar]
  3. Aberdeen Group. Gone in Three Seconds: Your Customers Have no Patience for a Slow Website. Available online: https://www.aberdeen.com/techpro-essentials/gone-in-three-seconds-your-customers-have-no-patience-for-a-slow-website (accessed on 21 March 2022).
  4. Using Site Speed in Web Search Ranking. Available online: https://developers.google.com/search/blog/2010/04/using-site-speed-in-web-search-ranking (accessed on 21 March 2022).
  5. Charnes, A.; Cooper, W.W.; Rhodes, E. Measuring the efficiency of decision making units. Eur. J. Oper. Res. 1978, 2, 429–444. [Google Scholar] [CrossRef]
  6. Daraio, C.; Kerstens, K.H.; Nepomuceno, T.C.C.; Sickles, R. Productivity and efficiency analysis software: An exploratory bibliographical survey of the options. J. Econ. Surv. 2019, 33, 85–100. [Google Scholar] [CrossRef]
  7. Daraio, C.; Kerstens, K.; Nepomuceno, T.; Sickles, R.C. Empirical surveys of frontier applications: A meta-review. Int. Trans. Oper. Res. 2020, 27, 709–738. [Google Scholar] [CrossRef]
  8. Nepomuceno, T.; Costa, A.; Daraio, C. Theoretical and empirical advances in the assessment of productive efficiency sincethe introduction of dea: A bibliometric analysis. Int. J. Oper. Res. 2023, 46, 505–549. [Google Scholar] [CrossRef]
  9. Nepomuceno, T.; Santiago, K.; Daraio, C.; Costa, A. Exogenous crimes and the assessment of public safety efficiency and effectiveness. Ann. Oper. Res. 2020, 316, 1349–1382. [Google Scholar] [CrossRef]
  10. Nepomuceno, K.; Nepomuceno, T.; Sadok, D. Measuring the internet technical efficiency: A ranking for the world wide web pages. IEEE Lat. Am. Trans. 2020, 18, 1119–1125. [Google Scholar] [CrossRef]
  11. Saraiva, N.; Soares, A. A performance evaluation programmable architecture for choice of switching paradigm in hybrid optical networks. IEEE Lat. Am. Trans. 2016, 14, 4567–4572. [Google Scholar] [CrossRef]
  12. Du, Y.; Li, C.; Hu, Q.; Li, X.; Chen, X. Ranking webpages using a path trust knowledge graph. Neurocomputing 2017, 269, 58–72. [Google Scholar] [CrossRef]
  13. Nepomuceno, K.; de Oliveira, I.N.; Aschoff, R.R.; Bezerra, D.; Ito, M.S.; Melo, W.; Sadok, D.; Szabo, G. Quic and tcp: A performance evaluation. In Proceedings of the 2018 IEEE Symposium on Computers and Communications (ISCC), Natal, Brazil, 25–28 June 2018; pp. 00045–00051. [Google Scholar] [CrossRef]
  14. Machado, L.; de Mello, J.; Roboredo, M. Efficiency evaluation of brazilian electrical distributors using dea game and cluster analysis. IEEE Lat. Am. Trans. 2016, 14, 4499–4505. [Google Scholar] [CrossRef]
  15. Fenerich, F.; da Costa, S.; de Lima, E. Energy efficiency in industrial environments: Overview and research agenda. IEEE Lat. Am. Trans. 2017, 15, 415–422. [Google Scholar] [CrossRef]
  16. Constant, R.; de Mello, J. Brazilian electricity distributors efficiency index based on non radial efficiency. IEEE Lat. Am. Trans. 2017, 15, 1657–1663. [Google Scholar] [CrossRef]
  17. Nepomuceno, T.C.C.; Costa, A.P.C.S. Resource allocation with Time Series DEA applied to Brazilian Federal Saving banks. Econ. Bull. 2019, 39, 1384–1392. [Google Scholar]
  18. Nepomuceno, T.C.C.; Daraio, C.; Costa, A.P.C.S. Combining multi-criteria and directional distances to decompose non- compensatory measures of sustainable banking efficiency. Appl. Econ. Lett. 2020, 27, 329–334. [Google Scholar] [CrossRef]
  19. Serrano-Cinca, C.; Fuertes-Calle, Y.; Mar-Molinero, C. Measuring dea efficiency in internet companies. Decis. Support Syst. 2005, 38, 557–573. [Google Scholar] [CrossRef]
  20. Martínez-Núñez, M.; Pérez-Aguiar, W.S. Efficiency analysis of information technology and online social networks management: An integrated dea-model assessment. Inf. Manag. 2014, 51, 712–725. [Google Scholar] [CrossRef]
  21. Li, C.; Cheng, B.; Chen, J.; Gu, P.; Deng, N.; Li, D. A web service performance evaluation approach based on users experience. In Proceedings of the 2011 IEEE International Conference on Web Services, Washington, DC, USA, 4–9 July 2011; pp. 734–735. [Google Scholar] [CrossRef]
  22. Klumpp, M.; Loske, D. Order picking and e-commerce: Introducing non-parametric efficiency measurement for sustainable retail logistics. J. Theor. Appl. Electron. Commer. Res. 2021, 16, 846–858. [Google Scholar] [CrossRef]
  23. Ghosh, P.; Rau-Chaplin, A. Performance of dynamic web page generation for database-driven web sites. In Proceedings of the International Conference on Next Generation Web Services Practices, Seoul, Republic of Korea, 25–28 September 2006; pp. 56–63. [Google Scholar] [CrossRef]
  24. Butkiewicz, M.; Madhyastha, H.V.; Sekar, V. Characterizing web page complexity and its impact. IEEE/ACM Trans. Netw. 2014, 22, 943–956. [Google Scholar] [CrossRef]
  25. Najadat, H.; Al-Badarneh, A.; Al-Huthaifi, R.; Abo-Zaitoon, A.; Al-Omary, Y. Evaluating jordanian universities’ websites based on data envelopment analysis. In Proceedings of the 2017 8th International Conference on Information and Communication Systems (ICICS), Irbid, Jordan, 4–6 April 2017; pp. 159–164. [Google Scholar] [CrossRef]
  26. Li, Z.; Li, J.; Li, X. A study on website operation efficiency evaluation: Based on dea model. In Proceedings of the 2009 International Conference on Management and Service Science, Beijing, China, 20–22 September 2009; pp. 1–6. [Google Scholar] [CrossRef]
  27. Widmer, J.; Denda, R.; Mauve, M. A survey on tcp-friendly congestion control. IEEE Netw. 2001, 15, 28–37. [Google Scholar] [CrossRef]
  28. Lychev, R.; Jero, S.; Boldyreva, A.; Nita-Rotaru, C. How secure and quick is quic? Provable security and performance analyses. In Proceedings of the 2015 IEEE Symposium on Security and Privacy, San Jose, CA, USA, 17–21 May 2015; pp. 214–231. [Google Scholar] [CrossRef]
  29. Carlucci, G.; De Cicco, L.; Mascolo, S. Http over udp: An experimental investigation of quic. In SAC ‘15: Proceedings of the 30th Annual ACM Symposium on Applied Computing, SAC 2015: Symposium on Applied Computing, Salamanca, Spain, 13–17 April 2015; Association for Computing Machinery: New York, NY, USA, 2015; pp. 609–614. [Google Scholar] [CrossRef]
  30. Megyesi, P.; Krämer, Z.; Molnár, S. How quick is quic? In Proceedings of the 2016 IEEE International Conference on Communications (ICC), Kuala Lumpur, Malaysia, 22–27 May 2016; pp. 1–6. [Google Scholar] [CrossRef]
  31. Biswal, P.; Gnawali, O. Does quic make the web faster? In Proceedings of the 2016 IEEE Global Communications Conference (GLOBECOM), Washington, DC, USA, 4–8 December 2016; pp. 1–6. [Google Scholar] [CrossRef]
  32. Reddy, N.R.; Reddy, P.C.; Padmavathamma, M. Efficient traffic engineering strategies for improving the performance of tcp friendly rate control protocol. Futur. Internet 2017, 9, 74. [Google Scholar] [CrossRef]
  33. Kakhki, A.M.; Jero, S.; Choffnes, D.; Nita-Rotaru, C.; Mislove, A. Taking a long look at quic: An approach for rigorous evaluation of rapidly evolving transport protocols. In IMC ‘17: Proceedings of the 2017 Internet Measurement Conference, IMC ‘17: Internet Measurement Conference, London, UK, 1–3 November 2017; Association for Computing Machinery: New York, NY, USA, 2017; pp. 290–303. [Google Scholar] [CrossRef]
  34. Peng, G.-Q.; Xue, G.; Chen, Y.-C. Network measurement and performance analysis at server side. Futur. Internet 2018, 10, 67. [Google Scholar] [CrossRef]
  35. Jaloudi, S. Communication protocols of an industrial internet of things environment: A comparative study. Futur. Internet 2019, 11, 66. [Google Scholar] [CrossRef]
  36. Olmedo, G.; Lara-Cueva, R.; Martínez, D.; de Almeida, C. Performance analysis of a novel tcp protocol algorithm adapted to wireless networks. Futur. Internet 2020, 12, 101. [Google Scholar] [CrossRef]
  37. The Top 500 Sites on the Web. Available online: https://www.alexa.com/topsites/ (accessed on 21 March 2022).
  38. Charles, V.; Aparicio, J.; Zhu, J. The curse of dimensionality of decision-making units: A simple approach to increase the discriminatory power of data envelopment analysis. Eur. J. Oper. Res. 2019, 279, 929–940. [Google Scholar] [CrossRef]
  39. Google Bigquery. Available online: https://cloud.google.com/bigquery/ (accessed on 21 March 2022).
  40. Netravali, R.; Sivaraman, A.; Das, S.; Goyal, A.; Winstein, K.; Mickens, J.; Balakrishnan, H. Mahimahi: Accurate record-and- replay for http. In Proceedings of the USENIX ATC, Santa Clara, CA, USA, 8–10 July 2015; pp. 417–429. [Google Scholar]
  41. Wang, X.S.; Balasubramanian, A.; Krishnamurthy, A.; Wetherall, D. How speedy is SPDY? In Proceedings of the 11th USENIX Symposium on Networked Systems Design and Implementation (NSDI 14), Seattle, WA, USA, 2–4 April 2014; pp. 387–399. [Google Scholar]
  42. Shephard, R.W. Theory of Cost and Production Functions; Princeton University Press: Princeton, NJ, USA, 1970. [Google Scholar]
  43. Fare, R.; Lovell, C.K. Measuring the technical efficiency of production. J. Econ. Theory 1978, 19, 150–162. [Google Scholar] [CrossRef]
  44. Cook, W.D.; Seiford, L.M. Data envelopment analysis (dea)—Thirty years on. Eur. J. Oper. Res. 2009, 192, 1–17. [Google Scholar] [CrossRef]
  45. Charnes, A.; Cooper, W.; Golany, B.; Seiford, L.; Stutz, J. Foundations of data envelopment analysis for pareto-koopmans efficient empirical production functions. J. Econom. 1985, 30, 91–107. [Google Scholar] [CrossRef]
  46. Nepomuceno, T.C.C.; Daraio, C.; Costa, A.P.C.S. Multicriteria ranking for the efficient and effective assessment of police departments. Sustainability 2021, 13, 4251. [Google Scholar] [CrossRef]
  47. Daraio, C.; Simar, L.; Wilson, P.W. Central limit theorems for conditional efficiency measures and tests of the ‘separability’ condition in non-parametric, two-stage models of production. Econom. J. 2018, 21, 170–191. [Google Scholar] [CrossRef]
  48. Badin, L.; Daraio, C. Explaining Efficiency in Non-parametric Frontier Models: Recent Developments in Statistical Inference. In Exploring Research Frontiers in Contemporary Statistics and Econometrics; Physica-Verlag: Heidelberg, Germany, 2012; Chapter 1; pp. 151–175. [Google Scholar] [CrossRef]
  49. Nepomuceno, T.C.C. Data-driven Analytics for Socioeconomic Challenges in a Contemporary World. Socioecon. Anal. 2023, 1, 1–4. [Google Scholar]
  50. Boezi, G.; Cottarelli, A.; Manimendra, I.; Pagmozzi, D. The Efficiency of European Universities and the Role of Exogenous Factors. Socioecon. Anal. 2023, 1, 103–125. [Google Scholar]
Figure 1. Schematic representations of efficiency frontiers under constant returns to scale. Panel (a): standard CRS frontier enveloping inefficient units using one input to produce one output. Panel (b): inverse CRS frontier enveloped by inefficient units using one free-disposal and cost-free input to produce one bad output.
Data 08 00134 g001
Figure 2. TCP/IP vs. QUIC dispersion graph. Pearson’s correlation = 0.6322823.
Data 08 00134 g002
Figure 3. Boxplots and hypothesis tests.
Data 08 00134 g003
Figure 4. Input-output additive hyperbolic graph-orientated efficiency frontiers. Panel (a): TCP/IP inverse hyperbolic graph-orientated efficiency frontier and an equivalent VRS efficiency frontier (dark red). Panel (b): QUIC inverse hyperbolic graph-orientated efficiency frontier and an equivalent VRS efficiency frontier (dark red).
Data 08 00134 g004
Table 1. Inputs, outputs, and efficiency scores.
Websites (DMUs)ObjectsPage SizePLT (TCP/IP)PLT (QUIC)Efficiency (TCP/IP)Efficiency (QUIC)Higher Efficiency
sina.com.cn49619,069,0951.66 × 1041.27 × 104100.00%100.00%100.00%
rakuten.co.jp80810,521,2951.08 × 1041.33 × 104100.00%100.00%100.00%
cntv.cn1301,021,7432.63 × 1033.18 × 103100.00%100.00%100.00%
bing.com56941,0861.72 × 1035.35 × 103100.00%92.11%100.00%
amazon.com1994,639,2448.59 × 1031.31 × 104100.00%89.98%100.00%
xinhuanet.com9214,845,0937.16 × 1035.57 × 10388.77%100.00%100.00%
cnn.com17678,9821.59 × 1046.66 × 10359.82%100.00%100.00%
imdb.com/17670,1751.51 × 1047.30 × 10357.58%100.00%100.00%
xvideos.com20263,5522.66 × 1044.07 × 10332.27%100.00%100.00%
baidu.com911,507,1733.24 × 1033.34 × 10361.28%95.37%95.37%
naver.com1011,537,0496.73 × 1035.98 × 10376.52%93.07%93.07%
msn.com92758,0562.87 × 1039.67 × 10391.51%65.83%91.51%
mail.ru15641,0629.53 × 1037.01 × 10355.14%90.74%90.74%
amazon.in1362,760,9551.16 × 1042.66 × 10490.58%50.21%90.58%
pornhub.com1282,577,8797.62 × 1031.23 × 10490.18%76.70%90.18%
flipkart.com2545,669,3669.50 × 1039.74 × 10373.37%89.79%89.79%
hao123.com3851,573,2588.89 × 1038.21 × 10368.20%88.31%88.31%
sohu.com1742,624,8861.23 × 1041.45 × 10485.59%87.61%87.61%
tumblr.com1121,621,7442.51 × 1041.46 × 10474.19%87.48%87.48%
amazon.co.jp132789,6471.75 × 1041.46 × 10461.49%87.00%87.00%
ebay.com3026,225,0629.33 × 1031.01 × 10477.68%86.71%86.71%
amazon.de18576,6981.29 × 1041.90 × 10483.70%66.97%83.70%
google.co.uk96869,8815.63 × 1033.86 × 10361.06%82.37%82.37%
google.de2585,060,7895.49 × 1034.01 × 10362.63%79.36%79.36%
youtube.com1311,589,9246.62 × 1032.11 × 10477.98%47.29%77.98%
gmw.cn36487,7001.44 × 1041.11 × 10453.95%76.63%76.63%
amazon.co.uk1822,150,5331.41 × 1042.39 × 10476.35%53.41%76.35%
nicovideo.jp842,040,8647.75 × 1039.01 × 10366.67%76.19%76.19%
pixnet.net471,239,3301.80 × 1041.77 × 10459.84%71.97%71.97%
kat.cr3074,408,5141.09 × 1041.11 × 10463.85%70.77%70.77%
github.com1651,504,1948.27 × 1038.01 × 10362.29%69.51%69.51%
twitter.com681,423,6376.08 × 1034.65 × 10343.25%68.40%68.40%
360.cn1481,869,2679.75 × 1031.33 × 10468.18%66.04%68.18%
microsoft.com1021,257,2621.03 × 1042.00 × 10466.95%52.55%66.95%
dropbox.com2053,2722.16 × 1041.91 × 10449.75%66.86%66.86%
xhamster.com15641,9227.84 × 1039.58 × 10355.40%66.44%66.44%
qq.com15647,4861.84 × 1041.81 × 10456.48%65.80%65.80%
tianya.cn541,279,9648.63 × 1034.87 × 10330.77%65.39%65.39%
soso.com23276,9483.71 × 1034.87 × 10346.30%65.33%65.33%
imgur.com141,638,0256.66 × 1031.38 × 10465.28%55.44%65.28%
go.com110940,9451.39 × 1049.65 × 10345.88%64.06%64.06%
outbrain.com15638,8369.36 × 1031.12 × 10455.08%61.91%61.91%
taobao.com18679,5041.52 × 1041.43 × 10456.66%61.13%61.13%
google.fr1823,993,2625.70 × 1031.07 × 10460.22%52.11%60.22%
google.com.mx17672,0615.87 × 1038.80 × 10358.55%50.59%58.55%
google.pl17669,2566.03 × 1038.42 × 10356.96%52.51%56.96%
pinterest.com1411,669,4511.14 × 1049.79 × 10348.48%56.87%56.87%
fc2.com23459,6041.15 × 1047.01 × 10337.77%56.68%56.68%
alibaba.com1472,861,7269.13 × 1031.41 × 10456.45%47.29%56.45%
yandex.ru184387,5647.46 × 1031.42 × 10456.25%44.77%56.25%
google.it16649,3836.12 × 1039.60 × 10356.17%53.09%56.17%
tmall.com36571,0771.66 × 1049.92 × 10329.10%55.89%55.89%
google.co.in15647,5136.15 × 1039.44 × 10355.82%50.15%55.82%
google.co.id19642,6956.20 × 1038.82 × 10355.43%49.91%55.43%
wikipedia.org2062,144,8433.18 × 1037.82 × 10354.05%40.70%54.05%
apple.com35129,2142.35 × 1041.82 × 10443.24%53.65%53.65%
google.es57512,9026.97 × 1031.01 × 10449.28%53.09%53.09%
google.ru2084,239,3936.51 × 1031.02 × 10452.74%50.21%52.74%
google.com.br63585,7706.59 × 1031.06 × 10452.10%50.59%52.10%
google.co.jp2202,314,7366.66 × 1038.93 × 10351.56%50.73%51.56%
google.com.hk14525,0336.57 × 1038.63 × 10351.39%47.18%51.39%
google.ca17679,5156.71 × 1038.42 × 10351.22%50.08%51.22%
aliexpress.com1262,187,8871.13 × 1042.20 × 10450.43%39.77%50.43%
google.com.au15645,0256.88 × 1038.58 × 10349.93%50.39%50.39%
yahoo.co.jp20141,2428.78 × 1031.04 × 10449.49%50.20%50.20%
google.com39448,0428.69 × 1031.10 × 10439.52%50.04%50.04%
facebook.com41578,9705.81 × 1036.39 × 10347.73%49.78%49.78%
wordpress.com59579,1118.00 × 1036.48 × 10332.87%49.12%49.12%
ok.ru532,069,6499.32 × 1031.17 × 10436.85%47.79%47.79%
reddit.com53474,6628.81 × 1039.43 × 10346.46%46.46%46.46%
live.com10162,0695.07 × 1036.88 × 10333.90%46.22%46.22%
weibo.com16640,4441.22 × 1041.44 × 10446.05%46.05%46.05%
craigslist.org26288,6264.46 × 1036.97 × 10338.56%45.66%45.66%
instagram.com16132,4721.00 × 1047.78 × 10334.29%44.98%44.98%
vk.com40306,6128.97 × 1037.17 × 10338.30%44.39%44.39%
stackoverflow.com311,368,8206.12 × 1031.10 × 10442.96%28.94%42.96%
ask.com821,332,1875.08 × 1039.95 × 10341.07%31.99%41.07%
blogger.com1478,7107.90 × 1038.76 × 10325.00%36.32%36.32%
blogspot.com1478,6678.40 × 1039.31 × 10325.00%34.19%34.19%
netflix.com18325,9901.51 × 1041.70 × 10434.18%32.78%34.18%
onclickads.net12152,9095.26 × 1031.00 × 10432.68%31.74%32.68%
linkedin.com13702,6098.40 × 1031.03 × 10431.91%31.91%31.91%
Table 2. Potential for improvements (for selected units).
DMUPotential for Improvements (TCP/IP Efficiency)Potential for Improvements (QUIC Efficiency)
ObjectsPage SizePLT (TCP/IP)ObjectsPage SizePLT (QUIC)
stackoverflow.com14.83164,619.593.49 × 10318.48205,097.197.81 × 103
onclickads.net8.08102,937.003.54 × 1038.19104,376.816.84 × 103
linkedin.com12.26221,982.015.72 × 10312.26221,982.016.99 × 103
ask.com13.55163,201.562.99 × 10315.64188,359.936.76 × 103
netflix.com8.56462,425.949.92 × 1038.74472,271.671.14 × 104
blogspot.com10.5059,000.266.30 × 1039.2151,774.986.13 × 103
blogger.com10.5059,032.525.92 × 1038.9250,123.605.58 × 103
aliexpress.com33.71705,763.495.60 × 10340.96857,464.811.33 × 104
wikipedia.org9.1924,477.281.46 × 10311.8631,592.934.64 × 103
vk.com24.06276,454.055.53 × 10321.69249,153.843.99 × 103
yandex.ru27.56256,274.433.27 × 10334.80323,546.857.85 × 103
instagram.com15.11302,003.566.58 × 10312.65252,863.424.28 × 103
craigslist.org6.1499,578.412.74 × 1035.4388,069.983.79 × 103
weibo.com59.35507,676.846.56 × 10359.35507,676.847.78 × 103
live.com10.5887,568.653.35 × 1038.6071,240.703.70 × 103
reddit.com28.38254,152.604.72 × 10328.38254,152.645.05 × 103
google.com.hk6.81255,239.573.19 × 1037.40277,342.794.56 × 103
alibaba.com20.47539,765.863.98 × 10324.77653,243.037.42 × 103
youtube.com28.85350,162.011.46 × 10369.05838,010.561.11 × 104
ok.ru25.89365,618.485.89 × 10321.41302,284.756.08 × 103
Disclaimer/Publisher’s Note: The statements, opinions and data contained in all publications are solely those of the individual author(s) and contributor(s) and not of MDPI and/or the editor(s). MDPI and/or the editor(s) disclaim responsibility for any injury to people or property resulting from any ideas, methods, instructions or products referred to in the content.

