Abstract
This study addressed the challenge of training generative adversarial networks (GANs) on small tabular clinical trial datasets for data augmentation, which are known to pose difficulties in training due to limited sample sizes. To overcome this obstacle, a hybrid approach is proposed, combining the synthetic minority oversampling technique (SMOTE) to initially augment the original data to a more substantial size for improving the subsequent GAN training with a Wasserstein conditional generative adversarial network with gradient penalty (WCGAN-GP), proven for its state-of-art performance and enhanced stability. The ultimate objective of this research was to demonstrate that the quality of synthetic tabular data generated by the final WCGAN-GP model maintains the structural integrity and statistical representation of the original small dataset using this hybrid approach. This focus is particularly relevant for clinical trials, where limited data availability due to privacy concerns and restricted accessibility to subject enrollment pose common challenges. Despite the limitation of data, the findings demonstrate that the hybrid approach successfully generates synthetic data that closely preserved the characteristics of the original small dataset. By harnessing the power of this hybrid approach to generate faithful synthetic data, the potential for enhancing data-driven research in drug clinical trials become evident. This includes enabling a robust analysis on small datasets, supplementing the lack of clinical trial data, facilitating its utility in machine learning tasks, even extending to using the model for anomaly detection to ensure better quality control during clinical trial data collection, all while prioritizing data privacy and implementing strict data protection measures.
1. Introduction
In recent years, the field of deep learning has undergone remarkable growth, bringing about revolutionary advancements in diverse domains, including computer vision, natural language processing (NLP), medical imaging, and even conversational AI with models such as ChatGPT. Nonetheless, the effectiveness of deep learning models heavily relies on the availability of large datasets for achieving robust generalization. Unfortunately, the pursuit of this requirement is often impeded by limited data accessibility, especially in more sensitive fields such as healthcare, medical science, and the biopharmaceutical industry, where privacy laws and regulations impose restrictions on access to these datasets.
Moreover, within the specific field of clinical trial research, limitations arise that further constrain data availability. Factors such as the high costs associated with patient enrollment, challenges in enrolling patients who meet the study criteria, and ethical considerations collectively contribute to the inherent limitations of clinical trial datasets. Consequently, clinical trial investigators often operate with a relatively limited number of patients, prioritizing adequate statistical power to achieve statistical significance to effectively demonstrate the comparative efficacy between treatments. This limitation becomes even more pronounced in areas of rare diseases clinical trial, where data scarcity amplifies the need for more data required for analysis and impactful findings.
Nevertheless, within these small tabular datasets, a wealth of valuable insights and utility for further machine learning can be unlocked through the application of appropriate data augmentation techniques. Tabular data, being the most common and crucial form of data in numerous studies, offers a significant potential for analysis and decision-making. Traditional approaches to data augmentation, such as Bayesian methods or randomization-based techniques, have historically been employed to generate synthetic data. However, recent advancements in generative adversarial networks (GANs) have shown promising outcomes, spurring the exploration of GANs for augmenting tabular data. Notably, GANs have outperformed traditional statistical methods in various tabular data augmentation tasks [1], enabling the generation of more diverse, realistic, and interpretable data. This breakthrough is particularly remarkable considering that GANs are predominantly associated with image generation and NLP.
With the growing interest in utilizing GANs for generating tabular data, it is crucial to tackle the challenges involved in applying GANs to small tabular datasets. Since GANs are deep learning models, they inherently require a substantial quantity of diverse and representative data for effective training. When training GANs with insufficient data, it can result in discriminator overfitting [2]. This means that the discriminator becomes too specialized and fails to generalize well to unseen data. As a result, the training process can become unstable, causing the GAN training to diverge and produce poor-quality or nonsensical outputs.
The current state of tabular data augmentation involves various techniques such as synthetic minority oversampling technique (SMOTE) and different variants of GANs. SMOTE is simple and effective; however, it may not be able to generate diverse and realistic data. On the other hand, a GAN and its different variants can generate diverse data but require larger datasets for training [2]. Therefore, a potential hybrid solution could involve enhancing a small tabular dataset by initially augmenting the original data with SMOTE, aiming to preserve the statistical characteristics of the original data. Subsequently, a GAN can be trained on the augmented data from the first step to create a generator model capable of producing more diverse and realistic data, while simultaneously safeguarding the statistical representation of the original data. This concept of standard data augmentation of a small dataset prior to GAN training is not new and has been widely implemented in image training. For example, Frid-Adar et al. (2018) used standard data augmentation techniques for images to create a larger dataset for training a GAN model that could generate better synthetic examples for training a liver lesion classifier [3]. However, further testing on a similar concept and its application for small tabular dataset is still not fully explored.
2. Literature Overview of Tabular Data Augmentation
2.1. SMOTE
While SMOTE was initially developed to address the problem of class imbalance in classification tasks by oversampling the minority class [4], it can also be utilized for synthesizing artificial data that can be used to supplement or replace real data [5]. In principle, the SMOTE algorithm works by selecting a minority class sample and finding its k nearest neighbors in feature space. Then, it generates a new synthetic sample by randomly selecting one of the k neighbors and interpolating between the selected sample and the original sample. By creating new synthetic data points in this way, the SMOTE algorithm can help to balance class distribution in the dataset and improve the performance of classifier trained on imbalanced data. In addition to oversampling only the minority class to deal with class imbalance problems, SMOTE can also be used unconventionally as a data augmentation method to oversample all labeled classes, including that of the original majority class, that is, if the majority class is also treated as minority class and the SMOTE algorithm is applied [6].
2.2. GAN
First introduced by Goodfellow et al. (2014), GANs are a type of deep learning model that can generate new data samples similar to the training data [7]. The principle behind GANs is training two networks simultaneously: a generator network that creates new data samples and a discriminator network that distinguishes between real and generated data. The generator network improves by attempting to deceive the discriminator network, while the discriminator network improves by accurately classifying real and generated data. This iterative training process continues until an equilibrium is reached between the adversarial loss of the generator and the discriminator. As a result, a generator capable of producing data similar to the original real data is obtained [8].
GANs have been used in a variety of applications, including image and natural language generation. In image generation, GANs can learn to generate realistic and high-quality images by training on a large dataset of real images [9]. The generator network can then produce new images that are similar to the training data. In natural language generation, GANs can learn to generate new text based on a training corpus of text [10]. However, GANs are less commonly used for generating tabular data. One reason for this is that generating tabular data requires a more structured approach than generating images or natural language. In tabular data, the relationships between variables must be preserved, and the data must be generated in a way that is consistent with the training data. This means that the generated data should have similar statistical properties to the original dataset, such that the distribution of each feature and the relationship between them is preserved. For example, if the original dataset has a specific correlation between two or more features, the generated data should also have a similar correlation or statistical pattern. Similarly, if the original dataset has a particular range for a specific feature, the generated data should also have a similar range. Another major challenge of using GANs for tabular data generation is the difficulty of handling discrete or categorical variables. Unlike continuous variables, categorical variables can only take a limited set of discrete values, making it difficult to model the distribution of these variables accurately [1]. In addition to these technical challenges, there is also the issue of data sparsity, where combinations of features may be extremely rare in the training data. In such cases, GAN may struggle to generate samples that are consistent with the training data, leading to poor performance.
Overall, generating tabular data using GANs is a challenging task that requires a careful consideration of the data representation, model architecture, and training procedures. While GANs have shown promising results in image and natural language generation, their effectiveness for tabular data generation is still an active area of research. In addition, traditional GAN can encounter training challenges such as vanishing gradients and mode collapse [11,12], leading to inadequate training performance and diversity in generated samples. Despite so, several important methods and breakthroughs in this field have emerged to address these challenges.
2.3. Conditional GAN (CGAN)
A CGAN is an extension of the standard GAN framework that incorporates conditional information during the training process [13]. The generator and discriminator in a CGAN receive additional input, known as condition or context information, guiding the generation process. This additional information can include class labels, attribute values, or text descriptions, enabling the generation of samples that satisfy specific constraints or belong to particular classes. By optimizing the generator and discriminator through adversarial training, CGANs learn to generate realistic samples that align with the provided conditions. CTGAN, short for conditional tabular GAN, is a specialized implementation of a CGAN that focuses on synthesizing tabular data [14]. It specifically addresses the unique challenges associated with tabular datasets, including the handling of mixed data types that contain both categorical and continuous variables: capturing complex dependencies between columns, and preserving statistical properties from the original dataset. However, it is important to consider some limitations of CTGAN [15]. The performance of CTGAN may still be impaired when handling high-cardinality features, skewed feature distributions, and small datasets. Moreover, the interpretability of the generated data may vary, where datasets with different characteristics may require a custom optimization of hyperparameters through trial and error to improve the generated data quality.
2.4. Wasserstein GAN (WGAN)
Wasserstein generative adversarial networks (WGANs) improve upon traditional GANs by using the Wasserstein distance, also known as earth mover’s distance, as the objective function for training [16]. The Wasserstein distance provides a more meaningful measure of similarity between the real and generated data distributions compared to the probability-based metrics used in traditional GANs. To address the stability and convergence issues in training, WGANs utilize a technique called weight clipping. This approach constrains the weights of the neural network models within a specified range, thereby enforcing a 1-Lipschitz constraint. By limiting the weights, WGANs encourage smaller and more stable weight updates during training, leading to improved convergence.
2.5. Wasserstein GAN with Gradient Penalty (WGAN-GP)
However, weight clipping, despite its benefits in stabilizing training, can sometimes still lead to issues such as vanishing gradients and limited expressiveness. In order to overcome these limitations, an improvement known as gradient penalty was introduced, resulting in WGAN-GP. Instead of directly clipping weights, WGAN-GP introduces a regularization term that penalizes the model based on the magnitude of gradients [17]. This regularization encourages a smooth transition between the distributions of generated and real data, thereby promoting more stable training and generating higher-quality samples. WGAN-GP utilizes a gradient penalty to enforce the 1-Lipschitz constraint and ensure that the norm of gradients remains close to one. By doing so, it effectively addresses the training instability caused by the critic producing explosive gradients in GANs. This approach involves clipping the weights using the 1-Lipschitz function and constraining the rate of change. Consequently, the convergence is accelerated as reasonable gradients are maintained during training, resulting in a more stable and less explosive critic [18]. By leveraging both the Wasserstein distance and the gradient penalty, WGAN-GP emerges as a more powerful approach for generating high-quality synthetic data compared to WGAN. It combines the meaningful similarity measure of the Wasserstein distance with the enhanced stability and gradient control provided by the gradient penalty, ultimately enabling the synthesis of synthetic data that closely approximate the properties of real data.
2.6. Wasserstein Conditional GAN with Gradient Penalty (WCGAN-GP)
WCGAN-GP expands upon the capabilities of WGAN-GP by integrating the handling of conditional information from CGAN [18]. By leveraging the strengths of WGAN-GP, including the utilization of the Wasserstein distance and gradient penalty, and the ability to generate synthetic data that adhere to specific condition(s), WCGAN-GP significantly enhances the synthesis of high-quality synthetic data with desired conditional attributes. This study demonstrated the potential of WCGAN-GP as a promising solution for synthesizing tabular mixed data, ensuring data privacy, and preserving the original statistical properties. Notably, the synthesized data from WCGAN-GP successfully capture the distributions and relationships observed in the original real data. Furthermore, the generated data from WCGAN-GP outperform SMOTE-generated data in classification tasks and data privacy protection. In the medical domain, a study conducted by Abedi et al. [8] employed GAN-based approaches for generating tabular data, comparing the performances of various GANs. The study highlighted that more advanced GAN variants, such as WCGAN-GP, exhibited the best classification accuracy. This underscores the efficacy of employing WCGAN-GP for generating high-quality synthetic medical data for the purpose of this paper.
2.7. Combined Use of SMOTE and GAN
In a more recent study conducted by Sharma et al. [19], they proposed a novel two-phase oversampling approach to treat the class imbalance problem by synthesizing minority class tabular data through iteratively training a GAN with a repertoire of oversamples from the SMOTE-generated input, which replaced the random noise generator in the traditional GAN model [20]. The end result was the generation of minority class data, in which the unrealistic minority class samples from SMOTE were transformed by the GAN into a more realistic sample distribution. According to the authors, this method of oversampling the minority class improved the F-1 score measurements of the classifier compared to performing either SMOTE or GAN methods of minority oversampling individually. Overall, this study highlighted the effectiveness of leveraging both SMOTE and GAN techniques as a hybrid method for addressing the class imbalance problem and generating more realistic minority class samples.
3. Materials and Methods
3.1. Proposed SMOTE and WCGAN-GP Hybrid Model
Building upon these findings, a promising approach emerges for addressing the challenges associated with training GANs on small tabular datasets. Training GANs with small tabular data is difficult because the limited sample sizes prevent a thorough exploration of the complexity inherent in the underlying data distribution. By leveraging the strengths from the latest state-of-art WCGAN-GP and training it on augmented data generated through SMOTE to overcome sample size limitation, it becomes possible to enhance the sample size while preserving the statistical properties of the original data. This combined methodology, which extends beyond the scope of minority class oversampling, holds the potential to generate augmented high-quality data that are both representative and statistically meaningful. Figure 1 illustrates the schematic diagram for the proposed hybrid approach.
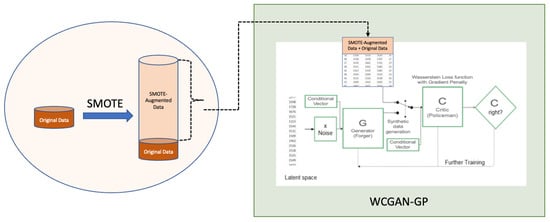
Figure 1.
Architecture of the proposed SMOTE and WCGAN-GP [18] hybrid model.
3.2. Data Acquisition, Data Preprocessing, and Data Description
The small tabular clinical trial dataset used was derived from a clinical trial study conducted by Khoury et al. [21]. The aforementioned clinical trial dataset used in this study was obtained from the ImmPort (Immunology Database and Analysis Portal) website (https://www.immport.org/home, accessed on 2 February 2023). Only the result data, used to calculate the Multiple Sclerosis Functional Composite (MSFC) score for clinically assessing the subjects’ disease progression, together with data on the subjects’ demographics (age and gender), were used and processed for further analysis. Although the demographic dataset also includes an ethnicity feature, it predominantly comprises individuals of Caucasian origin, resulting in limited variation. Consequently, this feature had minimal impact on the analysis and was excluded from further examination. Next, we concatenated the age and gender demographic features with MSFC results, using the subject ID as the index. Data imputation was performed for 8 subjects missing baseline values, by using their data at screening, which were consistent with the final data used by the original authors for their clinical trial study analysis. Moreover, given the closely gapped time interval between the screening visit (day 1) and the baseline visit (day 0), as specified in the clinical study protocol available for reference and download from ImmPort, this imputation was considered reasonable. Finally, column features for subject ID and rows containing the screening phase and unscheduled visits were dropped as they were irrelevant for the further statistical analysis: subject ID was mainly used for indexing and unscheduled visits occurred only in the rare occasion that the subject required urgent safety check-ups and did not contribute to MSFC results. The final cleaned data included eleven column features and 174 rows of data, with three categorical features and eight numerical features. The target class was assigned to the feature of treatment arm and each class was well-balanced with the albuterol arm (n = 84) and placebo arm (n = 90). Hereafter, these final cleaned data are referred to as original data, with the nomenclature of features presented in Table 1. Data preprocessing, cleaning, and the initial evaluation of data quality were performed on a single Mac machine using the Python programming language (Version 3.10.11) within the Jupyter environment in the Google Colaboratory (Colab) virtual cloud platform. This setup was used for all experiments and coding work in this research. We also utilized the implementation of WCGAN-GP available on GitHub (https://github.com/marzekan/WCGAN-GP, accessed on 10 February 2023).

Table 1.
Nomenclature of features in original data.
In the subsequent steps, before running machine learning for SMOTE and WCGAN-GP, it was essential to perform label encoding on each categorical variable in the original data to convert them into numerical format. Specifically, PHASE categories for baseline, Month_6, Month_12, Month_18, and Month_24 were converted to 0, 1, 2, 3, and 4, respectively. For GENDER, 0 was used to replace male, and 1 was used to replace female. For TRT, 0 was used to replace placebo, and 1 to replace albuterol.
3.3. Statistical Analysis of Original Data
The statistical analysis involved comparing the mean MSFC score results at month 6, month 12, month 18, and month 24 between the two treatment arms (placebo and albuterol). To calculate the MSFC scores, the method proposed in the Administration and Scoring Manual for the MSFC [21] was utilized. The baseline mean and baseline standard deviation for the reciprocal of 9-HPT, 25-Foot Walk, and PASAT-3 were obtained by combining baseline data from both treatment arms, following the manual’s recommendation. To compare the mean MSFC scores between the two treatment arms at each PHASE, three statistical tests were utilized: independent two-sample t-test, z-test, and effect size (Cohen’s d).
3.4. Applying Initial SMOTE for Data Augmentation
Approximately 30,000 rows of mixed data types were initially augmented from the original data using three different SMOTE augmentation strategies, for subsequent WCGAN-GP training. The first strategy treated each TRT class as a minority class and applied SMOTE minority oversampling; the second strategy divided the original data into five corresponding PHASE datasets and then performed the same sampling strategy as the first strategy; the third sampling strategy created a new feature that combined PHASE with TRT for a total of 10 different PHASE/TRT classes and then applied SMOTE to each class based on the same ratio as the original data. The SMOTE dataset that most resembled the original data’s statistical pattern in terms of effect size was selected for the WCGAN-GP training.
3.5. WCGAN-GP Model and Hyperparameter Tuning
The WCGAN-GP experiments were implemented using the Keras and TensorFlow frameworks, with the preprocessing of the training dataset (SMOTE data) and hyperparameter tuning based on insights from Walia et al. [18]. The actual size of the SMOTE data used for the WCGAN-GP training was 25,551 row instances, even though 30,000 rows of SMOTE data were available. We found that sample size was sufficient and capable of achieving the quality of data generated from the WCGAN-GP model. Prior to training, the data underwent the following preprocessing transformations in order: standardization, PCA transformation with a variance retention threshold of 0.99, and normalization. These transformations can result in accelerated convergence, improved processing efficiency, and enhanced reproducibility [18]. The hyperparameters were refined through experimentation, and the detailed information about the final optimized model configurations can be found in Table 2.
Table 2.
Critic and generator model configurations implemented for WCGAN-GP.
The WCGAN-GP model was trained on SMOTE data, which poses challenges due to its significant similarity across the feature space, leading to mode collapse, overfitting, instability, and loss explosion during training. To mitigate these issues and also benchmark against [18]’s configuration, hyperparameters were adjusted: a higher random noise of 64 and lambda of 12 to deliver a more diverse range of samples; a higher learning rate of 0.0005 and smaller number of epochs of 500 to discourage overfitting; a higher batch size of 256 and a smaller β1 of 0.05; the use of the Adam optimizer for improved stability; and tanh instead of a linear activation in the generator output to avoid loss explosion. These modifications helped enhance the model’s performance and generate more diverse and higher-quality results.
3.6. Data Generation and Reverse Transformation
Following the WCGAN-GP training, the generator model used the same shape (number of rows) and TRT conditional labels as the SMOTE training data to generate synthetic data samples. This approach ensured that the WCGAN-GP-generated samples aligned with the SMOTE training data in terms of structure while preserving the inherent data similarity captured by the conditional labels. Assuming the model was appropriately trained, the generated data would maintain the same desired data characteristics observed in the training dataset. To ensure the synthetic data closely resembled the real data, the original transformations applied during preprocessing needed to be reversed. This involved implementing inverse transformation steps in the reverse order on the WCGAN-GP-synthesized data. Additionally, generated data for gender were transformed based on the mean value to either 0 or 1; the age was rounded to the nearest whole number; PHASE values were rounded to the nearest 0, 1, 2, 3, or 4 as per the original data’s ordinal values. This final postprocessed data were used in the subsequent comparative analysis to evaluate their similarity with the original data and SMOTE data.
3.7. Comparative Analysis for Data Similarity
To ensure that the WCGAN-GP data preserved the essential characteristics of both the SMOTE-generated data and the original dataset, comprehensive comparative analyses were conducted. These analyses aimed to assess the retention of similarities among the three datasets: SMOTE data, original data, and WCGAN-GP-generated data.
Several visualization techniques were employed to facilitate data similarity interpretation. Correlation heat maps allowed us to examine the interrelationships between features and identify potential patterns in the datasets. Principal components analysis (PCA) scatter plots provided a visual representation of the high-dimensional data in a reduced space, enabling us to explore the overall data structure and any clustering patterns.
Additionally, scatter plots focusing on the two most highly correlated features in relation to the two treatment classes were used to gain insights into the distribution and separation of the samples. Boxplots were employed to visualize the distribution of numerical features, while bar plots provided an overview of the distribution of categorical features.
Furthermore, the statistical analysis of the Multiple Sclerosis Functional Composite (MSFC) scores at months 6, 12, 18, and 24, along with effect size measurements, allowed us to assess the similarity in disease progression patterns across the three datasets.
By using this diverse set of visualizations and statistical analyses, we were able to gain a comprehensive understanding of the data similarities and validate that the WCGAN-GP-generated data adequately captured essential characteristics from both the SMOTE data and the original dataset.
3.8. Classification Performance (Supervised Learning)
If the performance of synthetic data aligns with that of the real data when used for the creation and evaluation of a machine learning model, it can be considered an effective representation of the real data [22]. By inference, WCGAN-GP data would be a good representation of SMOTE data if they performed in the same way as the SMOTE data, when tested in machine learning models. In this research, decision tree, random forest, naïve Bayes, logistic regression, and support vector machine (SVM), classifiers were used with TRT designated as the target label. The SMOTE dataset for classifier machine learning was the same SMOTE data used for WCGAN-GP training; WCGAN’s dataset for classifier machine learning was generated based on Section 3.6; the testing dataset was derived from 15% of the respective datasets as their own entity, from a test–train split. It is important to note that the WCGAN-GP data were generated specifically to match the shape and label ratio of the SMOTE training data. This ensured a consistent comparison between these two datasets. The performance measurements using AUROC and F-1 scores were collected and compared across original, SMOTE, and WCGAN-GP data for a comprehensive analysis.
3.9. K-Means Clustering (Unsupervised Learning)
To assess the suitability of WCGAN-GP-generated data for unsupervised learning and its ability to exhibit similar clustering patterns as the original and SMOTE data, K-means clustering was applied. If the clustering results of the WCGAN-GP data resembled those of the original and SMOTE data, it would demonstrate their similarity to their predecessors and their utility in unsupervised learning. However, GAN-generated data are known for their diversity and potential outliers [18], which can introduce noise and hinder clustering. To address this, a postprocessing of the WCGAN-GP data may be necessary. Two numerical features, WLK1TM and NON1TM, were selected for clustering based on their importance determined through a PCA feature selection. Additionally, using only two numerical features enabled an easier visualization of clusters on a 2-dimensional scatterplot.
3.10. Privacy Metrics Evaluation
The Euclidean distance was used to assess the risk of revealing sensitive information. It helped us understand how similar the records were between different datasets [23]. The Euclidean distance to the nearest record (d) measured the average distance between a synthetic sample and its closest matching record in the original dataset. A distance of zero means that information could potentially leak and privacy could be compromised. The goal was to have a high average distance and a small range of distances. It is important to note that although the Euclidean distance was used as a privacy measure, it only gave an indication of the overall privacy level and did not provide guarantees at the individual record level. The calculation of the Euclidean distance (standard deviation) and identification of any instances of data duplication offered valuable insights into the privacy level of the datasets.
4. Results
4.1. Statistical Analysis of Original Data
The consolidated statistical analysis results shown in Table 3 indicate that at month 6, both the t-test and z-test yielded p-values of 0.029552 and 0.023598, respectively, indicating statistical significance (p < 0.05). These results—at month 6—demonstrate a significant difference in the mean MSFC score between the placebo and albuterol TRT groups. Additionally, month 12 exhibited a higher level of significance compared to both month 18 and month 24, despite the p-values for both tests at month 12 not falling below p < 0.05.
Table 3.
Mean MSFC score statistics between placebo and albuterol per PHASE.
The effective size (Cohen’s d) provided further support for the observed differences between the treatment arms at each PHASE. Specifically, the effect size values aligned with the magnitude of mean differences in the MSFC scores. At month 6, the largest effect size (0.725175) was observed, indicating a substantial mean difference between the two treatment arms. Month 12 exhibited a smaller effect size (0.584823), indicating a lesser degree of difference in the mean MSFC scores compared to month 6. Lastly, both month 18 and month 24 had similarly smaller effect sizes, suggesting smaller mean differences between the treatment arms at those time points.
4.2. SMOTE Data for WCGAN-GP Training
The statistical evaluations for the three different variants of SMOTE-augmented data, as depicted in Section 3.5, were consolidated and are presented in Table 4. Among these variants, the version of the SMOTE data chosen for a further WCGAN-GP training was based on the first SMOTE strategy. This strategy involved alternately augmenting both “TRT (class = 0)” and “TRT (class = 1)” data through minority oversampling. The selected SMOTE data, demonstrated the closest statistical resemblance and pattern to the original data, particularly in terms of its effect size at the four phases. Consequently, it was deemed most suitable for the WCGAN-GP training.
Table 4.
Analysis of effect sizes for six variants of SMOTE-augmented datasets.
The selected SMOTE data’s feature distributions were compared to those of the original data to ensure resemblance and minimal divergence. A comparison of the feature distributions can be found in Figure 2 (corresponding color coded bars), which indicates notable similarities in distribution patterns, except the PHASE 4 category had a lower total percentage in the SMOTE data (2.2189%) compared to the original data (15.5172%).
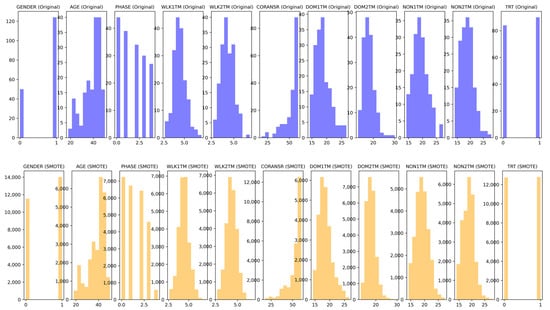
Figure 2.
Comparison of feature distributions: original vs. SMOTE.
4.3. Correlation Heat Map
The correlations between columns in the original data, SMOTE data, and WCGAN-GP data were visualized in a correlation heat map. Figure 3 presents the results, indicating that the column correlations in both the SMOTE data and WCGAN-GP data closely resembled those of the original data.
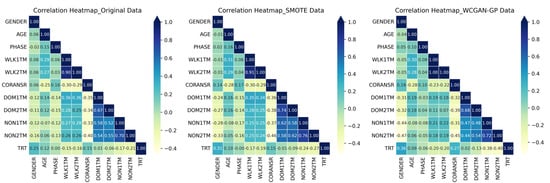
Figure 3.
Correlation heat maps: original, SMOTE, and WCGAN-GP data.
Furthermore, correlation coefficients were computed to compare the means of columns across different datasets. Specifically, the correlation coefficients were calculated between the means of columns in the original data and the SMOTE data, the original data and the WCGAN-GP data, and the SMOTE data and the WCGAN-GP data. These correlation coefficients provided insights into the relationships between the datasets and are presented in Table 5. These high correlation coefficients implied that the SMOTE data and WCGAN-GP data successfully captured the average characteristics and trends of the original data, supporting their effectiveness in generating synthetic data that closely resemble the original data.
Table 5.
Correlation coefficients between means of columns (paired datasets).
4.4. PCA Scatter Plots
Figure 4 displays PCA scatter plots depicting the original data, SMOTE data, and WCGAN-GP data, highlighting the consistent relationships observed within the first two PCA principal components. Notably, this consistent pattern persists across all three datasets, affirming the successful preservation of inherent relationships by both SMOTE and WCGAN-GP within the reduced-dimension PCA space. The findings further demonstrated the WCGAN-GP model’s ability to faithfully reproduce the distribution of the original data through training on the SMOTE data, showcasing the robustness of WCGAN-GP in capturing and preserving the essential characteristics and underlying structure of the original data within the context of PCA. Moreover, the explained variance of principal component 1 and principal component 2 exhibit a high degree of similarity among the three datasets in Figure 4, with the original data’s explained variance of PC1 at 0.53 and PC2 at 0.31 closely mirrored in both SMOTE data (PC1 = 0.56, PC2 = 0.31) and WCGAN-GP data (PC1 = 0.57, PC2 = 0.32).
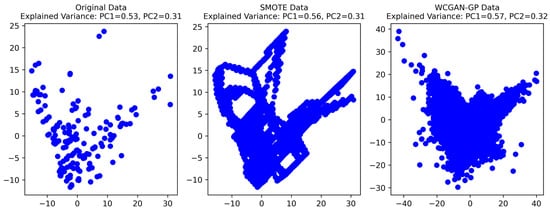
Figure 4.
PCA scatter plots of the original, SMOTE, and WCGAN-GP data.
4.5. Scatter Plot of Features
Figure 5 displays bivariate analysis scatter plots used to examine the relationships between the variables (NON1TM and NON2TM) and the target class (TRT) for the original, SMOTE, and WCGAN-GP data. Both SMOTE- and WCGAN-GP-generated data showed consistent and preserved relationships compared to the original data. Notably, the WCGAN-GP data exhibited an enhanced realism and diversity, indicating the successful avoidance of mode collapse during training. These findings illustrate the WCGAN-GP model’s ability to faithfully reproduce the distributions and provide data with a greater representation of real-world scenarios.
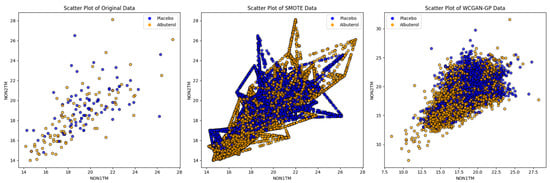
Figure 5.
Bivariate analysis scatter plots of original, SMOTE, WCGAN-GP data.
4.6. Feature Distribution Visualization
The analysis of box plots (Figure 6) across all datasets revealed that the synthesized numerical samples from SMOTE and WCGAN-GP exhibited distributions that closely resembled the original data. Both methods successfully captured fundamental properties such as range, median, and interquartile range (IQR). However, the WCGAN-GP model generated a higher number of outliers in the synthetic data, exhibiting a greater diversity compared to SMOTE. While outliers in the original and SMOTE data were primarily concentrated at one extreme, the WCGAN-GP data displayed outliers at both ends. Notably, the IQR of CORANSR in the WCGAN-GP data deviated more noticeably from the original and SMOTE data. Out of 25551 instances of synthesized WCGAN-GP data, a few data points with negative values (n = 6) for AGE was also observed.
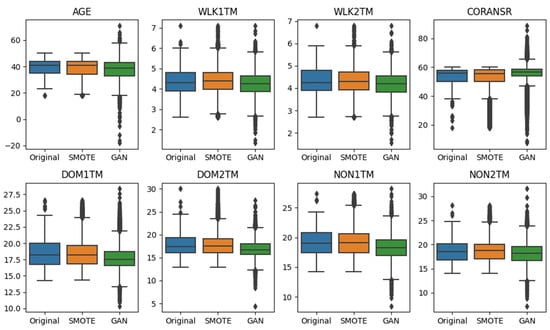
Figure 6.
Box plots of numerical features for original, SMOTE, and WCGAN-GP data.
There were two categorical features, GENDER and PHASE, in the datasets. Figure 7a displays the bar plots representing the GENDER and PHASE distributions in the original data, showing a descending order of counts from baseline to month 6, month 12, month 18, and finally month 24; the original data also revealed a significant gender imbalance, with a larger number of females compared to males.
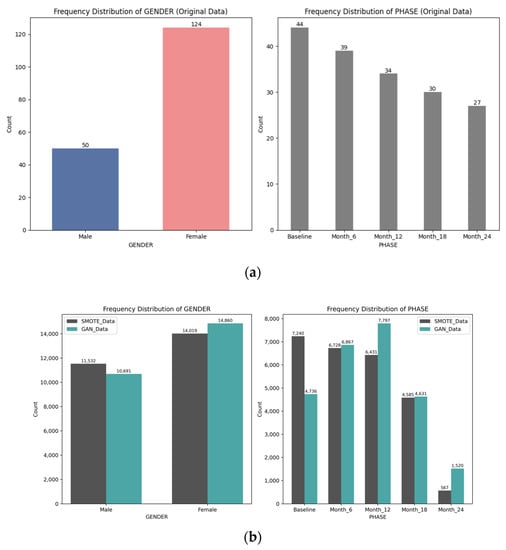
Figure 7.
(a) Bar plots for GENDER and PHASE features in the original data; (b) Bar plots for GENDER and PHASE in SMOTE and WCGAN-GP data.
Figure 7b illustrates the bar plots depicting the GENDER and PHASE distributions in the augmented datasets. The ratio of gender imbalance persisted in both the SMOTE data and the WCGAN-GP data. However, it is worth noting that both synthesized datasets showed a closer balance of GENDER compared to the original data. Regarding the distribution of PHASE, the SMOTE data retained the descending pattern observed in the original data, with counts decreasing from baseline to month 24, albeit with a relatively smaller count at month 24. In contrast, the WCGAN-GP-generated PHASE data exhibited a greater diversity. It displayed a higher count at month 12, deviating from the original distribution, and demonstrated a different pattern overall. Notably, the WCGAN-GP data exhibited a higher count at month 24 compared to the SMOTE data.
4.7. MSFC Statistical Analysis
Table 6 presents the effect sizes between the placebo and albuterol groups for the mean MSFC score at month 6, month 12, month 18, and month 24 in the WCGAN-GP data. These effect sizes were compared to the corresponding effect sizes in the original data and SMOTE data. Additionally, to demonstrate the reproducibility of the WCGAN-GP’s data statistics, five different trial runs of the WCGAN-GP data were generated using the same trained model generator. The statistical pattern observed in the WCGAN-GP-generated data remained consistent with that of the original data and SMOTE data. In general, the highest effect size was observed at month 6, followed by month 12, while nonsignificant effect sizes of small magnitudes were observed at months 18 and 24.
Table 6.
Effect sizes for mean MSFC scores in original, SMOTE, and WCGAN-GP data.
4.8. Classification Performance (Supervised Learning)
The performances of the original, SMOTE, and WCGAN-GP data for machine learning models were evaluated using AUROC and F-1 scores. Table 7 provides a comprehensive comparison of the performance scores achieved by different classifiers when trained on the original, SMOTE, and WCGAN-GP model-generated data. It can be observed in Table 7, that the WCGAN-GP data outperformed the SMOTE data for naïve Bayes, logistic regression, and SVM classifiers, while tree-based classifiers such as the decision tree and random forest performed slightly better for SMOTE data. However, the F-1 scores achieved by the WCGAN-GP data, specifically, 0.944401 for the decision tree and 0.981743 for random forest, still demonstrated an extremely high level of performance.
Table 7.
Performance comparison of classifiers on original, SMOTE, and WCGAN-GP data.
4.9. K-Means Clustering (Unsupervised Learning)
Based on the PCA feature selection, two numerical features (WLK1TM and NON1TM) were identified for K-means clustering—to observe if there were any innate clustering patterns shared across original data, SMOTE data, and WCGAN-GP data. Applying three K-means clusters, determined through the elbow curve method, K-means clustering was visualized with the cluster scatterplots presented in Figure 8. It was observed that WCGAN-GP data failed to generate the same cluster pattern as the original data and SMOTE data.
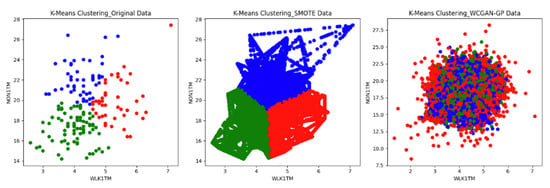
Figure 8.
K-means scatterplots for original, SMOTE, and WCGAN-GP data.
In the second approach, a postprocessing step was undertaken to align the distributions of the two features (WLK1TM and NON1TM) in the WCGAN-GP data with their counterparts in the original data and SMOTE data. This involved removing extreme values below the lower bound (minimum) in the boxplots from the WCGAN-GP data, ensuring a consistency to the distributions of the original data and SMOTE data, which did not exhibit such extreme values. Figure 9 visually depicts the feature distribution before and after the WCGAN-GP data filtering process, demonstrating a substantial enhancement in similarity between the new WCGAN-GP data and the original data, as well as the SMOTE data.
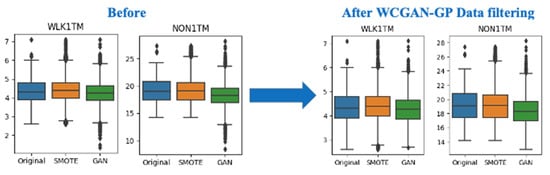
Figure 9.
Box plot comparisons before and after WCGAN-GP data filtration.
Following the treatment of the WLK1TM and NON1TM features in the WCGAN-GP data, a subsequent round of K-means clustering was performed. Figure 10 displays the K-means scatterplots comparing the filtered WCGAN-GP data with the original data and SMOTE data. Upon applying K-means clustering to the filtered WCGAN-GP data, the resulting scatterplots revealed a retained cluster pattern, signifying a higher level of overall similarity. This observation highlights the effectiveness of the straightforward WCGAN-GP data postprocessing in maintaining the desired data characteristics.
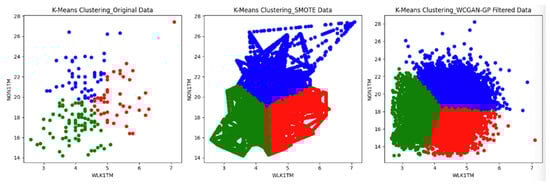
Figure 10.
K-means scatterplots for original, SMOTE, and filtered WCGAN-GP data.
4.10. Privacy Metrics Evaluation
Table 8 reveals no duplicate rows in any of the comparisons, ensuring data integrity and privacy. The average of Euclidean distances to the nearest neighbors were 1.0767 (original/SMOTE) and 1.5919 (original/WCGAN-GP). Standard deviations of these distances were 0.5965 (original/SMOTE) and 0.6015 (original/WCGAN-GP), reflecting data dispersion. Overall, WCGAN-GP data exhibited higher privacy levels than SMOTE data when compared with the original data.
Table 8.
Privacy level of SMOTE and WCGAN-GP data.
5. Discussion
The objective of this research was to generate synthetic data that faithfully represented the original small tabular dataset. To achieve this, we employed a novel hybrid approach by training a WCGAN-GP model on SMOTE-augmented data derived from a small tabular clinical trial dataset with mixed data types. To the best of our knowledge, we are the first apply this hybrid approach for mass oversampling of a small tabular dataset, specifically focusing on small tabular clinical trial datasets.
The success of this approach was demonstrated by comparing results of various similarity metrics (Section 4.2, Section 4.3, Section 4.5, Section 4.6 and Section 4.7), which revealed an overall likeness between the generated synthetic data and the original dataset. Moreover, it was observed that while SMOTE data more accurately captured the similarity with the original data thanks to its technique of interpolating between preexisting data, depictions from Figure 4, Figure 5, Figure 6 and Figure 7 and Table 6 revealed that the WCGAN-GP data trained on SMOTE data introduced more diverse patterns in the feature representation compared to SMOTE augmentation alone. The presence of more diverse patterns in the data is a positive attribute, indicating a greater representation of real-world scenarios and generalizability of data. GANs, in general, excel at overcoming the limitations of traditional methods—statistical methods or SMOTE—by introducing a generator and discriminator architecture that compete in a two-player game, enabling them to capture complex patterns and produce diverse data, thereby providing a more varied representation of the original data. Furthermore, the limitation of data size was also surpassed by first augmenting the original small tabular dataset with an initial SMOTE process, enabling a more stable WCGAN-GP training. This initial SMOTE augmentation allowed for a more comprehensive exploration of the data’s underlying distribution and contributed to the overall success of the WCGAN-GP synthetic data generation process.
Historically, augmenting small tabular datasets may not be commonly pursued due to the perceived lack of complexity and depth within such data. Hence, a clinically meaningful small tabular clinical trial dataset from a published clinical trial research [20] with representative statistical significance was used in this research to demonstrate the proposed hybrid method. Furthermore, the combination of SMOTE and GAN techniques for small tabular data augmentation had been limited in previous studies. Existing research primarily focuses on addressing class imbalance issues by using SMOTE for minority class oversampling combined with simpler GAN models, to generate higher-quality minority class data to correct data imbalance and improve machine learning.
Evidently, developing a GAN model solely relying on SMOTE-augmented data from small tabular datasets is uncommon due to concerns of overfitting and loss of generalization. The indiscriminate application of SMOTE for oversampling all classes may introduce synthetic samples that do not accurately represent the underlying data distribution. This research addressed this challenge by closely testing and monitoring the result from different SMOTE sampling strategies that best preserved the original data’s distribution and statistical properties. This research, therefore, was able to target the mass oversampling of an entire small tabular dataset using SMOTE, going beyond its conventional application for minority class oversampling, for subsequent WCGAN-GP training.
Furthermore, to mitigate overfitting during the WCGAN-GP training with SMOTE-augmented data, an extensive hyperparameter tuning of the WCGAN-GP model was conducted. This involved adjusting the random noise, activation function, learning rate, batch size, penalty gradient lambda, training epochs, and hidden layer node numbers to effectively capture the data’s complexity within a shorter training period. While this study observed that the implemented hyperparameters were optimal for the studied dataset, it may be different for other data structures; however, it can still serve as a good framework for future studies.
By closely monitoring the steps taken in this hybrid approach, it was observed that the final WCGAN-GP data exhibited meaningful and similar properties to the SMOTE data and the original small tabular dataset. The WCGAN-GP data also provided a more diverse data pattern, which could potentially imply a more realistic representation of multiple sclerosis outcome. However, as observed in Section 4.6, the numerical feature distribution for CORANSR exhibited a more noticeable deviation in its IQR compared to the original and SMOTE data. This deviation is likely due to the original data’s negatively skewed distribution for CORANSR, posing a more considerable challenge for training the WCGAN-GP model. Additionally, very few instances of age attaining negative values from the WCGAN-GP data indicated the need for data postprocessing to ensure practical applicability.
Interestingly, when examining the effect size of the statistical analysis comparison results in Table 6 (Section 4.7) among the original, SMOTE, and WCGAN-GP data, it was observed that the original data and SMOTE data exhibited a closer statistical similarity with each other. On the other hand, the WCGAN-GP data demonstrated a more diverse data pattern, potentially indicative of a more nuanced representation of the multiple sclerosis outcome, where a more pronounced reduction in treatment effect over time could be inferred. Although this observation is intriguing, it requires further validation against a larger and more diverse real-world population of patients to ascertain its real-world applicability and implications regarding treatment effectiveness over time and potential drug desensitization.
Nevertheless, this preservation of overall similarity, along with the augmented sample size, offers a significant utility for further applications in machine learning and overcoming the limitations of data constraint. Notably, the machine learning performance for AUROC and F1 scores across all models tested was higher for the WCGAN-GP data compared to the SMOTE data, except for tree-based classifiers where the SMOTE data marginally outperformed.
One main reason tree-based classifiers tend to perform better with SMOTE data compared to WCGAN-GP data is their ability to generate synthetic samples that are interpolated between existing instances, resulting in a more pronounced representation of the underlying data distribution. This process enhances the separability between different classes, allowing tree-based classifiers to create decision boundaries that effectively discriminate between the classes. On the other hand, the diversity introduced by the WCGAN-GP model in generating synthetic data can lead to more complex decision boundaries, making it relatively more challenging for tree-based classifiers to accurately classify the WCGAN-GP data.
However, it is noteworthy that logistic regression, naïve Bayes, and SVM classifiers still surpassed the SMOTE data’s performance. These findings provide valuable insights despite the study’s inherent limitations stemming from the initial small tabular dataset.
It is also worth noting that after applying basic postprocessing and treatment to the selected WCGAN-GP data features, similar clustering patterns were observed when subjecting it to unsupervised K-means clustering machine learning, as seen with the original small tabular data and SMOTE data. This observation demonstrates two important points: first, the inherent data properties of the WCGAN-GP data were preserved; secondly, by simply applying postprocessing techniques to the WCGAN-GP data, it can also be effectively utilized for unsupervised learning, yielding clustering results comparable to those obtained with the original and SMOTE data.
Additionally, with regards to data protection, WCGAN-GP data also provided a higher levels of data privacy compared to SMOTE-augmented data. This advantage of WCGAN-GP may help facilitate the dissemination of more sensitive data—especially in the healthcare domain. In conclusion, this research successfully generated synthetic data that accurately represented the original small tabular clinical trial dataset. The hybrid approach combining SMOTE augmentation with WCGAN-GP yielded meaningful and similar properties, overcoming the limitations encountered when augmenting a small tabular dataset.
Overall, this research successfully generated synthetic data that accurately represented the characteristics of the original small tabular clinical trial dataset. The hybrid approach, which combined SMOTE augmentation with WCGAN-GP training, effectively addressed the challenges associated with augmenting small tabular datasets through GANs. These findings emphasize the potential of data augmentation techniques in addressing data scarcity challenges, particularly in industries with limited data availability. The study also highlights the significance of this hybrid approach, as it not only augments the quantity but also preserves the quality and pattern of the original data. Furthermore, it enables the generation of more diverse and realistic data, enhancing its applicability in real-world scenarios.
The implications of these findings, combining this novel hybrid approach with an experimental small tabular clinical trial dataset, extend beyond the scope of this study. The WCGAN-GP-generated data demonstrated in this research has the potential to aid machine learning models and address data limitations in healthcare domains, where data are often inaccessible due to privacy protection regulations. Furthermore, synthesized data can facilitate a more meaningful analysis and utilization in clinical research settings. For instance, it can supplement the lack of data relating to clinical trial research, especially when enrolling patients with rare diseases is challenging. Additionally, it can serve as a substitute dataset for a placebo control group in clinical trial research, where it may be unethical to withhold proper treatment from patients. Moreover, the trained WCGAN-GP model enables anomaly detection, allowing the identification and removal of data that deviate from the generated data, thereby improving quality control during clinical trial data collection. These examples offer only a glimpse into the vast array of potential applications.
6. Avenues for Future Research
While our study demonstrates a significant progress in generating synthetic data for small tabular clinical trial datasets using a hybrid SMOTE and WCGAN-GP approach, it serves as a preliminary proof of concept. To enhance this methodology, future research can explore various aspects. To begin with, the versatility of the hybrid approach should be evaluated on a broader spectrum of small datasets, revealing its adaptability across diverse data types and structures. The refinement of the initial SMOTE augmentation can involve investigating different SMOTE strategies and variants such as SMOTE-NC, borderline SMOTE, and ADASYN, which could better preserve the original data characteristics for an improved WCGAN-GP training. Advancing the WCGAN-GP model to integrate more intricate architectures, such as multiple conditional variables, shows strong potential. In the context of clinical trials, this expansion could involve including subject IDs or other categorical features as supplementary conditions, offering the possibility of exploring a broader range of analytical objectives. However, it is crucial to emphasize that these implementations of this hybrid approach must still consider the careful selection of robust small tabular datasets, thorough data preprocessing, thoughtful WCGAN-GP hyperparameter tuning, and in-depth analysis. These steps ensure the synthesized data’s quality, interpretability, and usefulness across diverse data types. In summary, our current study represents a promising step, yet further research is required to refine and expand the proposed methodology for broader datasets and to address the intricacies inherent to various data domains.
Author Contributions
Conceptualization, W.W. and T.-W.P.; methodology, W.W.; software, W.W.; validation, T.-W.P.; formal analysis, W.W.; investigation, T.-W.P.; resources, T.-W.P.; data curation, W.W.; writing—original draft preparation, W.W. and T.-W.P.; writing—review and editing, W.W. and T.-W.P.; visualization, W.W.; supervision, T.-W.P.; project administration, W.W.; funding acquisition, T.-W.P. All authors have read and agreed to the published version of the manuscript.
Funding
This research was funded by the National Science and Technology Council, Taiwan, under grant number MOST 111-2221-E-027-113-MY2.
Institutional Review Board Statement
Ethical review and approval were waived for this study as it solely involved the analysis and data augmentation of publicly available data obtained from a clinical trial conducted by [20] in accordance with the Declaration of Helsinki and approved by The Institutional Review Board at the Brigham and Women’s Hospital, Boston, Massachusetts.
Informed Consent Statement
Informed consent was obtained from all subjects involved in the original clinical trial conducted by [20]. The data used in this study are anonymized and publicly available; therefore, additional informed consent was not required.
Data Availability Statement
Publicly available datasets were analyzed in this study. These data can be found at https://www.immport.org/shared/study/SDY471 (accessed on 2 February 2023).
Conflicts of Interest
The authors declare no conflict of interest.
References
- Xu, L.; Veeramachaneni, K. Synthesizing Tabular Data using Generative Adversarial Networks. arXiv 2018, arXiv:1811.11264. [Google Scholar]
- Karras, T.; Aittala, M.; Hellsten, J.; Laine, S.; Lehtinen, J.; Aila, T. Training generative adversarial networks with limited data. In Proceedings of the 34th Conference on Neural Information Processing Systems (NeurIPS 2020), Vancouver, BC, Canada, 6–12 December 2020. [Google Scholar]
- Frid-Adar, M.; Diamant, I.; Klang, E.; Amitai, M.; Goldberger, J.; Greenspan, H. Synthetic Data Augmentation using GAN for Improved Liver Lesion Classification. In Proceedings of the 2018 IEEE 15th International Symposium on Biomedical Imaging (ISBI 2018), Washington, DC, USA, 4–7 April 2018; pp. 289–293. [Google Scholar] [CrossRef]
- Chawla, N.V.; Bowyer, K.W.; Hall, L.O.; Kegelmeyer, W.P. SMOTE: Synthetic Minority Over-sampling Technique. J. Artif. Intell. Res. 2002, 16, 321–357. [Google Scholar] [CrossRef]
- Data Science Campus. Available online: https://datasciencecampus.ons.gov.uk/projects/synthetic-data-for-public-good/ (accessed on 3 March 2023).
- Hu, F.; Li, H. A Novel Boundary Oversampling Algorithm Based on Neighborhood Rough Set Model: NRSBoundary-SMOTE. Math. Probl. Eng. 2013, 2013, 694809. [Google Scholar] [CrossRef]
- Goodfellow, I.; Pouget-Abadie, J.; Mirza, M.; Xu, B.; Warde-Farley, D.; Ozair, S.; Courville, A.; Bengio, Y. Generative Adversarial Nets. Adv. Neural Inf. Process. Syst. 2014, 27, 2672–2680. [Google Scholar]
- Abedi, M.; Hempel, L.; Sadeghi, S.; Kirsten, T. GAN-Based Approaches for Generating Structured Data in the Medical Domain. Appl. Sci. 2022, 12, 7075. [Google Scholar] [CrossRef]
- Karras, T.; Aila, T.; Laine, S.; Lehtinen, J. Progressive Growing of GANs for Improved Quality, Stability, and Variation. arXiv 2017, arXiv:1710.10196. [Google Scholar]
- Li, J.; Monroe, W.; Shi, T.; Jean, S.; Ritter, A.; Jurafsky, D. Adversarial Learning for Neural Dialogue Generation. arXiv 2017, arXiv:1701.06547. [Google Scholar]
- Radford, A.; Metz, L.; Chintala, S. Unsupervised Representation Learning with Deep Convolutional Generative Adversarial Networks. arXiv 2015, arXiv:1511.06434. [Google Scholar]
- Salimans, T.; Goodfellow, I.; Zaremba, W.; Cheung, V.; Radford, A.; Chen, X. Improved Techniques for Training GANs. Adv. Neural Inf. Process. Syst. 2016, 29, 2234–2242. [Google Scholar]
- Mirza, M.; Osindero, S. Conditional Generative Adversarial Nets. arXiv 2014, arXiv:1411.1784. [Google Scholar]
- Xu, L.; Skoularidou, M.; Cuesta-Infante, A.; Veeramachaneni, K. Modeling Tabular Data Using Conditional GAN. arXiv 2019, arXiv:1907.00503. [Google Scholar]
- Medium. Available online: https://towardsdatascience.com/how-to-generate-real-world-synthetic-data-with-ctgan-af41b4d60fde (accessed on 10 March 2023).
- Arjovsky, M.; Chintala, S.; Bottou, L. Wasserstein GAN. arXiv 2017, arXiv:1701.07875. [Google Scholar]
- Gulrajani, I.; Ahmed, F.; Arjovsky, M.; Dumoulin, V.; Courville, A. Improved Training of Wasserstein GANs. arXiv 2017, arXiv:1704.00028. [Google Scholar]
- Walia, M.; Tierney, B.; McKeever, S. Synthesising Tabular Data using Wasserstein Conditional GANs with Gradient Penalty (WCGAN-GP). In Proceedings of the AICS 2020: 28th Irish Conference on Artificial Intelligence and Cognitive Science, Dublin, Ireland, 7–8 December 2020. [Google Scholar]
- Sharma, A.; Singh, P.K.; Chandra, R. SMOTified-GAN for Class Imbalanced Pattern Classification Problems. IEEE Access 2022, 10, 30655–30665. [Google Scholar] [CrossRef]
- Khoury, S.J.; Healy, B.C.; Kivisäkk, P.; Viglietta, V.; Egorova, S.; Guttmann CR, G.; Wedgwood, J.F.; Hafler, D.A.; Weiner, H.L.; Buckle, G.; et al. A Randomized Controlled Double-Masked Trial of Albuterol Add-on Therapy in Patients with Multiple Sclerosis. Arch. Neurol. 2010, 67, 1055–1061. [Google Scholar] [CrossRef] [PubMed]
- Fischer, J.S.; Jak, A.J.; Knicker, J.E.; Rudick, R.A.; Cutter, G. Multiple Sclerosis Functional Composite (MSFC) Administration and Scoring Manual (Revised October 2001); National Multiple Sclerosis Society: New York, NY, USA, 2001. [Google Scholar]
- Heyburn, R.; Bond, R.; Black, M.; Mulvenna, M.; Wallace, J.; Rankin, D.; Cleland, B. Machine Learning Using Synthetic and Real Data: Similarity of Evaluation Metrics for Different Healthcare Datasets and for Different Algorithms. In Proceedings of the Data Science and Knowledge Engineering for Sensing Decision Support: Proceedings of the 13th International FLINS Conference (FLINS 2018), Ireland, UK, 21–24 August 2018; Volume 11, pp. 1281–1291. [Google Scholar]
- Park, N.; Mohammadi, M.; Gorde, K.; Jajodia, S.; Park, H.; Kim, Y. Data Synthesis Based on Generative Adversarial Networks. arXiv 2018, arXiv:1806.03384. [Google Scholar] [CrossRef]
Disclaimer/Publisher’s Note: The statements, opinions and data contained in all publications are solely those of the individual author(s) and contributor(s) and not of MDPI and/or the editor(s). MDPI and/or the editor(s) disclaim responsibility for any injury to people or property resulting from any ideas, methods, instructions or products referred to in the content. |
© 2023 by the authors. Licensee MDPI, Basel, Switzerland. This article is an open access article distributed under the terms and conditions of the Creative Commons Attribution (CC BY) license (https://creativecommons.org/licenses/by/4.0/).