
Quality Control Impacts on Total Precipitation Gauge Records for Montane Valley and Ridge Sites in SW Alberta, Canada


Abstract
:1. Summary
2. Data Description
3. Methods
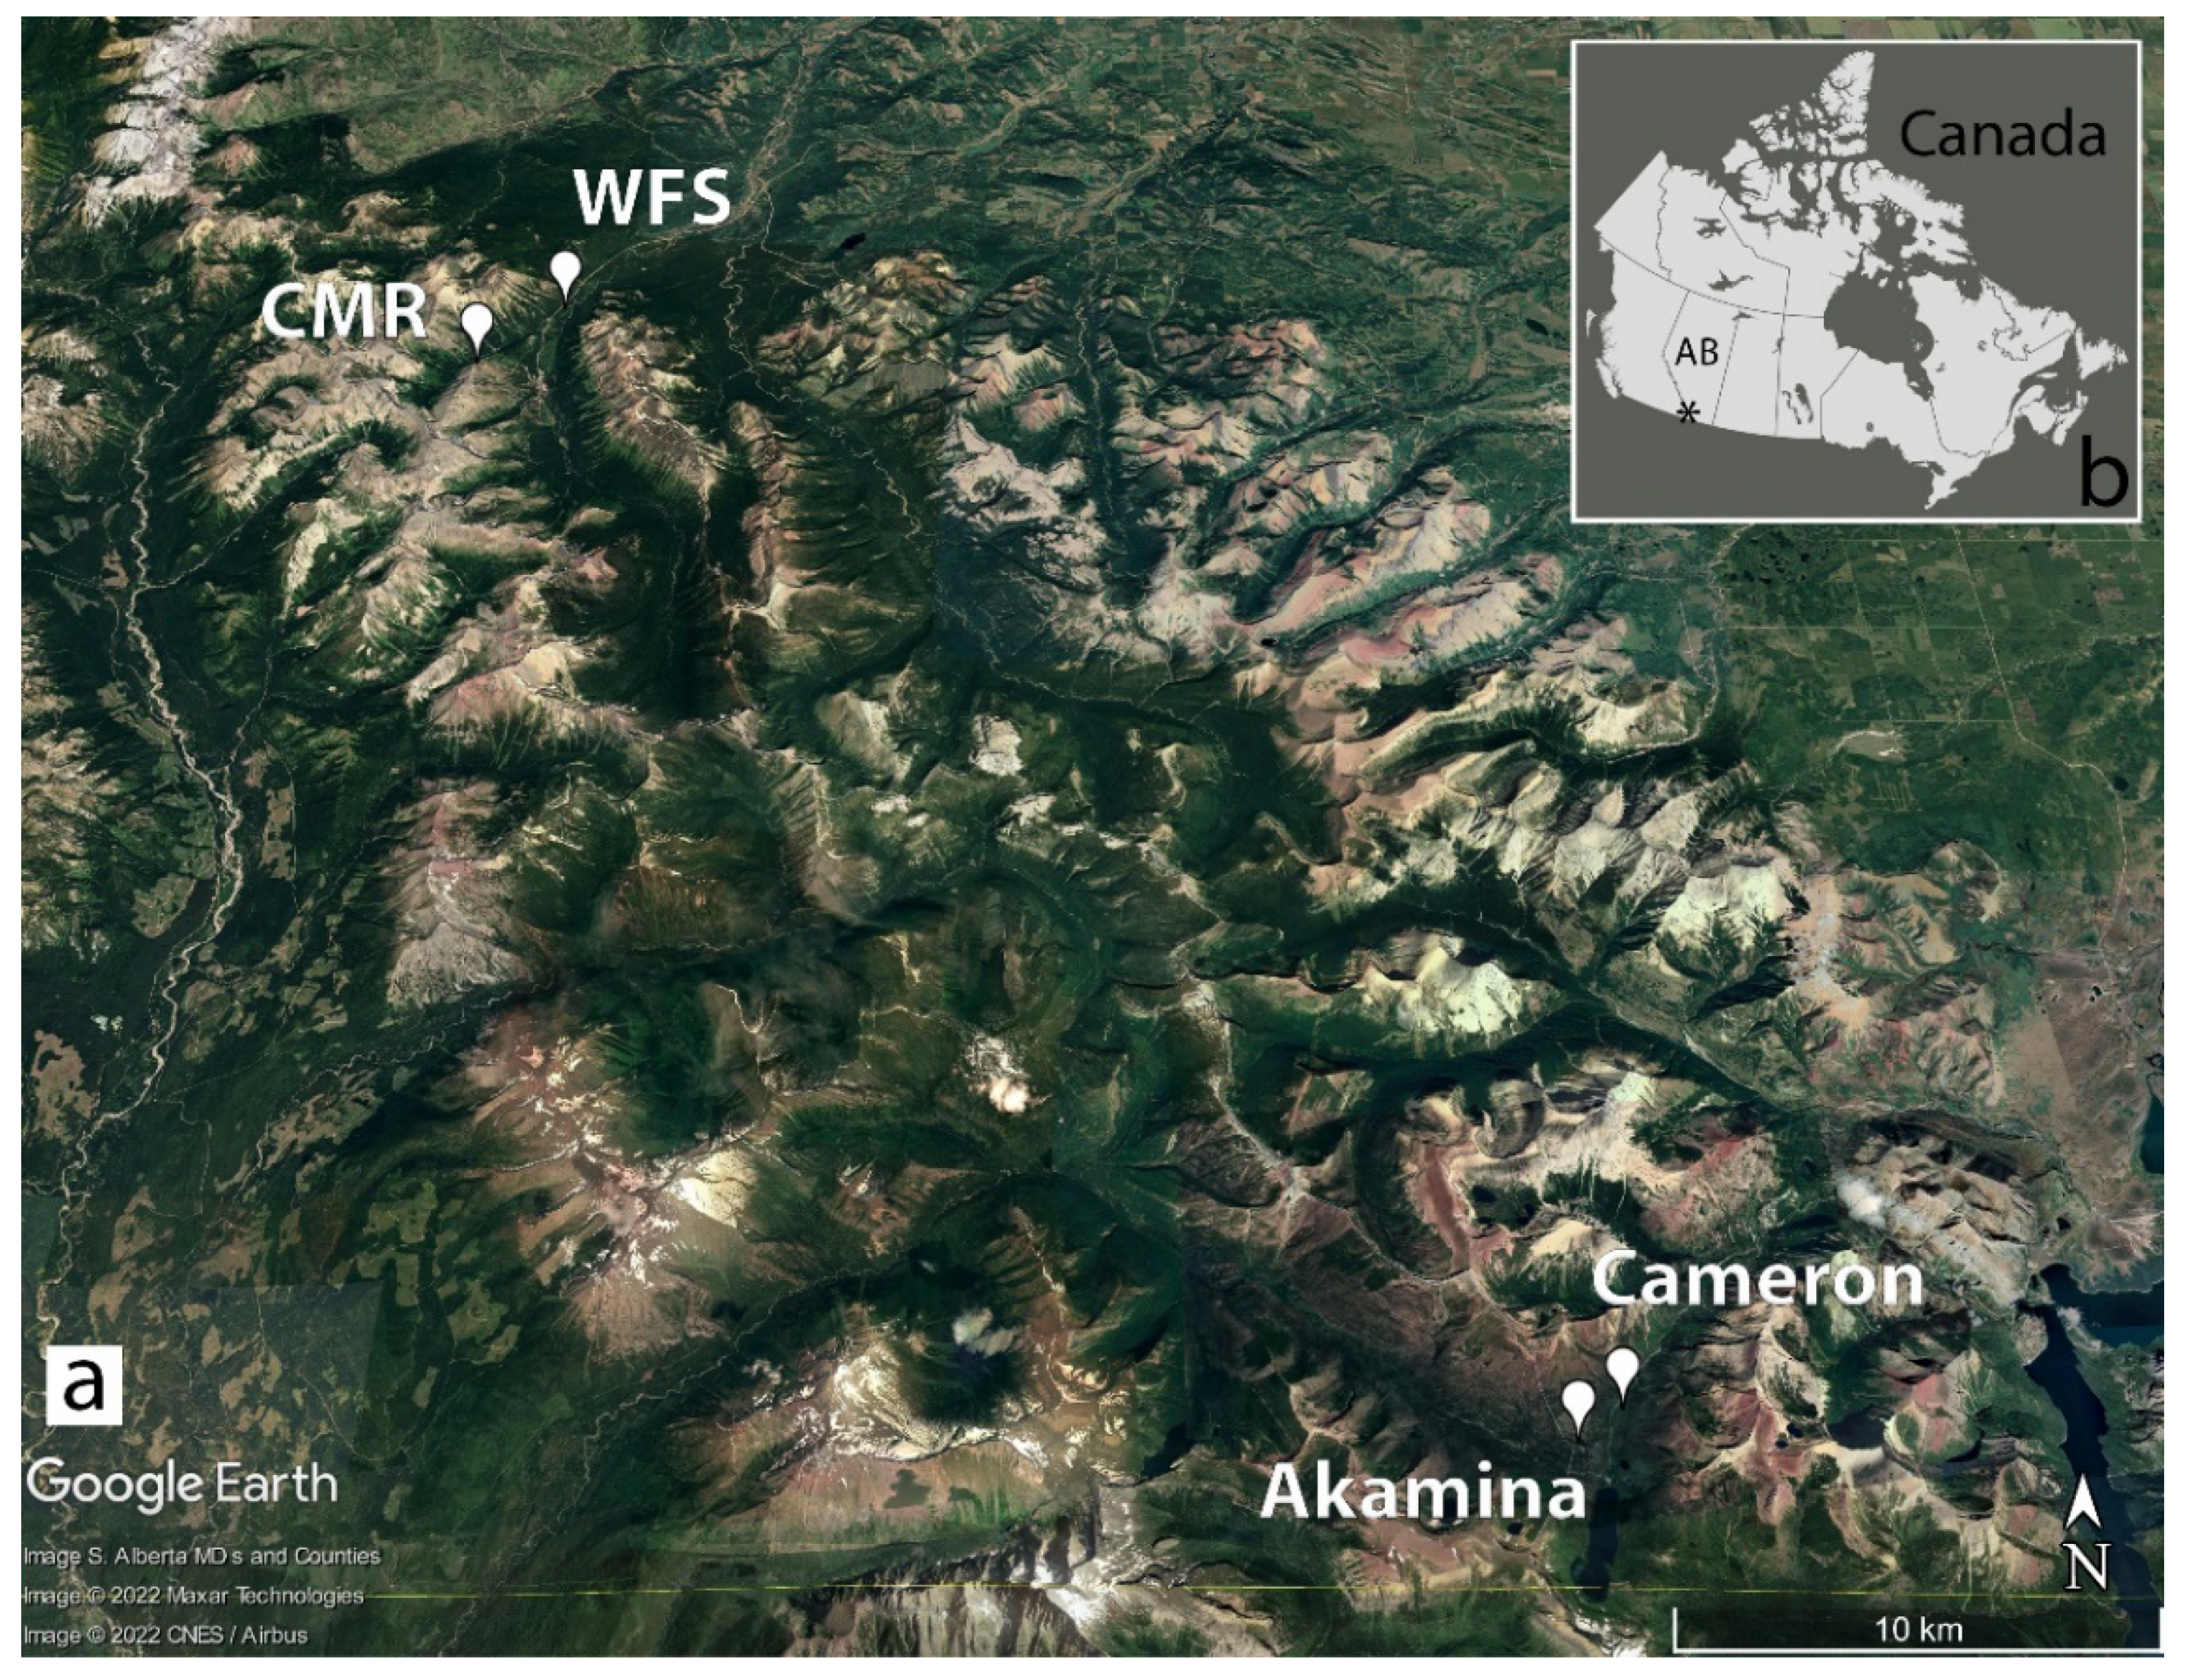
3.1. Study Area
3.2. Sensor Specifications
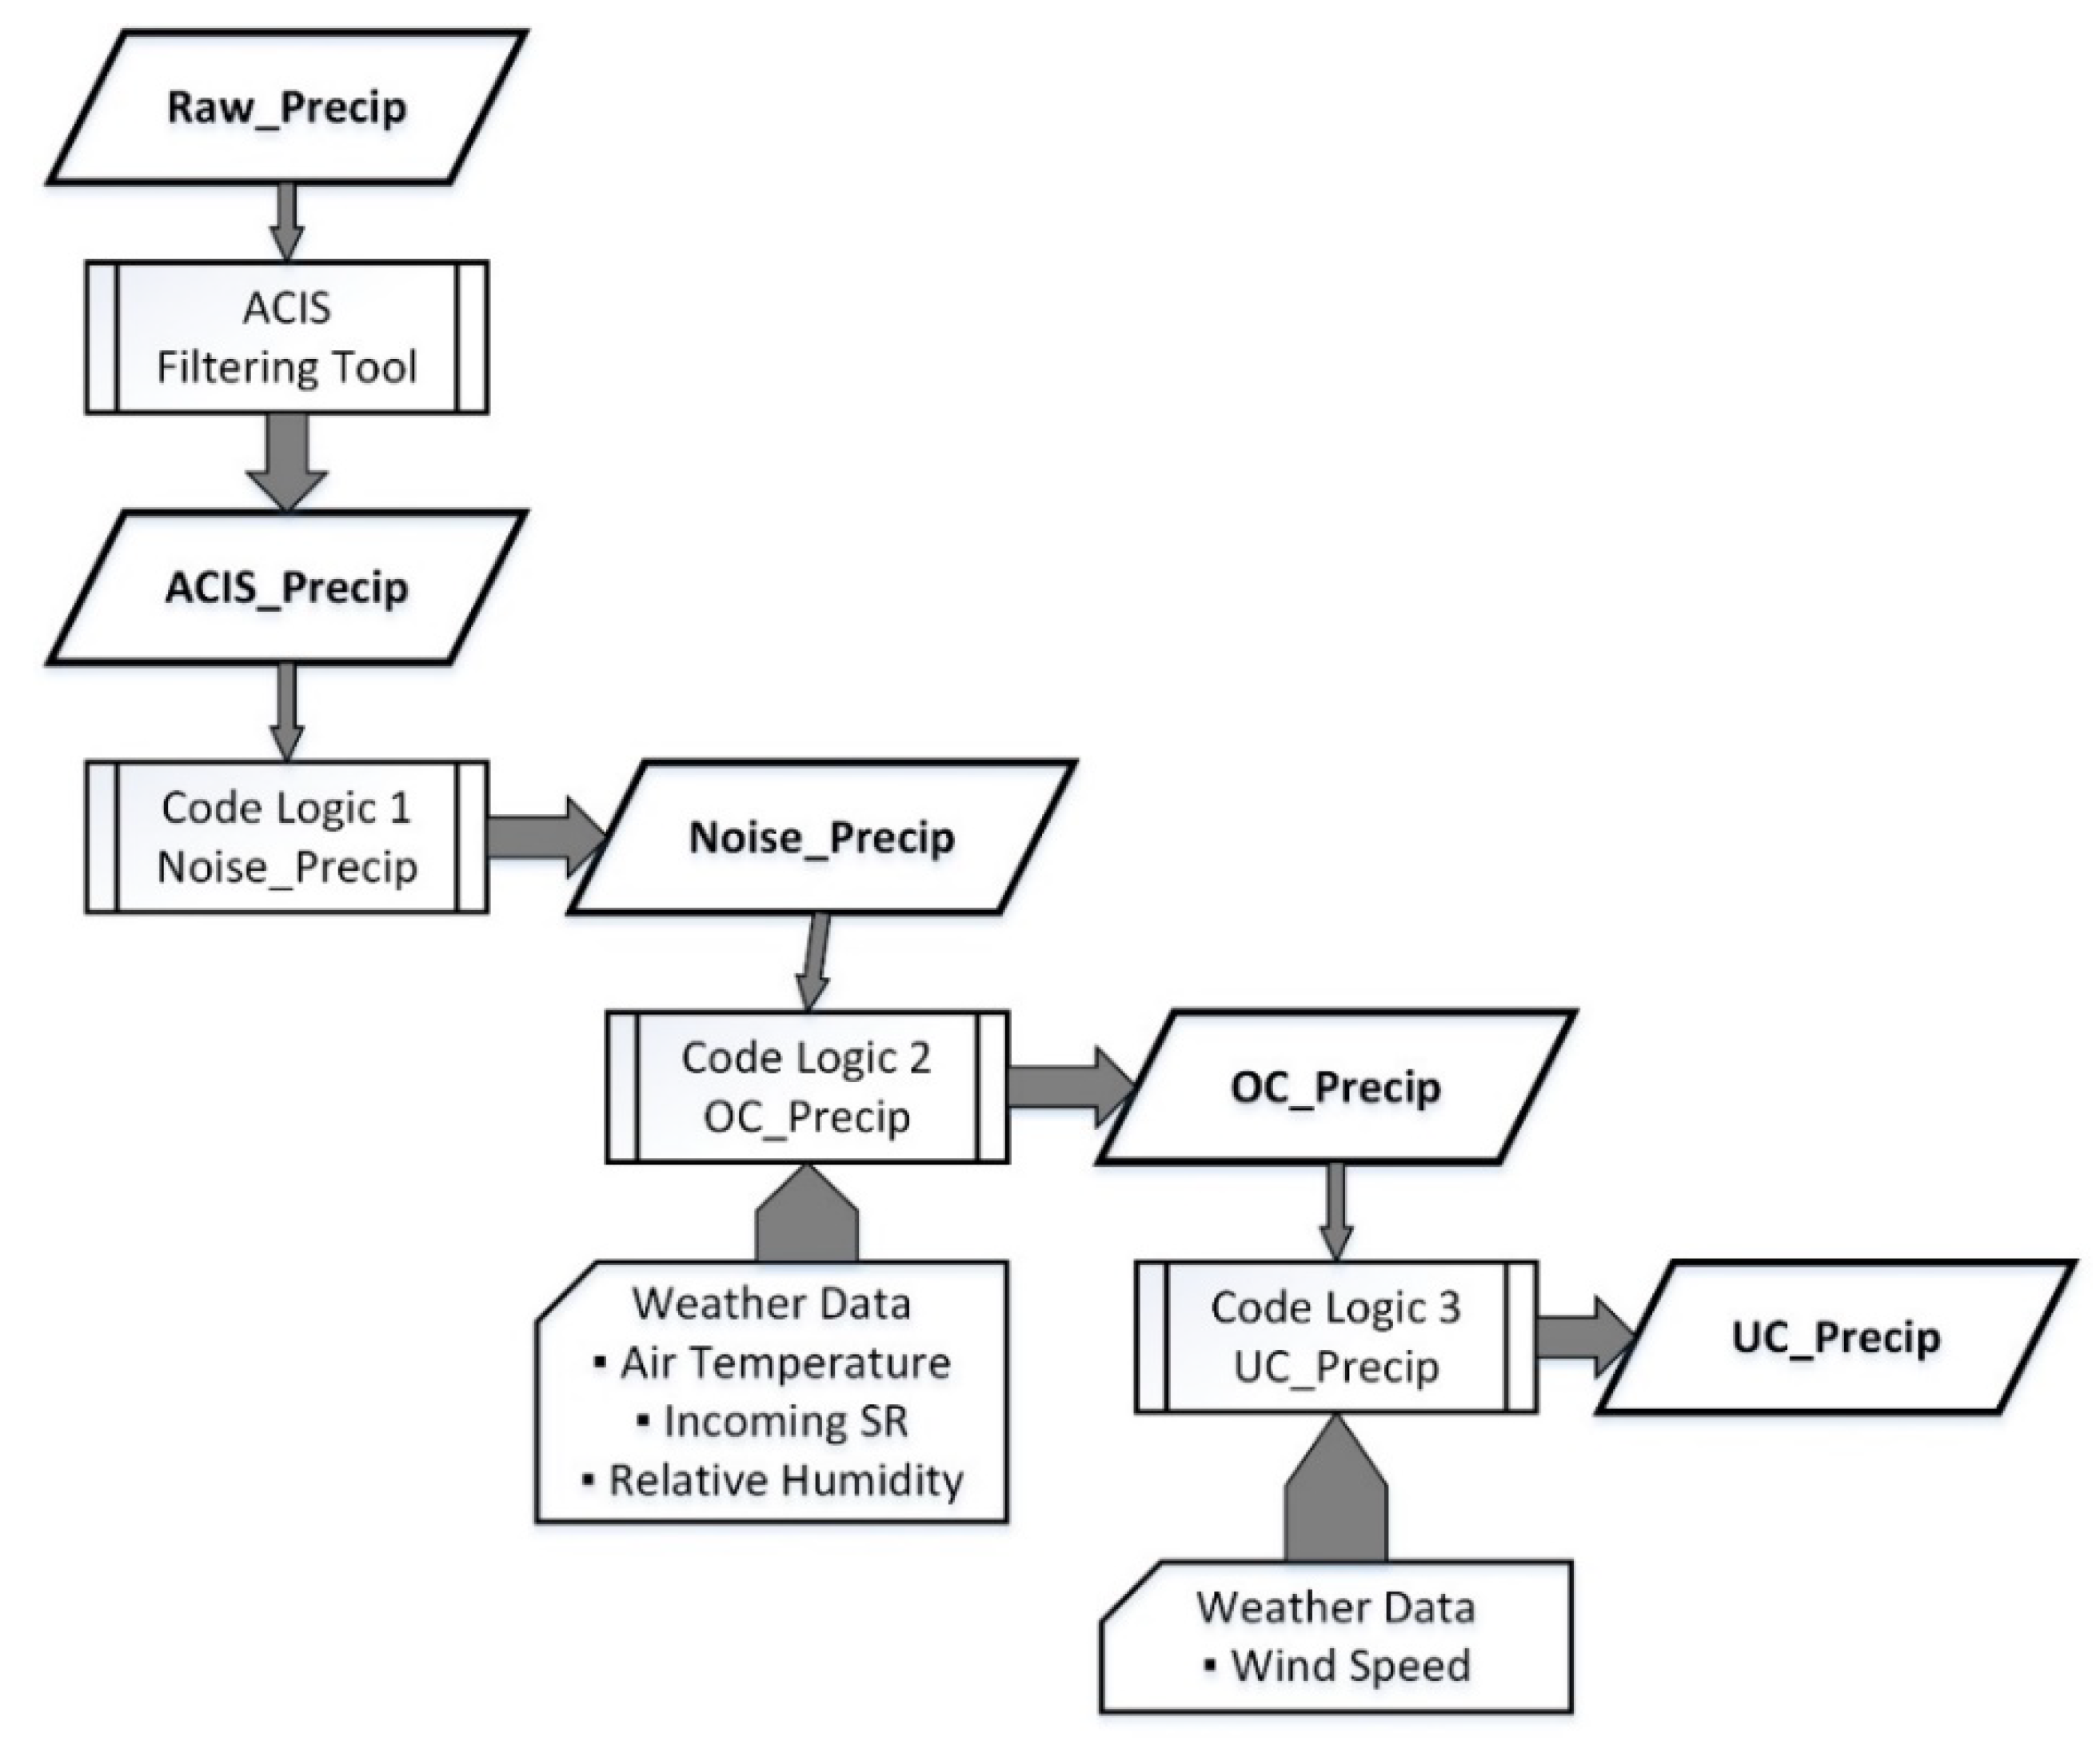
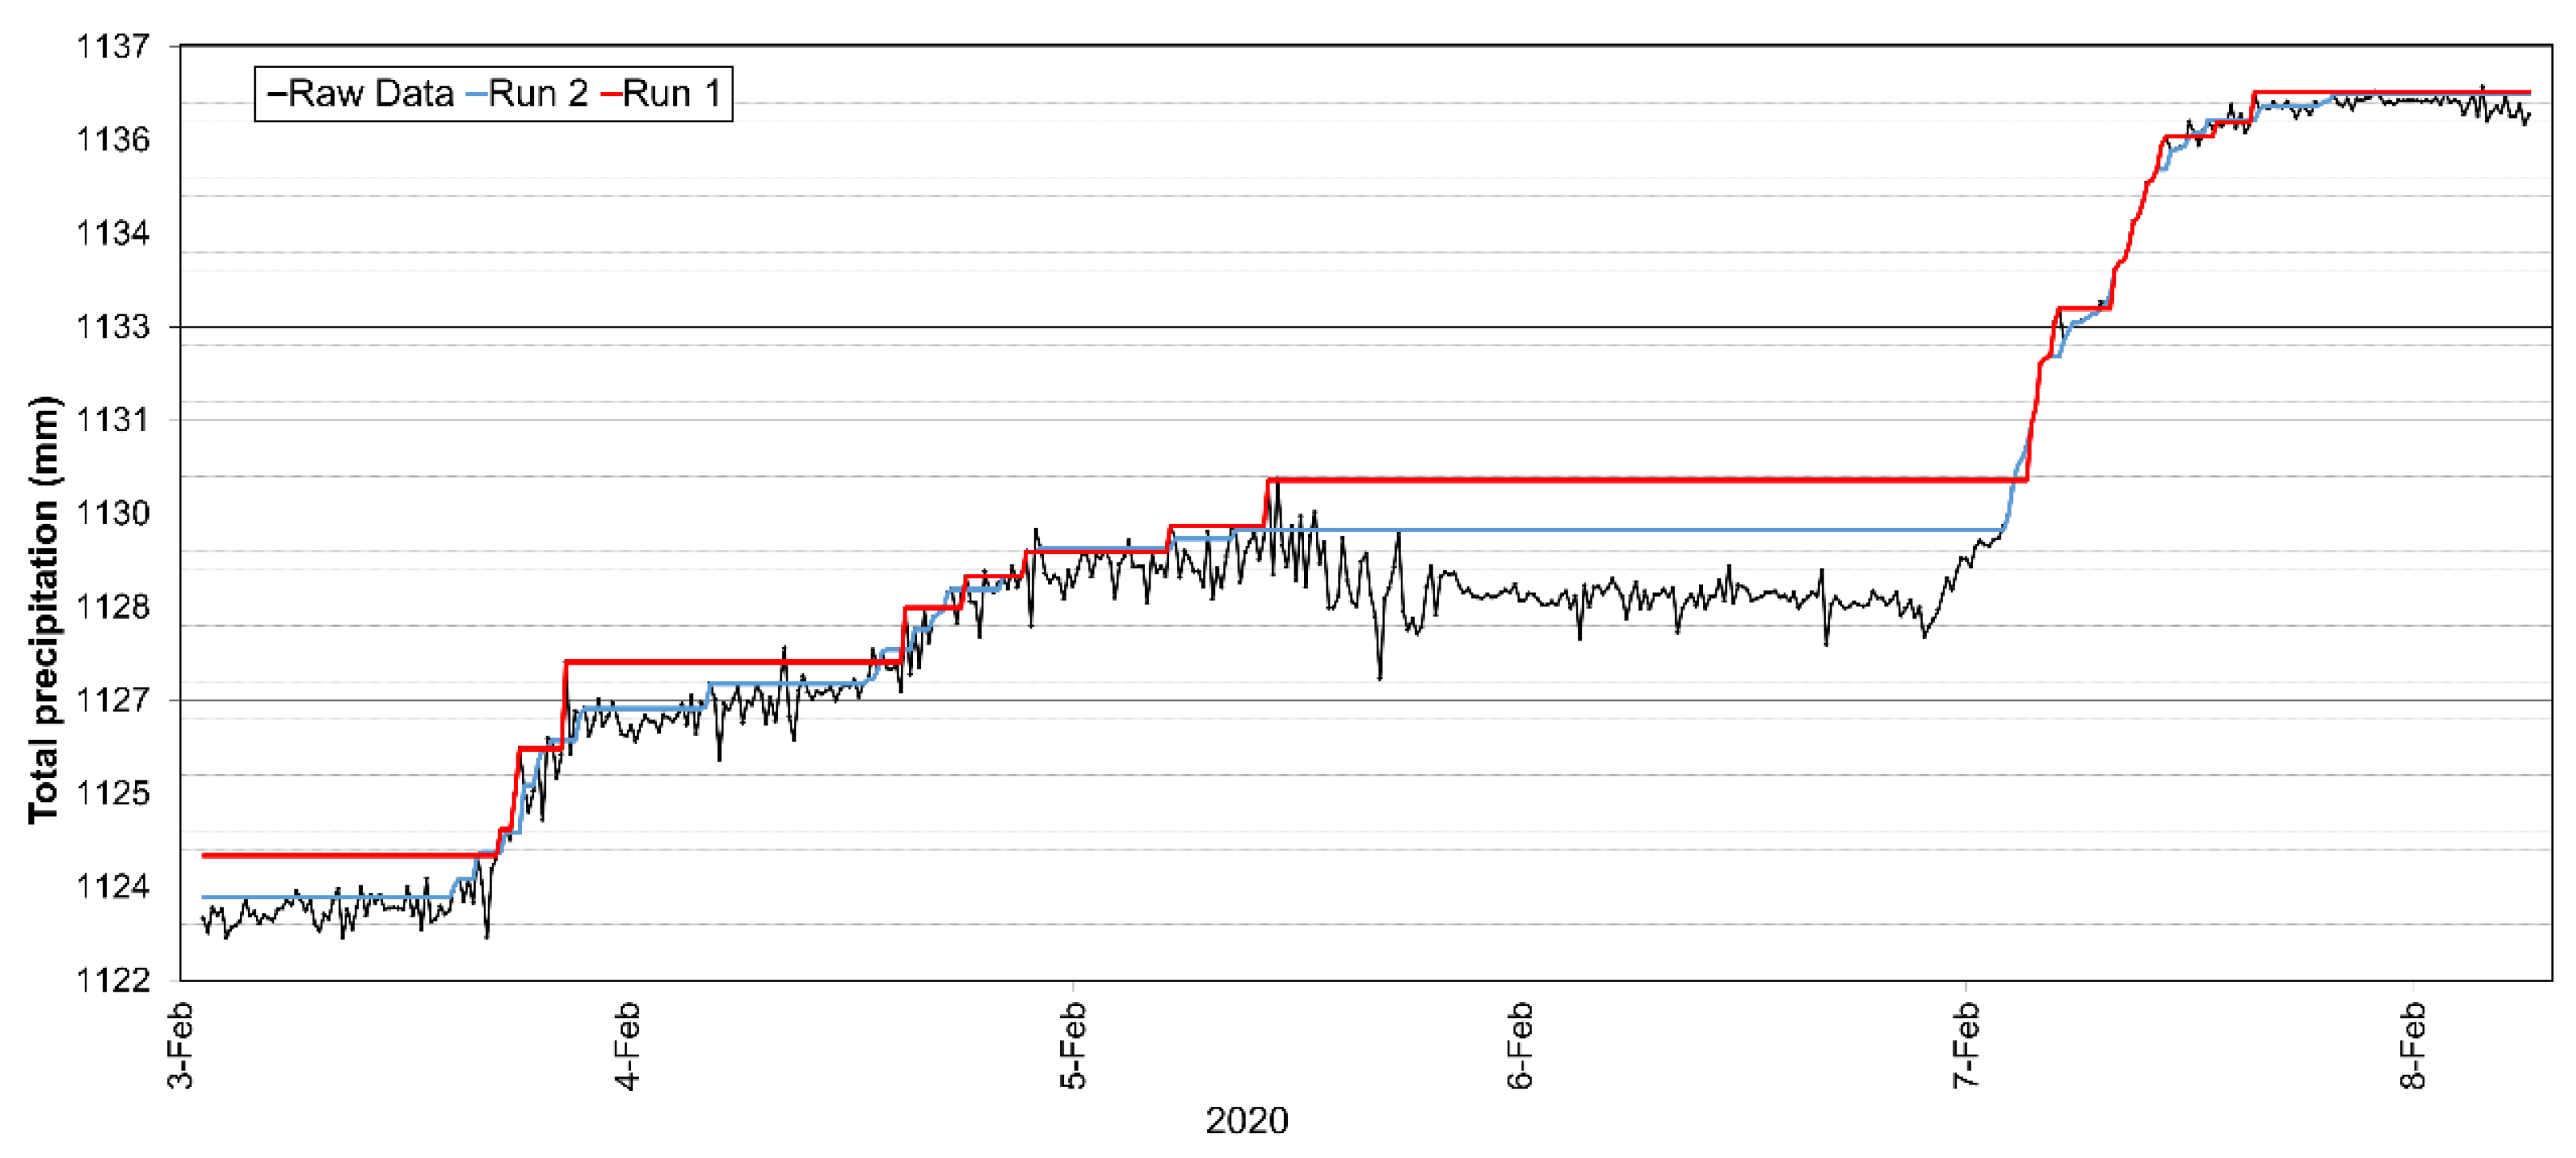
3.3. Data Cleaning and Quality Control
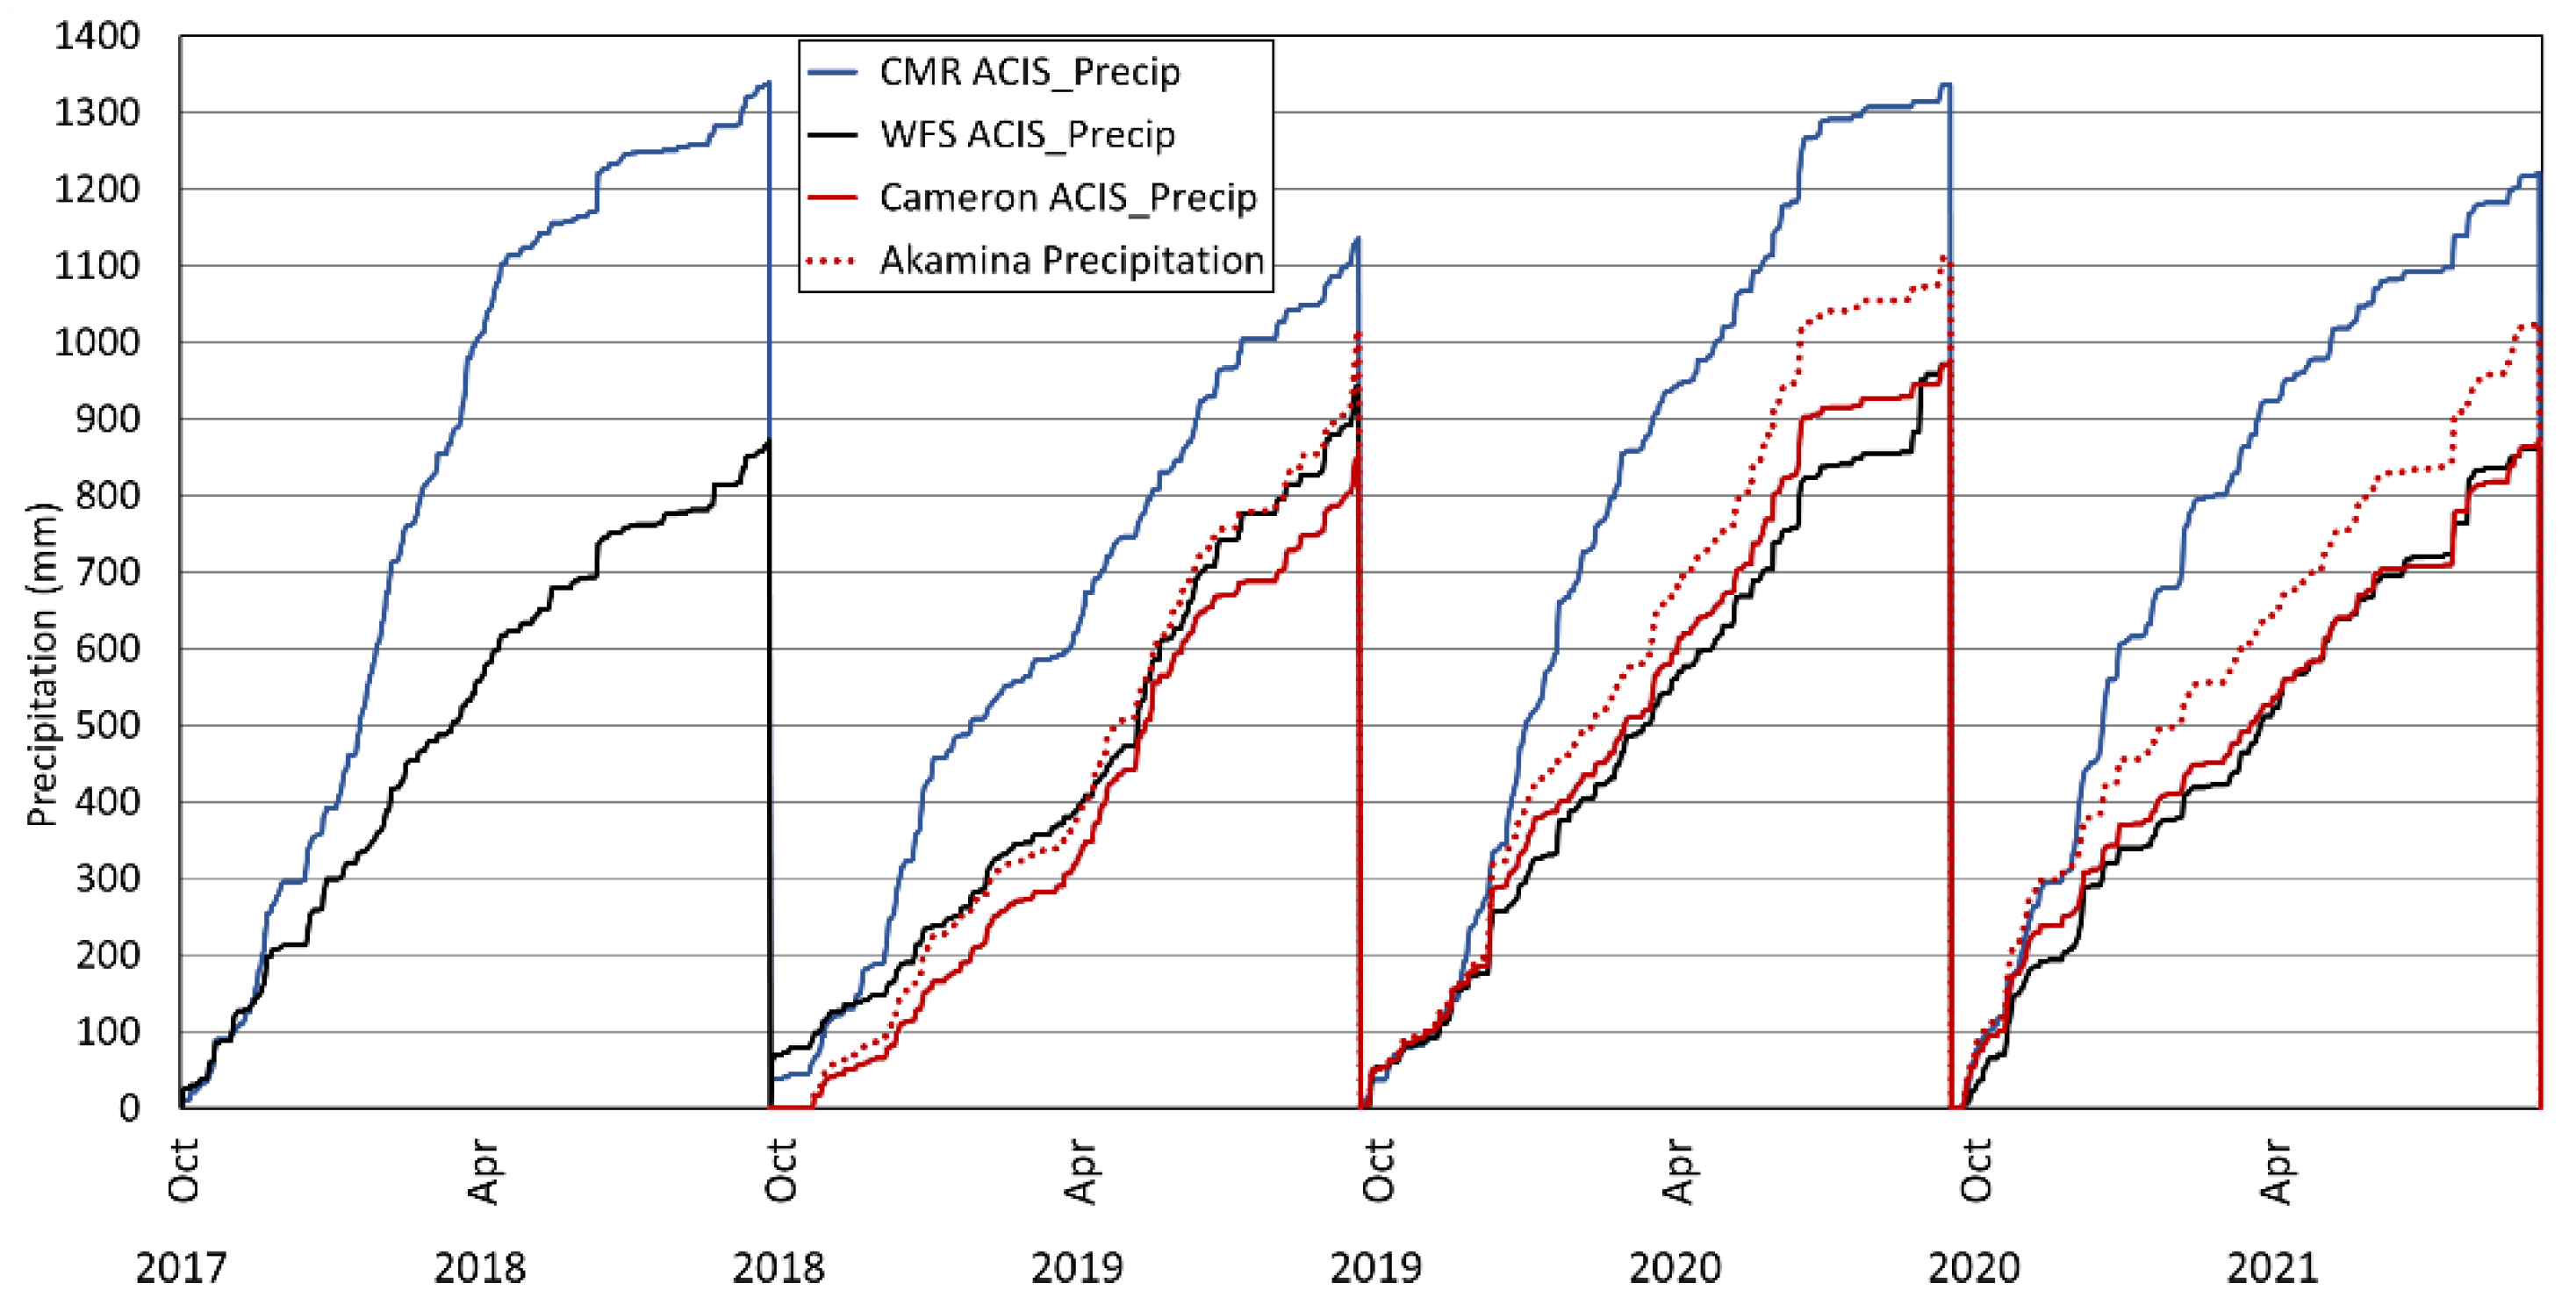
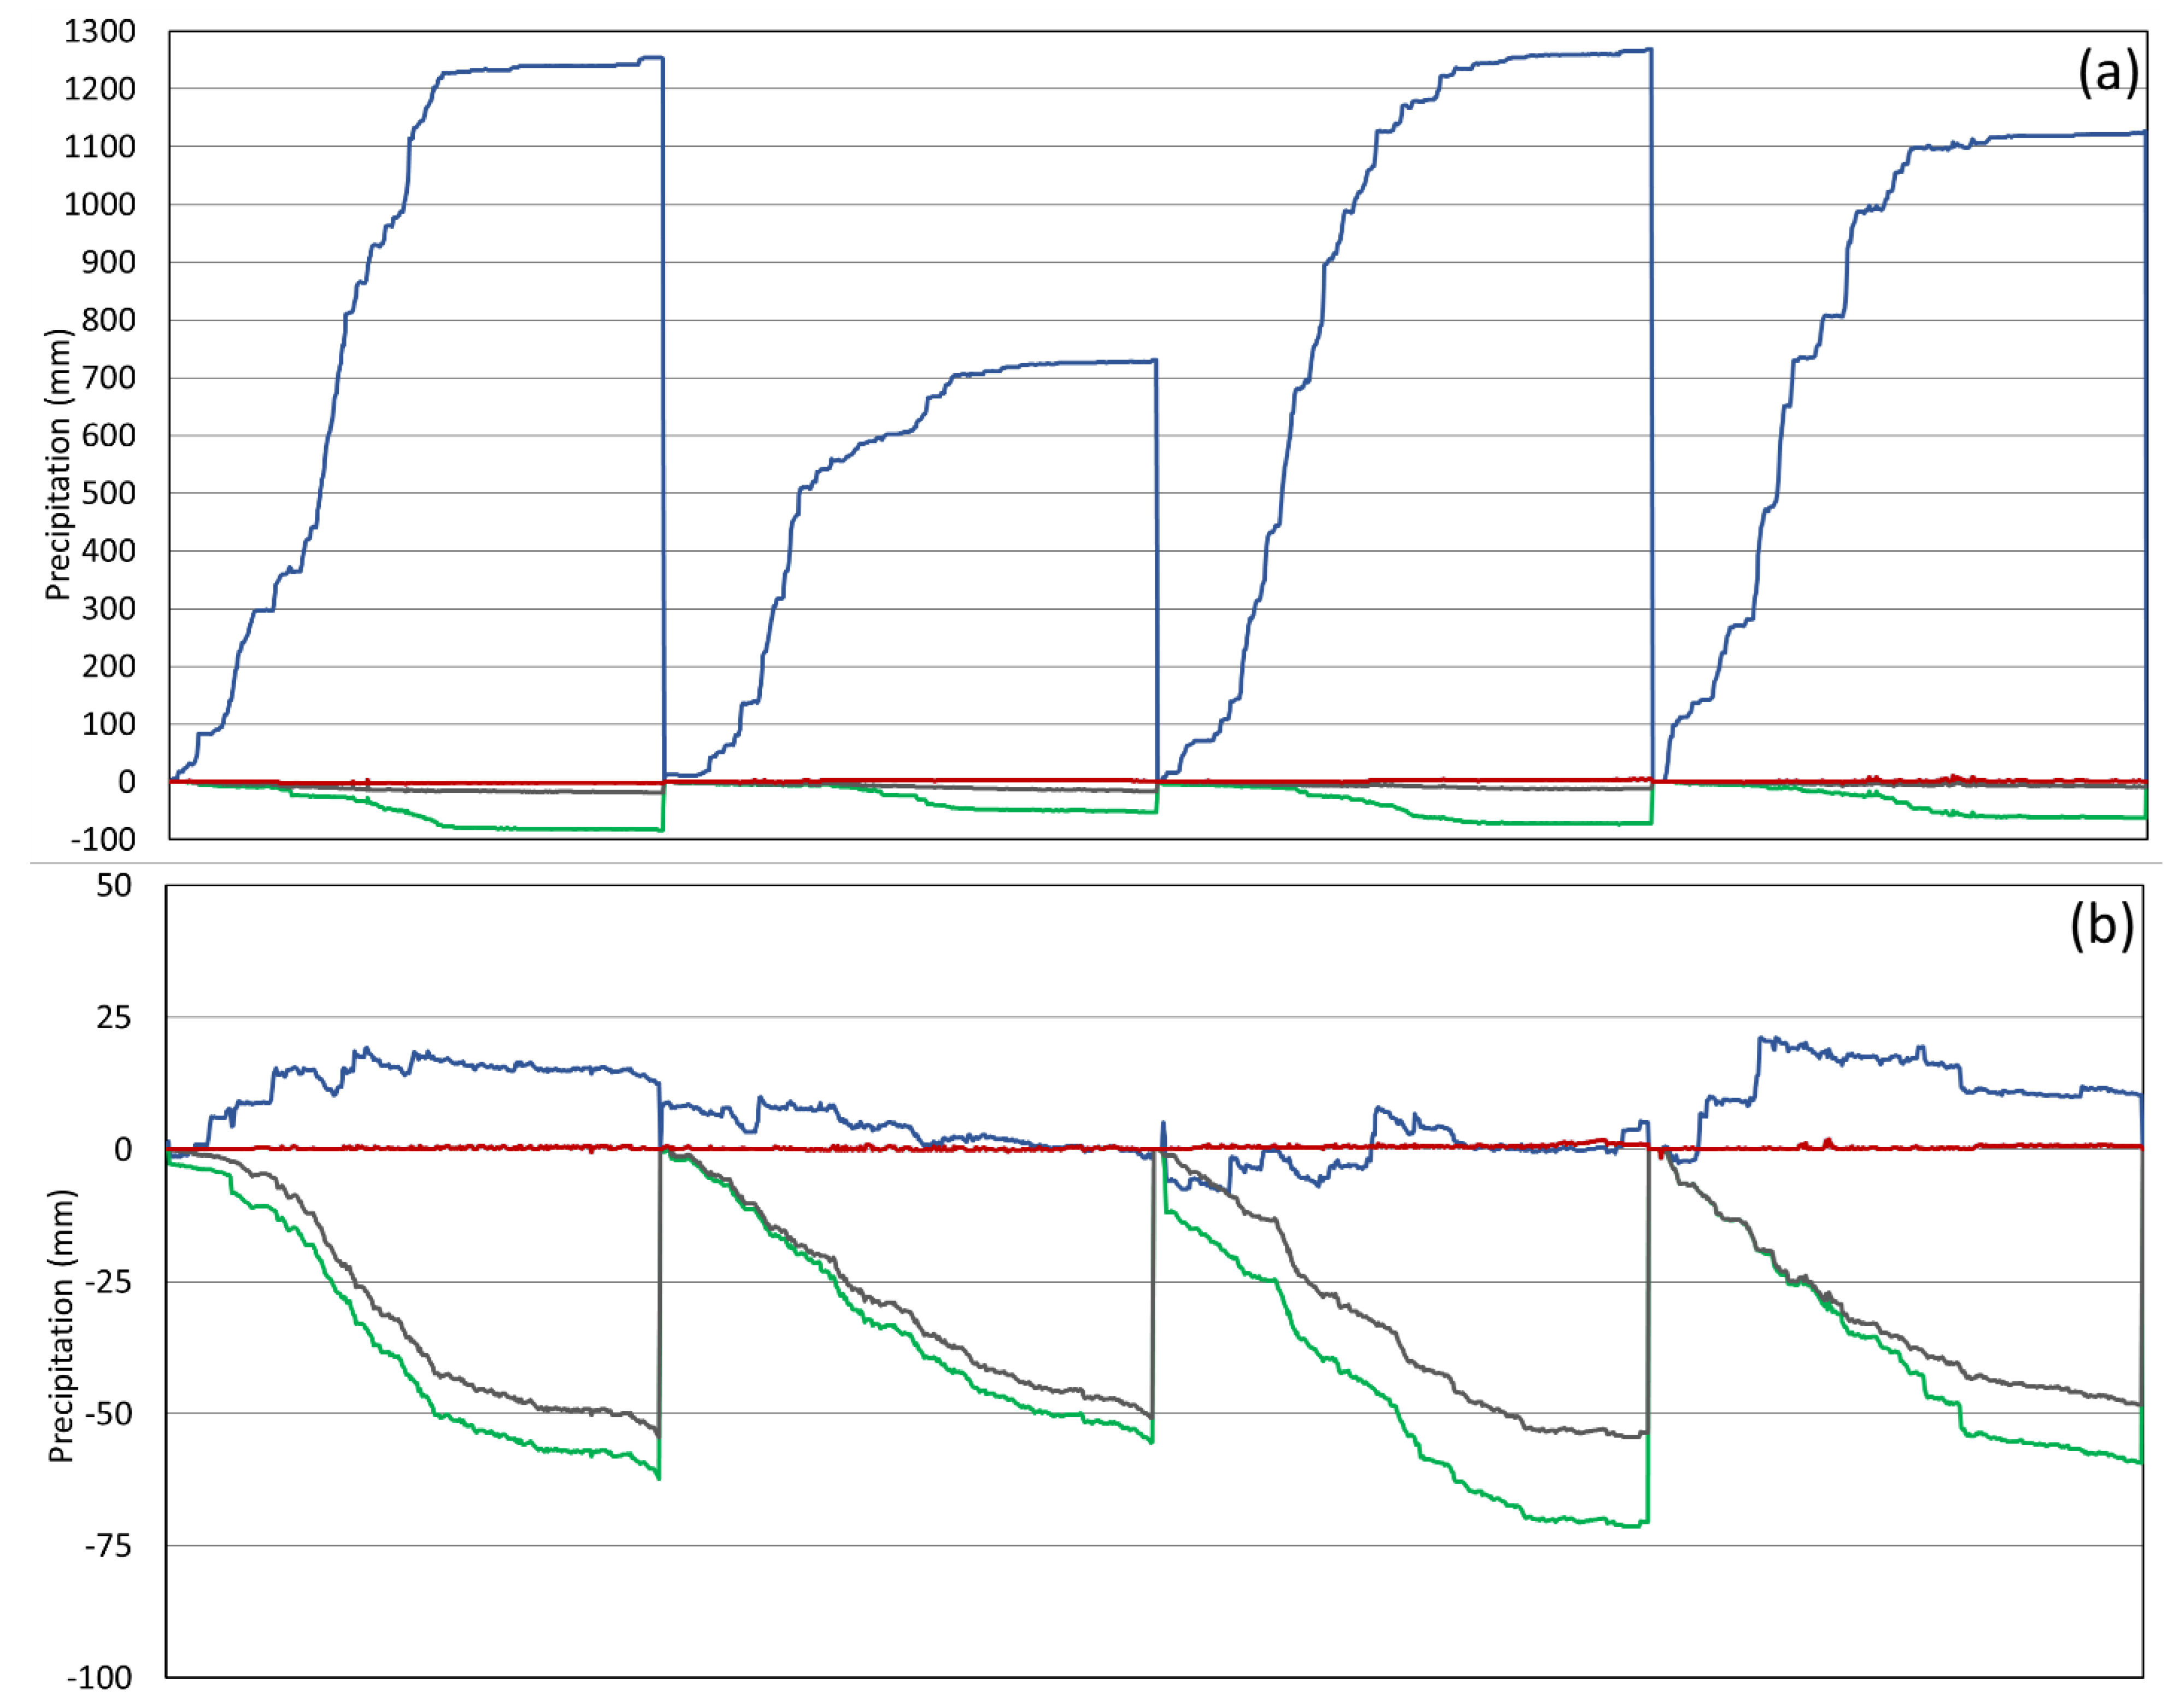
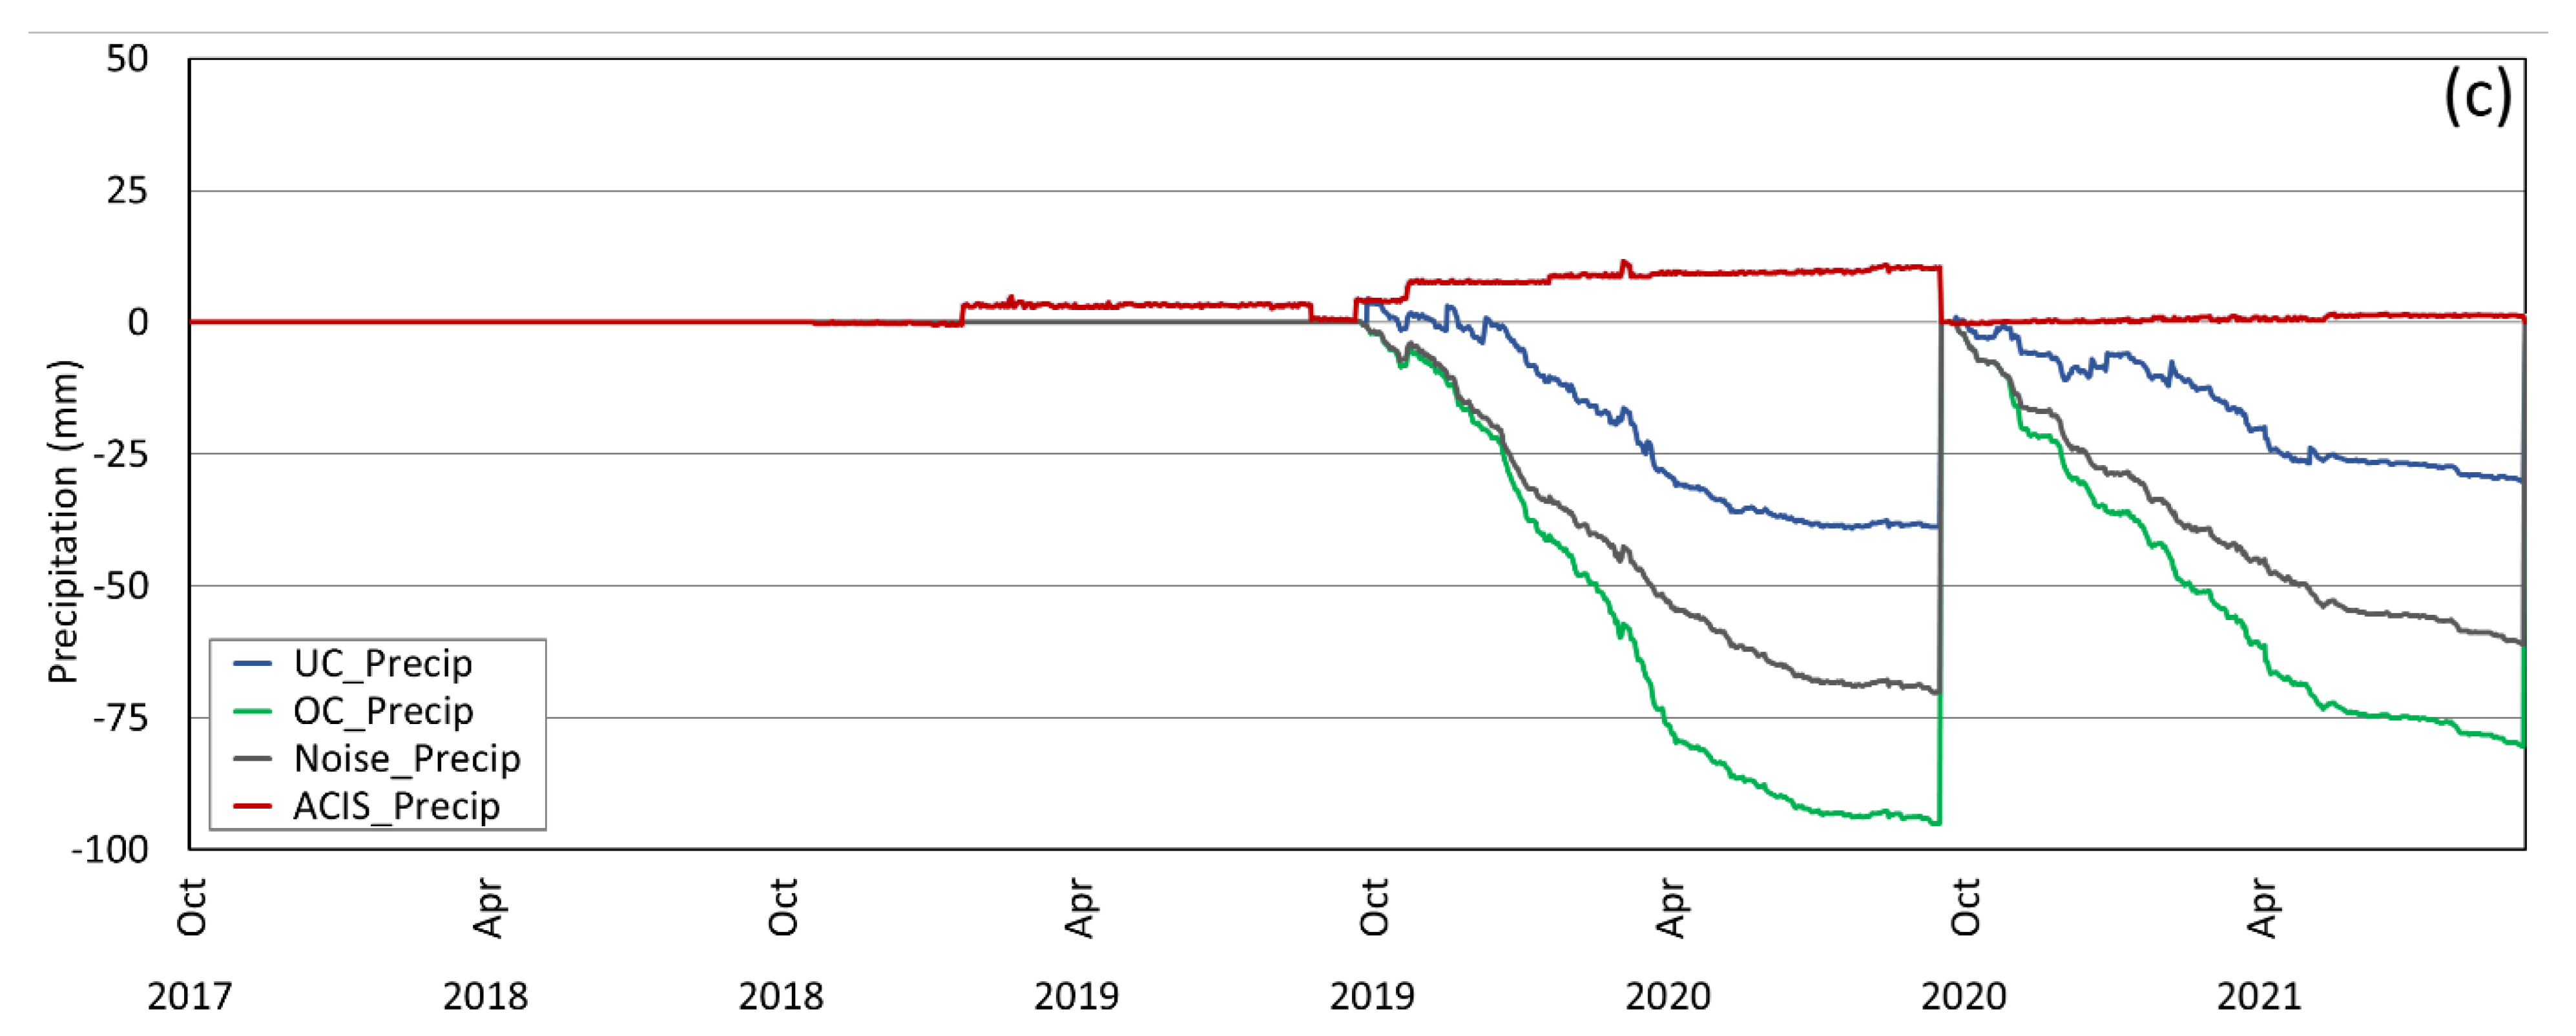
4. Aggregated Precipitation Output Results and Discussion
5. Conclusions
Author Contributions
Funding
Data Availability Statement
Acknowledgments
Conflicts of Interest
References
- Alberta Environment. Water for Life—Alberta’s Strategy for Sustainability; Government of Alberta: Edmonton, AB, Canada, 2003.
- Kienzle, S.W. Water Yield and Streamflow Trend Analysis for Alberta Watersheds; Alberta Innovates, Energy and Environment Solutions: Edmonton, AB, Canada, 2012. [Google Scholar]
- Thiessen, A.H. Precipitation Averages for Large Areas. Mon. Weather. Rev. 1911, 39, 1082–1089. [Google Scholar] [CrossRef]
- Rasmussen, R.; Baker, B.; Kochendorfer, J.; Meyers, T.; Landolt, S.; Fischer, A.P.; Black, J.; Thériault, J.M.; Kucera, P.; Gochis, D.; et al. How Well Are We Measuring Snow: The NOAA/FAA/NCAR Winter Precipitation Test Bed. Bull. Am. Meteorol. Soc. 2012, 93, 811–829. [Google Scholar] [CrossRef]
- Avanzi, F.; Ercolani, G.; Gabellani, S.; Cremonese, E.; Pogliotti, P.; Filippa, G.; Morra di Cella, U.; Ratto, S.; Stevenin, H.; Cauduro, M. Learning about precipitation lapse rates from snow course data improves water balance modeling. Hydrol. Earth Syst. Sci. 2021, 25, 2109–2131. [Google Scholar] [CrossRef]
- Goodison, B.E.; Louie, P.Y.; Yang, D. WMO Solid Precipitation Measurement Intercomparison; World Meteorological Organization: Geneva, Switzerland, 1998. [Google Scholar]
- Wright, R. Current and Historical Alberta Weather Station Data; Alberta Climate Information Service (ACIS): Edmonton, AB, Canada, 2021. [Google Scholar]
- Newton, B.W.; Farjad, B.; Orwin, J.F. Spatial and Temporal Shifts in Historic and Future Temperature and Precipitation Patterns Related to Snow Accumulation and Melt Regimes in Alberta, Canada. Water 2021, 13, 1013. [Google Scholar] [CrossRef]
- Barnes, C.; Hopkinson, C.; Porter, T.; Xi, Z. In-Situ LED-Based Observation of Snow Surface and Depth Transects. Sensors 2020, 20, 2292. [Google Scholar] [CrossRef] [PubMed]
- Waterton Lakes National Park. Kenow Fire: Burn Severity Map; Parks Canada: Gatineau, QC, Canada, 2017; p. 1. [Google Scholar]
- Earle, M.; Reverdin, A.; Wolff, M.; Smith, C.; Morin, S.; Rodica, N. Data Processing and Quality Control Methodology for the Derivation of Reference Datasets. In Project Team and (Reduced) International Organizing Committee for the WMO Solid Precipitation Intercomparison Experiment Final Report 2014, Fifth Session; WMO: Sodankylä, Finland, 2014; p. 77. [Google Scholar]
- Pan, X.; Yang, D.; Li, Y.; Barr, A.; Helgason, W.; Hayashi, M.; Marsh, P.; Pomeroy, J.; Janowicz, R.J. Bias corrections of precipitation measurements across experimental sites in different ecoclimatic regions of western Canada. Cryosphere 2016, 10, 2347–2360. [Google Scholar] [CrossRef]
- Peck, E.L. Snow measurement predicament. Water Resour. Res. 1972, 8, 244–248. [Google Scholar] [CrossRef]
- Leeper, R.D.; Palecki, M.A.; Davis, E. Methods to Calculate Precipitation from Weighing-Bucket Gauges with Redundant Depth Measurements. J. Atmos. Ocean. Technol. 2015, 32, 1179–1190. [Google Scholar] [CrossRef]
- Wolff, M.; Isaksen, K.; Petersen-Øverleir, A.; Ødemark, K.; Reitan, T.; Brækkan, R. Derivation of a new continuous adjustment function for correcting wind-induced loss of solid precipitation: Results of a Norwegian field study. Hydrol. Earth Syst. Sci. 2015, 19, 951–967. [Google Scholar] [CrossRef]
- Kochendorfer, J.; Nitu, R.; Wolff, M.; Mekis, E.; Rasmussen, R.; Baker, B.; Earle, M.E.; Reverdin, A.; Wong, K.; Smith, C.D. Analysis of single-Alter-shielded and unshielded measurements of mixed and solid precipitation from WMO-SPICE. Hydrol. Earth Syst. Sci. 2017, 21, 3525–3542. [Google Scholar] [CrossRef]
- Baghapour, B.; Wei, C.; Sullivan, P.E. Numerical simulation of wind-induced turbulence over precipitation gauges. Atmos. Res. 2017, 189, 82–98. [Google Scholar] [CrossRef]
- Kochendorfer, J.; Rasmussen, R.; Wolff, M.; Baker, B.; Hall, M.E.; Meyers, T.; Landolt, S.; Jachcik, A.; Isaksen, K.; Brækkan, R. The quantification and correction of wind-induced precipitation measurement errors. Hydrol. Earth Syst. Sci. 2017, 21, 1973–1989. [Google Scholar] [CrossRef]
- Kochendorfer, J.; Nitu, R.; Wolff, M.; Mekis, E.; Rasmussen, R.; Baker, B.; Earle, M.E.; Reverdin, A.; Wong, K.; Smith, C.D. Testing and development of transfer functions for weighing precipitation gauges in WMO-SPICE. Hydrol. Earth Syst. Sci. 2018, 22, 1437–1452. [Google Scholar] [CrossRef]
- Hopkinson, C.; Barnes, C. Precipitation Gauge and Supplemental Weather Station Data for Three Oldman River Headwater Locations in SW Alberta; Federated Research Data Repository: Toronto, ON, Canada, 2022. [Google Scholar]
- Alberta Environment and Parks. Alberta’s River Forecast Centre: Awareness and Communication; Alberta Environment and Parks: Edmonton, AB, Canada, 2019. [Google Scholar]
- CMR Board. Castle Mountain Resort Area Structure Plan; CMR Board, Castle Mountain Resort: Pincher Creek, AB, Canada, 2002; p. 61. [Google Scholar]
- Campbell Scientific (Canada) Corp. GEONOR T-200B Series Precipitation Gauge; Campbell Scientific (Canada) Corp.: Edmonton, AB, Canada, 2011; p. 64. [Google Scholar]
- Lang-Gorman, J. Protocols for Geonor Operation; Alberta Forestry, Ed.; Alberta Environment and Parks: Edmonton, AB, Canada, 2018; p. 10. [Google Scholar]
- Campbell Scientific (Canada) Corp. CR1000 Datalogger Operator’s Manual; Campbell Scientific (Canada) Corp.: Edmonton, AB, Canada, 2020; p. 628. [Google Scholar]
- Zhang, L.; Zhao, L.; Xie, C.; Liu, G.; Gao, L.; Xiao, Y.; Shi, J.; Qiao, Y. Intercomparison of Solid Precipitation Derived from the Weighting Rain Gauge and Optical Instruments in the Interior Qinghai-Tibetan Plateau. Adv. Meteorol. 2015, 2015, 11. [Google Scholar] [CrossRef]
- Wright, R. Weighing Gauge Time Series Analysis and Noise Filtering Tool; Alberta Agriculture and Forestry: Edmonton, AB, Canada, 2021.
- Meteorological Service of Canada. MANOBS-Manual of Surface Weather Observation Standards, 8th ed.; Meteorological Service of Canada: Gatineau, QC, Canada, 2021; p. 204.
- Nitu, R.; Wong, K. CIMO Survey on National Summaries of Methods and Instruments for Solid Precipitation Measurement at Automatic Weather Stations, IOM 102, TD1544; WMO: Geneva, Switzerland, 2010. [Google Scholar]
- Smith, R.B. 100 years of progress on mountain meteorology research. Meteorol. Monogr. 2019, 59, 20.21–20.73. [Google Scholar] [CrossRef]
- Cartwright, K.; Hopkinson, C.; Kienzle, S.; Rood, S.B. Evaluation of temporal consistency of snow depth drivers of a Rocky Mountain watershed in southern Alberta. Hydrol. Processes 2020, 34. [Google Scholar] [CrossRef]


| Variable | Value | Units | Description |
|---|---|---|---|
| Timestamp | recorded | Time measurement was recorded (yyyy–mm–dd hh:mm) | |
| RH | recorded | % | Relative humidity |
| Wind | recorded | ms−1 | Wind speed |
| AirTemp | recorded | °C | Air temperature |
| In_SR | recorded | watt/m2 | Incoming solar radiation |
| Raw_Precip | recorded | mm | Raw precipitation record |
| ACIS_Precip | computed | mm | ACIS weighing gauge time-series data filtering |
| Noise_Precip | computed | mm | Noise removal of positive values during no precipitation |
| OC_Precip | computed | mm | Over-catch subtracted |
| UC_Precip | computed | mm | Under-catch added for snow and rain |
| Site | CMR | WFS | Cameron |
|---|---|---|---|
| Elevation | 2130 m asl | 1400 m asl | 1655 m asl |
| Latitude | 49°19′15.18″ N | 49°20′55.17″ N | 49°2′3.52″ N |
| Longitude | 114°26′20.94″ W | 114°24′39.01″ W | 114°2′17.55″ W |
| Installation date | 17 September 2015 | 7 September 2017 | 27 October 2018 |
| Precipitation gauge | GEONOR T-200B-MD | GEONOR T-200B | GEONOR T-200B |
| Capacity | 1500 mm | 600 mm | 600 mm |
| Precision vibrating wire | 3 | 1 | 1 |
| Incoming shortwave radiation | CS CMP3 | CS CNR1 | CS CNR4 |
| Air temperature | CS T109 | CS HC2S3 | CS HMP45 |
| Relative humidity | CS HMP45 | CS HC2S3 | CS HMP45 |
| Wind speed | Met One 013A | RM Young 05103 | RM Young 05103 |
| Run # | Range | Change Factor | Raw Count | Comments |
|---|---|---|---|---|
| 1 (red line) | 24 | 0.2 | 3 | |
| 2 (blue line) | 24 | 0.9 | 1 | Baseline used for further adjustments |
| Threshold Values | CMR | WFS | Cameron | Comment |
|---|---|---|---|---|
| NoiseThreshold | 0.11 | 0.05 | 0.05 | Threshold for small positive precipitation changes |
| In_SRThreshold | 300 | 300 | 300 | Incoming SR threshold (daylight hours only) |
| RHThreshold | 75 | 65 | 65 | RH threshold when SR is greater than In_SRThreshold |
| AirTempThreshold | 0.0 | 0.0 | 0.0 | Temperature threshold to separate snow/rain |
| WSLower | 1.2 | 1.2 | 1.2 | Lower wind speed bounds for under-catch |
| WSUpper | 6.5 | 6.5 | 6.5 | Upper wind speed bounds for under-catch |
| Hanemometer | 14.0 | 6.5 | 3.0 | Height of anemometer (m) |
| Hgauge | 3.0 | 2.0 | 1.75 | Height of Geonor orifice (m) |
| Roughness | 0.05 | 0.05 | 0.05 | Roughness length (m) |
| CERain | 1.05 | 1.05 | 1.05 | Catch efficiency multiplier for rain |
| WSgauge | computed | Wind speed above the Geonor orifice | ||
| CESnow | computed | Catch efficiency for snow |
| Correction | 2017–2018 mm (%) | 2018–2019 mm (%) | 2019–2020 mm (%) | 2020–2021 mm (%) |
|---|---|---|---|---|
| CMR | ||||
| ACIS filter | −2.1 (−0.2%) | 1.6 (0.1%) | 4.7 (0.4%) | 1.4 (0.1%) |
| Noise reduction | −17.5 (−1.3%) | −18.6 (−1.6%) | −15.9 (−1.2%) | −10.2 (−0.8%) |
| Over-catch | −64.6(−5.1%) | −36.0 (−3.3%) | −60.0 (−4.8%) | −54.1 (−4.7%) |
| Under-catch | 1342.0 (51.5%) | 783.7 (42.0%) | 1340.3 (51.5%) | 1189.7 (50.7%) |
| Total correction | 1258.1 (48.3%) | 730.7 (39.2%) | 1269.1 (48.8%) | 1126.9 (48.0%) |
| WFS | ||||
| ACIS filter | 0.2 (0.0%) | 0.1 (0.0%) | 0.9 (0.1%) | 0.5 (0.1%) |
| Noise reduction | −54.7 (−6.2%) | −50.8 (−5.4%) | −54.5 (−5.6%) | −48.9 (−5.7%) |
| Over-catch | −7.8 (−1.0%) | −4.6 (−0.5%) | −16.9 (−1.9%) | −10.9 (−1.4%) |
| Under-catch | 74.9 (8.4%) | 53.9 (5.7%) | 75.6 (7.7%) | 69.5 (8.0%) |
| Total correction | 12.6 (1.4%) | −1.4 (−0.1%) | 5.1 (0.5%) | 10.2 (1.2%) |
| Cameron | ||||
| ACIS filter | 6.4 (0.7%) | 1.2 (0.1%) | ||
| Noise reduction | −76.4 (−7.9%) | −62.1 (−7.2%) | ||
| Over-catch | −24.9 (−2.9%) | −19.4 (−2.5%) | ||
| Under-catch | 56.5 (6.1%) | 50.2 (6.0%) | ||
| Total correction | −38.5 (−4.2%) | −30.1 (−3.6%) |
Publisher’s Note: MDPI stays neutral with regard to jurisdictional claims in published maps and institutional affiliations. |
© 2022 by the authors. Licensee MDPI, Basel, Switzerland. This article is an open access article distributed under the terms and conditions of the Creative Commons Attribution (CC BY) license (https://creativecommons.org/licenses/by/4.0/).
Share and Cite
Barnes, C.; Hopkinson, C. Quality Control Impacts on Total Precipitation Gauge Records for Montane Valley and Ridge Sites in SW Alberta, Canada. Data 2022, 7, 73. https://doi.org/10.3390/data7060073
Barnes C, Hopkinson C. Quality Control Impacts on Total Precipitation Gauge Records for Montane Valley and Ridge Sites in SW Alberta, Canada. Data. 2022; 7(6):73. https://doi.org/10.3390/data7060073
Chicago/Turabian StyleBarnes, Celeste, and Chris Hopkinson. 2022. "Quality Control Impacts on Total Precipitation Gauge Records for Montane Valley and Ridge Sites in SW Alberta, Canada" Data 7, no. 6: 73. https://doi.org/10.3390/data7060073
APA StyleBarnes, C., & Hopkinson, C. (2022). Quality Control Impacts on Total Precipitation Gauge Records for Montane Valley and Ridge Sites in SW Alberta, Canada. Data, 7(6), 73. https://doi.org/10.3390/data7060073