Abstract
Storm surge flooding can cause significant damage to coastal communities. In addition, coastal communities face an increased risk of coastal hazards due to sea-level rise (SLR). This research developed a dataset to communicate the socioeconomic consequences of flooding within the 1% and 0.2% Annual Exceedance Probability Floodplain (AEP) under four SLR scenarios for the Northern Gulf of Mexico region. Assessment methods primarily used HAZUS-MH software, a GIS-based modeling tool developed by the Federal Emergency Management Agency in the United States, to estimate natural disasters’ physical, economic, and social impacts. This dataset consists of 29 shapefiles containing seven different measures of storm surge inundation impacts under SLR (including building damage, displaced people and shelter needs, road exposure, essential facilities, wastewater treatment plants, bridges, and vehicle damage). The data is publicly available under the Gulf of Mexico Research Initiative Information and Data Cooperative (GRIIDC).
Dataset License: CC0
1. Introduction
Worldwide, floods have affected more people than any other disaster and account for 44% of all weather-related disasters; more specifically, storm-related floods account for 17% of the weather-disaster losses totaling $428 Billion between 2010–2019 [1]. Hurricanes like Maria, Harvey, and Katrina—each resulting in over $60B in economic losses—are the major cause of weather-disaster losses in North America [1]. Under global warming and sea-level rise (SLR), it is expected that the frequency and exposure to major flooding will increase in the Northern Gulf of Mexico [2,3,4], exposing communities to greater risk of social disruption and economic loss.
The combined effects of SLR, coastal habitat change, and storm surge can increase the risk of socioeconomic consequences such as damages to buildings and public infrastructure, loss of personal property, loss of business and wages, and the need to evacuate or relocate [5]. To add to this increasing risk, the coastal population is growing. From 2010–2017, coastal counties on the Atlantic and Gulf Coast have experienced an increase from 51.9 million to 60.2 million people [6], exposing more people to storm surge flooding. Recent modeling approaches find that, in the Northern Gulf of Mexico, SLR is expected to increase in spatial extent, expanding the floodplain into new regions, and increasing the depth of inundation in areas already in the present-day storm surge floodplain [7].
In the United States (U.S.) the National Flood Insurance Program (NFIP) protects individuals from flood losses through property insurance. Administered through the Federal Emergency Management Agency (FEMA), it reduces future flood damage through community floodplain management and mitigation [8]. Mortgaged homes located in designated Special Flood Hazard Areas (SFHAs) require insurance under the Flood Disaster Protection Act of 1973. The SFHAs correspond to the land within the floodplain subject to a 1% or greater chance of flooding in any given year (also called the 100-year flood). This 1-percent-annual-chance flood is a statistical measure of risk and the federal regulatory standard used by most agencies and states [9]. Areas outside of the SFHA are considered to be of moderate flood hazard and within the area of the a 0.2-percent-annual-chance (500-year flood), and do not require the purchase of flood insurance [10]. This paper presents analyses and output based on the current and future 100-year and 500-year storm surge flood still-water scenarios. Unlike SFHA, we do not include rainfall-induced or riverine flooding.
It is important for communities to plan and mitigate the potential effects of SLR, but to do so they first need to understand the spatial extent and magnitude of the potential consequences. Modeling current and future floodplains is a complex task that requires an understanding of coastal dynamics and potential landscape changes under changing climate conditions. These modeling and informational products help communities understand their vulnerability and are needed to develop adaptive management and resilience plans [11,12,13]. Although many communities in the U.S. recognize SLR as a potential issue, many local plans fail to incorporate means to address SLR impacts; this has been attributed to the intensive data collection and scenario development needed to gather this information [14]. This research was conducted to increase the understanding of the socioeconomic impacts of SLR and to develop the spatial information required by local planners to develop hazard mitigation and land-use plans.
Currently, some data and online data-viewers exist to map local sea-level inundation, storm surge inundation, and coastal population and infrastructure (see: https://www.nhc.noaa.gov/nationalsurge/ (accessed on 19 May 2022) and https://coastalresilience.org/project/gulf-of-mexico/ (accessed on 19 May 2022)), yet a dataset of the socioeconomic impacts of the combined storm surge under SLR was not available. This multi-year collaborative study aimed at addressing this data gap. In addition, throughout the length of this project, stakeholders have been engaged to best understand their information needs [15,16,17,18].
2. Data Description
The data set described here presents the potential social and economic consequences of storm surge under several SLR scenarios. This study builds on the products of the Ecological Effects of Sea Level Rise in the Northern Gulf of Mexico (EESLR-NGOM) project [19]. Specifically, this work uses the 1% and 0.2% Annual Exceedance Probability (AEP) floodplains developed by Bilskie et al. [20] to conduct a socioeconomic analysis of the combined effect of SLR and storm surge flooding. The 1% AEP and 0.2% AEP were developed using a hydrodynamic model of water circulation under tides, SLR, and storms; the resulting statistical product represents the geographical extent and depth of floods within the 100- and 500-year storm surge floodplain [20,21]. They found that storm surge response to SLR is non-linear—where storm surge is amplified, and flood depths are higher than projected SLR under certain conditions. Overall, SLR is expected to expand the storm surge floodplain into new regions and increase the depth of inundation in areas already in the present-day storm surge floodplain.
The dataset described herein is made available under the Gulf of Mexico Research Initiative Information and Data Cooperative (GRIIDC) and is titled “Socioeconomic risk associated with the 1% and 0.2% return period Stillwater flood elevation under sea-level rise for the Northern Gulf of Mexico”. The dataset consists of 29 shapefiles (Table 1) which report the potential inundation damage and exposure to buildings and their content, roads, bridges, vehicles, crops, essential facilities, and the displacement and shelter-needs of people. The data were developed for the Northern Gulf of Mexico, including 15 coastal counties across the states of Mississippi, Alabama, and the Florida Panhandle, extending from Hancock County, MS, east to Taylor County, FL (Figure 1).
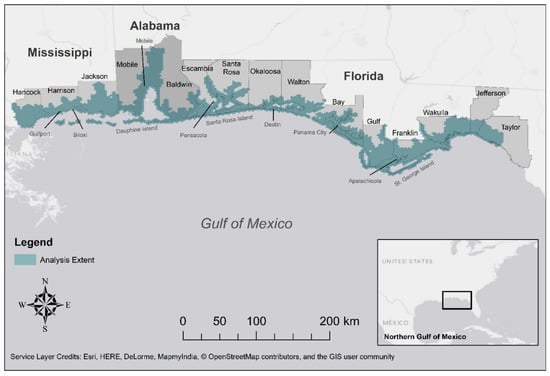
Figure 1.
Study Site: The Northern Gulf of Mexico Region includes 15 coastal counties across Mississippi, Alabama, and the Florida Panhandle.
2.1. Sea-Level Rise Scenarios
Sea-level rise scenarios in this study follow that of the U.S. National Oceanic and Atmospheric Administration’s (NOAA) Technical Memo “Global Sea Level Rise Scenarios for the US National Climate Assessment” [22]. This report is the result of U.S. interagency collaboration to synthesize and disseminate SLR data and science, aimed at coastal managers, planners, and policy makers. This report presents a resource that is more accessible and more widely used by the data target audience. The global SLR scenarios by the year 2100, presented in this report include:
- High (2.0 m) scenario was determined from a combination of IPCC AR4 projections and consideration for the maximum possible ice sheet and glacier loss.
- Intermediate-High (1.2 m) scenario is derived from an average of semi-empirical global projections.
- Intermediate-Low (0.5 m) scenario is based on IPCC AR4 SLR projection that use the B1 emissions scenarios.
- Low (0.2 m) was calculated from linear extrapolation of historical SLR rates as observed from tide gauge records since 1990.
2.2. Data Organization and Geometry
The dataset contains files in the following spatial geometries: points, lines, and polygons. In addition, polygon files represent two levels of data summaries, Census block level and a hexagon grid aggregate (Figure 2). The hexagon grid (see Figure 2) was chosen as a data aggregate format to enhance visualization of damage potential and hotspots at the regional scale [23]. In addition, it was learned through stakeholder engagement that loading such a large spatial dataset though an online viewer or a local computer can be difficult, therefore providing data summaries was an option considered for making this data more accessible to a broader audience. The grid covers the analysis extent shown in Figure 1 and contains 1787 polygons, each with an area of 10 square km (Figure 2).
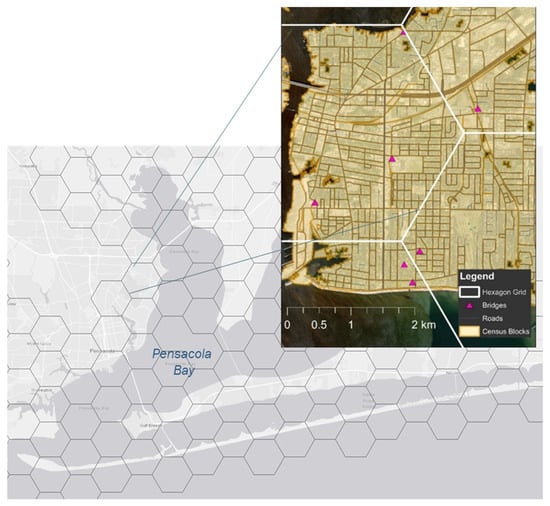
Figure 2.
Hexagon grid used for data summaries. Here is an example of the different geometries of damage/impact data, including Census block polygons, roads represented by lines, and bridges represented by points. The values are summarized to a 10 sq. km hexagon grid.

Table 1.
List of shapefiles associated with the dataset titled “Socioeconomic risk associated with the 1% and 0.2% return period Stillwater flood elevation under sea-level rise for the Northern Gulf of Mexico”.
Table 1.
List of shapefiles associated with the dataset titled “Socioeconomic risk associated with the 1% and 0.2% return period Stillwater flood elevation under sea-level rise for the Northern Gulf of Mexico”.
| Category | File Names | Description |
|---|---|---|
| Buildings | Build_Inventory.shp (block) NGOM_DamBlds100.shp (block) NGOM_DamBlds500.shp (block) Bld_Inv_Dam_02AEP.shp (hexagon) Bld_Inv_Dam_1AEP.shp (hexagon) NGOM_EconLoss_100.shp (block) NGOM_EconLoss_100.shp (block) |
|
| Essential Facilities | EssFacilities_1AEP.shp (point) EssFacilities_02AEP.shp (point) |
|
| Infrastructure | Wasterwater_1AEP.shp (point) Wastewater_02AEP.shp (point) |
|
| Roads | RoadsClip_100P (line) RoadsClip_100L (line) RoadsClip_100IL (line) RoadsClip_100IH (line) RoadsClip_100H (line) RoadsClip_500P (line) RoadsClip_500L (line) RoadsClip_500IL (line) RoadsClip_500IH (line) RoadsClip_500H (line) Road_Exp_1AEP.shp (hexagon) Road_Exp_02AEP.shp (hexagon) |
|
| Displaced People | NGOM_Displaced_100.shp (block) NGOM_Displaced_500.shp (block) Displaced_02AEP.shp (hexagon) Displaced_1AEP.shp (hexagon) |
|
| Total Economic Damage and Exposure | NGOM_EIA_1EP.shp (hexagon) NGOM_EIA_02AEP.shp (hexagon) |
|
2.3. Data Themes Summary
All measures of exposure and damage cover five SLR scenarios including the Present day, Low (0.2 m), Intermediate-Low (0.5 m), Intermediate-High (1.2 m) and High (2.0 m) of SLR and two storm surge-return statistical floodplains, the 1% AEP and the 0.2% AEP, for a total of 10 SLR-surge scenarios.
The dataset includes building data in two summary formats (Census block and hexagon grid format) (Table 1). The building inventory contains the number of total buildings and building counts by occupancy type (residential, commercial, industrial, agricultural, religion, government, and education buildings). Another set of files reports the number of damaged buildings. The hexagon grid summary files combine the building inventory and number of damaged residential and commercial buildings. Lastly, building economic losses are available in block-level format.
Two shapefiles report the essential facilities at risk. The fields in each of the shapefiles include information on facilities, including address, geographic location, percent damage to facility and the facility’s content (under each of the SLR scenarios), economic loss (in thousands of dollars), characterized as functional or nonfunctional, number of days to reach functioning status and category. The category field describes the facility type, such as schools, law enforcement, fire station, emergency operation facilities, and medical care facilities.
Two shapefiles report the wastewater treatment plants at risk. These point shapefiles have fields describing the wastewater treatments facilities, including address, geographic location, percent damage to facility, characterized as functional or nonfunctional after a flood event, and potential economic loss (in thousands of dollars).
A total of 12 files summarizes road exposure. Road exposure is summarized in two hexagon grid format files and 10 line-feature shapefiles (Figure 3). These files provide a summary of road length and repair costs associated with exposure to storm surge flooding.
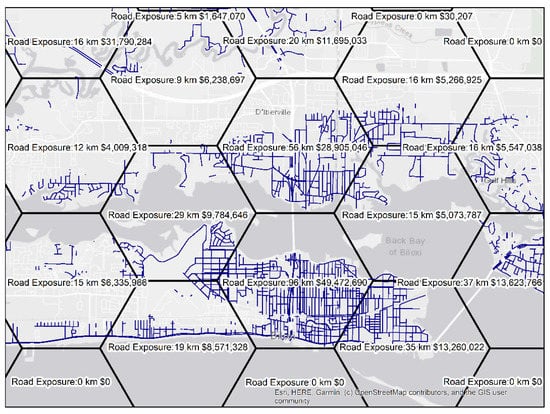
Figure 3.
Road exposure data is available in hexagon grid summary and line shape format. Both shapefiles provide road exposure in length (kilometers and miles) and in cost (U.S. dollars).
Displaced people are summarized in four shapefiles, in the two formats (Census block and hexagon gid format). These report the number of people at risk of being displaced and needing shelter.
Lastly, two files summarize all the economic impact data to the hexagon grid format. The total economic impact includes the individual losses and exposure of buildings, building content, vehicles, crops, roads, and bridges, and the cumulative impacts as result of storm surge flooding. Damage and exposure values are expressed in U.S. dollars.
3. Methods
The framework for assessing the socioeconomic consequences is presented in Figure 4. Part of the workflow was performed using HAZUS to determine damage and exposure to buildings, bridges, essential facilities (including wastewater treatment facilities), and vehicles, and the displacement of people. HAZUS utilizes depth damage curves and other algorithms to determine the relationship between flood depth and damage (more detail is given in Section 3.2). The exposure analysis for crops and roads was conducted outside the HAZUS platform. The overlay results of flood scenarios to roads and crops were paired with economic data to determine exposure cost. After the analysis was performed, output files were aggregated by theme (i.e., building, roads), and a summary of the total economic exposure was organized. Data outputs were organized into shapefile format, and metadata was produced to meet the criteria for inclusion in the GRIIDC data repository.
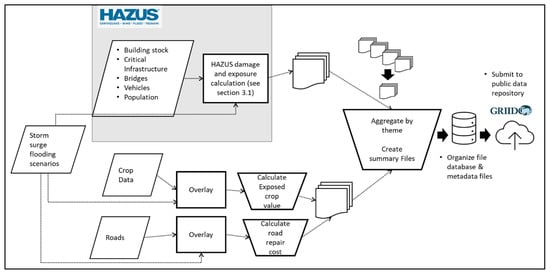
Figure 4.
Schematic showing the workflow for developing the dataset. Parallelograms represent input data, rectangles summarize analysis processes, and trapezoids represent manual processes. The workflow to assess socioeconomic damage and exposure used methods within and outside the HAZUS interface.
3.1. HAZUS
The FEMA HAZUS program provides a tool for a standardized approach to determining risks from natural hazards [24]. The tool is available as a GIS-based desktop application. Developed in the 1990s for earthquake hazards, HAZUS has expanded to include wind damages, floods, hurricanes, and tsunamis as well as additional modules such as bridges and displaced people [25]. In recent years, HAUZS has expanded to provide open-source tools (https://github.com/nhrap-hazus (accessed on 19 May 2022)). The HAZUS database comes integrated with aggregate and site-specific inventory that includes the following: demographic data, General Building Stock, agricultural statistics, vehicle inventory, essential facilities, transportation systems, and utility systems (among other sensitive facilities), all of which can be manipulated and enhanced by user-specified information [26]. The ability to perform multiple analysis levels and incorporate user-developed data into HAZUS makes this an easy-to-use, low-cost, and flexible tool for adaptation planning [27].
The HAZUS tool has been used in several U.S. case studies that assess the current exposure and impact of floods [28,29,30] and in studies that assess future risk [31,32]. HAZUS has also been applied to evaluate the benefits of green infrastructure, flood mitigation and adaptation approaches, and conservation investments related to reducing flood risk [33,34,35,36]. Although designed for U.S. hazards and supported by U.S.-based data, the HAZUS application has been adapted and modified in other countries [37,38].
This study used HAZUS-MH software (version 4.2.3) to assess the socioeconomic consequences of storm surge under SLR.
3.2. Input and Analyses
Data input for the socioeconomic analysis is summarized in Table 2. Data sources include flood inundation data from the Louisiana State University, Center for Coastal Resiliency; HAZUS inventory data (buildings, essential facilities, bridges, crops, and population); road data from the U.S. Census; and crop data from the U.S.D.A. Cropscape application. Many of the inputs for this analysis are available through U.S., national-level datasets (links provided), except for the Stillwater floodplains.
Table 2.
Input data summary.
3.2.1. Stillwater Floodplains
HAZUS facilitates flood hazard assessment by integrating a Flood Hazard Analysis Module to model flood depth, flood elevation, and flow velocities from national data or user-provided data [26]. Yet, one of the criticisms of using HAZUS for flood modeling is the deficiencies of the level 1 or default flood model [28]. This study did not use the HAZUS flood model; instead, we incorporated flood scenarios from dynamic SLR models from Bilskie et al. [20,21]. These flood scenarios were developed using the integrated Simulating WAves Nearshore and ADvanced CIRCulation (SWAN + ADCIRC) [39,40] model to simulate various hurricane events under various carbon emission scenarios. Sea-level rise scenarios follow Parris et al. for the year 2100 (see Section 2.1) [22].
The best available data were compiled to develop a computational coastal inundation model of the Northern Gulf of Mexico. This model contains 5.5 million computational points and represents the hydraulic connections between the Gulf of Mexico, tidal inlets, bay systems, rivers, and adjacent coastal lands (called the NGOM3 model) [21]. The NGOM3 was used in a coupled SWAN + ADCIRC platform, simulating water flow over the region from astronomic tides, wind-waves, and wind forcing. The NGOM3 model was validated by simulating past storms and comparing the storm surge values to observed measurements [21].
The NGOM3 model was adjusted for each of the SLR scenarios, and changes in the landscape were incorporated under Low, Intermediate-Low, Intermediate-High, and High SLR. Landscape changes adjusted for the NGOM3 model include the change in beach and dune width and height, salt-marsh extent and bio-productivity, shoreline position, and land use/land cover change [21,41,42,43,44]. Lastly, the updated landscape of the NGOM3 under SLR for each scenario was forced with a set of selected synthetic storms that represent a range of plausible tropical cyclones for the region [45]. These storms forced the coupled NGOM3 SWAN-ADCIRC model and results were analyzed to create the 1% (100-year) and 0.2% (500-year) Annual Exceedance Probability Stillwater floodplains (1% AEP and 0.2% AEP) [20].
The Stillwater floodplains are hosted by the NOAA National Centers for Environmental Information and titled “NCCOS Ecological Effects of Sea Level Rise in the Northern Gulf of Mexico (EESLR-NGOM): Simulated Return Period Stillwater Elevation (NCEI Accession 0170340)” (https://doi.org/10.7289/v54b2zkr, accessed on 19 May 2022).
3.2.2. Building Stock and Contents
The General Building Stock is a HAZUS database product developed from the U.S. Census, Bureau of Housing, and Department of Energy’s Energy Consumption data. Valuation of buildings is based on construction cost estimates from RSMeans (2018 values), a calculation of building cost based on square footage, construction classification, number of stories, and then further adjusted by a regional modifier. The county modifiers for the study area are −8.66% for AL, −12.80% for MS, and −11.17% for FL [46]. Some studies utilize parcel-level tax assessor data to enhance the valuation of buildings. Still, these estimates often include the value of the land, which can lead to the overestimation of damage cost [47]. In addition, using building costs to communicate flood impact was considered most appropriate in this study, considering that building and labor costs are often not factored into insurance valuation estimates [48] and thus may not reflect the cost of rebuilding after a disaster. Finally, because appraisal data varies from county to county, this study utilized HAZUS building stock data to maintain consistency across the study area. With the 15 counties in the study area, the building stock inventory includes 832,311 buildings with a total construction-cost value of $215 billion.
The HAZUS Flood Module applies depth-damage curves from the Federal Insurance Administration and the U.S. Army Corps of Engineers to assess percent damage as a function of flood depth [49]. These damage curves correspond to a mathematical relationship between the depth of flooding above first-floor elevation and the percent damage to a building. Within HAZUS, building losses are calculated and summarized by Census block and presented as area-weighted estimates of damage, where damage cost is calculated as a fraction of the replacement cost [26,49]. The output reported in this work includes the total replacement cost for buildings, for both pre- and post-FIRM (Flood Insurance Rate Map) structures. Where percent damage exceeds 50%, the damage is considered a total economic loss [7]. Lastly, content replacement value is considered a percentage of the structure’s replacement cost based on land-use type (i.e., commercial or residential).
3.2.3. Essential Facilities
This study utilized an enhanced version of the HAZUS essential facilities inventory. Essential facilities include hospitals, fire stations, schools, emergency operations centers, and wastewater treatment plants. The HAZUS database obtains essential facilities data from the Homeland Infrastructure Foundational-Level Data (except for wastewater treatment plants). The drawbacks of this database are that some facilities may not be represented or they could be in the wrong geographic location [28]. The HAZUS database was supplemented using SimplyAnalytics and the 2018 USGS National Structures Datasets data. SimplyAnalytics is a web-based application for visualizing social and economic data within the US and Canada. SimplyAnalytics was used to search for businesses with codes related to education and medical care. Next, spatial locations and addresses were individually verified and adjusted using Google and Google Street View. Floor elevation for hospitals was assumed to be at 3ft above grade, and all other facilities were assumed to be at grade [26]. A total of 672 facilities within the extent of the study area were used for this analysis.
Wastewater treatment data points are part of the HAZUS-HM Utility Lifelines database. This dataset was developed by Atkins (published in 2014) and is based on the Environmental Protection Agency Envirofacts Data Warehouse (https://enviro.epa.gov/, accessed on 19 May 2022). Wastewater treatment plants are categorized and valued by size, as follows: small ($60,000), medium ($200,000), and large ($720,000). The cost of damage is estimated as a percentage of the total valuation. The plants are assumed to be functional to a depth of under 4ft of water, and the assumed elevation of these structures is 3ft above grade [26]. The location of these plants was also verified using Google Maps and associated imagery. There is a total of 32 wastewater treatment plants within the study area. The critical facilities and utility stations’ reported output includes a percent damage estimate, building damage cost (where available), and the average depth of flooding.
3.2.4. Roads and Bridges
Roads were mapped using the U.S. Census TIGER data. This dataset presents several geographic features such as bike paths, alleys, roads, and unpaved roads. For this analysis, select features were used to represent public, paved infrastructure; these included ramps, primary roads, secondary roads, and local neighborhood roads (MAF/TIGER Feature Class Codes: S1630, S1100, S1200, and S1400, respectively). The most common type of road within the study region is local neighborhood roads with 22,426 km of length (Table 3).
Table 3.
Summary of total road length for the study site. This table presents the MAF/TIGER Feature Class Codes (MTFCC), class description, and road length in the region.
Depth-damage curves are not available for roads, therefore, road damage was determined by exposure to flooding. This study used a repair-cost estimate to calculate potential damage to roads exposed to flooding. Although road-exposure estimates are available through HAZUS, the road inventory is limited to primary roads, and exposure is based on the default value of roads [50]. Similar to HAZUS, this study assumed the potential for damage if road feature intersected the flood layer, regardless of flood depth. To enhance the exposure value, road repair costs were obtained from published milling and resurfacing costs. To avoid over-estimating potential losses, the milling and resurfacing cost was chosen over the cost of new construction, which is approximately six times the cost of milling and resurfacing. New construction is more costly because it involves additional preparation steps (clearing the construction site, excavation, installing utility holes, and culverts), while milling and resurfacing involves only the grading of the damaged road surface and re-paving—which is more likely the kind of repairs that would be needed for flooded roads. This analysis used data from the Florida Department of Transportation (FDOT) because it was geographically appropriate for the study area. The FDOT provides construction estimates that consider the costs associated with road repairs, such as maintenance of traffic, labor, materials, and costs associated with litter removal [51]. Because of the variety of road types in the region, the costs of urban and rural roads were averaged for each road type (Table 4). The length of roads exposed to flooding was multiplied by the corresponding cost-per-mile for each scenario.
Table 4.
Road Milling and Resurfacing Cost [51].
Lastly, highway bridges were also considered part of the economic assessment. The only comprehensive bridge database available was that found within the HAZUS inventory. Highway bridges considered are those that span 20 ft or more. HAZUS does not utilize a depth damage curve for bridges; instead, it considers the probability of failure (or loss of function) due to the potential for scour and bridge span type (simple vs. continuous) and flood return period [26]. Damage cost is calculated as:
The probability of failure (in percent) is a predetermined value associated with bridge type and flood return period (more detail in table 7.2 of HAZUS Flood Technical Manual) [26]. The 0.25 is a constant based on expert opinion, which relates to the probability of failure to damage [26]. Within the study site, there is a total of 162 bridges.
3.2.5. Vehicles
A flood event may damage vehicles if they are within the extent of floodwaters. These include vehicles at residences, parking facilities, business locations, or parked at motor vehicle dealers and repair facilities [26]. The number of vehicles in a Census block is part of the HAZUS database; this database was generated by relating the number of vehicles to square footages of different occupancy groups within Census blocks. Damage in relation to flood depth is shown in Table 5.
Table 5.
Vehicle Depth (ft)-Damage (%) Relationship [26].
3.2.6. Crops
The spatial extent of crops was mapped using the 2018 USDA’s Cropland Data Layer (CDL) [52]. The CDL is produced yearly by the National Agricultural Statistics Services and uses satellite imagery to classify crops [53]. Satellite imagery for the 2018 CDL are derived from Landsat 8 OLI/TIRS, the Disaster Monitoring Constellation (DMC) DEIMOS-1 and UK2, ISRO ResourceSat-2 LISS-3, and ESA SENTINEL-2 [54]. The crop area (in acres) was calculated and summarized to the hexagon grid for each scenario. The value of crops was obtained from the Land Values 2018 Summary Report [55]; from this report, the value-per-acre of cropland is $2780/acre for Mississippi, $3080/acre for Alabama, and $6810/acre for Florida. Most crops within the study area are categorized as cotton and peanuts—each over 3000 acres; smaller crops include corn, pecans, soybeans and oats (<100 acres each). This study did not include hay or pasture as a crop.
3.2.7. Displaced People
Within the HAZUS displacement module, individuals and households are considered displaced when there is reduced access to homes due to flooding, regardless of building damage. Access to homes is assumed to be obstructed at a flood depth of 6 inches (15.2 cm) or more, corresponding to a typical curb height [26]. A portion of the displaced population is adjusted by an age and income factor to determine the number of individuals that may need temporary shelter. The shelter algorithm uses a category weight for income (weight = 0.8) and age (weight = 0.2) to determine population statistics (for more information, see equations 13-5 and 13-6 in the HAZUS-MH Flood Model User Manual) [50]. The population and household information in HAZUS are based on the 2010 Census. There is a total population of 1,363,760 people within the study area and a total number of households of 537,981.
3.3. Data Processing and Workflow
Analyses in HAZUS were conducted by regions to reduce the processing time and the number of processing errors. Region 1 included Taylor, Franklin, Wakulla, Jefferson, and Taylor Counties, FL. Region 2 included Bay, Walton, Okaloosa, Santa Rosa, and Escambia Counties, FL. Region 3 included Mobile and Baldwin Counties, AL. Lastly, Region 4 included Hancock, Harrison, and Jackson Counties, MS.
As previously mentioned, most of the HAZUS inventory was not modified except for essential facilities. The location and facility details were updated using the Comprehensive Data Management System [56]. The HAZUS analyses focused on coastal flood hazards and used user-defined flood depth data for each scenario. A model run was performed for each SLR scenario and region for a total of 40 model runs (four regions, five 1% AEP scenarios, and five 0.2% AEP scenarios). HAZUS output was exported as one shapefile per theme (building and content loss, essential facilities, wastewater treatment plants, vehicles, bridges, and displaced people).
For each SLR scenario, roads were masked to the extent of inundation. Then each shapefile was clipped to the hexagon grid. Next, the exposed length of roads was calculated by dissolving the road line features by grid cell and road type. Once the length-of-exposed roads were established, the repair cost was calculated using the values in Table 4.
Similar to other themes, crops were assessed for each of the 10 scenarios. Crops included raster CDL raster values 1, 3–36, 38–58, 60–74, and 209–242. Cells identified as aquaculture, open water, developed, barren, forest, shrubland, grass, wetlands, or hay and seed were excluded from the analysis. An overlay of crop and inundation data was used to identify crops exposed to storm surge flooding. Next, zonal statistics were used to sum the area of crops inundated within each hexagon grid cell. The zonal statistic results were exported as a table, then joined back to the hexagon grid file. Once joined, the exposure value was calculated using each corresponding state’s crop-value per acre.
Data summaries were developed using the following steps:
- For each HAZUS output theme (i.e., buildings, roads, displaced people), merge all regional output into a site-wide file.
- Join the present, 0.2 m, 0.5 m, 1.2 m and 2.0 m SLR scenarios for the 100- and 500- year flood-return scenario. This reduces the number of files for each result category from 10 to two files.
- Each output theme was joined to the hexagon grid.
- Raster data (crops exposure) was summarized using zonal statistics assigned to grid cell as described in Section 3.3.
- For the line files (roads) files, lines were clipped, and total length summarized to the grid cells (see Section 3.3).
- Point data (bridges) was spatially joined to the grid using the intersect match option and dissolved by grid cell using the sum value of damage.
- Polygon data (buildings, vehicles, and displaced people) was represented at the Census block level and joined to the hexagon grid using the match option ‘have their centers in’. Census-block level data was then dissolved by grid cell, resulting in the sum of values.
4. Discussion
As with any study, data and modeling limitations exist. First, this assessment did not consider all costs related to storm surge flooding. For example, the cost of cleanup and debris removal and impacts on port facilities and other business disruptions are other important considerations for an economic assessment. In addition, damage to natural resources such as beaches and dunes and the cost of repair of natural infrastructure are not included. Further, other indirect impacts such as health-related costs, and other social factors such as stress, loss of livelihood, or mass migration, were not considered. In addition, this work only captures damage resulting from storm surge flooding. It does not consider damage from wind or rain-induced flooding, which can significantly contribute to disaster costs.
The data used here also presents limitations. For example, the building stock data is not always reflective of on-the-ground conditions, particularly in areas that have experienced rapid growth and new development. Further, the replacement cost of buildings is not always comparable to appraisal district property values, as noted by previous studies [57,58]. The HAZUS building database mainly reflects residential buildings and is deficient in the estimates associated with commercial, religious, agriculture, industrial, and government buildings. Recently, the US Census Bureau released the results of their latest demographic, social, and economic survey (2020); these can be incorporated into future studies. In the same manner, facilities, roads, and other infrastructure are continually changing and are likely outdated by the time studies are completed and made publicly available.
More research is needed to understand the relationship between storm surge flooding and damages to roads and crops. Detailed data can help construct better algorithms for estimating damage.
5. Conclusions
This work aimed to develop a spatial product that can enhance resilience and SLR planning in the Northern Gulf of Mexico. This work created a dataset to communicate the socioeconomic consequences of flooding within the 1% and 0.2% AEP under four SLR scenarios. This manuscript describes the inputs and methods for developing the dataset, describes the organization and contents, and provides accessibility information.
6. User Notes
The dataset and metadata can be accessed through the Gulf of Mexico Research Initiative Information and Data Cooperative (GRIIDC) at https://data.gulfresearchinitiative.org/data/HI.x801.000:0001 (accessed on 22 May 2022).
Author Contributions
Conceptualization, D.C.D.A., D.Y., S.C.H. and M.V.B.; formal analysis and investigation, data curation and writing-original draft, D.C.D.A.; writing-review and editing, D.Y., S.C.H. and M.V.B.; project administration, D.Y. and S.C.H.; funding acquisition, S.C.H. All authors have read and agreed to the published version of the manuscript.
Funding
This effort was funded in part under awards NA10NOS4780146 and NA16NOS4780208 from the National Oceanic and Atmospheric Administration (NOAA) Center for Sponsored Coastal Ocean Research (CSCOR) and the Office of Education Educational Partnership Program award NA16SEC4810009. Its contents are solely the responsibility of the award recipient and do not necessarily represent the official views of the U.S. Department of Commerce, National Oceanic and Atmospheric Administration. Any opinions, findings, conclusions, or recommendations expressed in this publication are those of the author(s) and do not necessarily reflect the view of the U.S. Department of Commerce, National Oceanic and Atmospheric Administration.
Institutional Review Board Statement
Not applicable.
Informed Consent Statement
Not applicable.
Data Availability Statement
Data are openly available at https://data.gulfresearchinitiative.org/data/HI.x801.000:0001 under CC0 license.
Acknowledgments
The authors would like to thank Renee Collini (Program for Local Adaptation to Climate Effects|Sea Level Rise) and Christine Addison Buckel (NOAA National Centers for Coastal Ocean Science) for sharing their expertise and providing their user feedback during the development of this dataset. Additionally, we’d like to thank the three reviewers for taking their time in evaluating the manuscript and providing feedback. The authors dedicated this work to the memory of our dear colleague and mentor, Scott C. Hagen.
Conflicts of Interest
The authors declare no conflict of interest.
References
- WMO. Atlas of Mortality and Econoic Losses from Weather, Climate, and Water Extremes (1970–2019); World Meteorological Organization: Geneva, Switzerland, 2021. [Google Scholar]
- Vitousek, S.; Barnard, P.L.; Fletcher, C.H.; Frazer, N.; Erikson, L.; Storlazzi, C.D. Doubling of Coastal Flooding Frequency within Decades Due to Sea-Level Rise. Sci. Rep. 2017, 7, 1399. [Google Scholar] [CrossRef] [PubMed]
- Ghanbari, M.; Arabi, M.; Obeysekera, J.; Sweet, W. A Coherent Statistical Model for Coastal Flood Frequency Analysis Under Nonstationary Sea Level Conditions. Earth’s Future 2019, 7, 162–177. [Google Scholar] [CrossRef]
- Wahl, T.; Jain, S.; Bender, J.; Meyers, S.D.; Luther, M.E. Increasing Risk of Compound Flooding from Storm Surge and Rainfall for Major US Cities. Nat. Clim. Chang. 2015, 5, 1093–1097. [Google Scholar] [CrossRef]
- Heinz, H.J. The Hidden Costs of Coastal Hazards: Implications for Risk Assessment and Mitigation; Island Press: Washignton, DC, USA, 2000. [Google Scholar]
- U.S. Census Bureau. American FactFinder—Community Facts. Available online: https://factfinder.census.gov/faces/nav/jsf/pages/community_facts.xhtml (accessed on 1 April 2019).
- Bilskie, M.V.; Angel, D.D.; Yoskowitz, D.; Hagen, S.C. Future Flood Risk Exacerbated by the Dynamic Impacts of Sea Level Rise Along the Northern Gulf of Mexico. Earth’s Future 2022, 10, e2021EF002414. [Google Scholar] [CrossRef]
- FEMA. National Flood Insurance Program Program Description 2002; Federal Emergency Management Agency: Washington, DC, USA, 2002.
- Brown, J.T. Introduction to FEMA’s National Flood Insurance Program (NFIP); Congressional Research Service Washington: Washington, DC, USA, 2016.
- FEMA Flood Zones|FEMA.Gov. Available online: https://www.fema.gov/flood-zones (accessed on 19 May 2022).
- Hughes, T.; Bellwood, D.; Folke, C.; Steneck, R.; Wilson, J. New Paradigms for Supporting the Resilience of Marine Ecosystems. Trends Ecol. Evol. 2005, 20, 380–386. [Google Scholar] [CrossRef] [PubMed]
- National Research Council (U.S.) (Ed.) Adapting to the Impacts of Climate Change; National Academies Press: Washington, DC, USA, 2010; ISBN 978-0-309-14591-6. [Google Scholar]
- Moser, S.C.; Ekstrom, J.A. A Framework to Diagnose Barriers to Climate Change Adaptation. Proc. Natl. Acad. Sci. USA 2010, 107, 22026–22031. [Google Scholar] [CrossRef]
- Fu, X.; Gomaa, M.; Deng, Y.; Peng, Z.-R. Adaptation Planning for Sea Level Rise: A Study of US Coastal Cities. J. Environ. Plan. Manag. 2017, 60, 249–265. [Google Scholar] [CrossRef]
- Kidwell, D.M.; Dietrich, J.C.; Hagen, S.C.; Medeiros, S.C. An Earth’s Future Special Collection: Impacts of the Coastal Dynamics of Sea Level Rise on Low-Gradient Coastal Landscapes: Coastal Dynamics of Sea Level Rise. Earth’s Future 2017, 5, 2–9. [Google Scholar] [CrossRef]
- DeLorme, D.E.; Kidwell, D.; Hagen, S.C.; Stephens, S.H. Developing and Managing Transdisciplinary and Transformative Research on the Coastal Dynamics of Sea Level Rise: Experiences and Lessons Learned. Earth’s Future 2016, 4, 194–209. [Google Scholar] [CrossRef]
- Stephens, S.H.; DeLorme, D.E.; Hagen, S.C. Evaluating the Utility and Communicative Effectiveness of an Interactive Sea-Level Rise Viewer Through Stakeholder Engagement. J. Bus. Tech. Commun. 2015, 29, 314–343. [Google Scholar] [CrossRef]
- Stephens, S.H.; DeLorme, D.E.; Hagen, S.C. Coastal Stakeholders’ Perceptions of Sea Level Rise Adaptation Planning in the Northern Gulf of Mexico. Environ. Manag. 2020, 66, 407–418. [Google Scholar] [CrossRef] [PubMed]
- NOAA Predicting Impacts of Sea Level Rise in the Northern Gulf of Mexico. Available online: https://coastalscience.noaa.gov/project/predicting-impacts-sea-level-rise-gulf-mexico/ (accessed on 2 June 2021).
- Bilskie, M.V.; Hagen, S.C.; Irish, J.L. Development of Return Period Stillwater Floodplains for the Northern Gulf of Mexico under the Coastal Dynamics of Sea Level Rise. J. Waterw. Port Coast. Ocean Eng. 2019, 145, 4019001. [Google Scholar] [CrossRef]
- Bilskie, M.V.; Hagen, S.C.; Alizad, K.; Medeiros, S.C.; Passeri, D.L.; Needham, H.F.; Cox, A. Dynamic Simulation and Numerical Analysis of Hurricane Storm Surge under Sea Level Rise with Geomorphologic Changes along the Northern Gulf of Mexico. Earth’s Future 2016, 4, 177–193. [Google Scholar] [CrossRef]
- Parris, A.S.; Bromirski, P.; Burkett, V.; Cayan, D.R.; Culver, M.E.; Hall, J.; Horton, R.M.; Knuuti, K.; Moss, R.H.; Obeysekera, J. Global Sea Level Rise Scenarios for the United States National Climate Assessment; National Oceanic and Atmospheric Administration: Washington, DC, USA, 2012; p. 37.
- Esri. Thematic Mapping with Hexagons; Esri: Redlands, CA, USA, 2015. [Google Scholar]
- FEMA Hazus. Available online: https://www.fema.gov/flood-maps/products-tools/hazus (accessed on 19 May 2022).
- Schneider, P.J.; Schauer, B.A. HAZUS—Its Development and Its Future. Nat. Hazards Rev. 2006, 7, 40–44. [Google Scholar] [CrossRef]
- FEMA Hazus-MH Flood Model Technical Manual 2013. Available online: https://www.fema.gov/sites/default/files/2020-09/fema_hazus_flood-model_technical-manual_2.1.pdf (accessed on 22 May 2022).
- Banks, J.C.; Camp, J.V.; Abkowitz, M.D. Adaptation Planning for Floods: A Review of Available Tools. Nat. Hazards 2013, 70, 1327–1337. [Google Scholar] [CrossRef]
- Allen, M.; Gillespie-Marthaler, L.; Abkowitz, M.; Camp, J. Evaluating Flood Resilience in Rural Communities: A Case-Based Assessment of Dyer County, Tennessee. Nat. Hazards 2020, 101, 173–194. [Google Scholar] [CrossRef]
- Maantay, J.; Maroko, A. Mapping Urban Risk: Flood Hazards, Race, & Environmental Justice in New York. Appl. Geogr. 2009, 29, 111–124. [Google Scholar] [CrossRef]
- Remo, J.W.F.; Pinter, N.; Mahgoub, M. Assessing Illinois’s Flood Vulnerability Using Hazus-MH. Nat. Hazards 2016, 81, 265–287. [Google Scholar] [CrossRef]
- Shepard, C.C.; Agostini, V.N.; Gilmer, B.; Allen, T.; Stone, J.; Brooks, W.; Beck, M.W. Assessing Future Risk: Quantifying the Effects of Sea Level Rise on Storm Surge Risk for the Southern Shores of Long Island, New York. Nat. Hazards 2012, 60, 727–745. [Google Scholar] [CrossRef]
- Cummings, C.A.; Todhunter, P.E.; Rundquist, B.C. Using the Hazus-MH Flood Model to Evaluate Community Relocation as a Flood Mitigation Response to Terminal Lake Flooding: The Case of Minnewaukan, North Dakota, USA. Appl. Geogr. 2012, 32, 889–895. [Google Scholar] [CrossRef]
- Aerts, J.C.J.H.; Botzen, W.J.W.; de Moel, H.; Bowman, M. Cost Estimates for Flood Resilience and Protection Strategies in New York City. Ann. N. Y. Acad. Sci. 2013, 1294, 49–68. [Google Scholar] [CrossRef] [PubMed]
- Lawrence, C.B.; Pindilli, E.J.; Hogan, D.M. Valuation of the Flood Attenuation Ecosystem Service in Difficult Run, VA, USA. J. Environ. Manag. 2019, 231, 1056–1064. [Google Scholar] [CrossRef] [PubMed]
- Kousky, C.; Walls, M.; Chu, Z. Flooding and Resilience: Valuing Conservation Investments in a World with Climate Change; Social Science Research Network: Rochester, NY, USA, 2013. [Google Scholar]
- Antolini, F.; Tate, E.; Dalzell, B.; Young, N.; Johnson, K.; Hawthorne, P.L. Flood Risk Reduction from Agricultural Best Management Practices. JAWRA J. Am. Water Resour. Assoc. 2020, 56, 161–179. [Google Scholar] [CrossRef]
- Chantavilasvong, W.; Guerrero, L. Application of HAZUS-MH Flood Model in Developing Countries: The Case of Piura, Peru. Nakhara J. Environ. Des. Plan. 2019, 16, 33–52. [Google Scholar] [CrossRef]
- Pratiwi, D.S.; Teguh, M.; Pawirodikromo, W. An Implementation of the HAZUS Method for Estimating Potential Damage of Residential Houses at Pacitan Sub-District, East Java, Indonesia Due to Earthquake. MATEC Web Conf. 2019, 280, 1008. [Google Scholar] [CrossRef][Green Version]
- Dietrich, J.C.; Zijlema, M.; Westerink, J.J.; Holthuijsen, L.H.; Dawson, C.; Luettich, R.A.; Jensen, R.E.; Smith, J.M.; Stelling, G.S.; Stone, G.W. Modeling Hurricane Waves and Storm Surge Using Integrally-Coupled, Scalable Computations. Coast. Eng. 2011, 58, 45–65. [Google Scholar] [CrossRef]
- Dietrich, J.C.; Tanaka, S.; Westerink, J.J.; Dawson, C.N.; Luettich, R.A.; Zijlema, M.; Holthuijsen, L.H.; Smith, J.M.; Westerink, L.G.; Westerink, H.J. Performance of the Unstructured-Mesh, SWAN+ADCIRC Model in Computing Hurricane Waves and Surge. J. Sci. Comput. 2012, 52, 468–497. [Google Scholar] [CrossRef]
- Alizad, K.; Hagen, S.C.; Morris, J.T.; Medeiros, S.C.; Bilskie, M.V.; Weishampel, J.F. Coastal Wetland Response to Sea-Level Rise in a Fluvial Estuarine System. Earth’s Future 2016, 4, 483–497. [Google Scholar] [CrossRef]
- Alizad, K.; Hagen, S.C.; Medeiros, S.C.; Bilskie, M.V.; Morris, J.T.; Balthis, L.; Buckel, C.A. Dynamic Responses and Implications to Coastal Wetlands and the Surrounding Regions under Sea Level Rise. PLoS ONE 2018, 13, e0205176. [Google Scholar] [CrossRef]
- Passeri, D.L.; Hagen, S.C.; Plant, N.G.; Bilskie, M.V.; Medeiros, S.C.; Alizad, K. Tidal Hydrodynamics under Future Sea Level Rise and Coastal Morphology in the Northern Gulf of Mexico: Tidal hydrodynamics under sea level rise. Earth’s Future 2016, 4, 159–176. [Google Scholar] [CrossRef]
- Plant, N.G.; Thieler, R.E.; Passeri, D.L. Coupling Centennial-Scale Shoreline Change to Sea-Level Rise and Coastal Morphology in the Gulf of Mexico Using a Bayesian Network. Earth’s Future 2016, 4, 143–158. [Google Scholar] [CrossRef]
- Niedoroda, A.W.; Resio, D.T.; Toro, G.R.; Divoky, D.; Das, H.S.; Reed, C.W. Analysis of the Coastal Mississippi Storm Surge Hazard. Ocean Eng. 2010, 37, 82–90. [Google Scholar] [CrossRef]
- Federal Emergency Management Agency. Using Hazus for Mitigation Planning; Federal Emergency Management Agency: Washington, DC, USA, 2018; p. 39.
- Schultz, P.W. Conservation Means Behavior. Conserv. Biol. 2011, 25, 1080–1083. [Google Scholar] [CrossRef]
- Nothaft, F.; Gromowski, A.; Tierney, A.; Moore, D.; Kopperud, G. 2019 Insurance Coverage Adequacy Report: The Effects of Underinsurance to the Property Ecosystem; CoreLogic: Irvine, CA, USA, 2019. [Google Scholar]
- Scawthorn, C.; Blais, N.; Seligson, H.; Tate, E.; Mifflin, E.; Thomas, W.; Murphy, J.; Jones, C. HAZUS-MH Flood Loss Estimation Methodology. I: Overview and Flood Hazard Characterization. Nat. Hazards Rev. 2006, 7, 60–71. [Google Scholar] [CrossRef]
- Federal Emergency Management Agency. Hazus-MH Flood Model User Manual 2013. Available online: https://www.fema.gov/sites/default/files/2020-09/fema_hazus_flood-model_user-manual_2.1.pdf (accessed on 22 May 2022).
- FDOT Cost Per Mile Models for Long Range Estimating 2019. Available online: https://www.fdot.gov/programmanagement/estimates/documents/costpermilemodels (accessed on 22 May 2022).
- U.S. Department of Agriculture CropScape—Cropland Data Layer. Available online: https://nassgeodata.gmu.edu/CropScape/ (accessed on 6 August 2020).
- Han, W.; Yang, Z.; Di, L.; Mueller, R. CropScape: A Web Service Based Application for Exploring and Disseminating US Conterminous Geospatial Cropland Data Products for Decision Support. Comput. Electron. Agric. 2012, 84, 111–123. [Google Scholar] [CrossRef]
- USDA CropScape and Cropland Data Layers FAQs. Available online: https://www.nass.usda.gov/Research_and_Science/Cropland/sarsfaqs2.php (accessed on 19 May 2022).
- National Agricultural Statistics Service. Land Values 2018 Summary; U.S. Department of Agriculture: Washington, DC, USA, 2019.
- FEMA. Hazus Comprehensive Data Management System (CDMS) User Guidance; FEMA: Washington, DC, USA, 2019.
- Gutenson, J.L.; Oubeidillah, A.A.; Ernest, A.N.S.; Zhu, L.; Zhang, X.; Sadeghi, S.T. Investigating Uncertainty in Developing Regional Building Inventories for Flood Damage Prediction. Nat. Hazards Rev. 2017, 18, 04016013. [Google Scholar] [CrossRef]
- Shultz, S.D. Accuracy of HAZUS General Building Stock Data. Nat. Hazards Rev. 2017, 18, 04017012. [Google Scholar] [CrossRef]
Publisher’s Note: MDPI stays neutral with regard to jurisdictional claims in published maps and institutional affiliations. |
© 2022 by the authors. Licensee MDPI, Basel, Switzerland. This article is an open access article distributed under the terms and conditions of the Creative Commons Attribution (CC BY) license (https://creativecommons.org/licenses/by/4.0/).