Abstract
Taita Taveta County (TTC) is one of the world’s biodiversity hotspots in the highlands with some of the world’s megafaunas in the lowlands. Detailed mapping of the terrestrial ecosystem of the whole county is of global significance for biodiversity conservation. Here, we present a land cover map for 2020 based on satellite observations, a machine learning algorithm, and a reference database for accuracy assessment. For the land cover map production processing chain, temporal metrics from Sentinel-1 and Sentinel-2 (such as median, quantiles, and interquartile range), vegetation indices from Sentinel-2 (normalized difference vegetation index, tasseled cap greenness, and tasseled cap wetness), topographic metrics (elevation, slope, and aspect), and mean annual rainfall were used as predictors in the gradient tree boost classification model. Reference sample points which were collected in the field were used to guide the collection of additional reference sample points based on high spatial resolution imagery for training and validation of the model. The accuracy of the land cover map and uncertainty of area estimates at 95% confidence interval were assessed using sample-based statistical inference. The land cover map has an overall accuracy of 81 ± 2.3% and it is freely accessible for land use planners, conservation managers, and researchers.
Dataset License: CC-BY.
1. Summary
With ever-growing human–environment interactions, monitoring of terrestrial ecosystems is crucial for sustaining environmental and economic benefits of biodiversity and ecosystem functioning. In this regard, land use and land cover maps provide vital information to land use planners and conservation managers for informed decision making. This is particularly important in a multifunctional landscape consisting of biodiversity hotspots and wildlife conservation areas, as they host unique flora and fauna of scientific and conservation interest.
Taita Taveta County (TTC) in southern Kenya is such an area that is rich in biodiversity, comprising Taita Hills and surrounding lowlands, covering an area of around 17,000 km2. The Taita Hills are part of the Eastern Arc Mountains, known for their rich endemism, and representing one of the world’s biodiversity hotspots [1]. The hilltops are covered with indigenous evergreen montane forest, forest plantations, agroforestry, and croplands [2]. The lowlands are characterized by Acacia-Commiphora thickets and shrublands, croplands, sisal farming (including one of the world’s biggest sisal estates), grassland, and wildlife conservation areas harboring megafauna (e.g., elephants, giraffes, rhinos, buffalos, etc.) [3]. Previous local mapping efforts in TTC have mainly been based on optical multispectral data [3,4,5,6]. All these studies cover smaller areas (either the highland or a small portion of lowlands surrounding Taita Hills), are outdated (e.g., the recent map available for Taita Hills is for the year 2011 based on commercial SPOT imagery), and lack detailed classes.
Despite an increase in the spatial and temporal resolution of freely available satellite data, global mapping products derived from these data lack the accuracy [7] and level of detail required by decision makers for planning and conservation in the areas of high biodiversity. For example, in the TTC lowlands, global land cover products are highly homogeneous and strongly disagree with respect to land cover types (i.e., the MODIS MCD12Q1 500 m land cover product shows around >90% of the lowland covered by grassland, while the European Space Agency (ESA) Climate Change Initiative Land Cover (CCI-LC) Sentinel-2 20 m land cover map of Africa shows around >75% of the lowlands covered by shrubland). Similarly, the Copernicus Global Land Cover (CGL-LC) based on a PROBA-V sensor at 100 m resolution shows lowlands dominantly covered by shrubland. This grassland-shrubland confusion in global products was also well noted in a recent study in Africa [7]. In the highlands, discrepancies have been even stronger among products where, for instance, agroforestry was mapped as woody savanna in a MODIS product, as croplands in an ESA CCI-LC product, and as forest in a CGL-LC product including the sisal plantation in the lowlands. Hence, an up-to-date, detailed, and accurate mapping of the TTC, as well as an efficient monitoring method are very important to understand the state of the terrestrial ecosystem.
Although high spatial and spectral resolution airborne imaging spectroscopy (i.e., airborne hyperspectral remote sensing) data can provide good results for land cover classification, they are not suited for regular monitoring of large areas due to the high cost of data acquisition. In this regard, freely available radar, optical, and topoclimatic data offer an advantage through providing wider feature space for land cover classification using machine learning (ML) algorithms. Radar backscatter is sensitive to the size, shape, water content, and texture (i.e., smoothness or roughness) of a surface and compliments optical sensors, which mainly provide information about vegetation biophysical properties or greenness, as well as surface reflectance and albedo. As topography and climate play important roles in the distribution and biodiversity of vegetation, they provide additional information for training ML classification models [8,9].
In this paper, we present a land cover map of TTC, for the year 2020, at 20 m resolution. Along with the map, a reference database comprising 3628 points collected from field observations and interpretation of high-resolution imagery is provided. The mapping approach uses Sentinel-1 radar, Sentinel-2 optical, and topoclimatic data, together with a machine learning algorithm. Accuracy and area uncertainty of the classification is assessed based on probability sampling inference at 95% confidence interval. The approach is based on open data and fully implemented in Google Earth Engine (GEE) and can be used for production of a land cover map for a desired year and monitoring of land cover changes whenever Sentinel data are available. This allows land use planners and conservation managers to routinely monitor the state of the ecosystem in this unique biodiversity hotspot.
2. Data Description
The land cover map and reference dataset can be accessed from Mendeley Data (https://data.mendeley.com/datasets/xv24ngy2dz/2) (accessed on 20 January 2022) [10], which is an open research data repository. The dataset contains a land cover map in raster GeoTiff format with associated style information in QGIS software in QML format, and two reference databases in shapefile format, one for classification and the other for sample-based accuracy assessment. Detailed data description and map visualization are presented in the following sections.
2.1. Land Cover Map
The land cover map was prepared, for the year 2020, as displayed in Figure 1 and a closer view of Taita Hills is also provided in Figure 2. The map was produced using temporal metrics from Sentinel-1 and Sentinel-2 satellites, and topoclimatic metrics (Section 3.2.1). These data were used as input in the gradient tree boost (GTB) classification algorithm (Section 3.2.2). The map has a sample-based overall classification accuracy of 81 ± 2.3%. Class level accuracy ranges from 37% in riverine forest to 96% in sisal plantation. In total, the map comprises 14 classes with shrubland (49 ± 4.4% of area) and grassland (37 ± 5.3% of area) being the dominant land cover classes, while the remaining classes represent small fractions (Section 3.2.3). The data are available for downloading in GeoTiff raster format with geographic coordinate system and WGS84 reference ellipsoid or EPSG 4326.
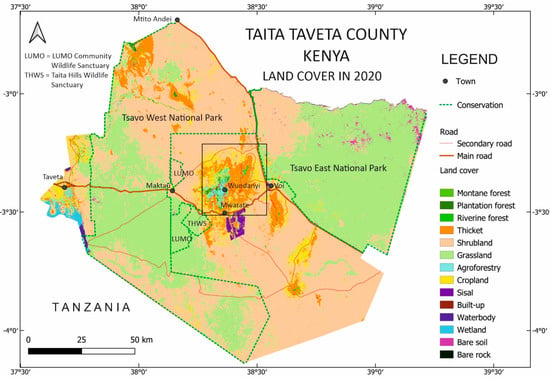
Figure 1.
Land cover map of Taita Taveta County for the year 2020. Conservation areas are marked with a green broken line which shows the Tsavo West and Tsavo East national parks and boundaries of the Taita Hills Wildlife Sanctuary (THWS) from the World Database on Protected Areas (WDPA). The box at the center shows the location of the Taita Hills.
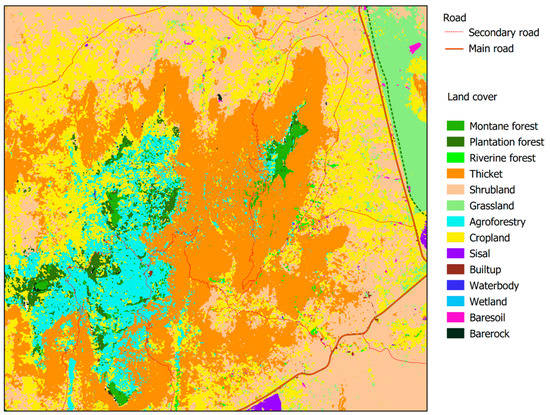
Figure 2.
A closer view of Taita Hills (see location in Figure 1), showing the extent of montane forest fragments and other land cover classes.
2.2. Land Cover Nomenclature
The classification legend and class names follow earlier studies in the area [2,3,4,5] (Clark and Pellikka 2009, Pellikka et al., 2009, Heikinheimo 2015, Pellikka et al., 2018) (Table 1). The legend is also in line with land cover and vegetation types in [11], as described in the World Agroforestry Centre Land Degradation Surveillance Framework [12]. Detailed classes are provided for different types of forest (montane, plantation, and riverine forest) and cropland (agroforestry, sisal, and cropland). Field photographs of vegetation classes are displayed in the Appendix A (Figure A1). In contrast to earlier studies [3], the woodland class was omitted as it included mainly riverine forest, agroforestry, and plantation forests, which are now classified as separate classes.

Table 1.
Land cover classification scheme for the Taita Taveta County land cover map.
2.3. Reference Database
A reference database in ESRI shapefile format consists of 3628 sample points and represents various land cover classes in TTC. Among these, 806 sample points were collected from the field using a consumer grade handheld GPS (Garmin GPSMAP64) and the GPX waypoint files were organized in shapefile format using the QGIS 3.20.0 software (www.qgis.org) (accessed on 20 January 2022). The remaining 2822 points were interpreted using high-resolution Google Earth imagery. Spatial distribution of these points is given in Figure 3. The reference database was used to train and cross-validate the GTB classification algorithm.
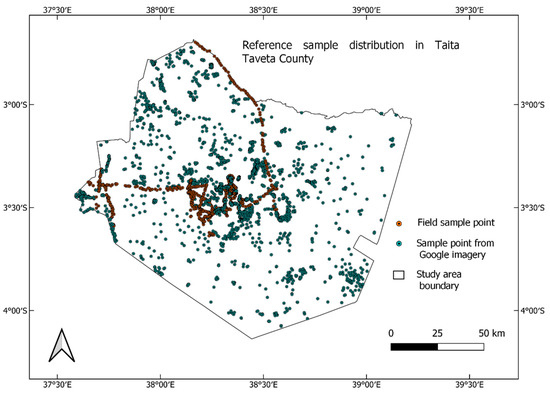
Figure 3.
Distribution of reference points collected from the field (red dots) and interpreted from very high spatial resolution Google imagery (green dots).
3. Methods
3.1. Input Data and Preprocessing
3.1.1. Sentinel-1 and Sentinel-2 Imagery
Sentinel-1 and Sentinel-2 data were provided by the European Space Agency (ESA) under the Copernicus program. Sentinel-1 C-band synthetic aperture radar (SAR) data were available in different spatial resolutions, polarizations, and instrument modes. We used interferometric wide swath mode at 10 m spatial resolution and ascending orbital pass. Short-dry season (January and February) 2020 composite in co-polarization (VV) and cross-polarization (VH) were selected to minimize the impact of precipitation on the SAR signal [13].
The backscatter coefficient (σ°) provided in decibel (db) on the Google Earth Engine (GEE) computing platform [14] was radiometrically calibrated and corrected for thermal noise and terrain effects using ESA Sentinel-1 toolbox. We included additional processing steps involving speckle filtering and radiometric terrain normalization to produce analysis-ready data (ARD) [15].
Sentinel-2 with its twin satellites (S2A and S2B) provides 13 bands with temporal resolution of 5 days and spatial resolution range of 20–60 m. We used Level-2 (L2) surface reflectance consisting of 9 bands (2–8, 8A, and 12) in the visible to shortwave infrared spectral range with spatial resolution ranging from 10 m to 20 m. Band 11 was discarded due to its high correlation with Band 12. Clouds were masked using a maximum cloud probability threshold of <20% and used for calculating temporal metrics.
To harmonize the spatial resolution, Sentinel-1 and Sentinel-2 data were resampled to a common spatial resolution of 20 m. Furthermore, all the other data (DEM and precipitation, Section 3.1.2) were also resampled to the same resolution.
3.1.2. Topoclimatic Data
The digital elevation model (DEM) at 30 m resolution was obtained from the NASA Shuttle Radar Topography Mission (SRTM). We used the version 3 SRTM void-filled product for extracting topographic metrics (elevation, slope, and aspect). The rainfall data were obtained from the University of California (WorldClim BIO Variables V1). It was prepared from interpolation of weather station data at 1 km resolution considering elevation and geographic location [16].
3.2. Land Cover Classification Workflow
There were three steps to the land cover classification workflow (Figure 4). First, input data from Sentinel-1, Sentinel-2, topoclimatic variables (DEM and rainfall data), and training data (field and high-resolution imagery) were used to run the GTB classification algorithm. Second, the classification map was used for stratification and generation of reference random sample locations. Third, the accuracy and uncertainty of classification and area estimates were done using reference random samples independently collected and interpreted based on very high spatial resolution imagery (Google Earth imagery), earlier land cover and vegetation mappings made in the area [2,15], and the authors’ knowledge regarding the land cover of the area. Details of each processing step are provided below in Section 3.2.1, Section 3.2.2, Section 3.2.3. and Section 3.2.4. Land cover classification was done in GEE, the code is provided in Supplementary Material. Map layout and production were performed using the QGIS software.
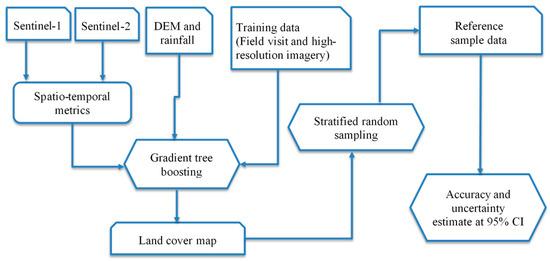
Figure 4.
Land cover classification methodology flow diagram. DEM, digital elevation model; CI, confidence interval.
3.2.1. Temporal and Topoclimatic Variables Used for Classification
Several spectral-temporal metrics, vegetation indices, and topoclimatic data were used as predictors (Table 2). From the total of 54 predictors, 13 metrics were from Sentinel-1, 39 metrics were from Sentinel-2 (including vegetation indices), and the remaining two metrices were from DEM and rainfall, respectively. Band 11 was discarded from the model due to its high correlation with Band 12 and other predictors.

Table 2.
Temporal and topoclimatic predictors derived from satellite observation (Sentinel-1, Sentinel-2), DEM, and rainfall data. VV, vertical-vertical; VH, vertical-horizontal; NIR, near infrared; SWIR, shortwave infrared; NDVI, normalized difference vegetation index; TCG, tasseled cap greenness; TCW, tasseled cap wetness. TCG and TCW were computed following Lastovicka et al. (2020).
3.2.2. Gradient Tree Boost Classification
The gradient boosting machine algorithm was used for land cover classification. We selected the GBM as it showed better prediction performance than other machine learning algorithms (e.g., random forest and CART). GBMs are ensemble machine learning algorithms that use decision trees as weak learners to make predictions [17]. Trees are iteratively added one at a time to the ensemble and fit to correct prediction error in the prior model for improving overall model performance. A total of 3628 sample points were used for training (70%) and validation (30%) of the model. The final model was run using 100 decision trees. The model had an out-of-bag classification accuracy of 84%.
3.2.3. Accuracy Assessment and Uncertainty Analysis
Accuracy and area uncertainty at 95% confidence interval were assessed following good practice recommendations based on sample-based statistical inference [18]. Random stratified class-proportional reference sample locations (1140 samples) were generated by fixing the target standard error at 0.01. Distribution of the sample location is provided in Figure 5. For montane and exotic forest stratum, reference samples were identified from field-verified tree species maps prepared using aerial photographs [2] and hyperspectral imagery [19]. For the remaining reference samples, land cover types were interpreted from Google Earth imagery, which were cross-checked with Bing Maps imagery. Details of class level accuracy and class area uncertainty are provided in Table 3. Furthermore, the classification error matrix is provided in Table 4.
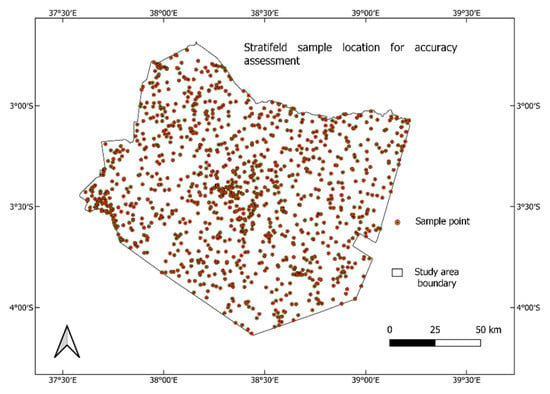
Figure 5.
Distribution of reference sample points for accuracy assessment.

Table 3.
Class level accuracy and area uncertainty matrix. Classes: 1, montane forest; 2, plantation forest; 3, riverine forest; 4, agroforestry; 5, thicket; 6, shrubland; 7, grassland; 8, cropland; 9, sisal; 10, built-up; 11, waterbody; 12, wetland; 13, bare soil; and 14, bare rock.

Table 4.
Land cover classification error matrix. Classes: 1, montane forest; 2, plantation forest; 3; riverine forest; 4, thicket; 5, shrubland, 6, grassland; 7, agroforestry; 8, cropland; 9, sisal; 10, built-up; 11, waterbody; 12, wetland; 13, bare soil; and 14, bare rock.
3.2.4. Post-Processing and Map Production
Isolated pixels in the classified map were removed and the map was smoothed by applying morphological smoothing in GEE. A circular kernel radius of 1.5 was used for smoothing to minimize its impact on classification.
4. Discussion
4.1. Importance of Using Multi-Source Data for Improved Classification
The combined use of feature spaces from radar, optical, and topoclimatic data yielded a classification accuracy of 81 ± 2.3% based on independently collected reference random samples. The use of multi-source data improved the accuracy of the gradient tree boost (GTB) classification model as compared with single source data. For example, using only optical data, the classification accuracy on the testing dataset was only 65%. When radar data were included in the model, the accuracy increased to 77%, which was a 12% increment. When topoclimatic variables were included, the accuracy increased from 77% to 85%, which improved the performance of the model by 8%. Based on variable importance score, topoclimatic data (elevation and precipitation), radar data (the 75 percentile or Q3 ratio between VV and VH polarization and 25 percentile VV polarization), and optical data (tasseled cap wetness, 25 percentile red band, and NDVI) were the most important variables.
In heterogeneous landscapes, achieving sufficient classification accuracy using only optical satellite imagery is challenging, and as a result, auxiliary data (e.g., topography) are used to improve classification [20]. Topography and climate have a direct or indirect control on the distribution and types of vegetation through their impact on temperature, moisture, and radiation regimes, as well as soil development and nutrient availability [8,21]. The biogeography of vegetation in the study area also shows a closer link with topoclimatic gradient as can be inferred from the distribution of montane forest in the highlands, thickets mainly along the slopes and foothills of the Taita Hills, and grassland and shrubland in the semi-arid lowlands (Figure 1 and Supplementary Figures S1 and S2). Nonetheless, a detailed investigation is required in the future to quantify impacts of topographic, edaphic, climatic factors, and human disturbances on the distribution of vegetation types in the region.
4.2. Limitations of the Study
Our classification carries some limitations associated with the data source and algorithm used. For example, the riverine forest class relatively has the highest omission and commission errors, which can be explained by several reasons. Although we used a small kernel size (1.5) for post-classification smoothing to remove isolated pixels and improve the result, this will impact smaller area classes such as riverine forest that spans a few Sentinel-2 pixels at 20 m resolution. Consequently, misclassification of riverine forest to other nearby classes (e.g., thicket, shrubland, grassland, and waterbody) increased the omission error. Spectral confusion with other forest classes in the highlands also causes commission error in riverine forest. The agroforestry class, next to riverine forest, has a high omission error. The misclassification of agroforestry to thicket occurs along the slopes of the Taita Hills. The occurrence of trees, together with croplands, in agroforestry creates spectral similarity with trees in thickets and can cause the omission error. Future studies using multi-source high spatial and spectral resolution data, and testing different types of machine and deep learning algorithms can shed more light on improving classification accuracy in such heterogeneous landscapes.
5. User Notes
The map provides detailed spatial information on the distribution of land use and land cover classes, such as montane forest, plantation forest, riverine forest, agroforestry, cropland, sisal, shrubland, and grassland. It can be used, for example, to support land use planning, natural vegetation conservation, watershed conservation, wildlife habitat protection, rangeland management, and research in Taita Taveta County, Kenya. The reference database can be used for validating land cover maps and testing new land cover classification algorithms and mapping approaches.
Supplementary Materials
The following supporting information can be downloaded at: https://www.mdpi.com/article/10.3390/data7030036/s1, GEE code, Figure S1: Elevation map of the study area (JAXA DEM 30 m resolution). Figure S2: Probability density plot showing distribution of natural vegetation across elevation gradient in the study area.
Author Contributions
Conceptualization, T.A.A., J.H. and P.K.E.P.; methodology, T.A.A., J.H. and I.V.; software, T.A.A. and I.V.; validation, T.A.A., J.H. and I.V.; formal analysis, T.A.A.; investigation, T.A.A.; resources, P.K.E.P.; data curation, T.A.A.; writing—original draft preparation, T.A.A.; writing—review and editing, P.K.E.P., J.H., I.V. and M.M.; visualization, T.A.A.; supervision, P.K.E.P. and J.H.; project administration, P.K.E.P.; funding acquisition, P.K.E.P. All authors have read and agreed to the published version of the manuscript.
Funding
This work is funded by the European Union DG International Partnerships under the DeSIRA (Development of Smart Innovation through Research in Agriculture) program (FOOD/2020/418-132) through the ESSA (Earth observation and environmental sensing for climate-smart sustainable agropastoral ecosystem transformation in East Africa) project.
Institutional Review Board Statement
Not applicable.
Informed Consent Statement
Not applicable.
Data Availability Statement
Sentinel-1 and Sentinel-2 data were provided by European Union/ESA/Copernicus. Digital elevation model at 30 m resolution was provided by NASA/USGS/JPL-Caltech. Precipitation data (WorldClim BIO Variables V1) were made available by the University of California, Berkeley. All data were accessed in GEE platform.
Acknowledgments
The research permit from the National Commission for Science, Technology & Innovation (NACOSTI/P/21/14534) in Kenya is acknowledged. Open access funding provided by University of Helsinki.
Conflicts of Interest
The authors declare no conflict of interest.
Appendix A
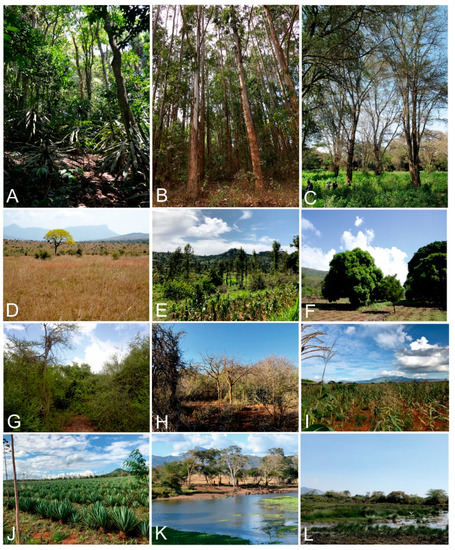
Figure A1.
Field photographs showing: (A) Montane forest, Taita hills, (B) plantation forest of eucalyptus, Taita hills, (C) riverine forest of Vachellia xanthophylla, Mwatate, (D) grassland, Taita Hills Wildlife Sanctuary, (E) highland agroforestry with Grevillea robusta trees, Taita Hills, (F) lowland agroforestry with mango trees (Mangifera indica), Mwatate, (G) Acacia-Commiphora thicket, Mwatate, (H) Acacia-Commiphora shrubland, Maktau, (I) cropland of maize (Zea mays), Maktau, (J) sisal (Sisal agave) estate, Mwatate, (K) water body, Taita Hills Wildlife Sanctuary, and (L) wetland, Taveta. Photos by Petri Pellikka, 2010–2021.
References
- Platts, P.J.; Burgess, N.; Gereau, R.; Lovett, J.; Marshall, A.; McClean, C.J.; Pellikka, P.K.E.; Swetnam, R.D.; Marchant, R. Delimiting tropical mountain ecoregions for conservation. Environ. Conserv. 2011, 38, 312–324. [Google Scholar] [CrossRef] [Green Version]
- Pellikka, P.K.E.; Lötjönen, M.; Siljander, M.; Lens, L. Airborne remote sensing of spatiotemporal change (1955−2004) in indigenous and exotic forest cover in the Taita Hills, Kenya. Int. J. Appl. Earth Obs. Geoinf. 2009, 11, 221–232. [Google Scholar] [CrossRef]
- Pellikka, P.K.E.; Heikinheimo, V.; Hietanen, J.; Schäfer, E.; Siljander, M.; Heiskanen, J. Impact of land cover change on aboveground carbon stocks in Afromontane landscape in Kenya. Appl. Geogr. 2018, 94, 178–189. [Google Scholar] [CrossRef]
- Clark, B.; Pellikka, P. Landscape analysis using multi-scale segmentation and object-oriented classification. In Recent Advances in Remote Sensing and Geoinformation Processing for Land Degradation Assessment; Röder, A., Hill, J., Eds.; CRC Press: Boca Raton, FL, USA, 2009; pp. 323–342. [Google Scholar]
- Heikinheimo, V. Impact of Land Cover Change on Aboveground Carbon Stocks in the Taita Hills, Kenya. Master’s Thesis, University of Helsinki, Helsinki, Finland, 2015. Available online: http://urn.fi/URN:NBN:fi-fe2017112251821 (accessed on 20 January 2022).
- Amara, E.; Adhikari, H.; Heiskanen, J.; Siljander, M.; Munyao, M.; Omondi, P.; Pellikka, P. Aboveground Biomass Distribution in a Multi-Use Savannah Landscape in Southeastern Kenya: Impact of Land Use and Fences. Land 2020, 9, 381. [Google Scholar] [CrossRef]
- Lesiv, M.; See, L.; Mora, B.; Pietsch, S.; Fritz, S.; Bun, H.; Sendabo, S.; Kibuchi, S.; Okemwa, J.; Derrik, O.; et al. Accuracy Assessment of the ESA CCI 20M Land Cover Map: Kenya, Gabon, Ivory Coast and South Africa; WP-19-009; IIASA Working Paper: Laxenburg, Austria, 2019; Available online: http://pure.iiasa.ac.at/id/eprint/16107/1/WP-19-009.pdf (accessed on 5 December 2021).
- Bunyan, M.; Bardhan, S.; Singh, A.; Jose, S. Effect of topography on the distribution of tropical montane forest fragments: A predictive modelling approach. J. Trop. For. Sci. 2015, 27, 30–38. [Google Scholar]
- Coblentz, D.D.; Riitters, K.H. Topographic controls on the regional-scale biodiversity of the south-western USA. J. Biogeogr. 2004, 31, 1125–1138. [Google Scholar] [CrossRef]
- Abera, T.A.; Vuorinne, I.; Munyao, M.; Pellikka, P.; Heiskanen, J. Taita Taveta County, Kenya-2020 Land cover map and reference database. Mendeley Data 2021. [Google Scholar] [CrossRef]
- White, F. The vegetation of Africa: A descriptive memoir to accompany the UNESCO/AETFAT/UNSO vegetation map of Africa. Nat. Resour. Res. 1983, 20, 356. [Google Scholar] [CrossRef]
- Vågen, T.-G.; Winowiecki, L.; Desta, L.T.; Tondoh, J.E. The Land Degradation Surveillance Framework (LDSF): Field Guide. 2013. Available online: https://www1.cifor.org/fileadmin/subsites/sentinel-landscapes/document/LDSF_Field_Guide.pdf (accessed on 25 November 2021).
- Benninga, H.J.F.; van der Velde, R.; Su, Z. Impacts of Radiometric Uncertainty and Weather-Related Surface Conditions on Soil Moisture Retrievals with Sentinel-1. Remote Sens. 2019, 11, 2025. [Google Scholar] [CrossRef] [Green Version]
- Gorelick, N.; Hancher, M.; Dixon, M.; Ilyushchenko, S.; Thau, D.; Moore, R. Google Earth Engine: Planetary-scale geospatial analysis for everyone. Remote Sens. Environ. 2017, 202, 18–27. [Google Scholar] [CrossRef]
- Mullissa, A.; Vollrath, A.; Odongo-Braun, C.; Slagter, B.; Balling, J.; Gou, Y.; Gorelick, N.; Reiche, J. Sentinel-1 SAR Backscatter Analysis Ready Data Preparation in Google Earth Engine. Remote Sens. 2021, 13, 1954. [Google Scholar] [CrossRef]
- Hijmans, R.J.; Cameron, S.E.; Parra, J.L.; Jones, P.G.; Jarvis, A. Very High Resolution Interpolated Climate Surfaces for Global Land Areas. Int. J. Climatol. 2005, 25, 1965–1978. [Google Scholar] [CrossRef]
- Friedman, J.H. Greedy boosting approximation: A gradient boosting machine. Ann. Stat. 2001, 29, 1189–1232. [Google Scholar] [CrossRef]
- Olofsson, P.; Foody, G.M.; Herold, M.; Stehman, S.V.; Woodcock, C.E.; Wulder, M.A. Good practices for estimating area and assessing accuracy of land change. Remote Sens. Environ. 2014, 148, 42–57. [Google Scholar] [CrossRef]
- Adhikari, H.; Valbuena, R.; Pellikka, P.; Heiskanen, J. Mapping forest structural heterogeneity of tropical montane forest remnants from airborne laser scanning and Landsat time series. Ecol. Indic. 2020, 108, 105739. [Google Scholar] [CrossRef]
- Hurskainen, P.; Adhikari, H.; Siljander, M.; Pellikka, P.K.E.; Hemp, A. Auxiliary datasets improve accuracy of object-based land use/land cover classification in heterogeneous savanna landscapes. Remote Sens. Environ. 2019, 233, 111354. [Google Scholar] [CrossRef]
- Franklin, J. Predictive vegetation mapping: Geographic modelling of biospatial patterns in relation to environmental gradients. Prog. Phys. Geogr. 1995, 19, 474–499. [Google Scholar] [CrossRef]
Publisher’s Note: MDPI stays neutral with regard to jurisdictional claims in published maps and institutional affiliations. |
© 2022 by the authors. Licensee MDPI, Basel, Switzerland. This article is an open access article distributed under the terms and conditions of the Creative Commons Attribution (CC BY) license (https://creativecommons.org/licenses/by/4.0/).