
Hybrid Wi-Fi and BLE Fingerprinting Dataset for Multi-Floor Indoor Environments with Different Layouts


Abstract
1. Introduction
- To the best of the authors’ knowledge, this is the first work to provide a large-scale location fingerprinting dataset for different layouts of the same indoor area. This work paves the way for the development of fingerprinting-based positioning techniques that are robust against indoor layout change, and it fosters reproducibility and comparability of techniques in this field.
- The dataset presented in this work provides the location fingerprints for both the Wi-Fi and BLE signals. This contribution will enable future work in this field to enhance localization performance by jointly exploiting both the Wi-Fi and BLE fingerprints.
- A comprehensive investigation is carried out to analyze the effects of the layout changes on the BLE and Wi-Fi signal variations as well as the localization performance of various baseline fingerprinting-based positioning techniques.
2. Related Works
2.1. UJI IndoorLoc Dataset
2.2. IPIN 2016 Tutorial, ALCALA 2017 Tutorial Dataset
2.3. Tampere University Dataset
2.4. Other Indoor Datasets and Research Gaps
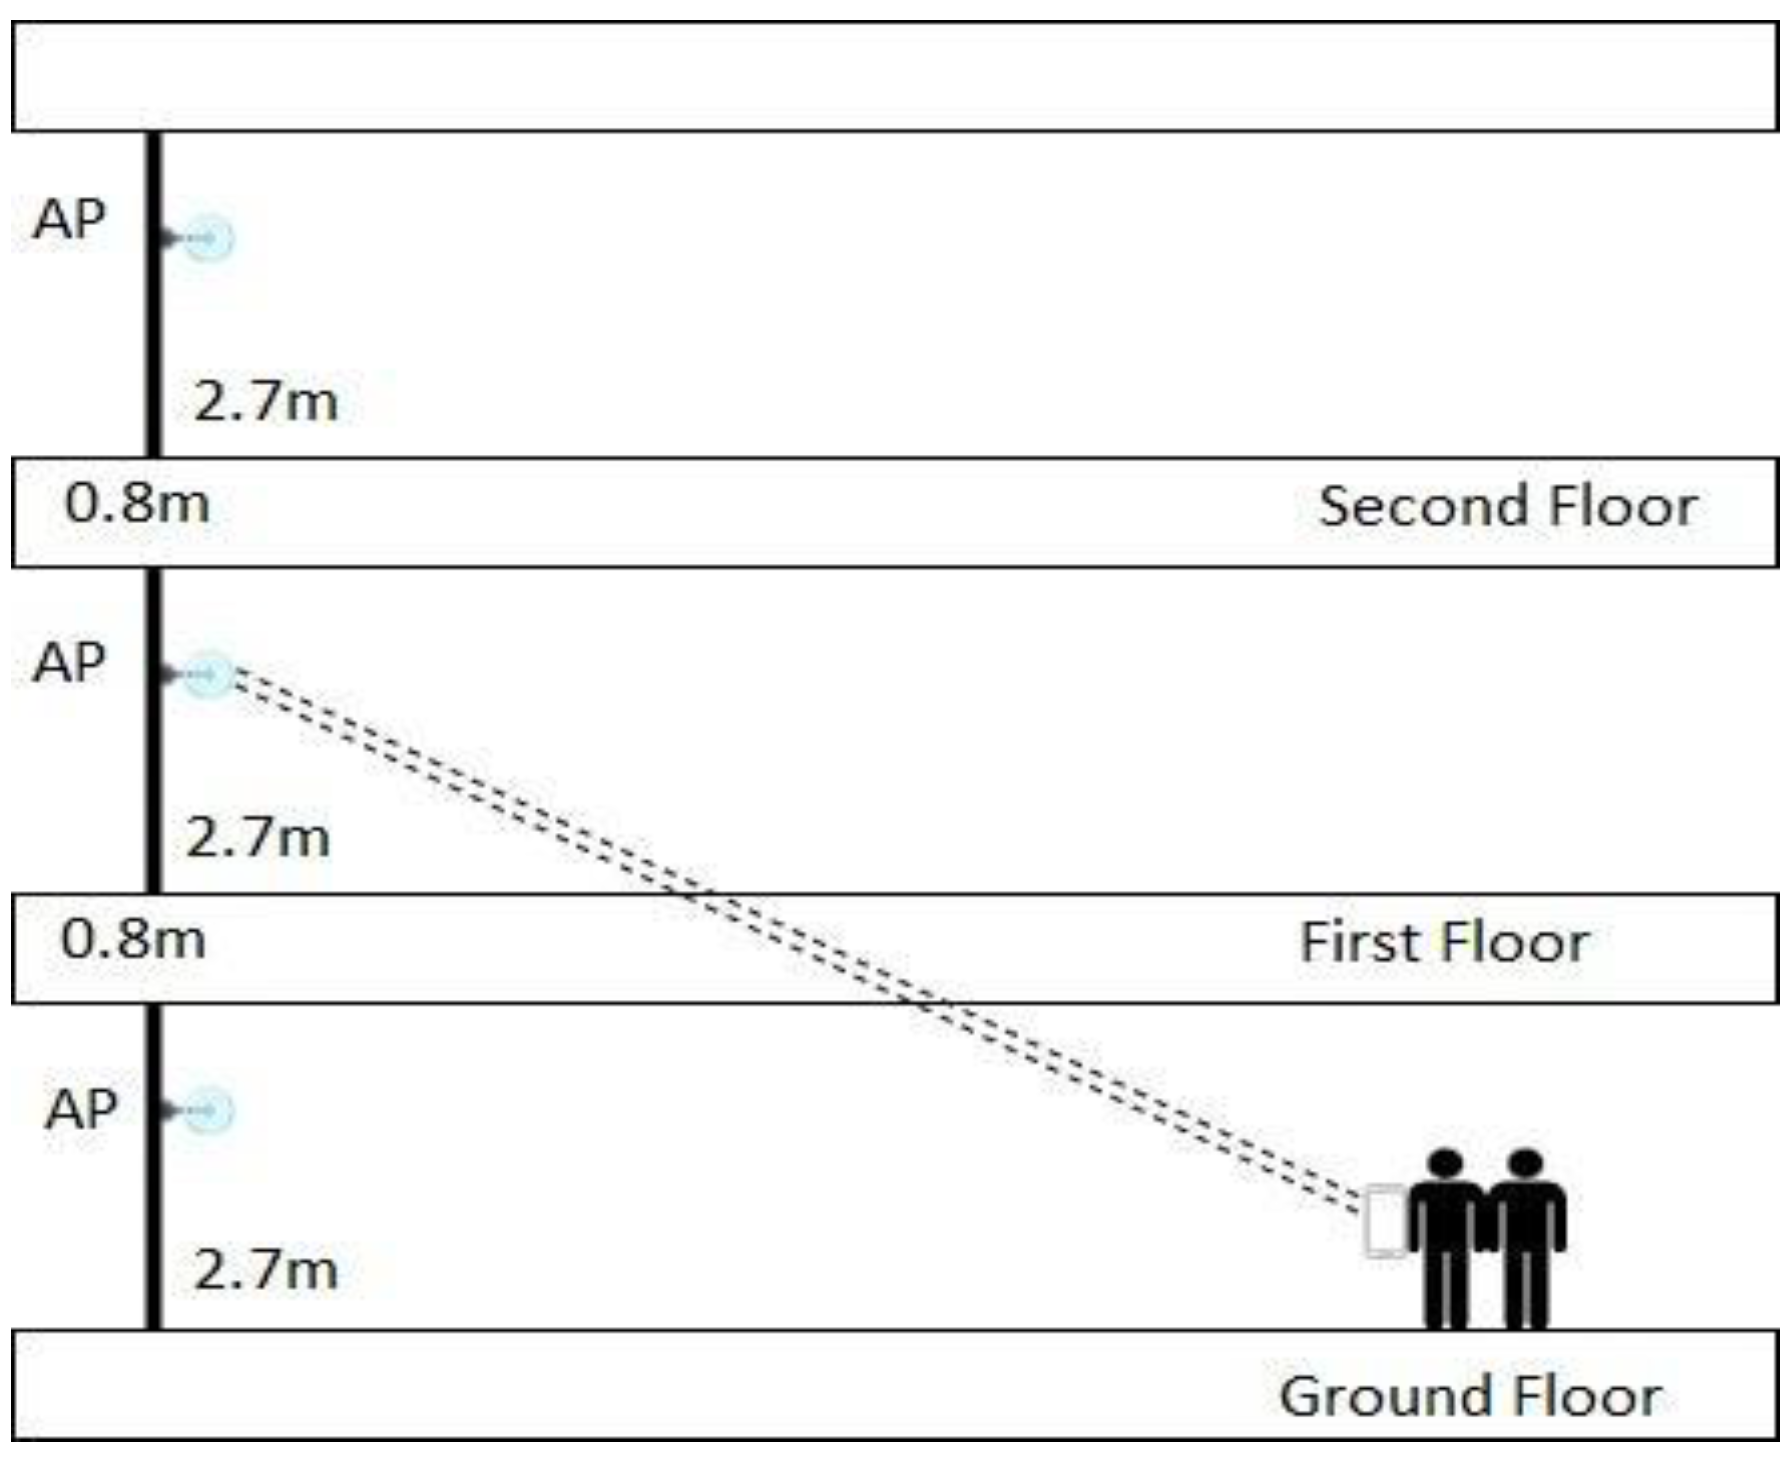
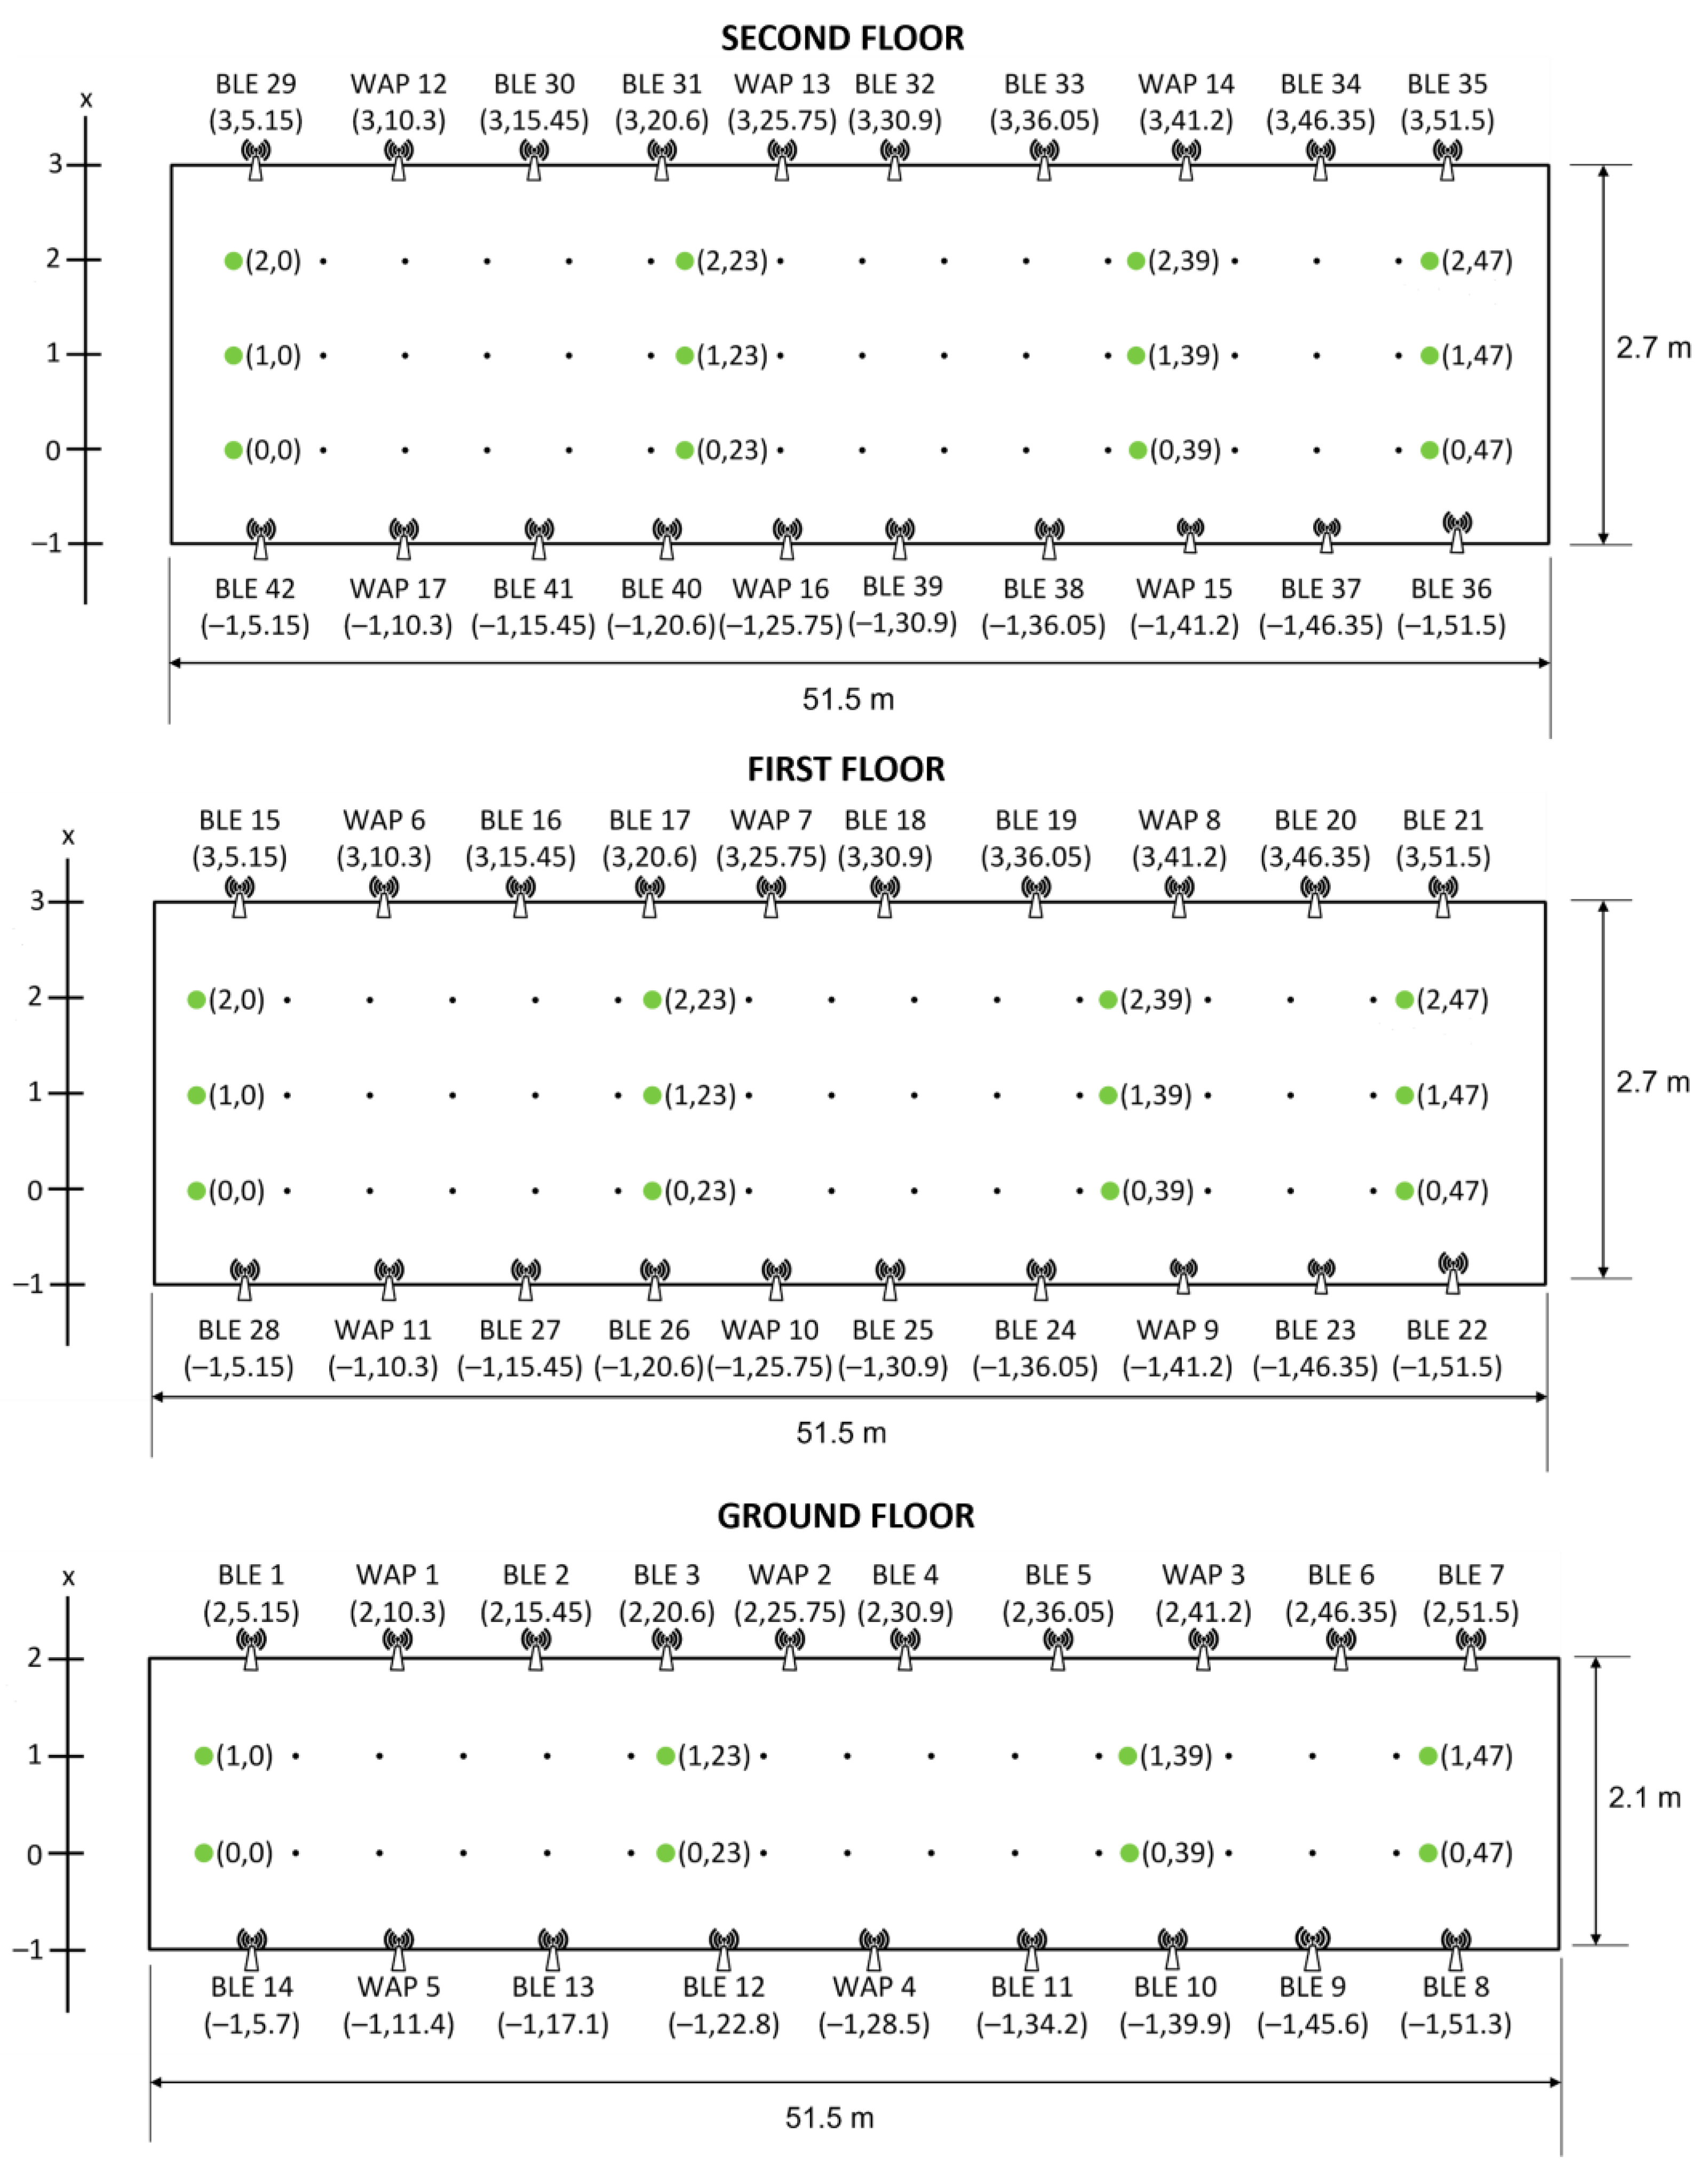
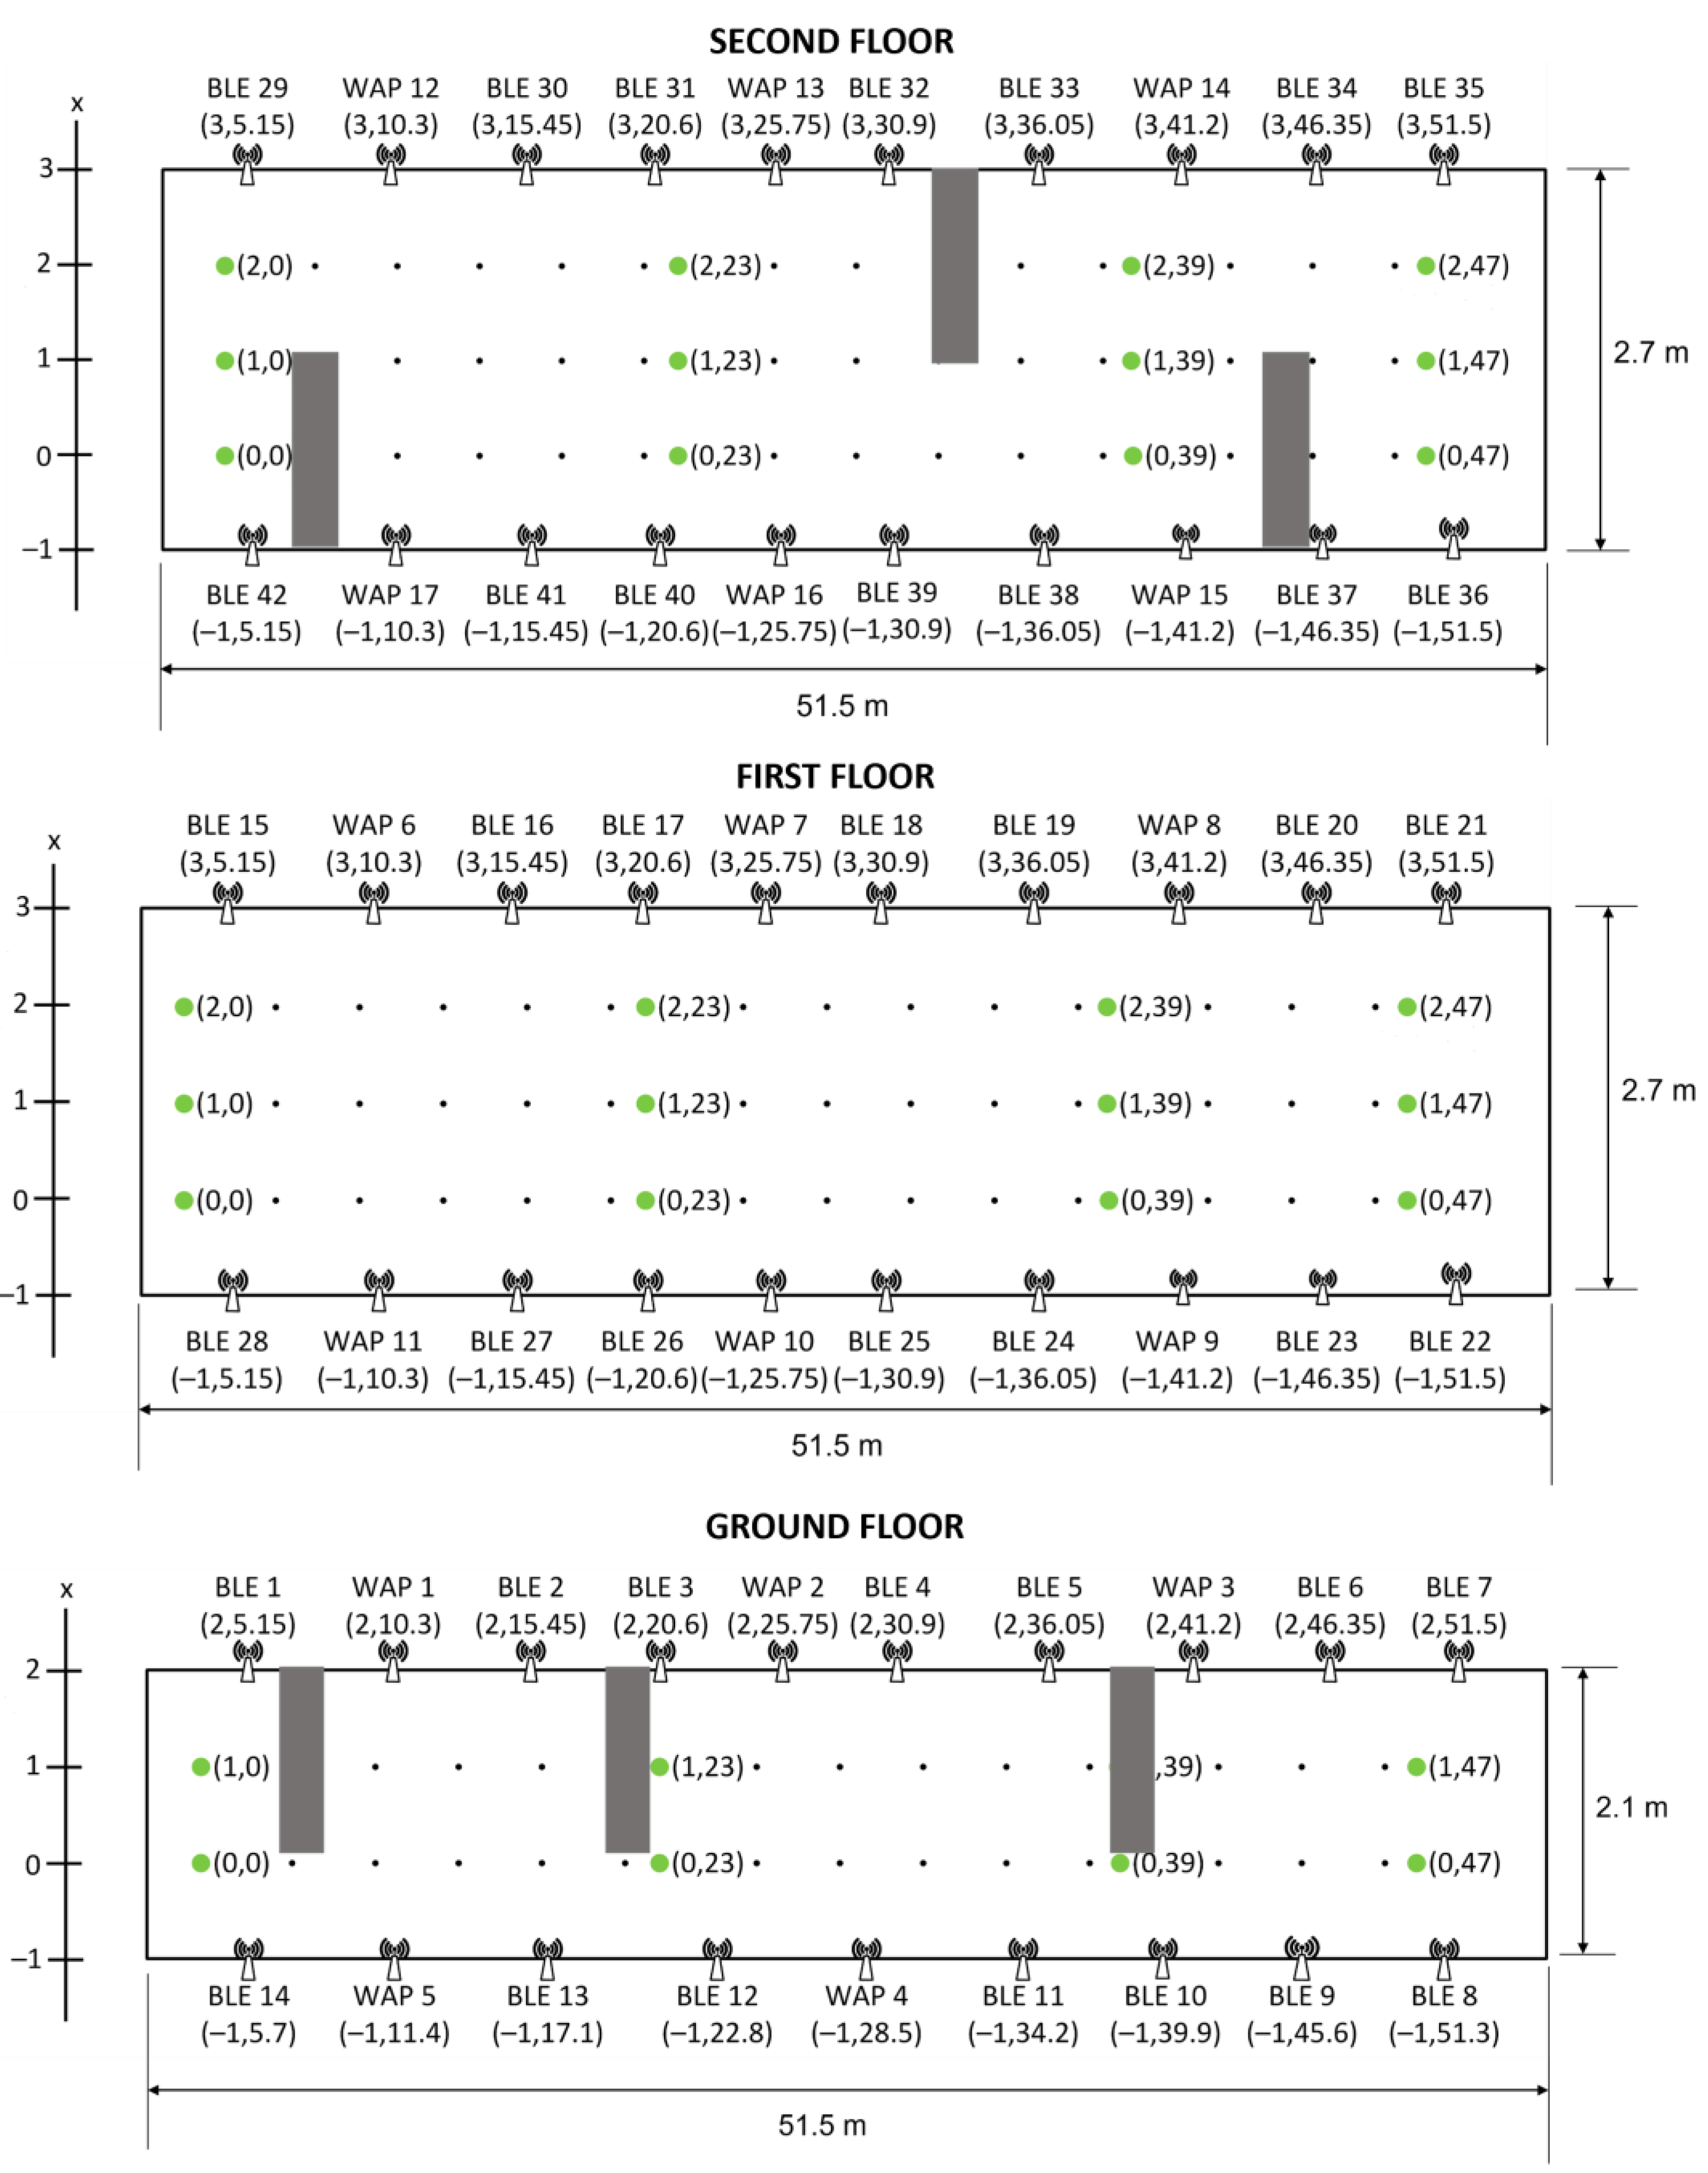
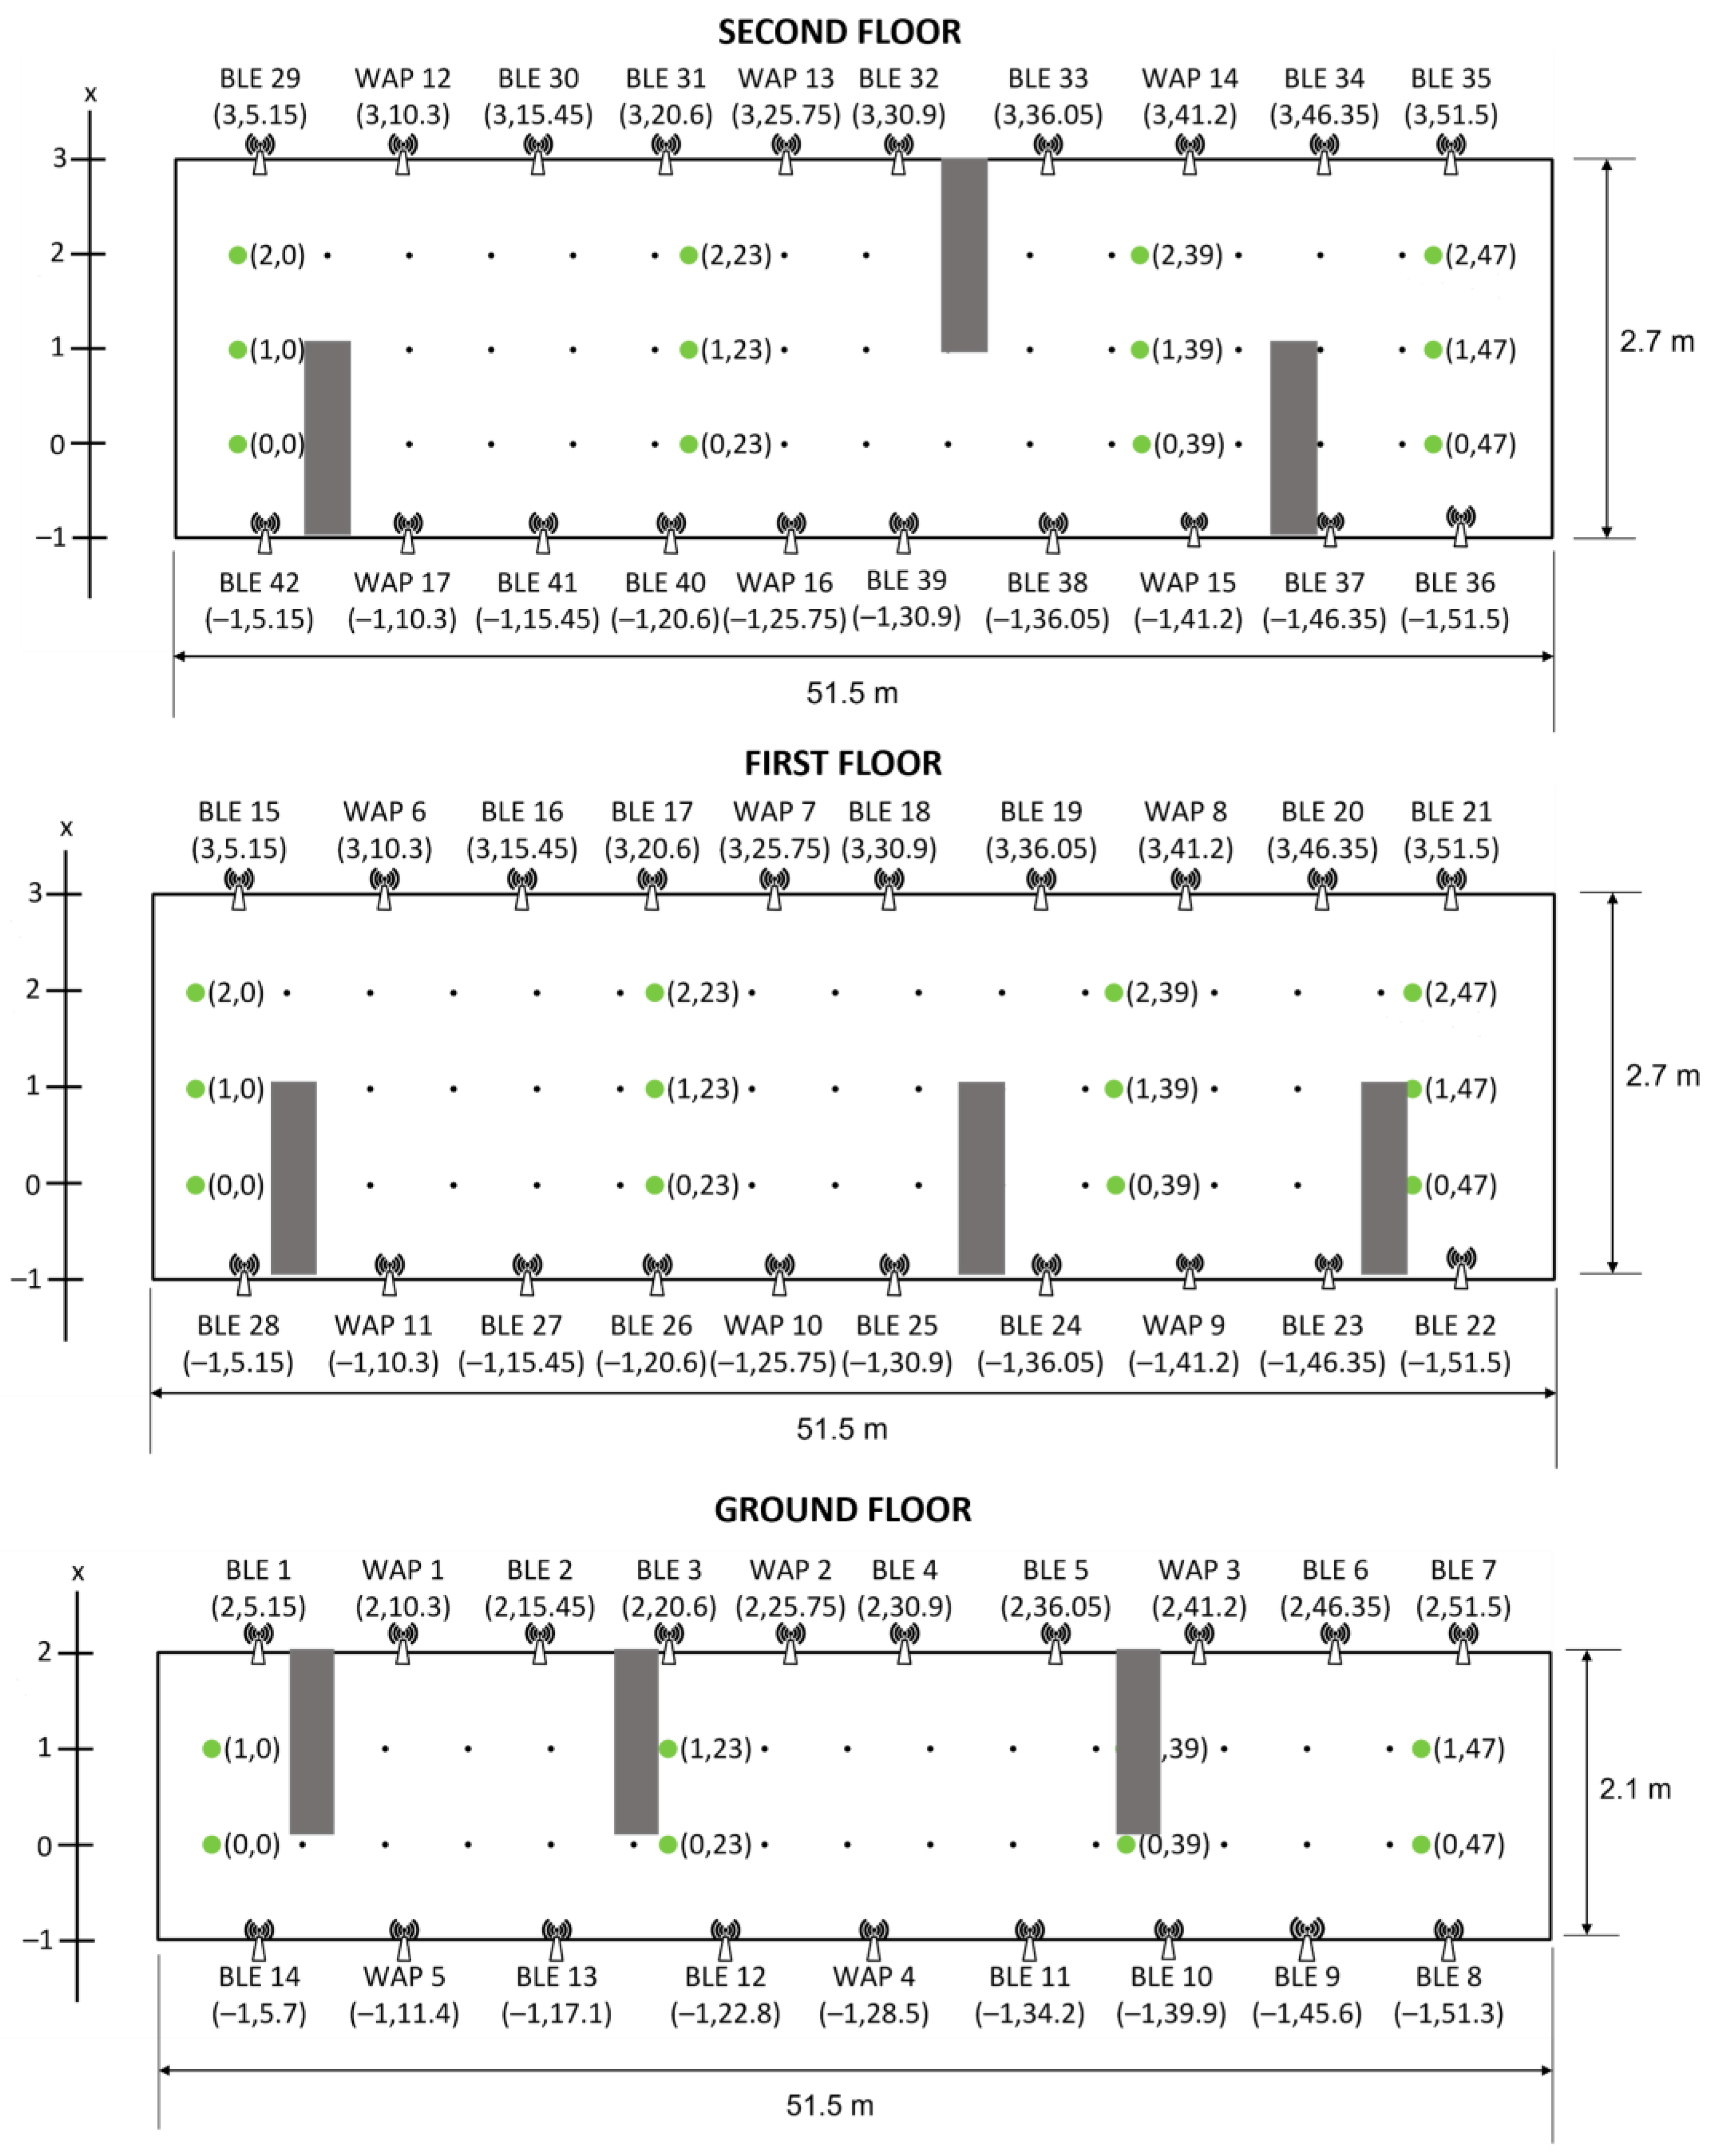
3. Setup and Dataset Collection Procedure
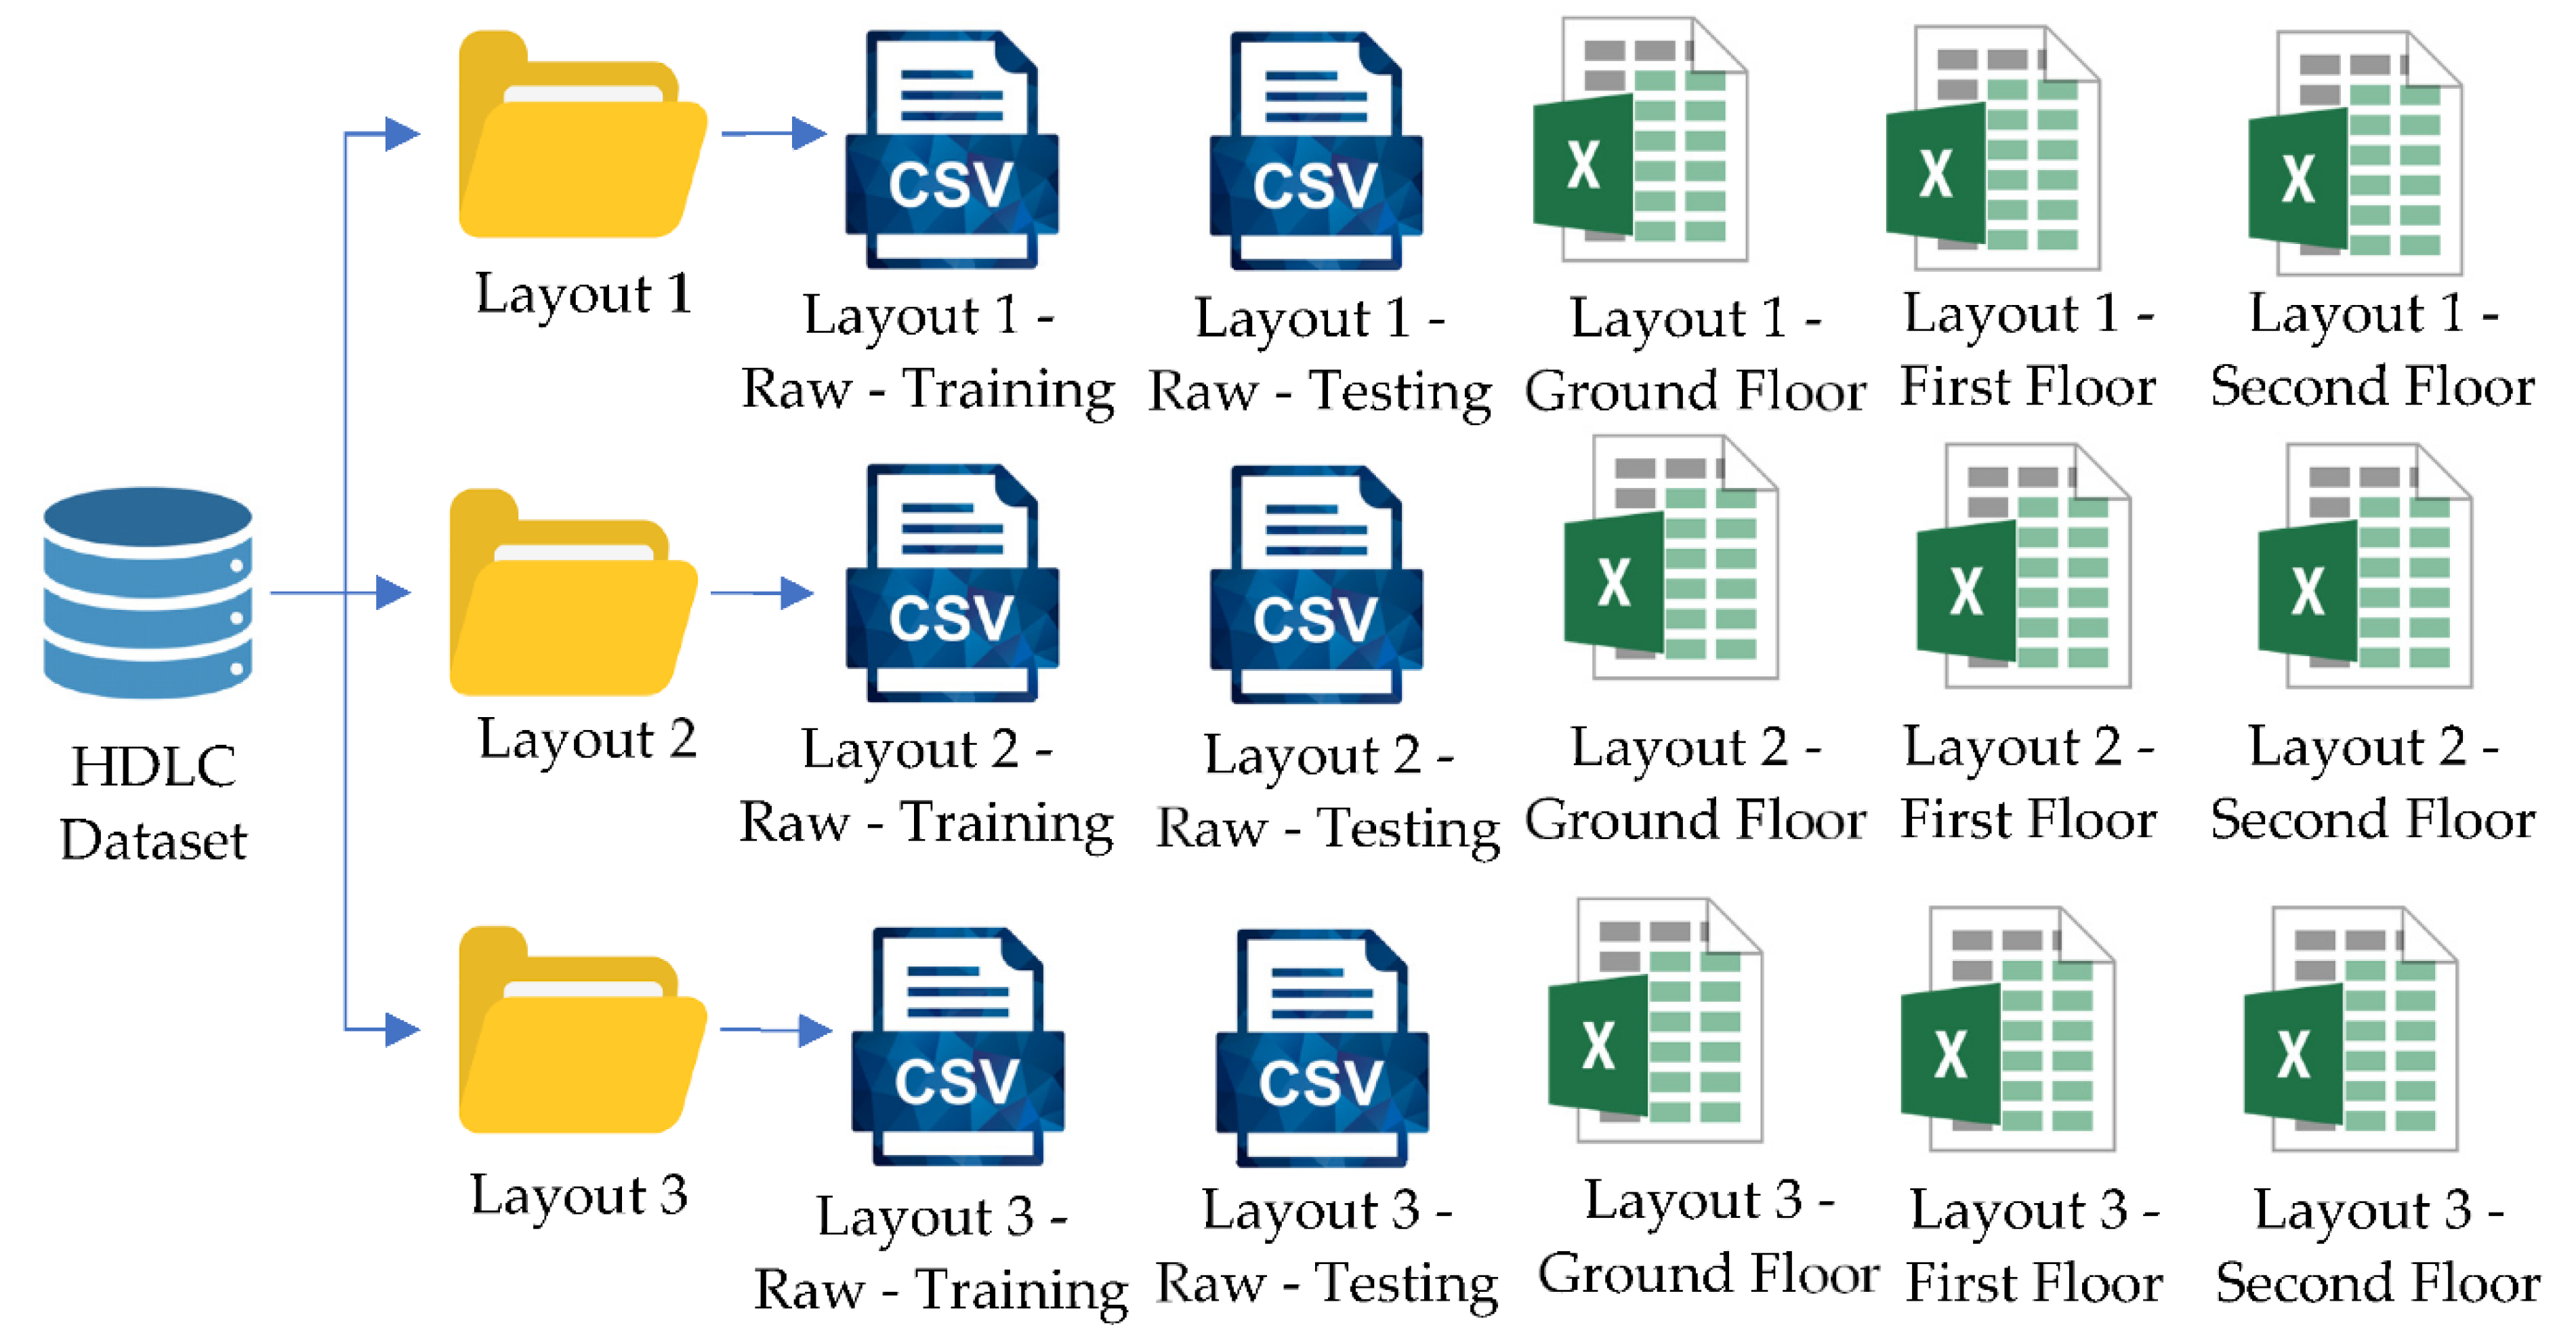
4. Dataset Description (Hybrid-Fingerprint Data with Layout Change (HDLC))
5. Analysis of the Datasets
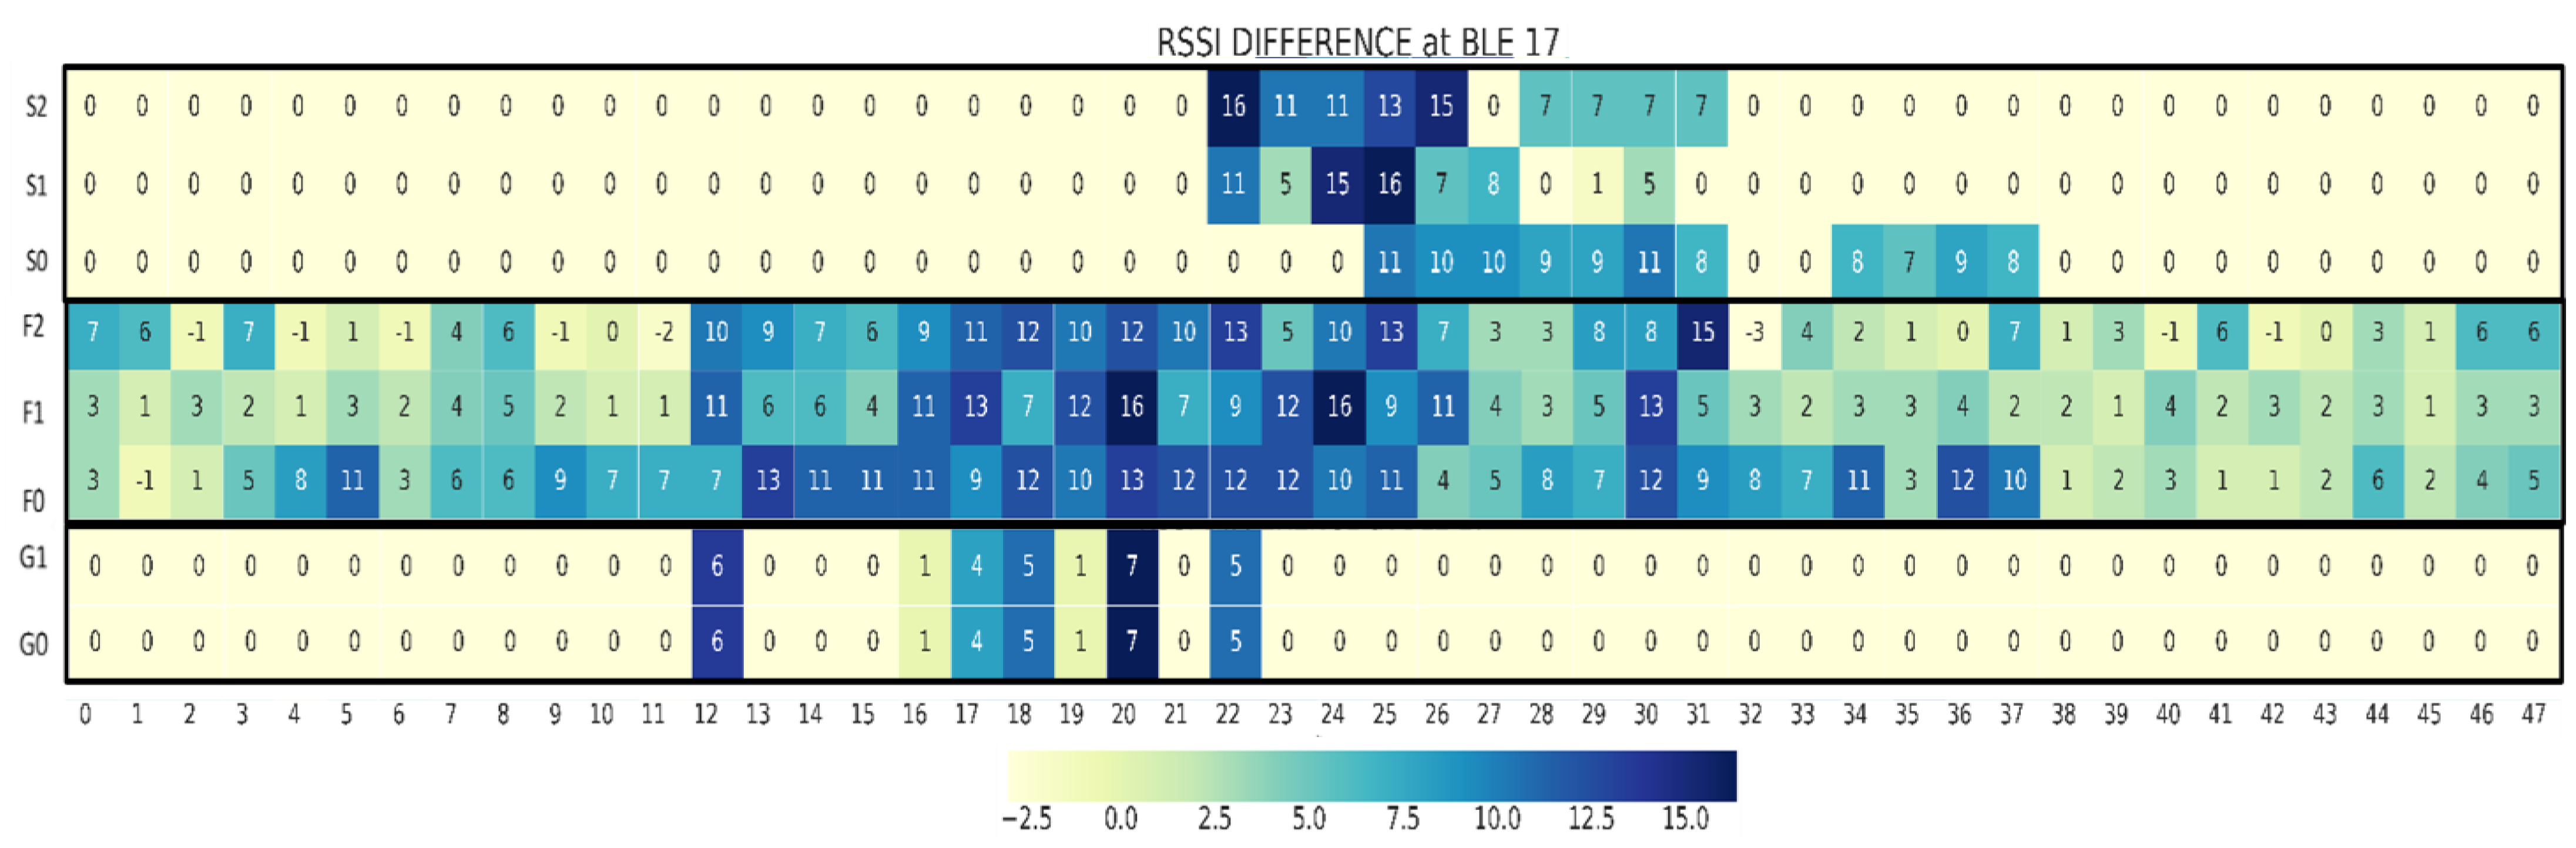
5.1. Impact of Layout Change on RSSI
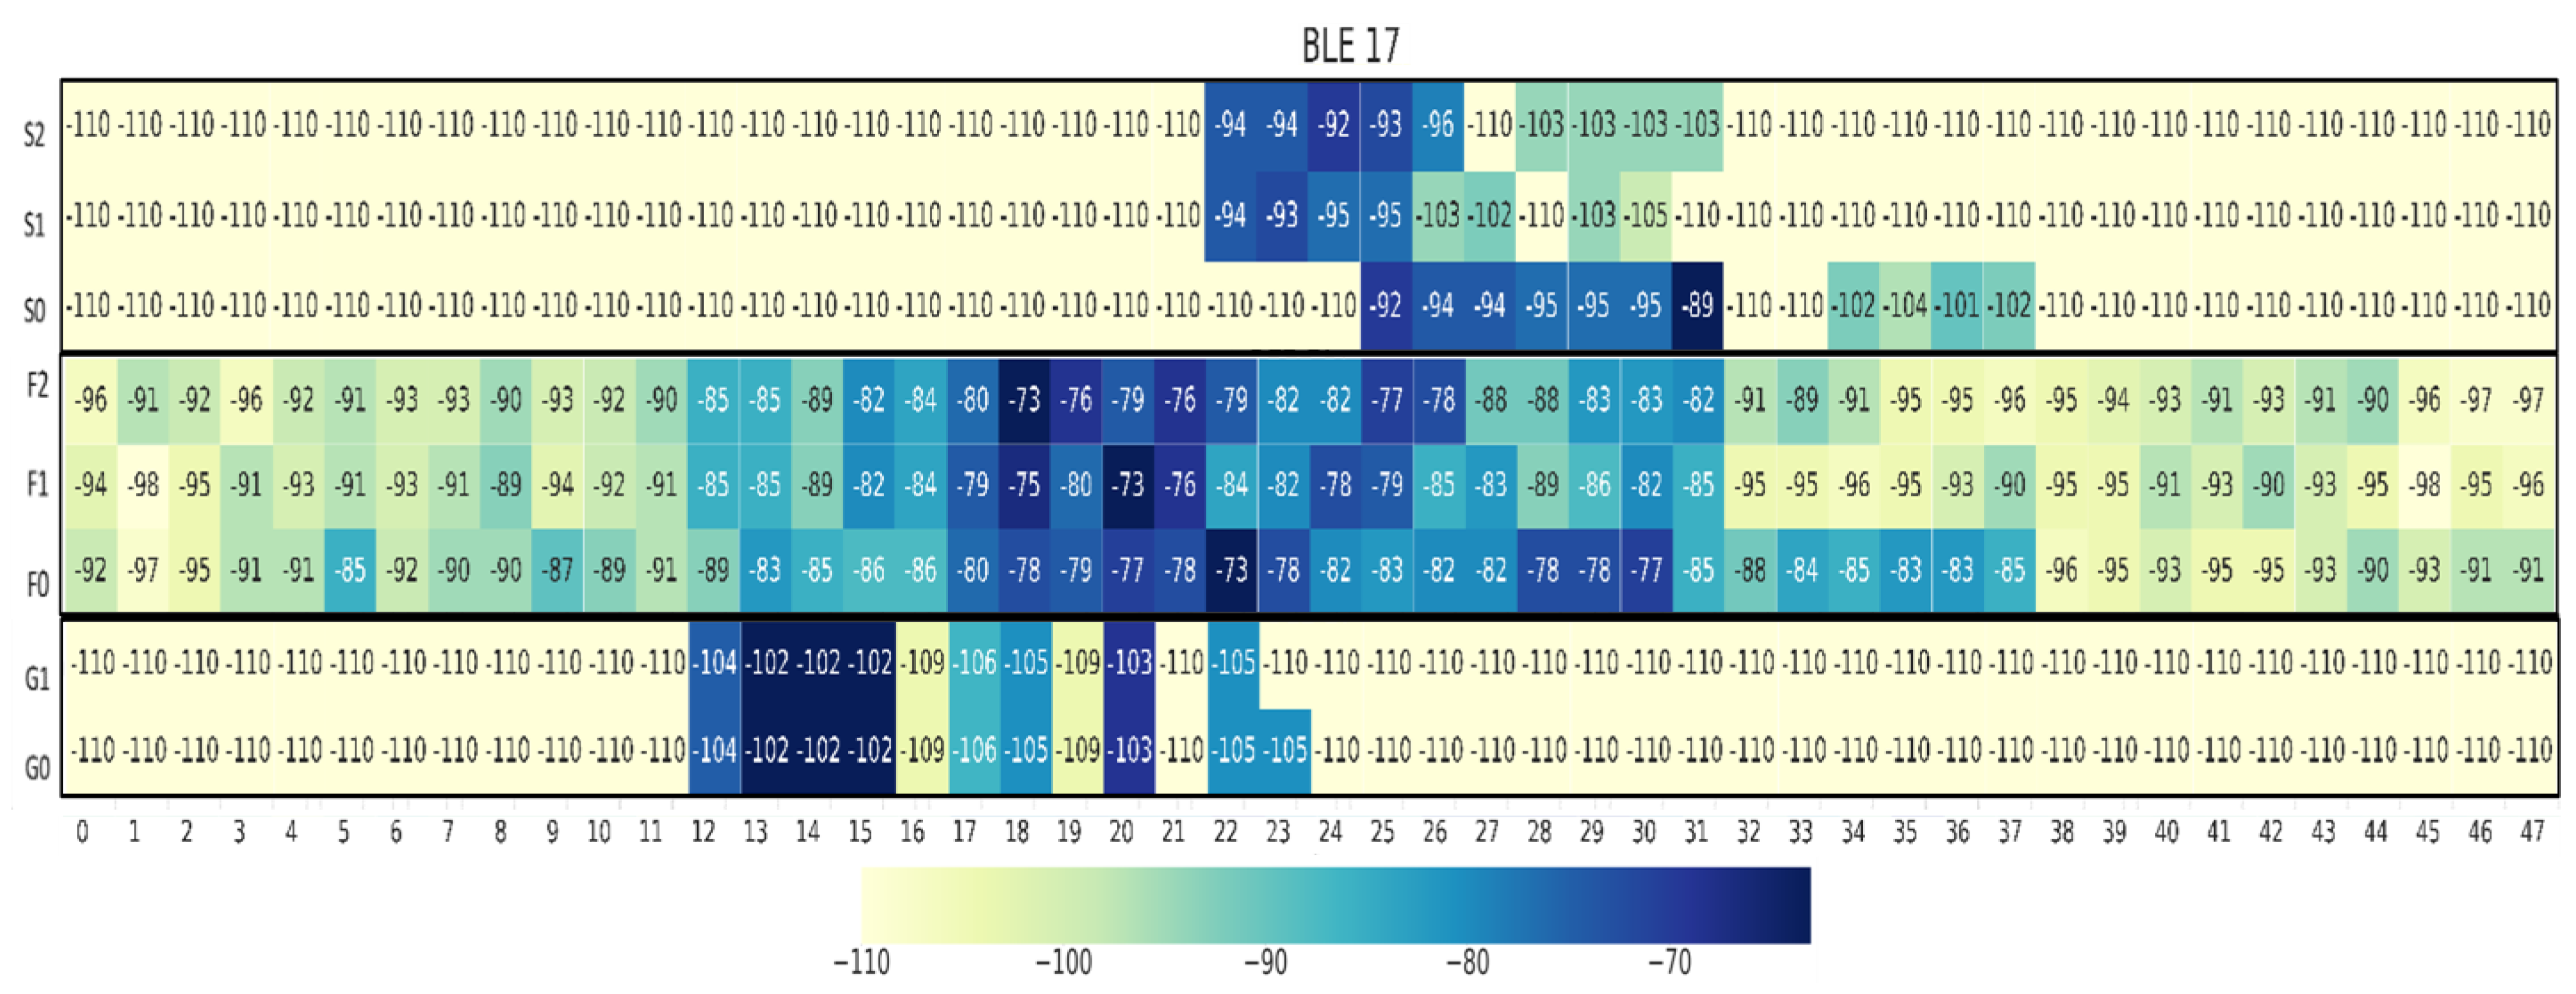
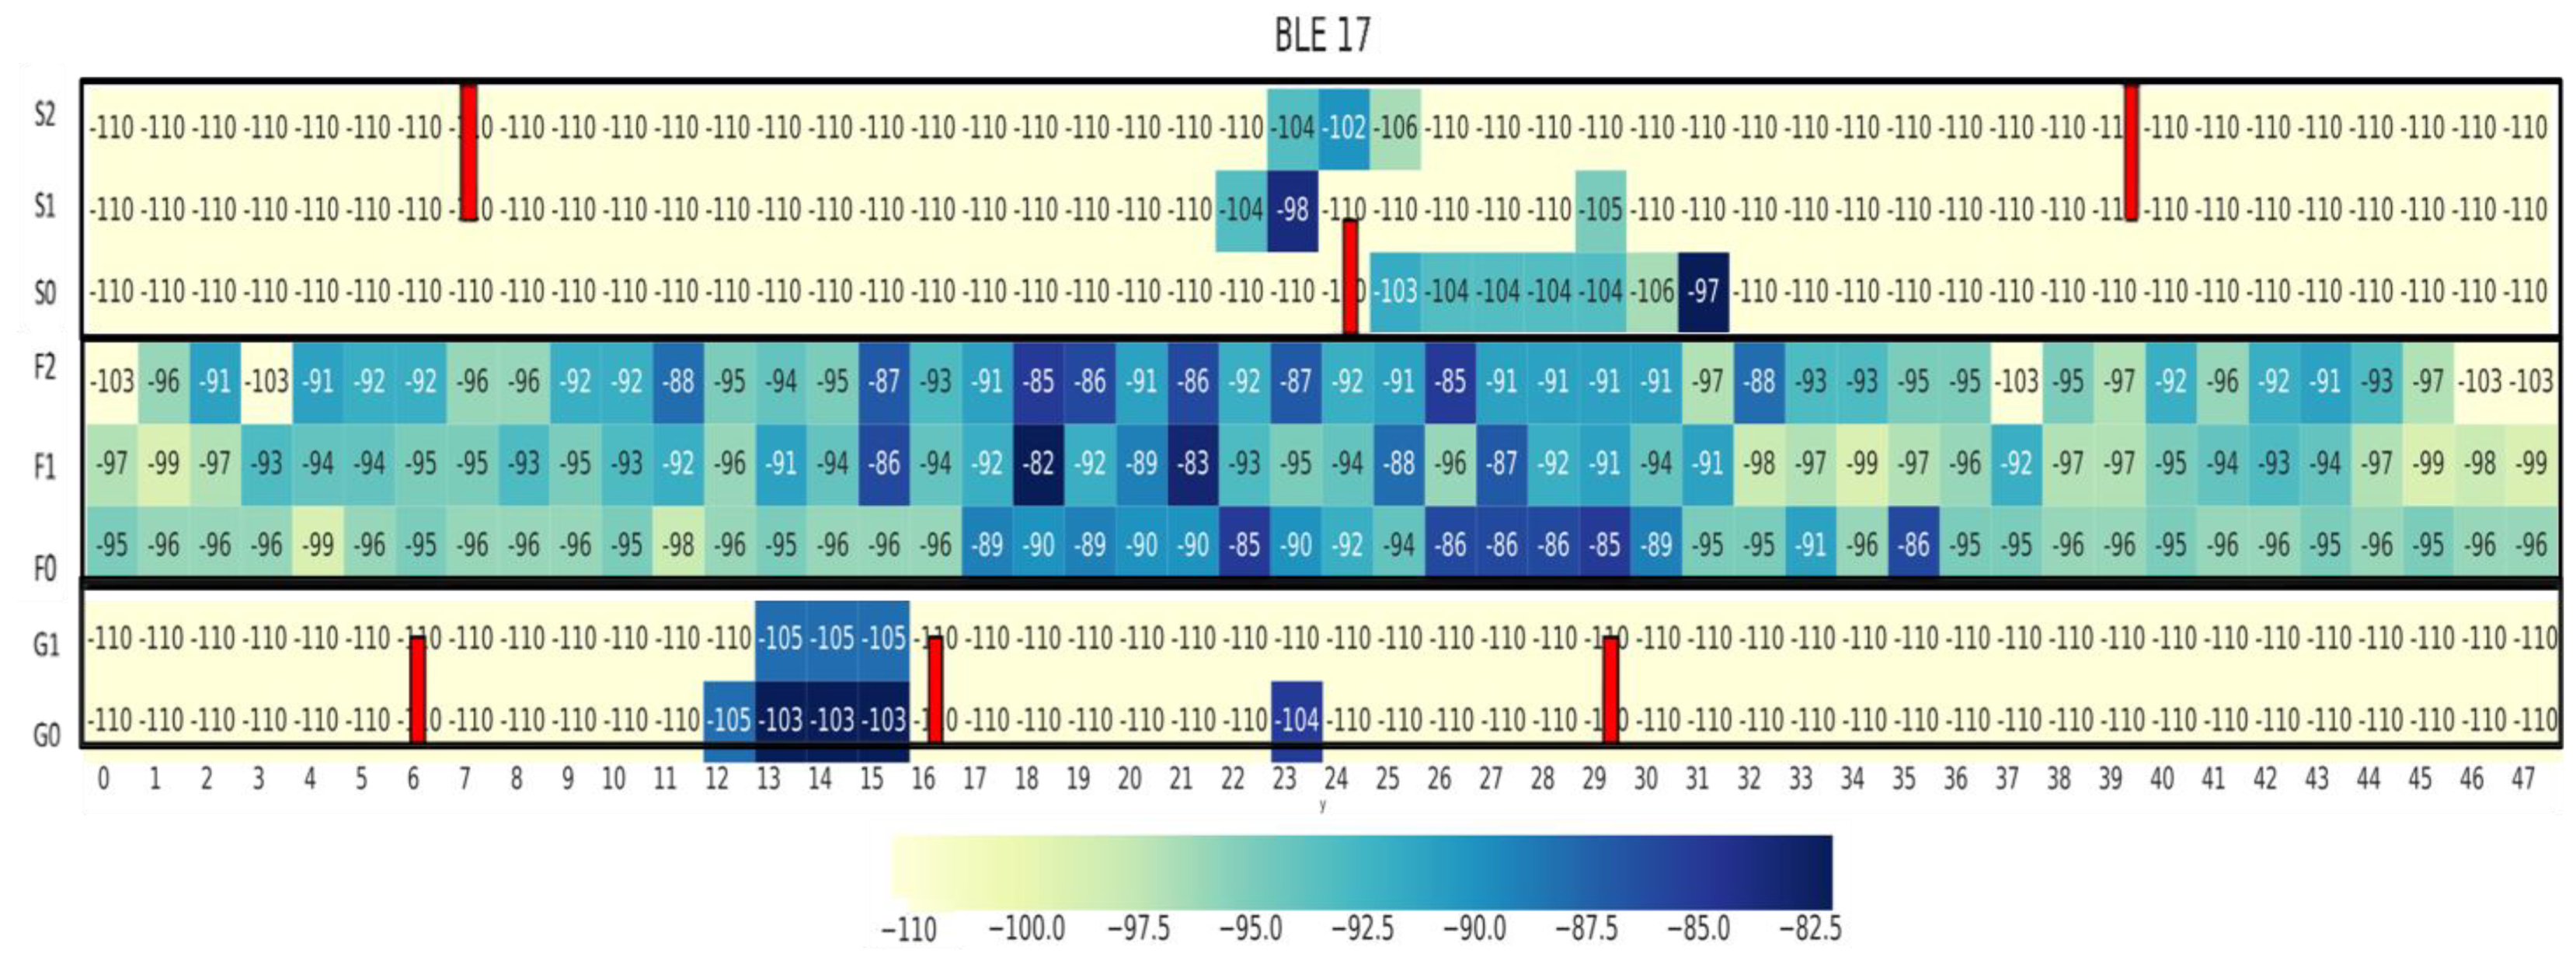
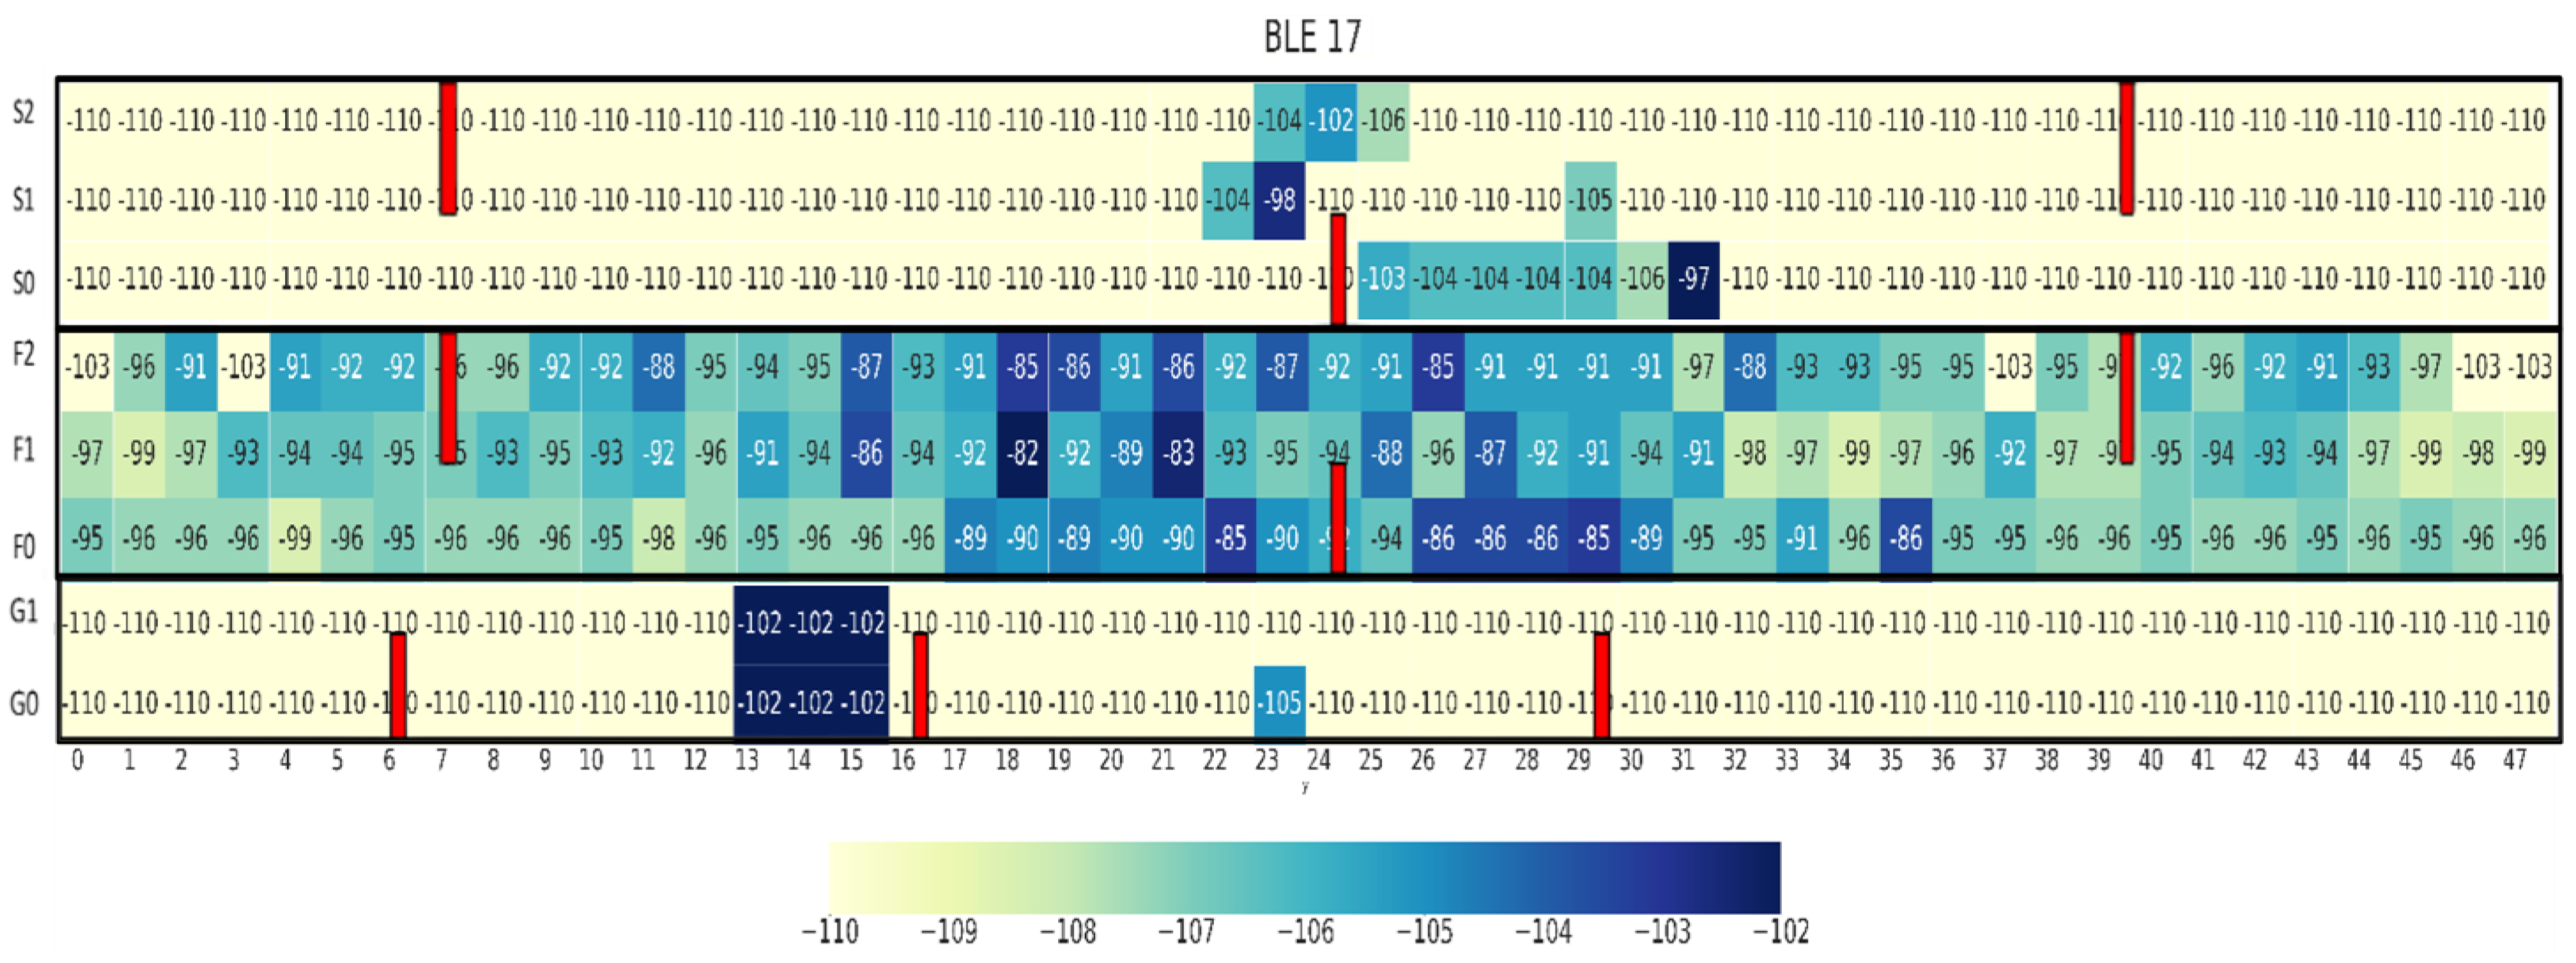
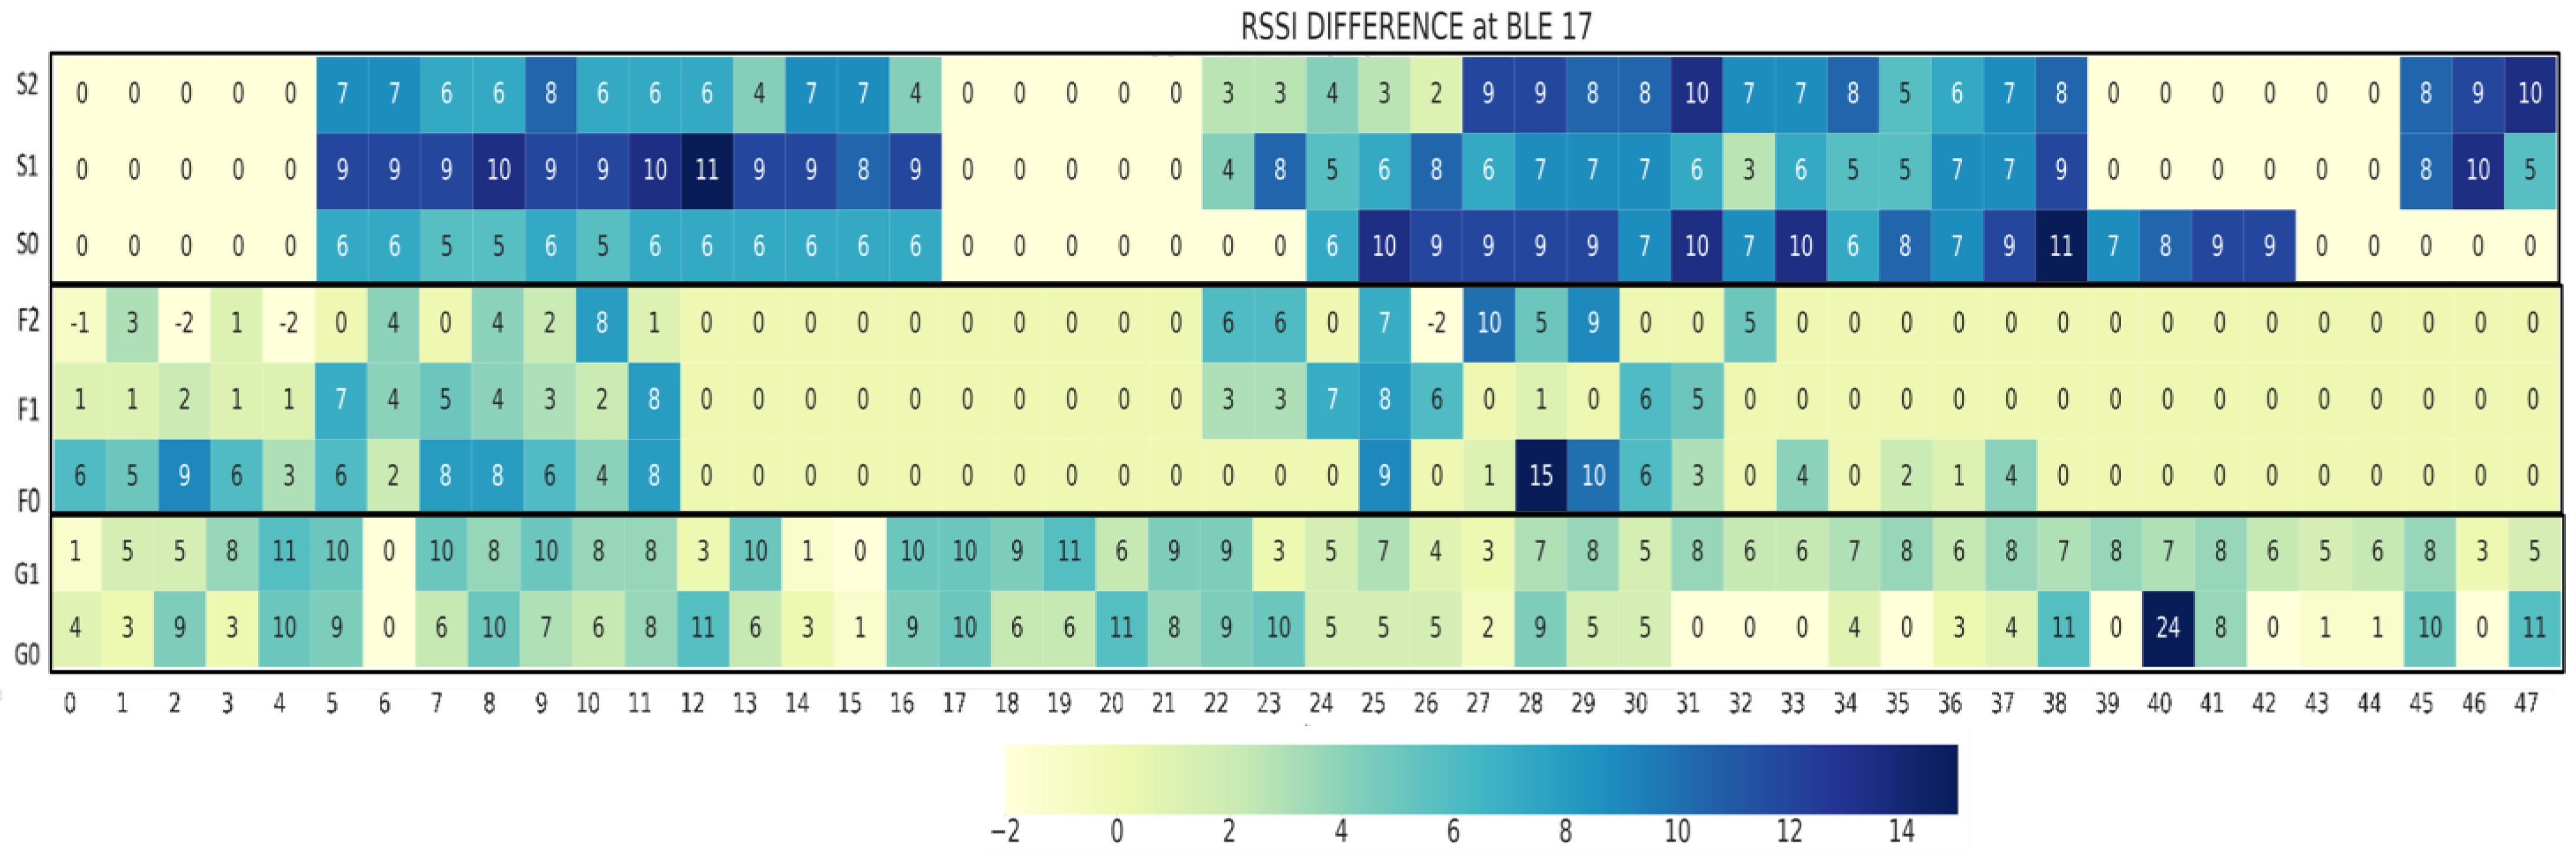
5.1.1. BLE Signal
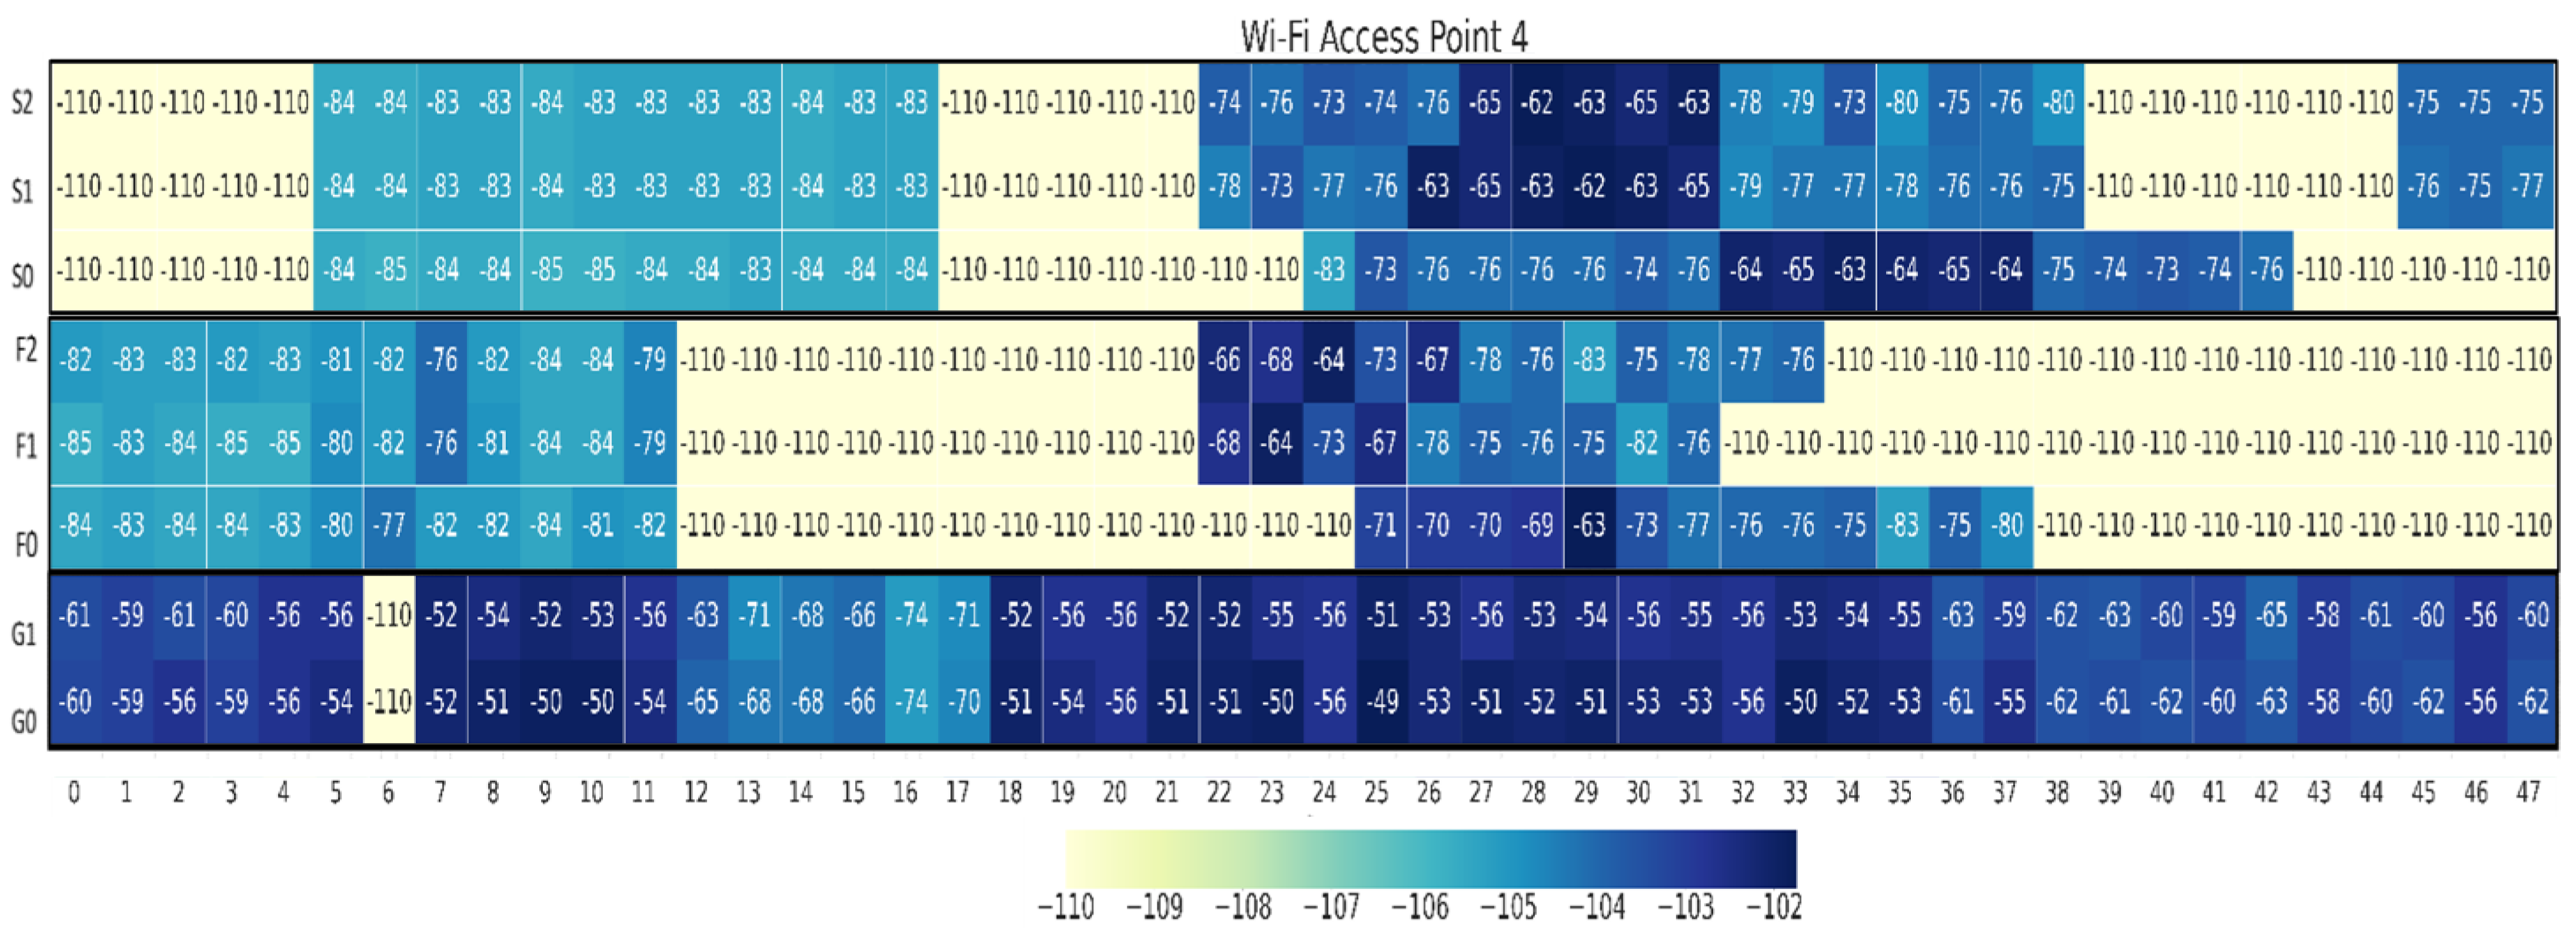
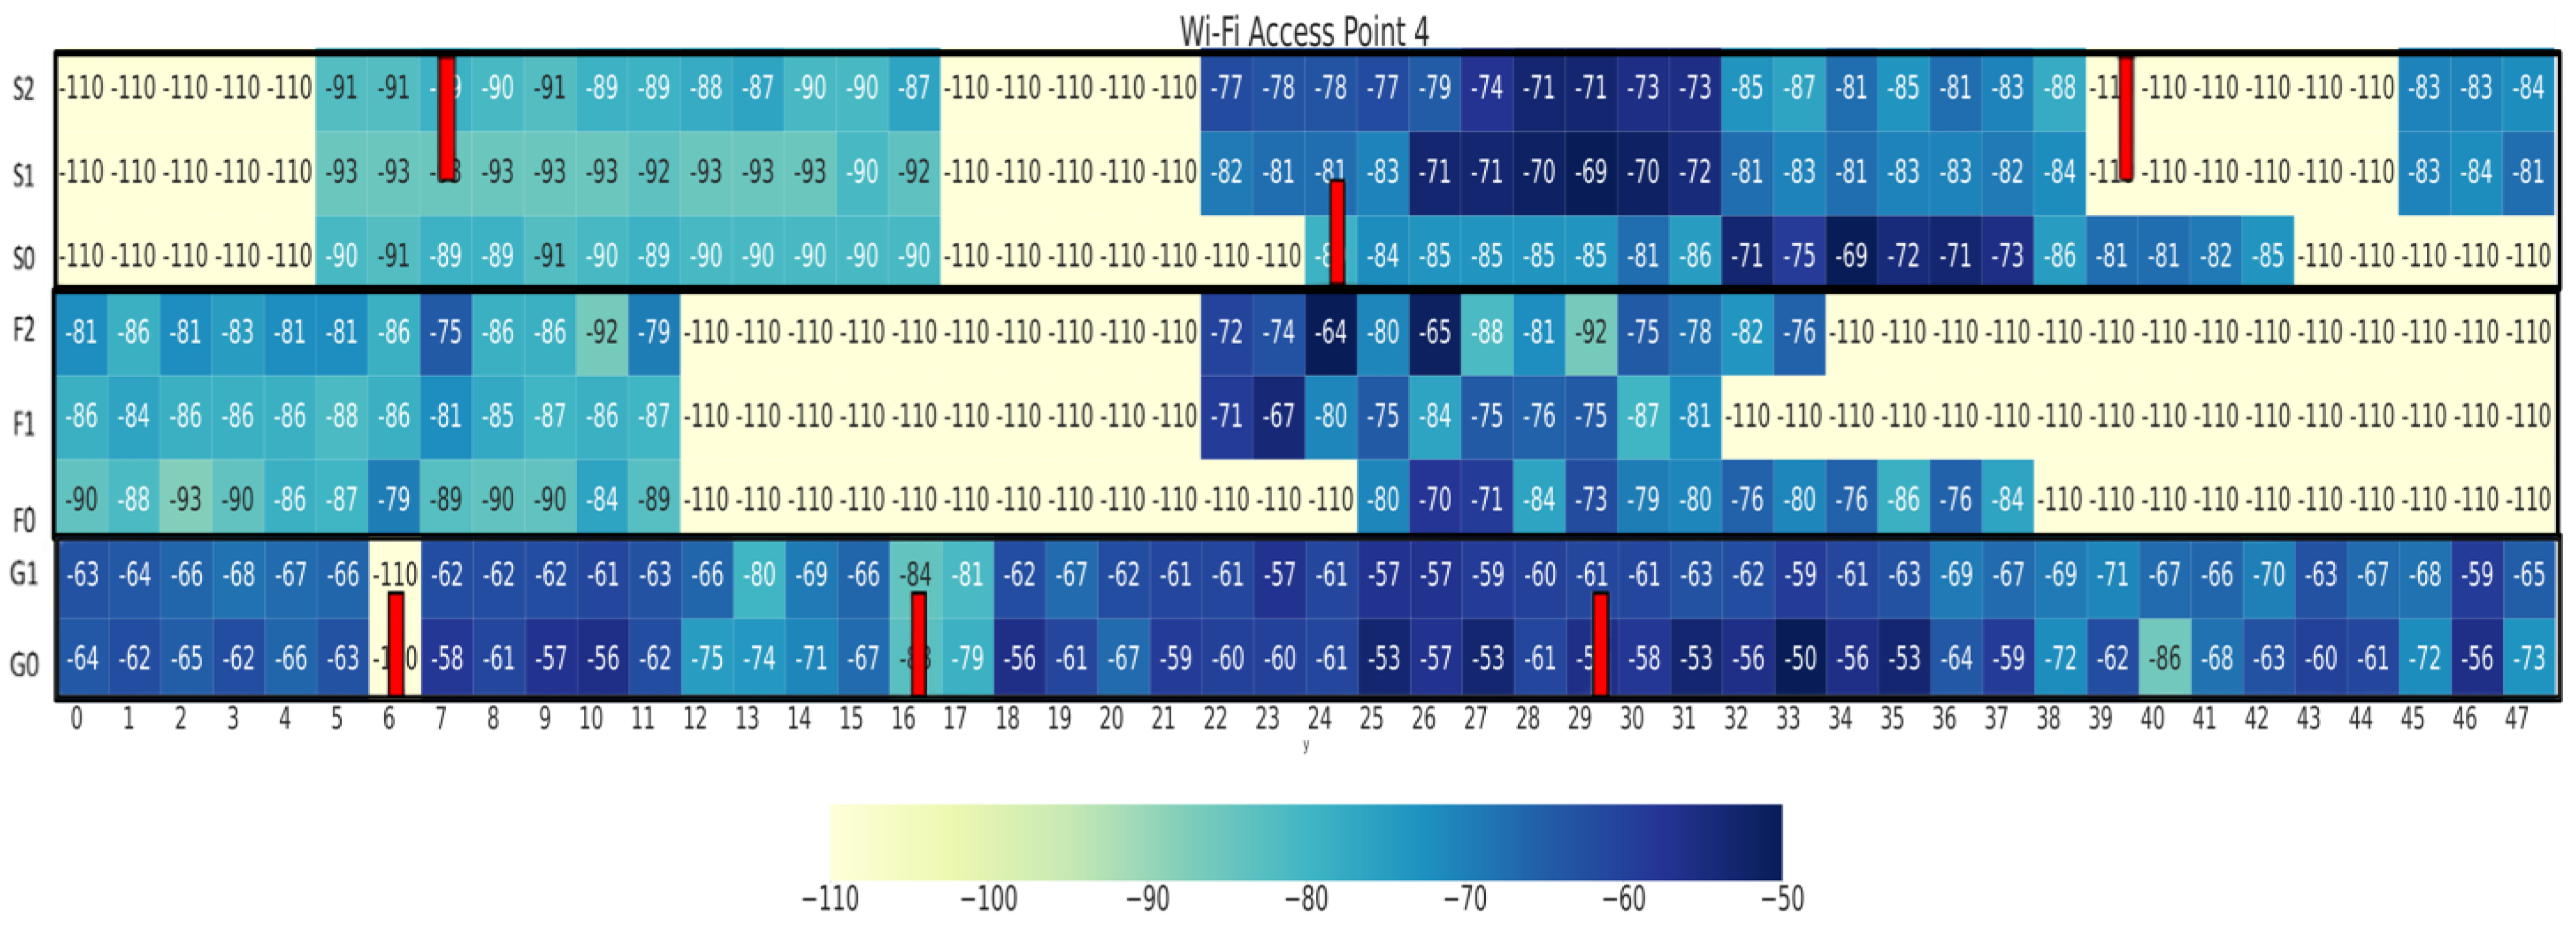
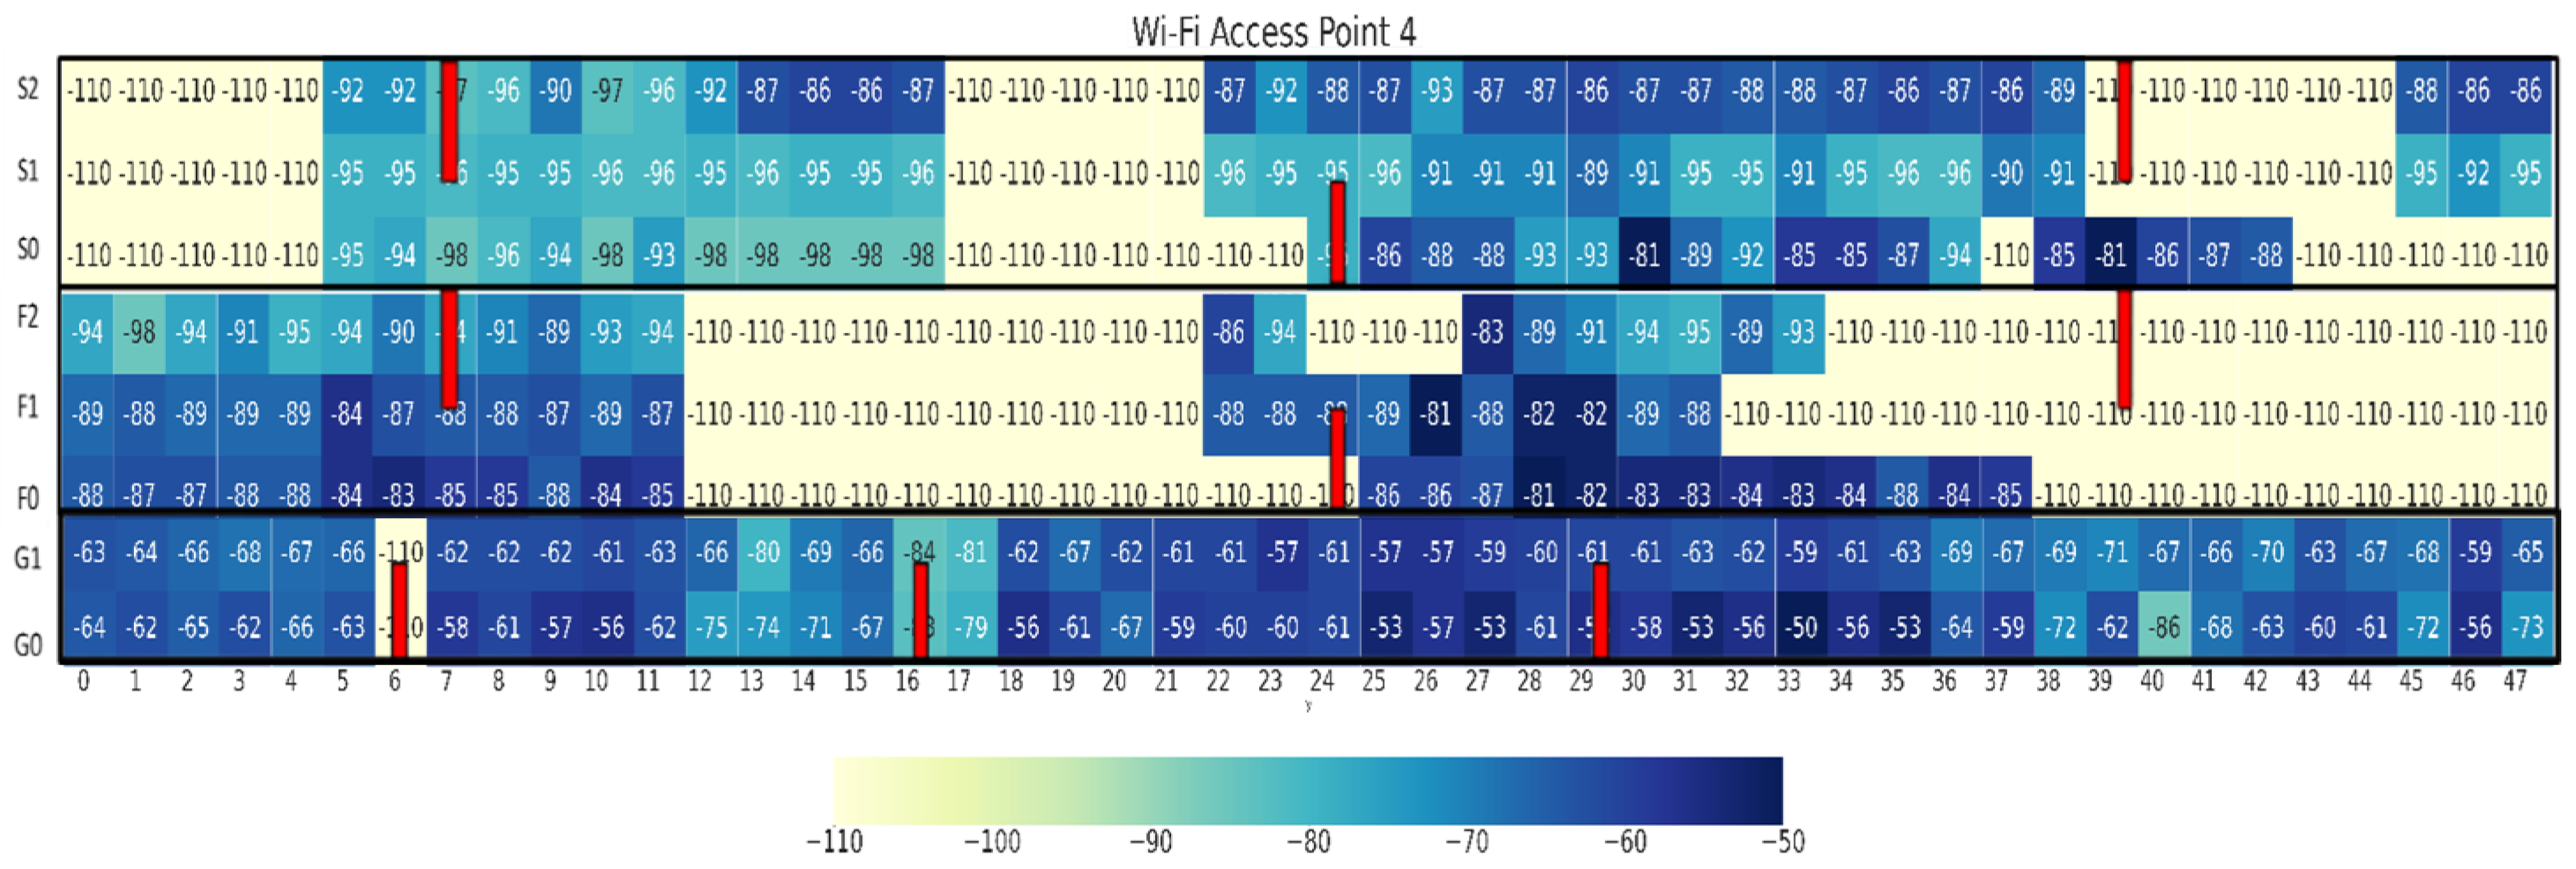
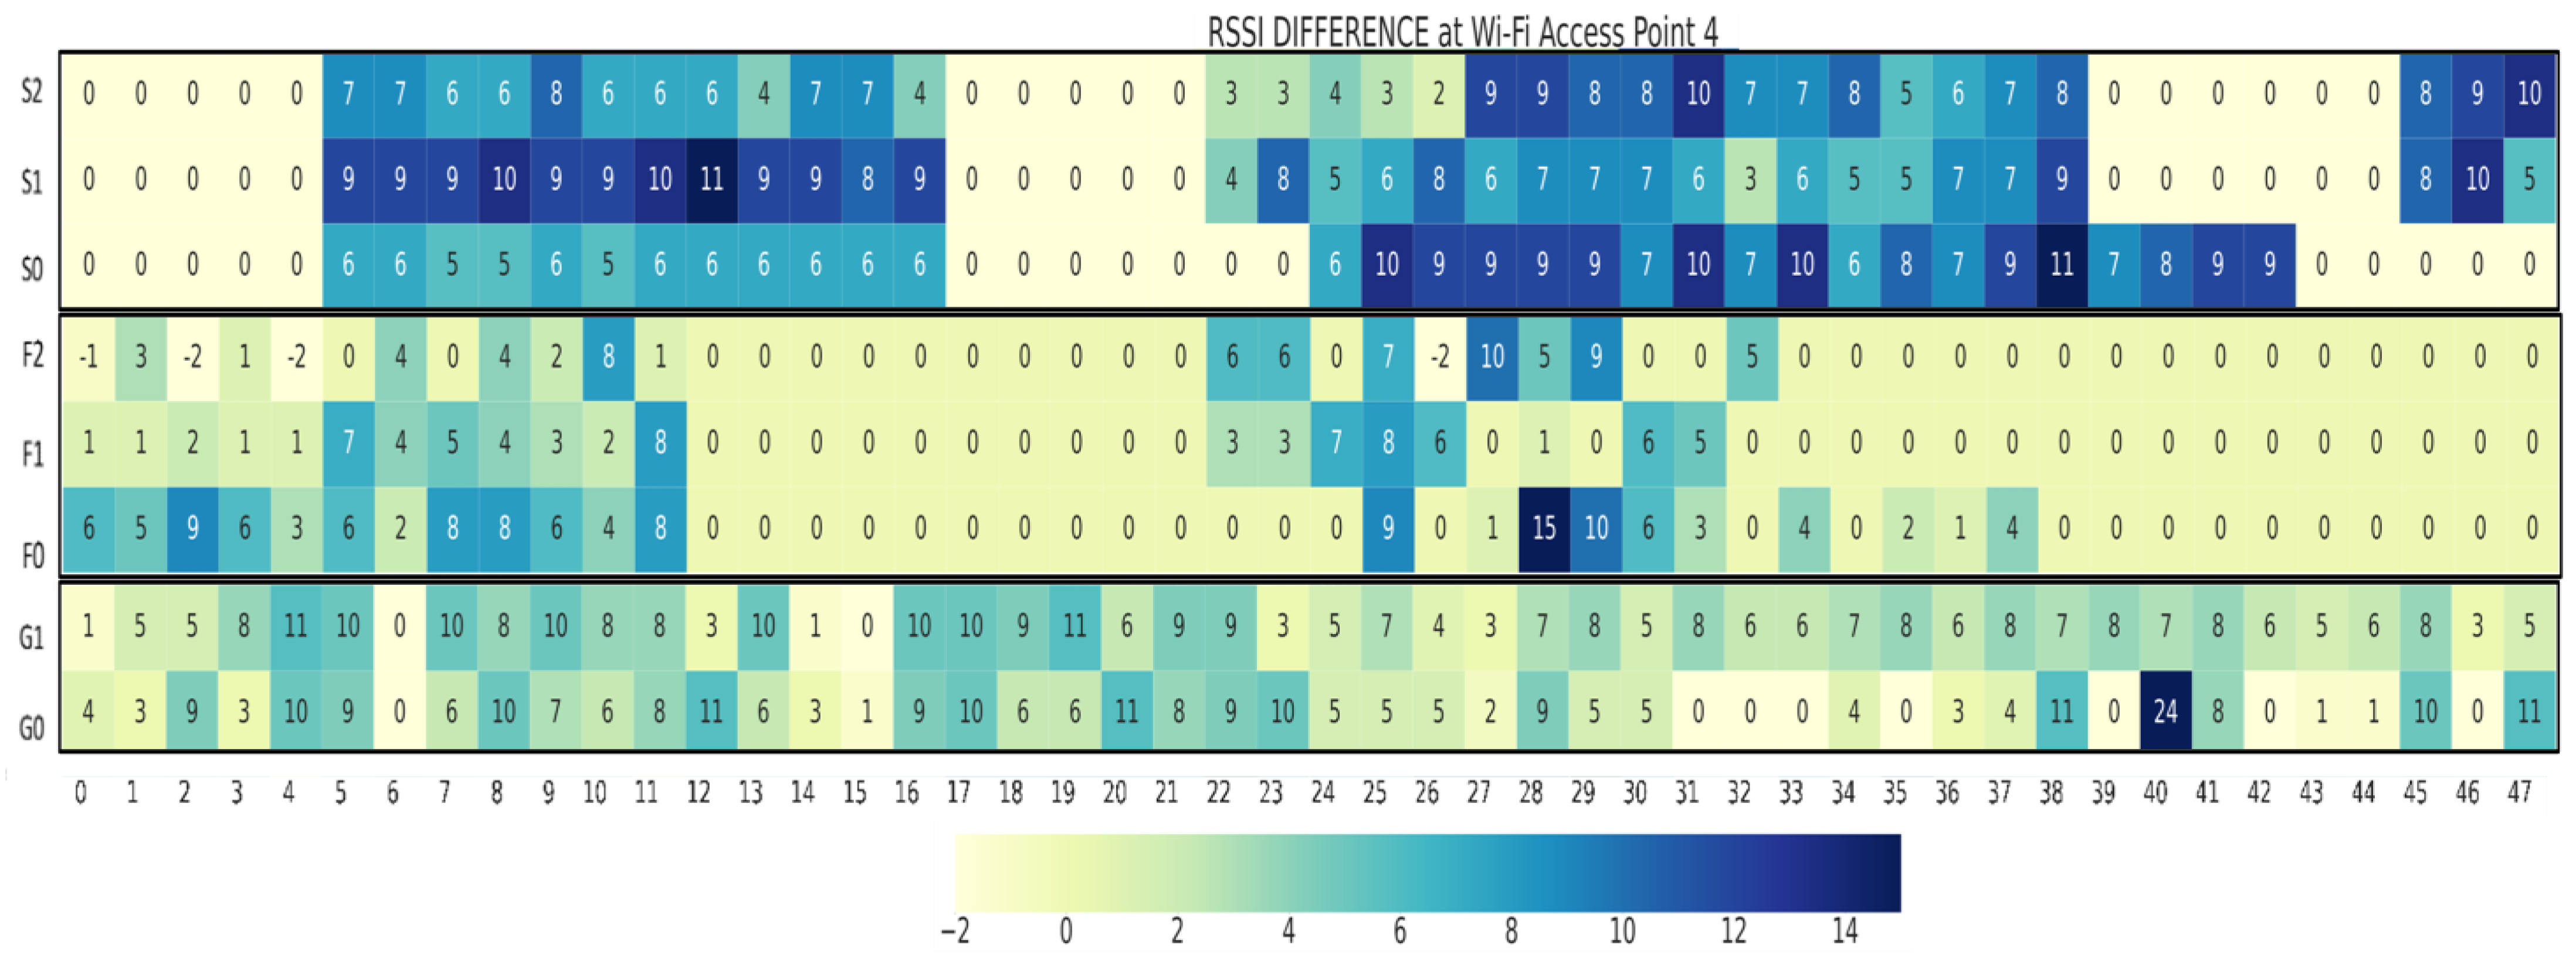
5.1.2. Wi-Fi Signal
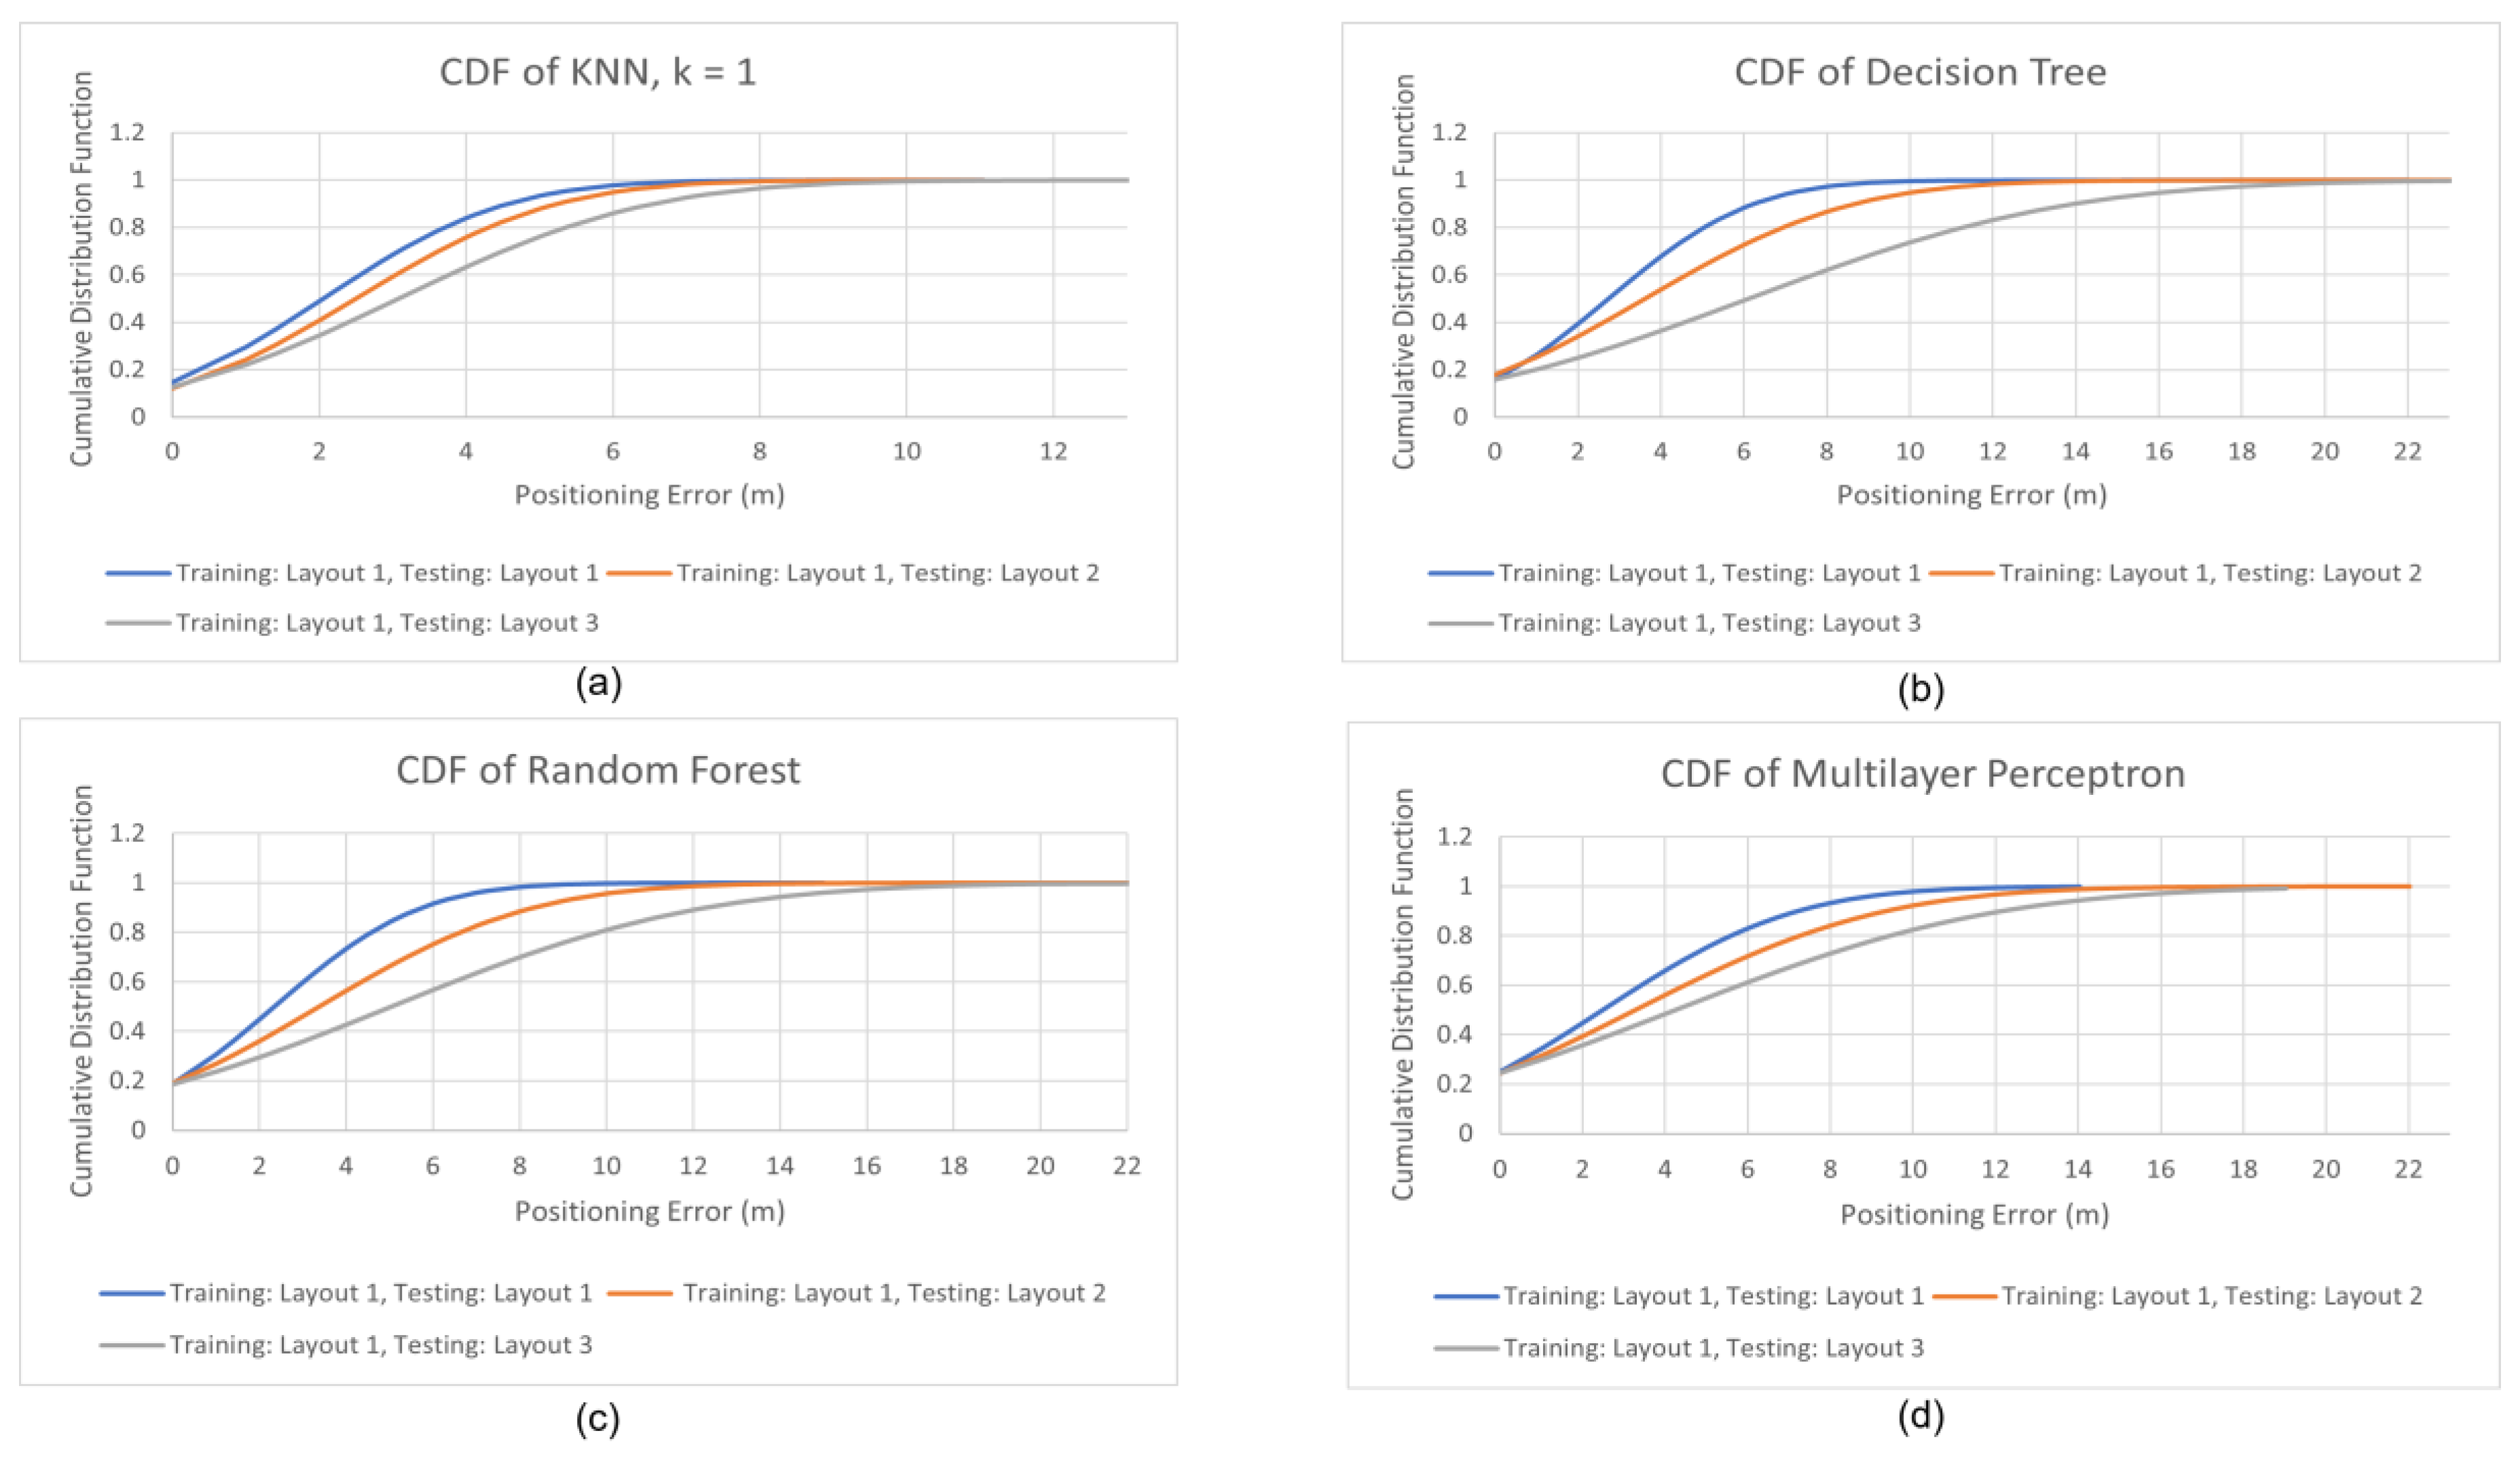
5.2. Localization Performances
6. Conclusions and Future Works
Author Contributions
Funding
Institutional Review Board Statement
Informed Consent Statement
Data Availability Statement
Conflicts of Interest
References
- Wang, W.; Marelli, D.; Fu, M. Fingerprinting-Based Indoor Localization Using Interpolated Preprocessed CSI Phases and Bayesian Tracking. Sensors 2020, 20, 2854. [Google Scholar] [CrossRef] [PubMed]
- Racko, J.; Machaj, J.; Brida, P. Wi-Fi Fingerprint Radio Map Creation by Using Interpolation. Procedia Eng. 2017, 192, 753–758. [Google Scholar] [CrossRef]
- Zheng, J.; Li, K.; Zhang, X. Wi-Fi Fingerprint-Based Indoor Localization Method via Standard Particle Swarm Optimization. Sensors 2022, 22, 5051. [Google Scholar] [CrossRef] [PubMed]
- Xia, S.; Liu, Y.; Yuan, G.; Zhu, M.; Wang, Z. Indoor Fingerprint Positioning Based on Wi-Fi: An Overview. ISPRS Int. J. Geo-Inf. 2017, 6, 135. [Google Scholar] [CrossRef]
- Yang, T.; Cabani, A.; Chafouk, H. A Survey of Recent Indoor Localization Scenarios and Methodologies. Sensors 2021, 21, 8086. [Google Scholar] [CrossRef] [PubMed]
- Brena, R.F.; García-Vázquez, J.P.; Galván-Tejada, C.E.; Muñoz-Rodriguez, D.; Vargas-Rosales, C.; Fangmeyer, J. Evolution of Indoor Positioning Technologies: A Survey. J. Sens. 2017, 2017, 2630413. [Google Scholar] [CrossRef]
- Ji, T.; Li, W.; Zhu, X.; Liu, M. Survey on Indoor Fingerprint Localization for BLE. In Proceedings of the 2022 IEEE 6th Information Technology and Mechatronics Engineering Conference (ITOEC), Chongqing, China, 4–6 March 2022; pp. 129–134. [Google Scholar] [CrossRef]
- Lohan, E.S.; Torres-Sospedra, J.; Leppäkoski, H.; Richter, P.; Peng, Z.; Huerta, J. Wi-Fi Crowdsourced Fingerprinting Dataset for Indoor Positioning. Data 2017, 2, 32. [Google Scholar] [CrossRef]
- Mendoza-Silva, G.M.; Richter, P.; Torres-Sospedra, J.; Lohan, E.S.; Huerta, J. Long-Term Wi-Fi Fingerprinting Dataset for Research on Robust Indoor Positioning. Data 2018, 3, 3. [Google Scholar] [CrossRef]
- Mendoza-Silva, G.M.; Matey-Sanz, M.; Torres-Sospedra, J.; Huerta, J. BLE RSS Measurements Dataset for Research on Accurate Indoor Positioning. Data 2019, 4, 12. [Google Scholar] [CrossRef]
- Montoliu, R.; Sansano, E.; Torres-Sospedra, J.; Belmonte, O. IndoorLoc Platform: A Public Repository for Comparing and Evaluating Indoor Positioning Systems. In Proceedings of the 2017 International Conference on Indoor Positioning and Indoor Navigation (IPIN), Sapporo, Japan, 18–21 September 2017; pp. 1–8. [Google Scholar] [CrossRef]
- Torres-Sospedra, J.; Montoliu, R.; Martinez-Uso, A.; Avariento, J.P.; Arnau, T.J.; Benedito-Bordonau, M.; Huerta, J. UJIIndoorLoc: A New Multi-Building and Multi-Floor Database for WLAN Fingerprint-Based Indoor Localization Problems. In Proceedings of the 2014 International Conference on Indoor Positioning and Indoor Navigation (IPIN), Busan, Korea, 27–30 October 2014; pp. 261–270. [Google Scholar] [CrossRef]
- Torres-Sospedra, J.; Jiménez, A.R.; Knauth, S.; Moreira, A.; Beer, Y.; Fetzer, T.; Ta, V.C.; Montoliu, R.; Seco, F.; Mendoza-Silva, G.M.; et al. The Smartphone-Based Offline Indoor Location Competition at IPIN 2016: Analysis and Future Work. Sensors 2017, 17, 557. [Google Scholar] [CrossRef] [PubMed]
- Torres-Sospedra, J.; Montoliu, R.; Mendoza-Silva, G.M.; Belmonte, O.; Rambla, D.; Huerta, J. Providing Databases for Different Indoor Positioning Technologies: Pros and Cons of Magnetic Field and Wi-Fi Based Positioning. Mob. Inf. Syst. 2016, 2016, 6092618. [Google Scholar] [CrossRef]
- Aranda, F.J.; Parralejo, F.; Álvarez, F.J.; Torres-Sospedra, J. Multi-Slot BLE Raw Database for Accurate Positioning in Mixed Indoor/Outdoor Environments. Data 2020, 5, 67. [Google Scholar] [CrossRef]


| Dataset | Ref | Signal Types | Access Points | Dataset Available | Multi Building | Multi Floor | Change of Layouts |
|---|---|---|---|---|---|---|---|
| UJI IndoorLoc | [11,12] | Wi-Fi | 520 APs | Training (19938) | Yes | Yes | No |
| Validation & Testing (1111) | |||||||
| IPIN2016 Tutorial | [8,9,11,13] | Wi-Fi | 168 APs | Training (927) | No | No | No |
| Testing (702) | |||||||
| Tampere University | [8,11] | Wi-Fi | 309 APs, 354 APs | Training (1478,583) | Yes | Yes | No |
| Testing (489,175) | |||||||
| ALCALA2017 | [8,9,11] | Wi-Fi | 152 APs | Training (670) | No | No | No |
| Testing (405) | |||||||
| [14] | [14] | Magnetic field, Wi-Fi | 97 (9 indoor, 88 outdoor) | Training (680) | No | No | No |
| Testing (460) | |||||||
| BLE RSS | [10] | BLE | 22, 24 | None | No | No | No |
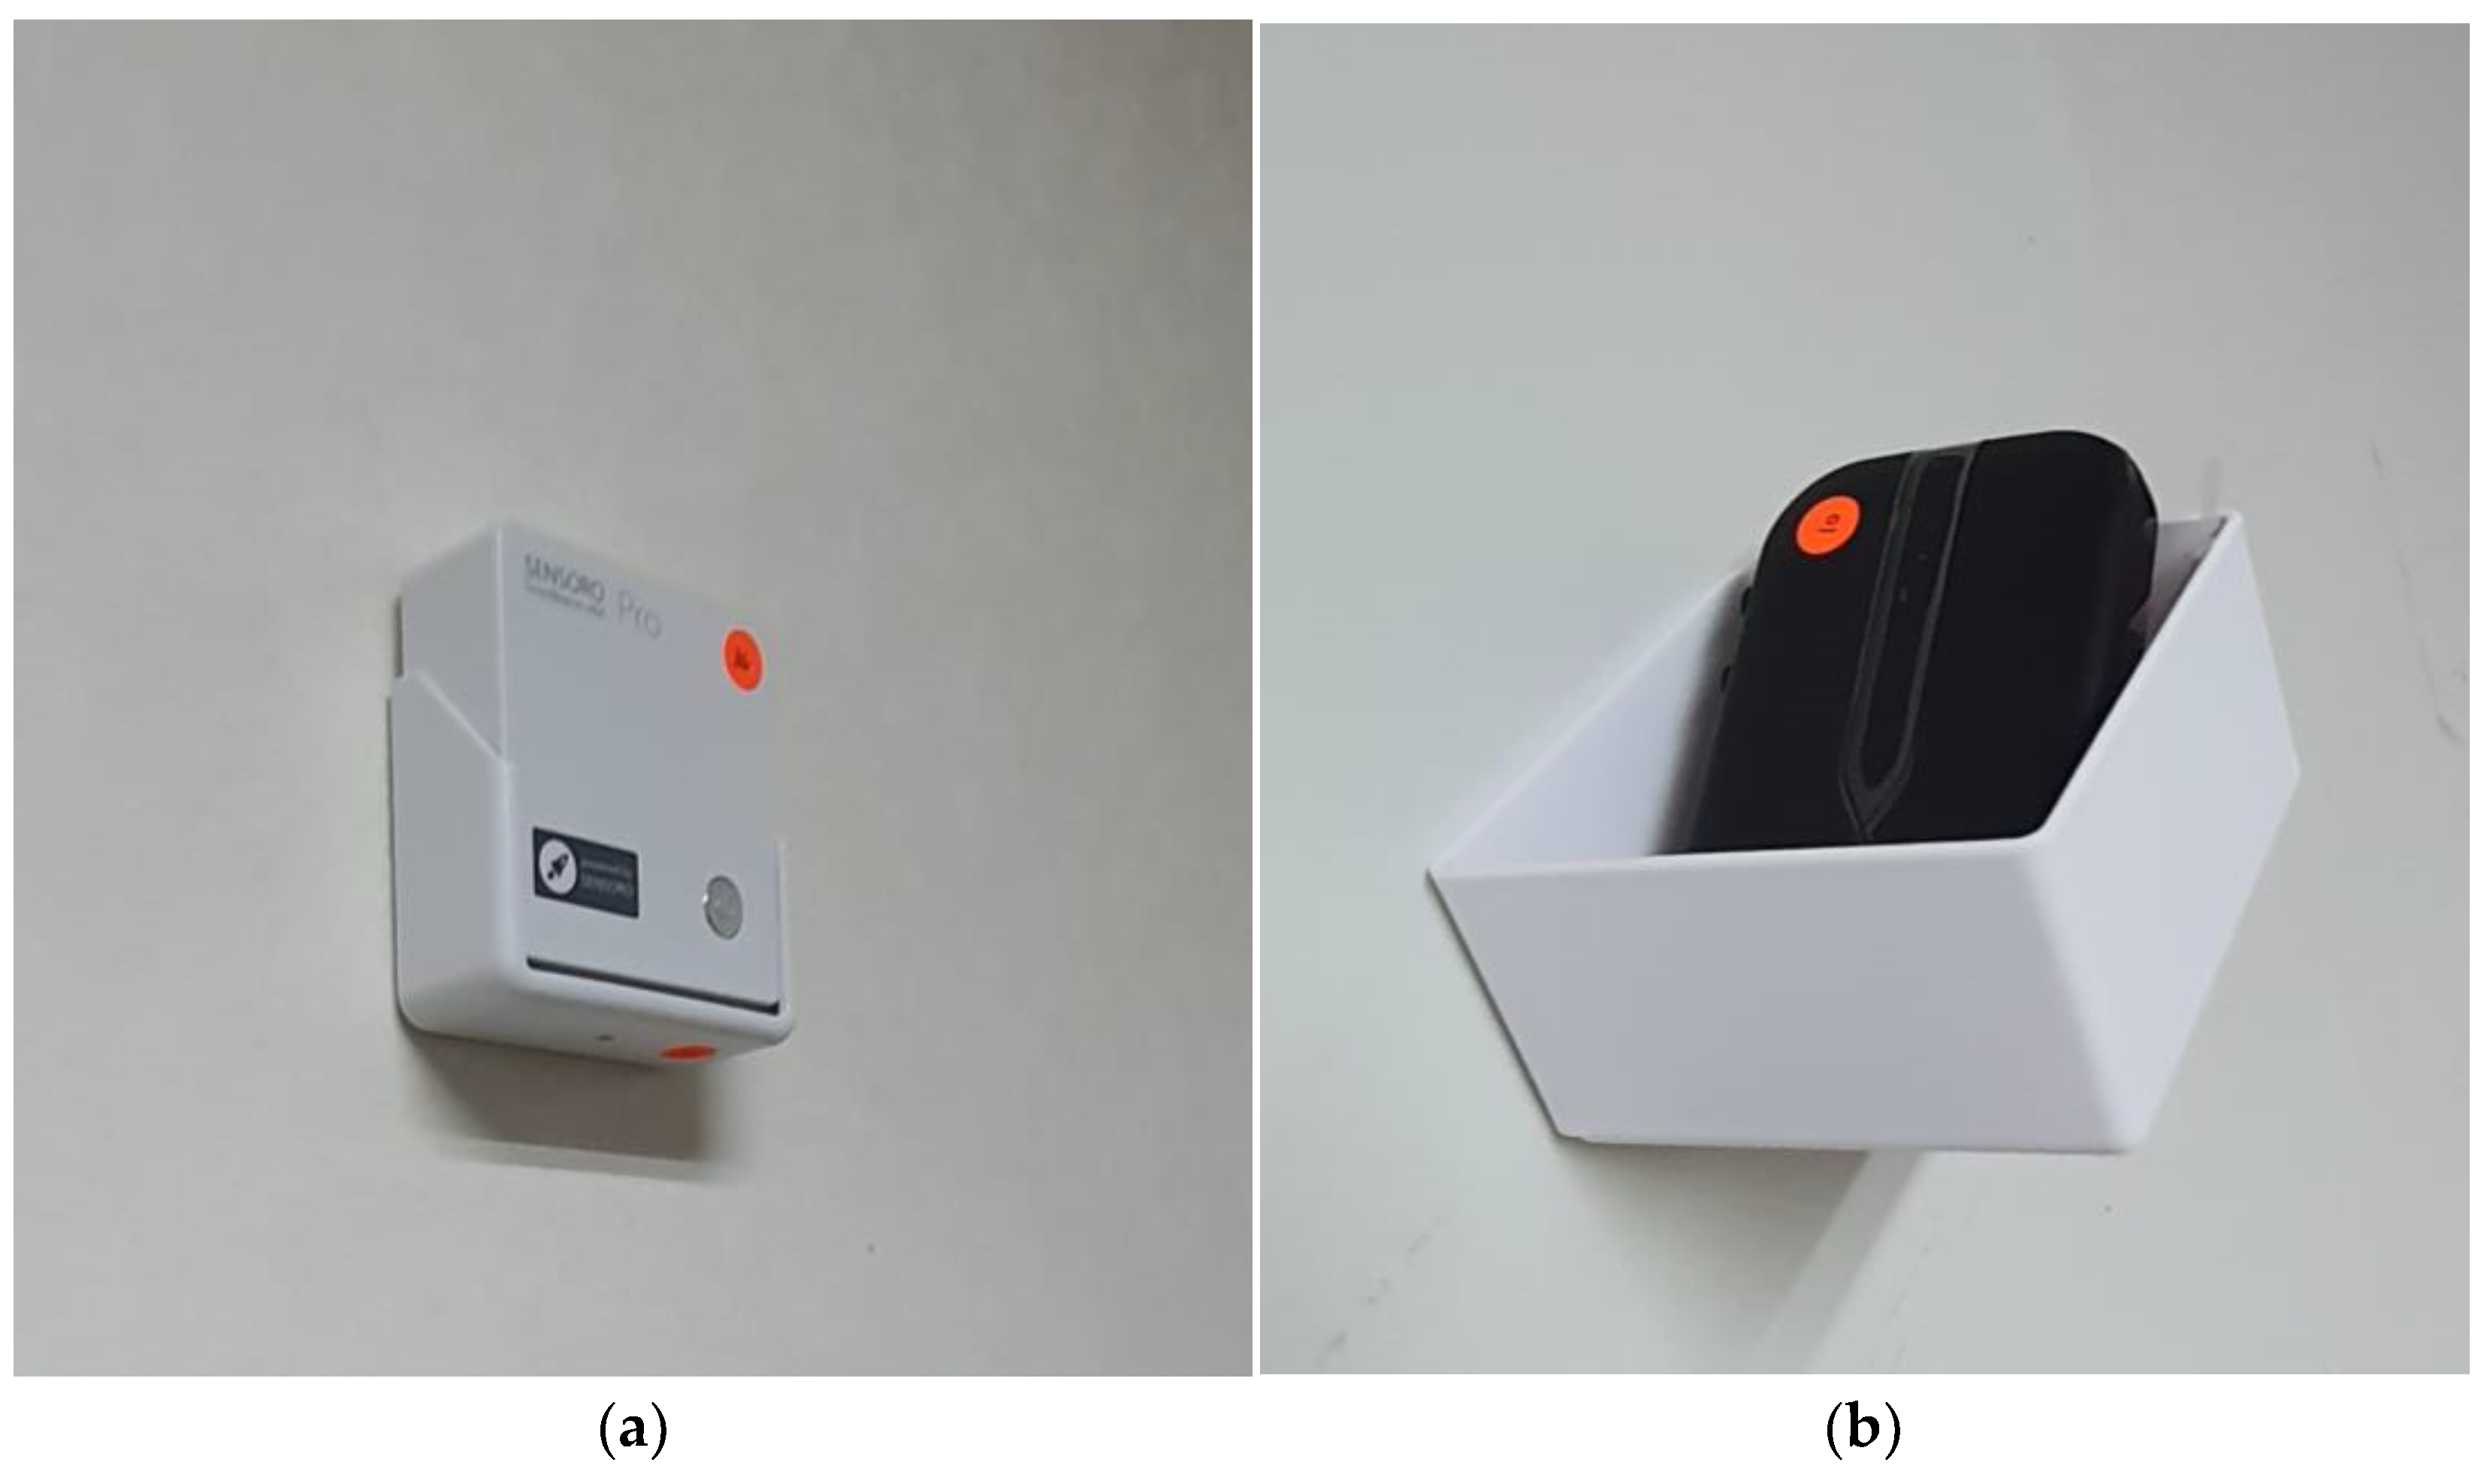
| Type of BLE Beacon | Sensoro SmartBeacon-4AA Pro |
|---|---|
| Transmitting Power | 4 dBm |
| Advertising Interval | 417.5 ms (recommended by the manufacturer) |
| RSSI calibrations | −67 dBm |
| Transmitting Frequency | 2.4 GHz |
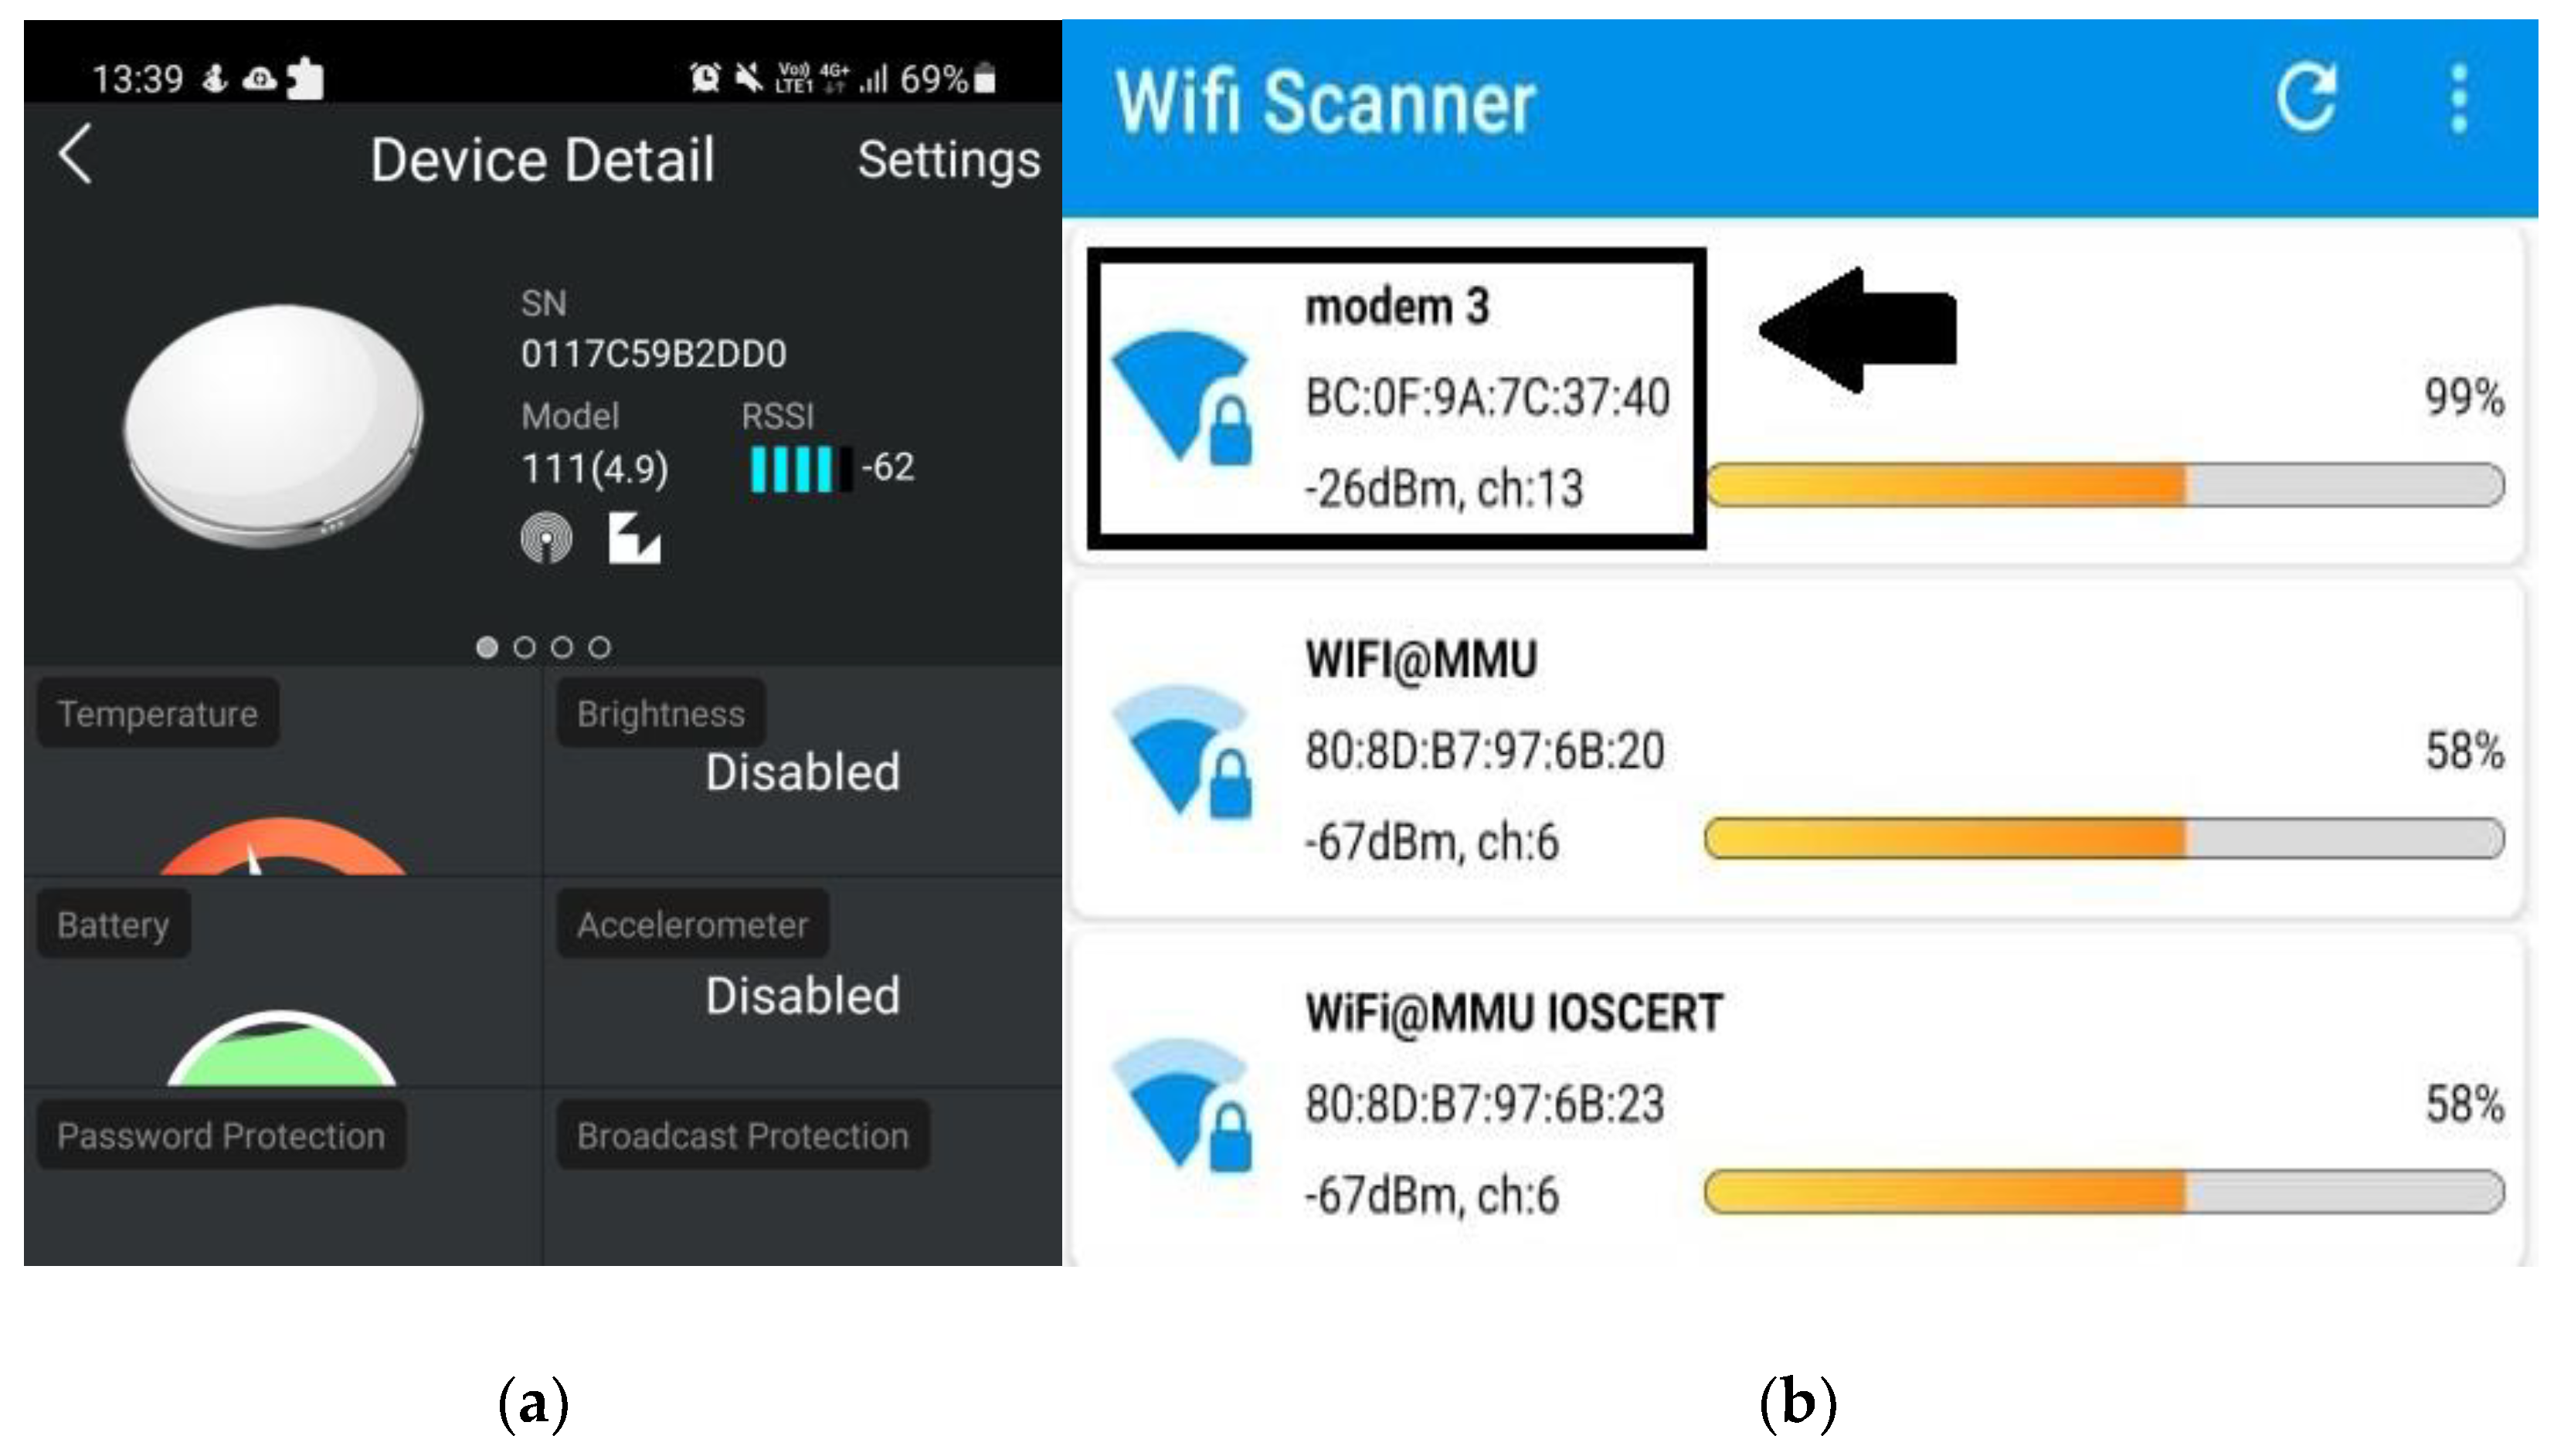
| Application used | Sensoro Apps |
| Type of Wi-Fi Access Point | D-Link 4G LTE Mobile Router |
|---|---|
| Transmitting Power | Fixed by manufacturer |
| Advertising Interval | Fixed by manufacturer |
| RSSI calibrations | Fixed by manufacturer |
| Transmitting Frequency | 2.4 GHz |
| Application used | All Router Setup |
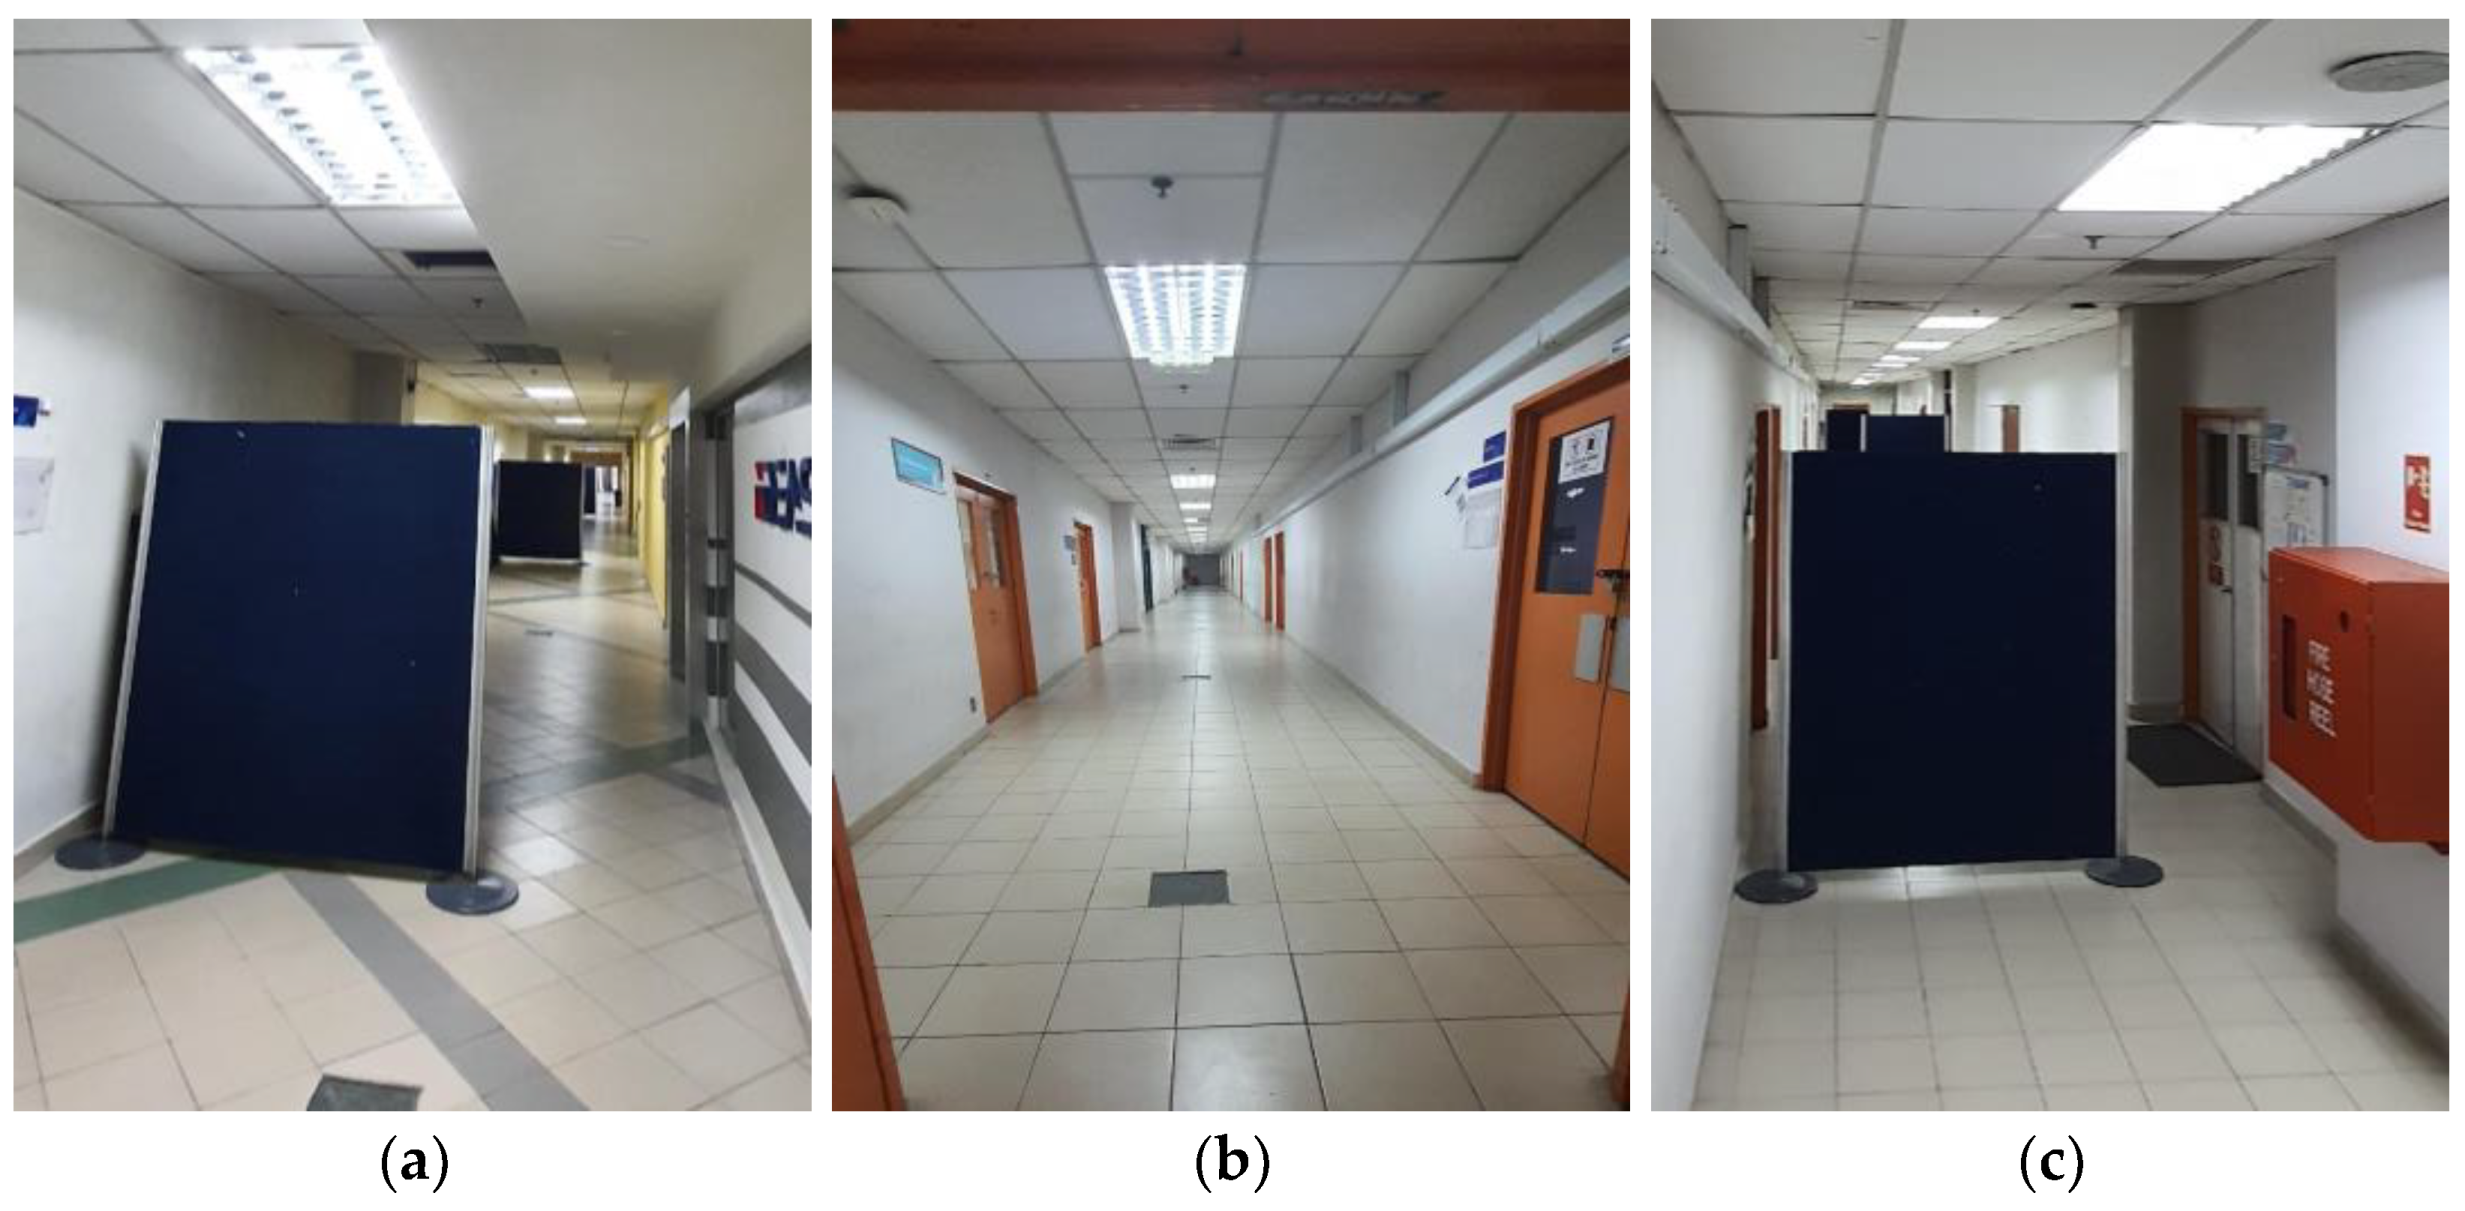
| Floor/Layout | Layout 1 (Without Partition Board) | Layout 2 | Layout 2 |
|---|---|---|---|
| Ground Floor | No boards | 15 boards | 15 boards |
| First Floor | No boards | No boards | 12 boards |
| Second Floor | No boards | 15 boards | 15 boards |
| x | y | z | Sample | BLE1 | BLE2 | … | BLE42 | WAP1 | … | WAP17 |
|---|---|---|---|---|---|---|---|---|---|---|
| 1 | −88 | −97 | … | −110 | −110 | −110 | −110 | |||
| 0 | 0 | 0 | … | … | … | … | … | … | … | … |
| 30 | −110 | −95 | … | −110 | −110 | −110 | −110 | |||
| 1 | −110 | −110 | … | −95 | −89 | −110 | −110 | |||
| 0 | 1 | 0 | … | … | … | … | … | … | … | … |
| 30 | −110 | −110 | … | −73 | −110 | −73 | −83 | |||
| …… | …… | …… | ||||||||
| 1 | −93 | −92 | … | −110 | −110 | −110 | −110 | |||
| 0 | 47 | 0 | … | … | … | … | … | … | … | … |
| 30 | −110 | −110 | … | −73 | −75 | −73 | −83 |
| Floor | x | y | BLE1 | BLE2 | … | BLE42 | WAP1 | … | WAP17 |
|---|---|---|---|---|---|---|---|---|---|
| 0 | 0 | 0 | −93.9 | −88.4 | … | −110 | −110 | −110 | −110 |
| … | … | … | … | … | … | … | … | … | … |
| 0 | 0 | 47 | −84.2 | −85.5 | … | −110 | −110 | −110 | −110 |
| 0 | 1 | 0 | −110 | −110 | … | −87.7 | −99.6 | −110 | −110 |
| … | … | … | … | … | … | … | … | … | … |
| 2 | 2 | 47 | −110 | −110 | −110 | −108.6 | −102.2 | −110 | −110 |
| Training Dataset | Testing Dataset | K | Floor Accuracy | Average Positioning Error (m) |
|---|---|---|---|---|
| Layout 1 | Layout 1 | 1 | 1.0 | 2.05 |
| 5 | 1.0 | 2.11 | ||
| 9 | 1.0 | 2.10 | ||
| Layout 2 | Layout 2 | 1 | 1.0 | 2.02 |
| 5 | 1.0 | 2.06 | ||
| 9 | 1.0 | 2.09 | ||
| Layout 3 | Layout 3 | 1 | 1.0 | 1.49 |
| 5 | 1.0 | 1.68 | ||
| 9 | 1.0 | 1.74 | ||
| Layout 1 | Layout 2 | 1 | 1.0 | 2.49 |
| 5 | 1.0 | 2.37 | ||
| 9 | 1.0 | 2.32 | ||
| Layout 1 | Layout 3 | 1 | 0.997 | 4.67 |
| 5 | 0.996 | 4.39 | ||
| 9 | 0.996 | 4.26 | ||
| Layout 2 | Layout 1 | 1 | 1.0 | 2.67 |
| 5 | 1.0 | 2.54 | ||
| 9 | 1.0 | 2.5 | ||
| Layout 2 | Layout 3 | 1 | 1.0 | 3.59 |
| 5 | 1.0 | 3.42 | ||
| 9 | 1.0 | 3.32 | ||
| Layout 3 | Layout 1 | 1 | 1.0 | 2.84 |
| 5 | 1.0 | 2.72 | ||
| 9 | 1.0 | 2.69 | ||
| Layout 3 | Layout 2 | 1 | 1.0 | 2.77 |
| 5 | 1.0 | 2.69 | ||
| 9 | 1.0 | 2.6 |
| Training Dataset | Testing Dataset | Floor Accuracy | Average Positioning Error (m) |
| Layout 1 | Layout 1 | 1.0 | 2.73 |
| Layout 2 | Layout 2 | 0.997 | 3.43 |
| Layout 3 | Layout 3 | 1.0 | 2.02 |
| Layout 1 | Layout 2 | 0.96 | 3.94 |
| Layout 1 | Layout 3 | 0.77 | 5.71 |
| Layout 2 | Layout 1 | 0.96 | 5.16 |
| Layout 2 | Layout 3 | 0.79 | 7.74 |
| Layout 3 | Layout 1 | 0.98 | 3.98 |
| Layout 3 | Layout 2 | 0.98 | 3.53 |
| Training Dataset | Testing Dataset | Floor Accuracy | Average Positioning Error (m) |
| Layout 1 | Layout 1 | 1.0 | 2.64 |
| Layout 2 | Layout 2 | 1.0 | 3.01 |
| Layout 3 | Layout 3 | 1.0 | 1.98 |
| Layout 1 | Layout 2 | 1.0 | 3.83 |
| Layout 1 | Layout 3 | 0.98 | 5.63 |
| Layout 2 | Layout 1 | 1.0 | 4.48 |
| Layout 2 | Layout 3 | 0.98 | 6.97 |
| Layout 3 | Layout 1 | 0.99 | 3.41 |
| Layout 3 | Layout 2 | 1.0 | 3.04 |
| Training Dataset | Testing Dataset | Floor Accuracy | Average Positioning Error (m) |
| Layout 1 | Layout 1 | 0.997 | 3.68 |
| Layout 2 | Layout 2 | 0.99 | 4.63 |
| Layout 3 | Layout 3 | 0.99 | 4.18 |
| Layout 1 | Layout 2 | 0.995 | 4.73 |
| Layout 1 | Layout 3 | 0.95 | 6.16 |
| Layout 2 | Layout 1 | 0.992 | 5.12 |
| Layout 2 | Layout 3 | 0.979 | 4.77 |
| Layout 3 | Layout 1 | 0.998 | 5.75 |
| Layout 3 | Layout 2 | 0.995 | 5.37 |
Publisher’s Note: MDPI stays neutral with regard to jurisdictional claims in published maps and institutional affiliations. |
© 2022 by the authors. Licensee MDPI, Basel, Switzerland. This article is an open access article distributed under the terms and conditions of the Creative Commons Attribution (CC BY) license (https://creativecommons.org/licenses/by/4.0/).
Share and Cite
Nor Hisham, A.N.; Ng, Y.H.; Tan, C.K.; Chieng, D. Hybrid Wi-Fi and BLE Fingerprinting Dataset for Multi-Floor Indoor Environments with Different Layouts. Data 2022, 7, 156. https://doi.org/10.3390/data7110156
Nor Hisham AN, Ng YH, Tan CK, Chieng D. Hybrid Wi-Fi and BLE Fingerprinting Dataset for Multi-Floor Indoor Environments with Different Layouts. Data. 2022; 7(11):156. https://doi.org/10.3390/data7110156
Chicago/Turabian StyleNor Hisham, Aina Nadhirah, Yin Hoe Ng, Chee Keong Tan, and David Chieng. 2022. "Hybrid Wi-Fi and BLE Fingerprinting Dataset for Multi-Floor Indoor Environments with Different Layouts" Data 7, no. 11: 156. https://doi.org/10.3390/data7110156
APA StyleNor Hisham, A. N., Ng, Y. H., Tan, C. K., & Chieng, D. (2022). Hybrid Wi-Fi and BLE Fingerprinting Dataset for Multi-Floor Indoor Environments with Different Layouts. Data, 7(11), 156. https://doi.org/10.3390/data7110156