Long-Term, Gridded Standardized Precipitation Index for Hawai‘i


Abstract
1. Summary
2. Data Description and Methods
2.1. Calculating Gridded SPI
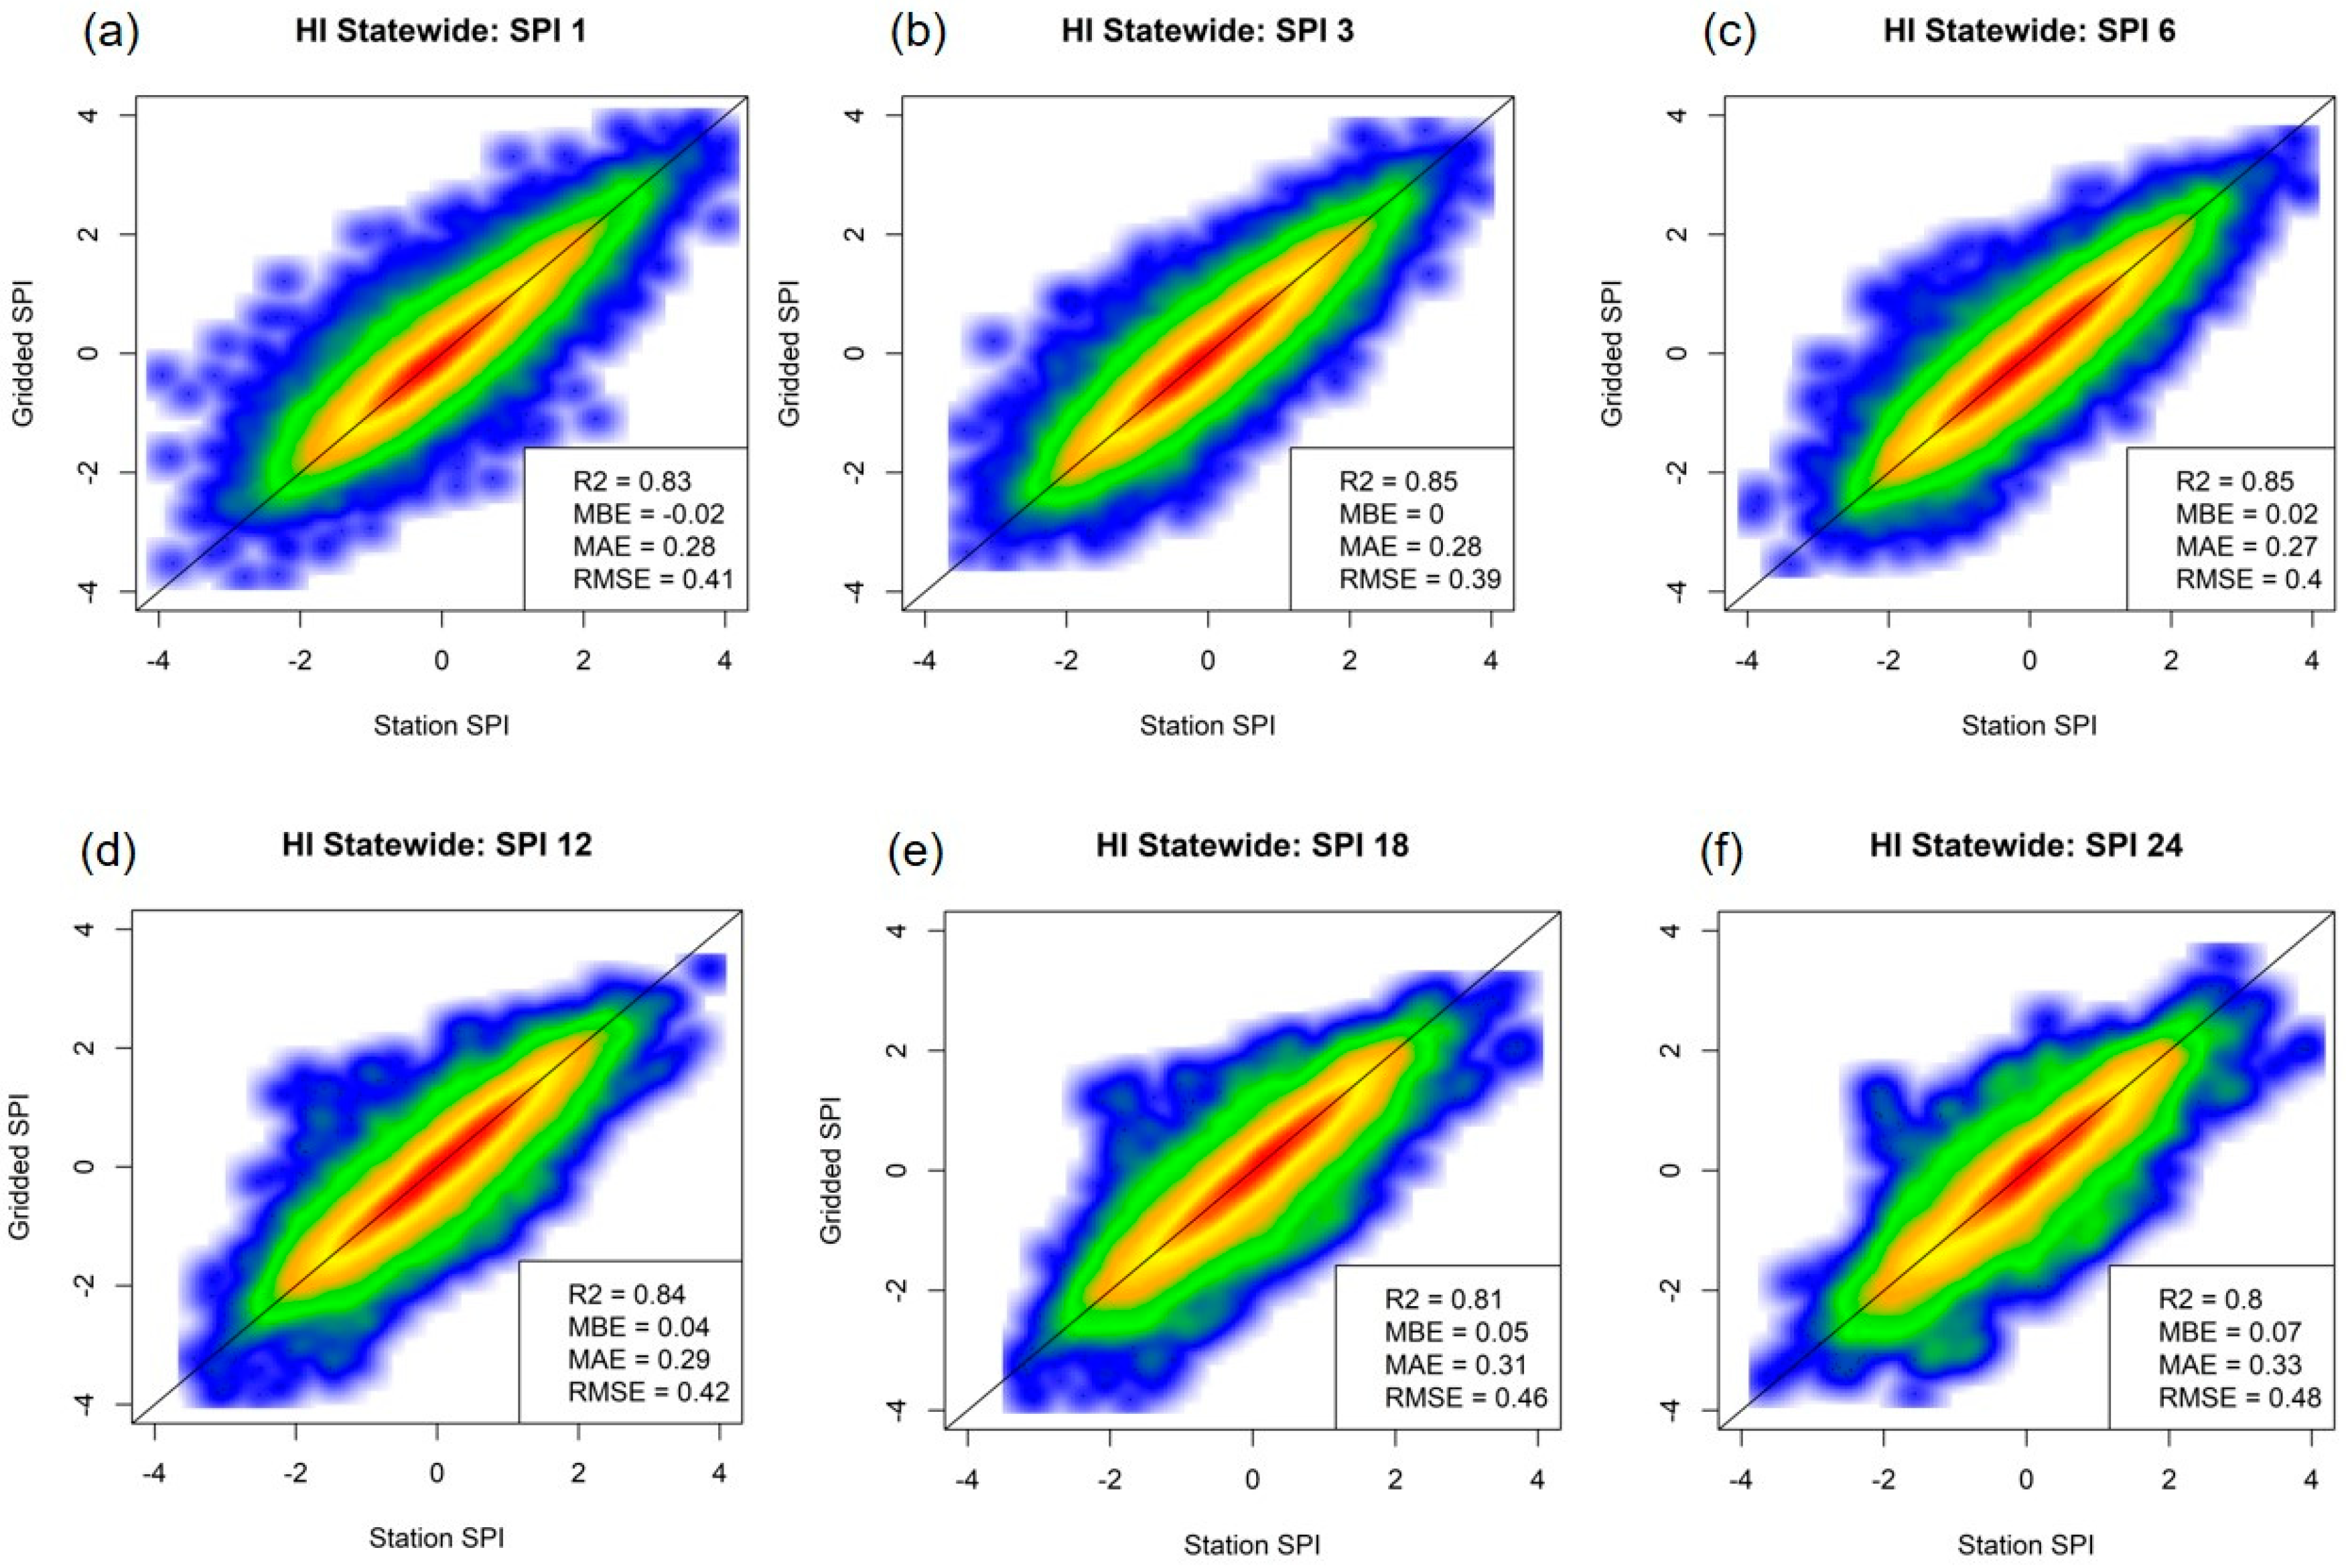
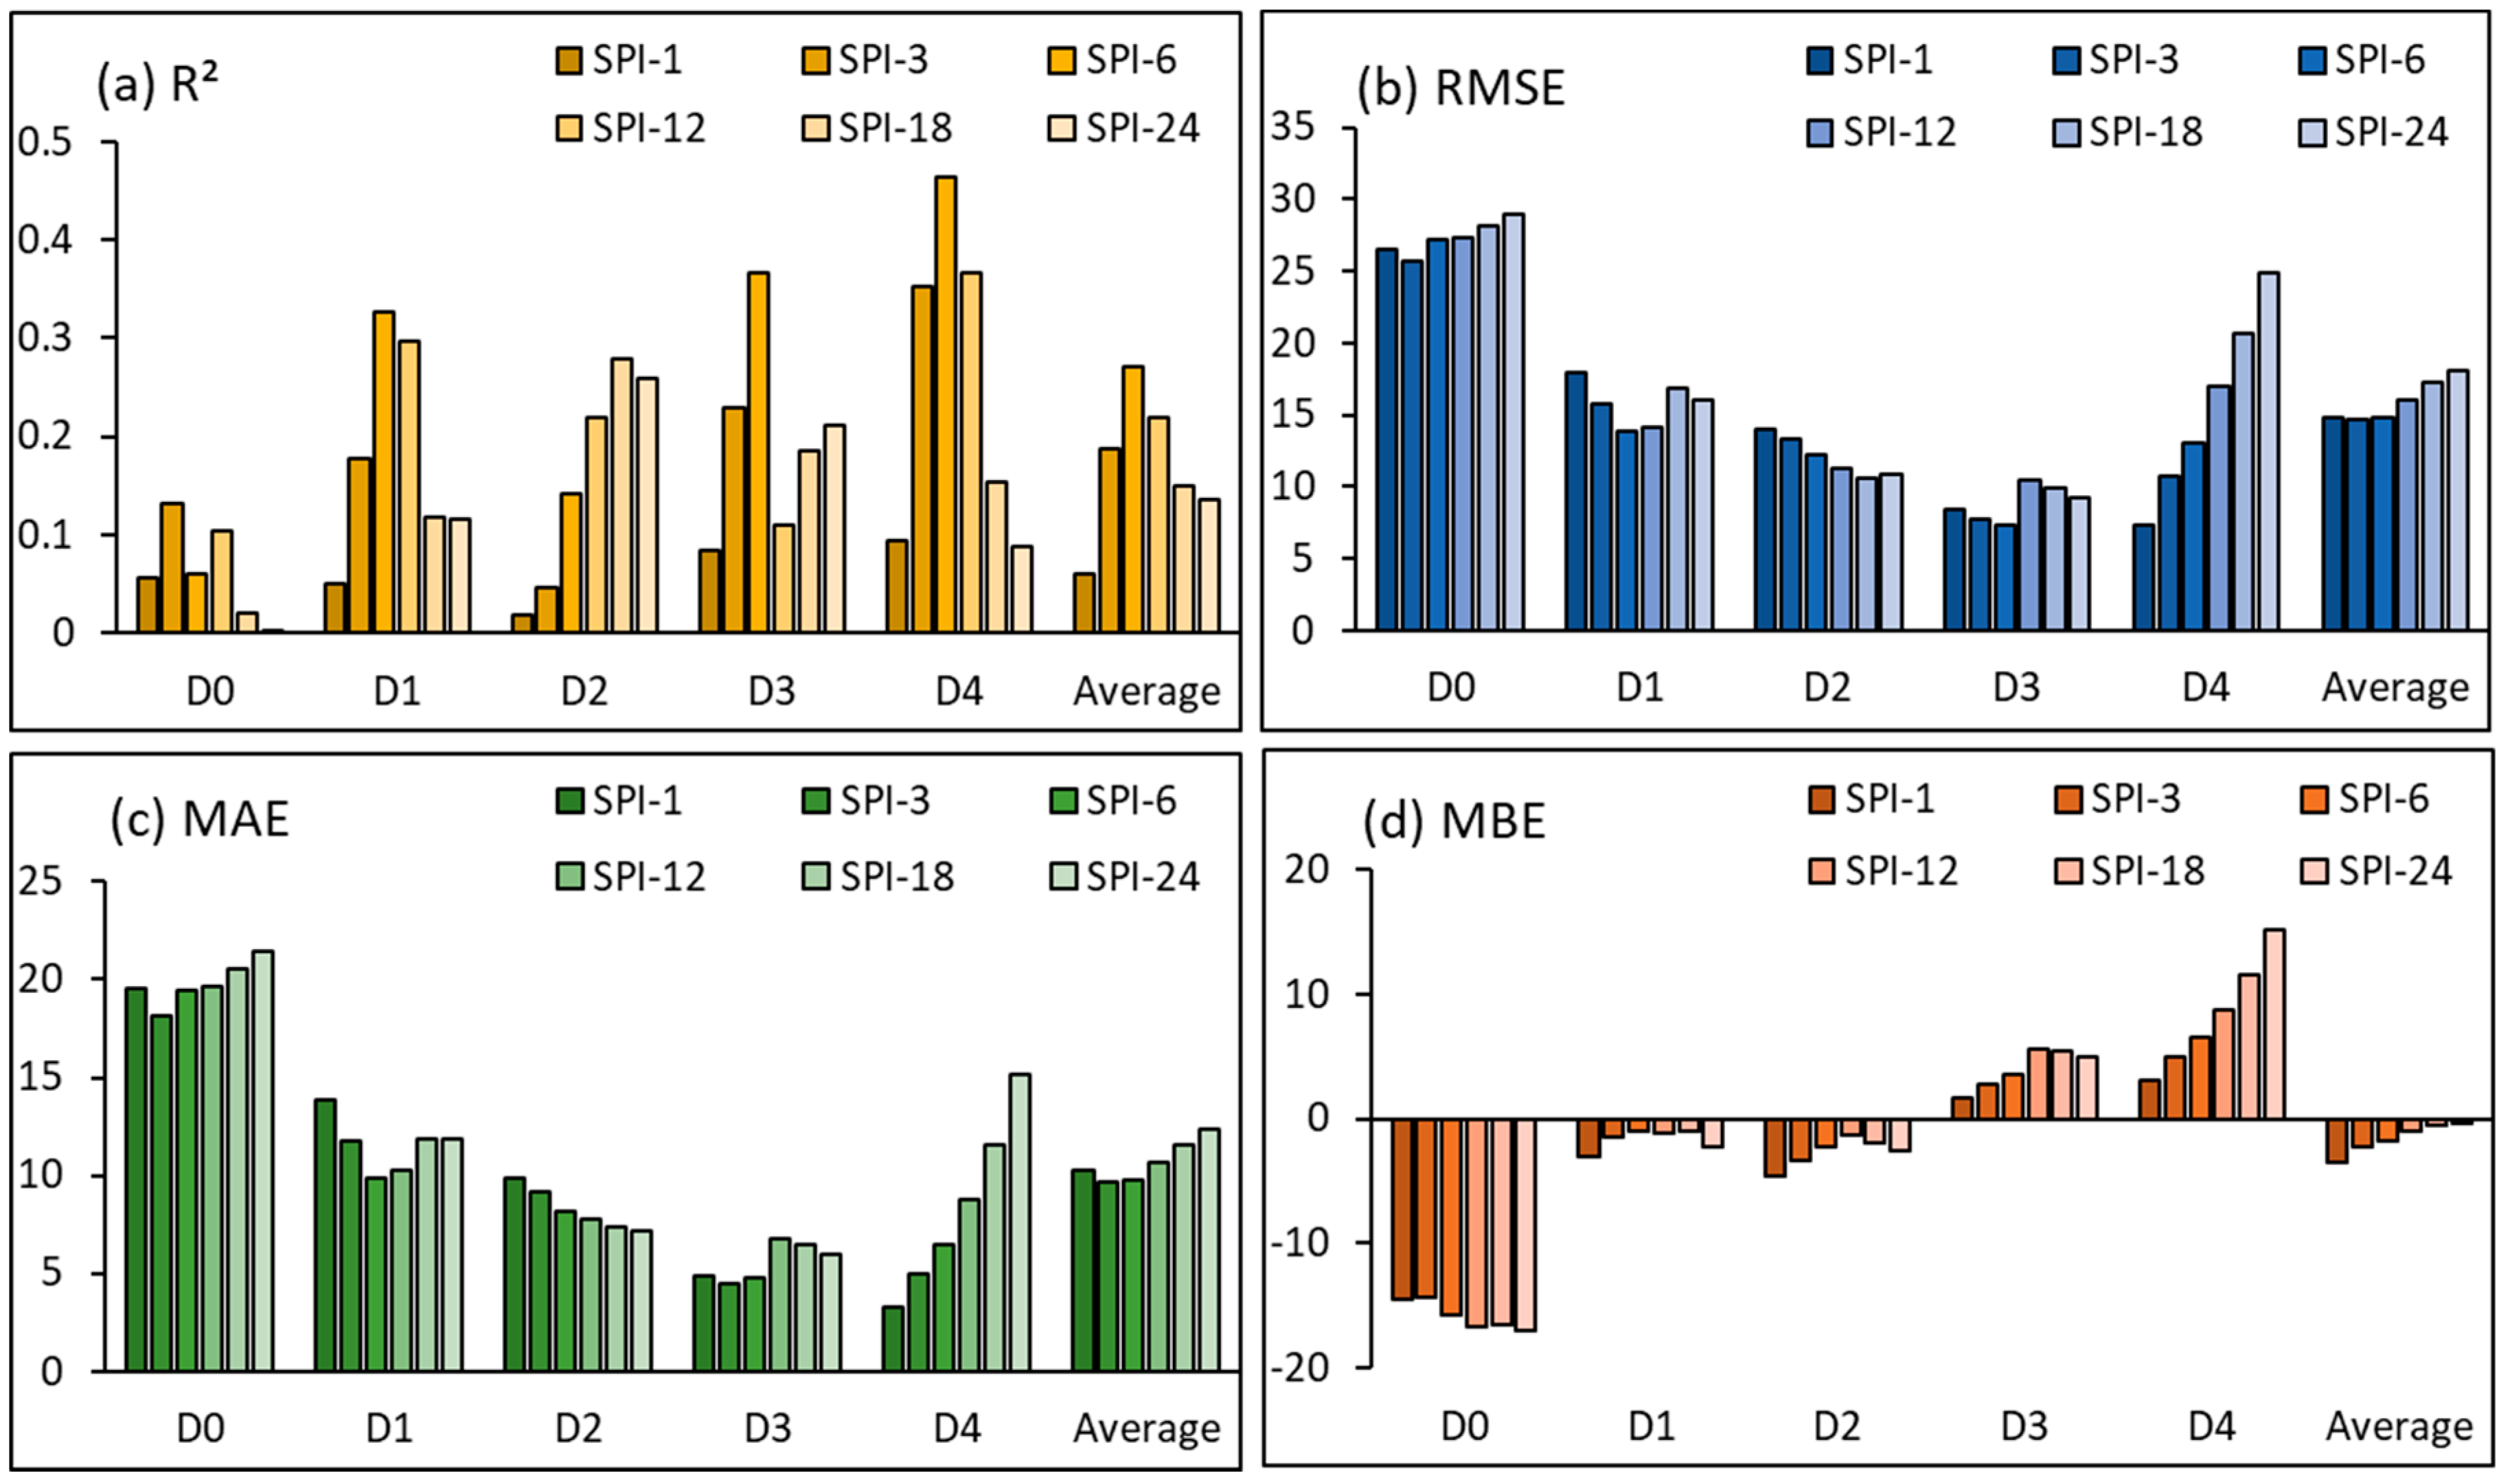
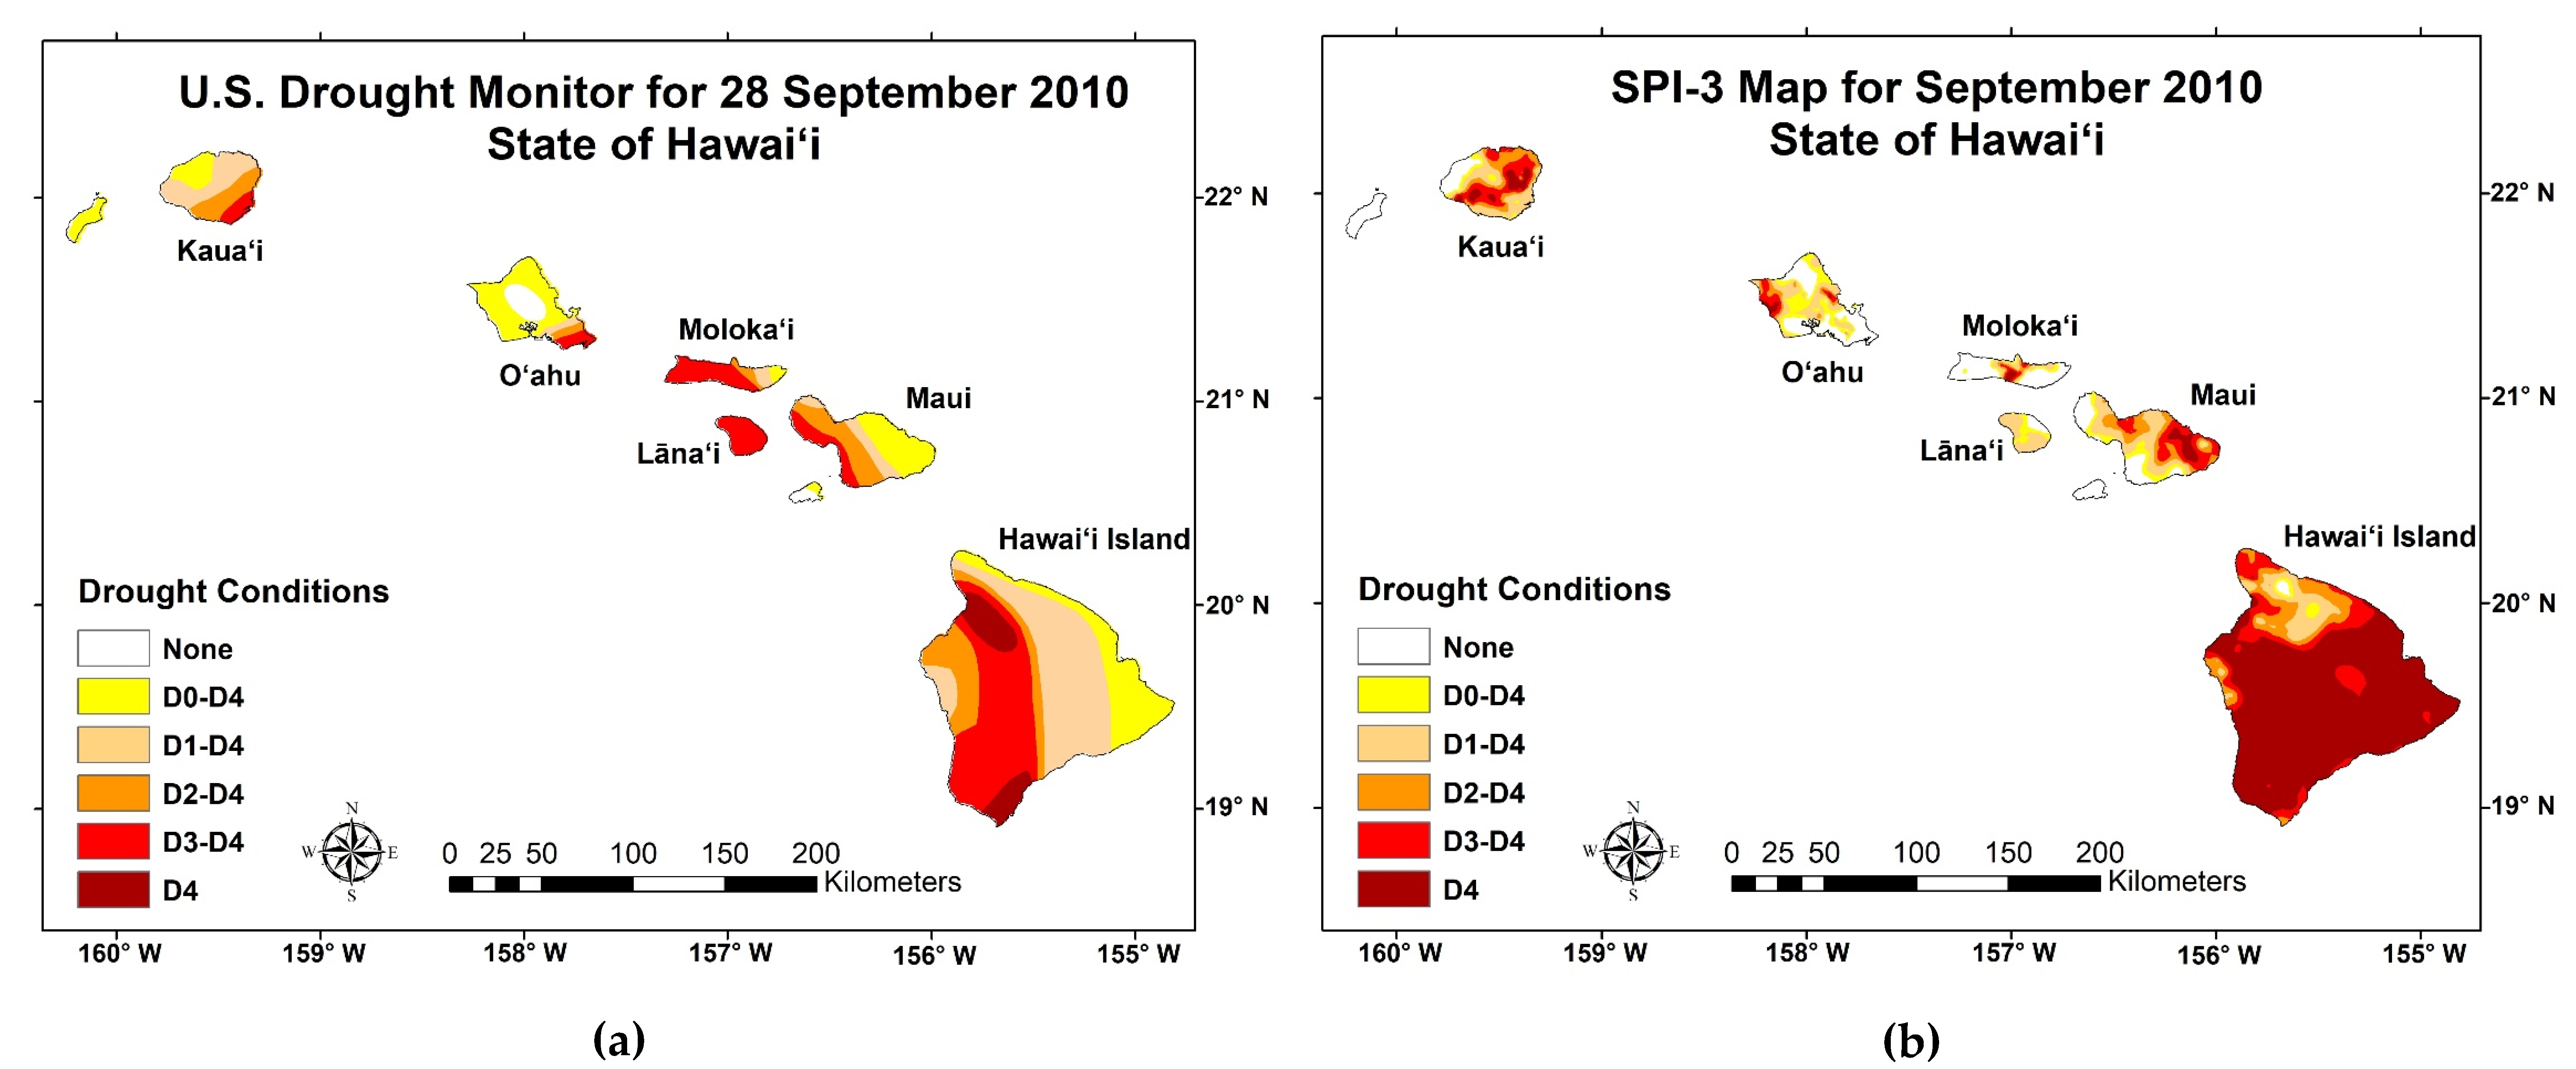
2.2. Validation
3. Validation Results
4. Data Use and Application
Author Contributions
Funding
Acknowledgments
Conflicts of Interest
References
- Giambelluca, T.W.; Chen, Q.; Frazier, A.G.; Price, J.P.; Chen, Y.-L.; Chu, P.-S.; Eischeid, J.K.; Delparte, D.M. Online rainfall atlas of hawai‘i. Bull. Am. Meteorol. Soc. 2013, 94, 313–316. [Google Scholar] [CrossRef]
- Frazier, A.G.; Giambelluca, T.W. Spatial trend analysis of Hawaiian rainfall from 1920 to 2012. Int. J. Climatol. 2017, 37, 2522–2531. [Google Scholar] [CrossRef]
- Frazier, A.G.; Giambelluca, T.W.; Diaz, H.F.; Needham, H.L. Comparison of geostatistical approaches to spatially interpolate month-year rainfall for the Hawaiian Islands. Int. J. Climatol. 2016, 36, 1459–1470. [Google Scholar] [CrossRef]
- Giambelluca, T.W.; Nullet, M.A.; Ridgley, M.A.; Eyre, P.R.; Moncur, J.E.T.; Price, S. Drought in Hawai‘i; Report R88; University of Hawai‘i at Mānoa and U.S. Geological Survey: Honolulu, HI, USA, 1991; 232p. [Google Scholar]
- Frazier, A.G.; Deenik, J.L.; Fujii, N.D.; Funderburk, G.R.; Giambelluca, T.W.; Giardina, C.P.; Helweg, D.A.; Keener, V.W.; Mair, A.; Marra, J.J.; et al. Managing effects of drought in Hawai‘i and U.S.-affiliated pacific islands. In Effects of Drought on Forests and Rangelands in the United States: Translating Science into Management Responses; Vose, J.M., Peterson, D.L., Luce, C.H., Patel-Weynand, T., Eds.; Gen. Tech. Rep. WO-98; Department of Agriculture Forest Service, Washington Office: Washington, DC, USA, 2019; Chapter 5; pp. 95–121. [Google Scholar]
- Trauernicht, C. Vegetation—Rainfall interactions reveal how climate variability and climate change alter spatial patterns of wildland fire probability on Big Island, Hawaii. Sci. Total Environ. 2019, 650, 459–469. [Google Scholar] [CrossRef] [PubMed]
- Commission on Water Resources Management (CWRM). Hawaii Drought Plan. Report Prepared for State of Hawaii Department of Land and Natural Resources; One World One Water, LLC: Honolulu, HI, USA, 2017; 131p. [Google Scholar]
- Palmer, W.C. Keeping track of crop moisture conditions, nationwide: The new crop moisture index. Weatherwise 1968, 21, 156–161. [Google Scholar] [CrossRef]
- Palmer, W.C. Meteorological Drought; Res. Pap. No. 45; U.S. Weather Bureau: Washington, DC, USA, 1965; p. 58. [Google Scholar]
- Keetch, J.J.; Byram, G.M. A Drought Index for Forest Fire Control; US Department of Agriculture, Forest Service, Southeastern Forest Experiment Station: Asheville, NC, USA, 1968. [Google Scholar] [CrossRef]
- McKee, T.B.; Doesken, N.J.; Kleist, J. The relationship of drought frequency and duration to time scales. In Proceedings of the Paper presented at the Eighth Conference on Applied Climatology, Anaheim, CA, USA, 17–22 January 1993; pp. 17–22. [Google Scholar]
- Svoboda, M.; Lecomte, D.; Hayes, M.; Heim, R.; Gleason, K.; Angel, J.; Rippey, B.; Tinker, R.; Palecki, M.; Stooksbury, D.; et al. The drought monitor. Bull. Am. Meteorol. Soc. 2002, 83, 1181–1190. [Google Scholar] [CrossRef]
- Hayes, M.; Svoboda, M.; Wall, N.; Widhalm, M. The Lincoln declaration on drought indices: Universal meteorological drought index recommended. Bull. Am. Meteorol. Soc. 2011, 92, 485–488. [Google Scholar] [CrossRef]
- Vicente-Serrano, S.M.; Beguería, S.; López-Moreno, J.I. A multiscalar drought index sensitive to global warming: The standardized precipitation evapotranspiration index. J. Clim. 2010, 23, 1696–1718. [Google Scholar] [CrossRef]
- Lucas, M.; Trauernicht, C.; Frazier, A.; Miura, T. Long-Term, Gridded Standardized Precipitation Index for Hawai‘i: CUAHSI HydroShare. Available online: https://www.hydroshare.org/resource/822553ead1d04869b5b3e1e3a3817ec6/ (accessed on 16 September 2017).
- Frauendorf, T.C.; MacKenzie, R.A.; Tingley, R.W.; Frazier, A.G.; Riney, M.H.; El-Sabaawi, R.W. Evaluating ecosystem effects of climate change on tropical island streams using high spatial and temporal resolution sampling regimes. Glob. Chang. Biol. 2019, 25, 1344–1357. [Google Scholar] [CrossRef] [PubMed]
- Newman, A.J.; Clark, M.P.; Longman, R.J.; Gilleland, E.; Giambelluca, T.W.; Arnold, J.R. Use of daily station observations to produce high-resolution gridded probabilistic precipitation and temperature time series for the hawaiian islands. J. Hydrometeorol. 2019, 20, 509–529. [Google Scholar] [CrossRef]
- Beguería, S.; Vicente-Serrano, S.M. SPEI: Calculation of the Standardised Precipitation-Evapotranspiration Index. R package Version 1.7. 2017. Available online: https://CRAN.R-project.org/package=SPEI (accessed on 16 September 2017).
- R Core Team. R: A Language and Environment for Statistical Computing; R Foundation for Statistical Computing: Vienna, Austria, 2019; Available online: https://www.R-project.org/ (accessed on 16 September 2017).
- Guttman, N. Accepting the standardized precipitation index: A calculation algorithm. J. Am. Water Resour. Assoc. 1999, 35, 311–322. [Google Scholar] [CrossRef]
- Willmott, C.J. Some comments on the evaluation of model performance. Bull. Am. Meteorol. Soc. 1982, 63, 1309–1313. [Google Scholar] [CrossRef]
- Cumbie-Ward, R.V.; Boyles, R.P. Evaluation of a high-resolution SPI for monitoring local drought severity. J. Appl. Meteorol. Climatol. 2016, 55, 2247–2262. [Google Scholar] [CrossRef]
- Hao, Z.; AghaKouchak, A. A nonparametric multivariate multi-index drought monitoring framework. J. Hydrometeor. 2014, 15, 89–101. [Google Scholar] [CrossRef]
- Anderson, M.C.; Hain, C.; Otkin, J.; Zhan, X.; Mo, K.; Svoboda, M.; Wardlow, B.; Pimstein, A. An intercomparison of drought indicators based on thermal remote sensing and NLDAS-2 simulations with US Drought Monitor classifications. J. Hydrometeor. 2013, 14, 1035–1056. [Google Scholar] [CrossRef]


| USDM Category | Percentile Chance | SPI Range |
|---|---|---|
| D0: Abnormally dry | From >20 to 30 | From −0.5 to −0.7 |
| D1: Moderate drought | From >10 to 20 | From −0.8 to −1.2 |
| D2: Severe drought | From >5 to 10 | From −1.3 to −1.5 |
| D3: Extreme drought | From >2 to 5 | From −1.6 to −1.9 |
| D4: Exceptional drought | ≤2 | ≤−2.0 |
| SPI Timescale | County | R2 | RMSE |
|---|---|---|---|
| 1-month | Hawai‘i | 0.80 | 0.45 |
| Kaua‘i | 0.88 | 0.34 | |
| Maui | 0.83 | 0.42 | |
| O‘ahu | 0.84 | 0.40 | |
| 3-month | Hawai‘i | 0.82 | 0.44 |
| Kaua‘i | 0.90 | 0.32 | |
| Maui | 0.85 | 0.39 | |
| O‘ahu | 0.85 | 0.38 | |
| 6-month | Hawai‘i | 0.82 | 0.45 |
| Kaua‘i | 0.90 | 0.33 | |
| Maui | 0.85 | 0.40 | |
| O‘ahu | 0.86 | 0.38 | |
| 12-month | Hawai‘i | 0.80 | 0.48 |
| Kaua‘i | 0.88 | 0.36 | |
| Maui | 0.83 | 0.42 | |
| O‘ahu | 0.85 | 0.40 | |
| 18-month | Hawai‘i | 0.78 | 0.52 |
| Kaua‘i | 0.87 | 0.38 | |
| Maui | 0.81 | 0.45 | |
| O‘ahu | 0.82 | 0.44 | |
| 24-month | Hawai‘i | 0.76 | 0.54 |
| Kaua‘i | 0.86 | 0.39 | |
| Maui | 0.80 | 0.48 | |
| O‘ahu | 0.81 | 0.46 |
Publisher’s Note: MDPI stays neutral with regard to jurisdictional claims in published maps and institutional affiliations. |
© 2020 by the authors. Licensee MDPI, Basel, Switzerland. This article is an open access article distributed under the terms and conditions of the Creative Commons Attribution (CC BY) license (http://creativecommons.org/licenses/by/4.0/).
Share and Cite
Lucas, M.P.; Trauernicht, C.; Frazier, A.G.; Miura, T. Long-Term, Gridded Standardized Precipitation Index for Hawai‘i. Data 2020, 5, 109. https://doi.org/10.3390/data5040109
Lucas MP, Trauernicht C, Frazier AG, Miura T. Long-Term, Gridded Standardized Precipitation Index for Hawai‘i. Data. 2020; 5(4):109. https://doi.org/10.3390/data5040109
Chicago/Turabian StyleLucas, Matthew P., Clay Trauernicht, Abby G. Frazier, and Tomoaki Miura. 2020. "Long-Term, Gridded Standardized Precipitation Index for Hawai‘i" Data 5, no. 4: 109. https://doi.org/10.3390/data5040109
APA StyleLucas, M. P., Trauernicht, C., Frazier, A. G., & Miura, T. (2020). Long-Term, Gridded Standardized Precipitation Index for Hawai‘i. Data, 5(4), 109. https://doi.org/10.3390/data5040109