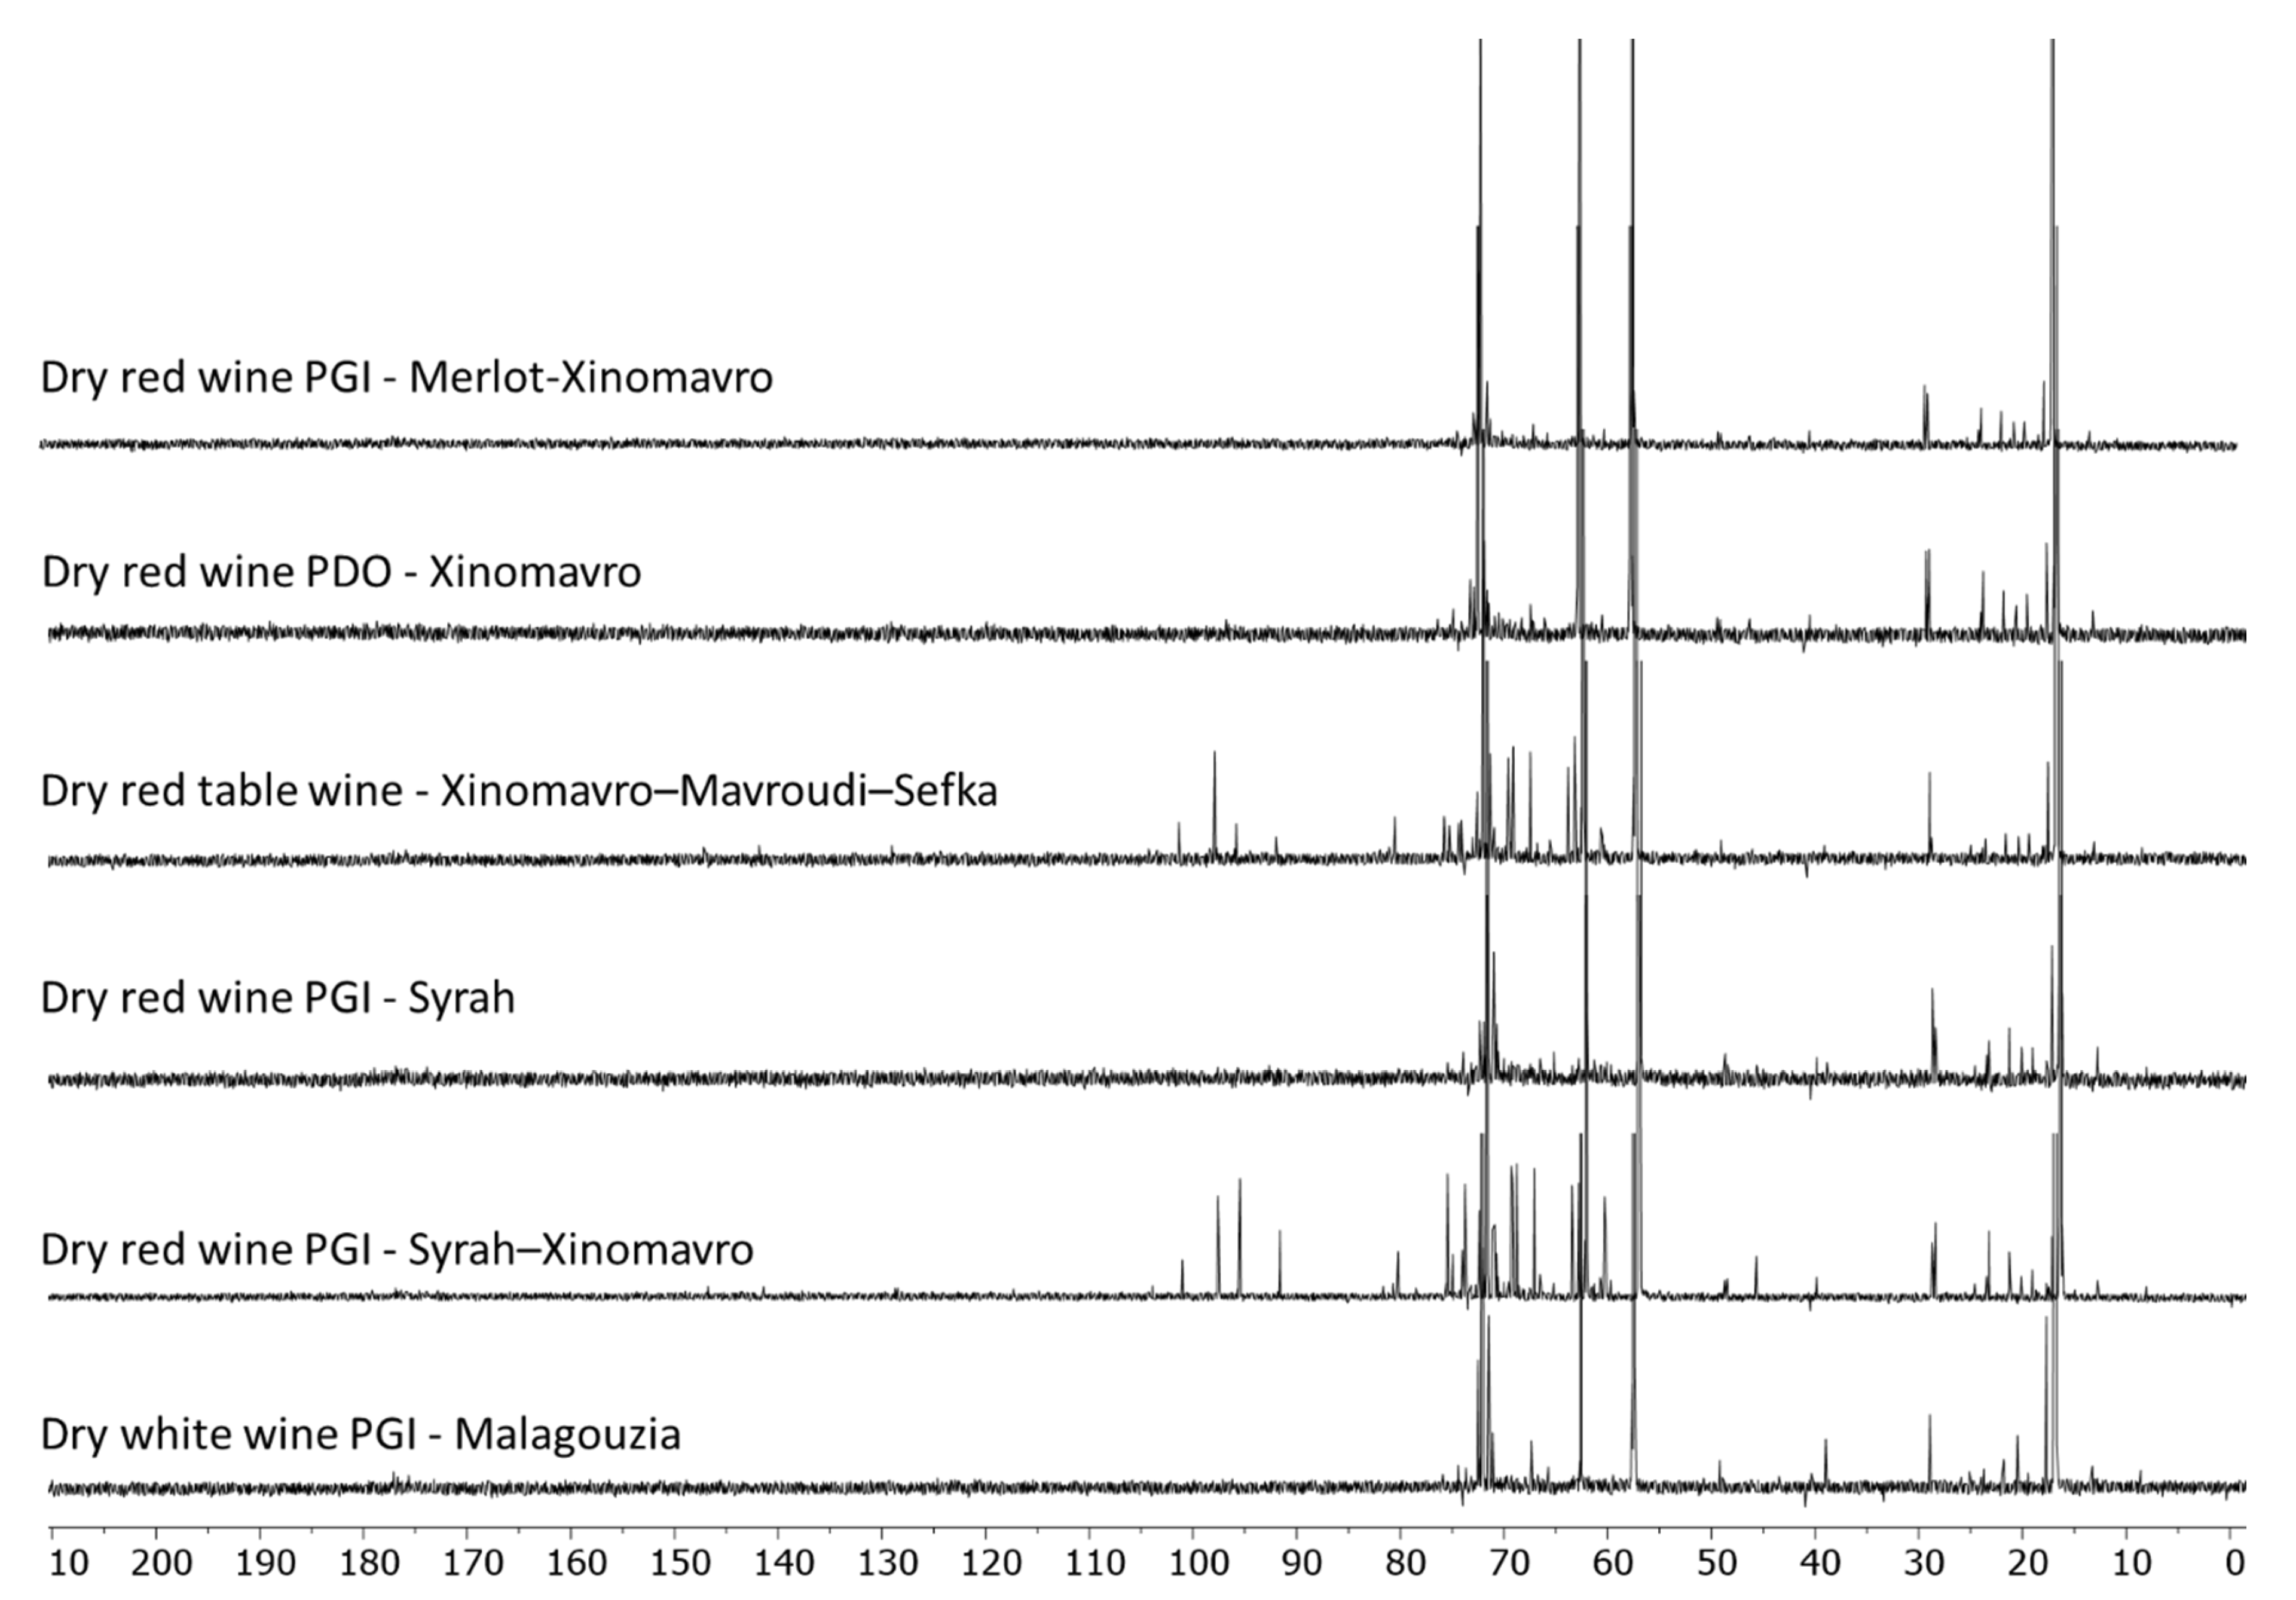
Abstract
The development of analytical techniques for characterizing food samples, especially for the wine industry, is a main topic of research. Regarding the classification of wines based on their geographical origin, nuclear magnetic resonance (NMR) spectroscopy represents a fast and effective tool for determining chemical fingerprints. Herein, a 13C NMR dataset, which was acquired for classification of Grecian wines through multivariate statistics, is reported and described. Thus, the main qualitative differences between grapes of the same geographical origin, observable by the visual analysis of the 13C NMR data, are discussed.
Dataset License: CC BY 4.0
1. Summary
The development of new analytical techniques combined with statistics for possible applications in food chemistry and, in particular, in food classification and quality assessment is a topic of interest for many studies [,,,,]. The possibility to employ, for such purposes, the raw data extracted from 13C nuclear magnetic resonance (NMR) analysis for the geographical classification of Grecian wines has been recently explored []. In that case, selected portions of 13C NMR spectra were extracted by a binning procedure, and the resulting integrals (independently from their physical meaning) were statistically treated. Herein, the original dataset, only partially published in the original manuscript, is reported and qualitatively described. The 13C NMR spectra were grouped by a known geographical origin, and a qualitative discussion about the differences among different wines from the same region is provided. The samples were analyzed in pure form as collected from the original bottles. Additional details are given in the Methods section.
2. Data Description
The 13C NMR analysis of 28 Grecian wine samples is herein described. Samples of different geographical origin and arising from different grapes and processes were considered (Table 1). The samples were grouped by geographical origin, and seven groups were generated: Crete, Samos Island, Ileia, Ioannina, Meteora, Korinthos, and Macedonia. The 13C NMR spectra of each group are described in a dedicated section.
Table 1.
The wine samples considered in the study.
2.1. Crete Samples
The Crete group contains two white (Malvasia di Candia Aromatica–Chardonnay and Vidiano), two red (Syrah and Syrah–Mandilari), and one rosé wine (Syrah–Mandilari). The corresponding 13C NMR spectra are reported in Figure 1.
Figure 1.
13C nuclear magnetic resonance (NMR) spectra of Crete wines.
From the 13C NMR spectra reported in Figure 1, it is possible to notice that the pattern of signals associated with the Crete wines is similar for all the samples considered. As the five wines analyzed are quite different in terms of grapes, procedure, and year of preparation, more differences within the corresponding spectra were expected. This fact suggests that the common geography of these grapes strongly influences their chemical composition, leading to only small differences related to grape and production characteristics. The portions of the spectra most representative for these samples are the aliphatic part (10–40 ppm), as well as the part associated with carbon atoms near multiple bonds or to heteroatoms (40–80 ppm). Looking at the small differences, up to 50 ppm, only the dry rosé protected geographical indication (PGI) Syrah–Mandilari shows a different pattern of signals between 40 and 50 ppm. Looking at lower fields, dry red wine PGI Syrah–Mandilari and dry red wine Syrah reveal a small pattern between 90 and 105 ppm. Small signals just outside the background in the area of the quaternary carbons, around 180 ppm, can be noticed for all the samples.
2.2. Samos Island Samples
From Samos Island, four wines (three white and one rosé) were considered (Figure 2).
Figure 2.
13C NMR spectra of Samos Island wines.
The three Muscat wines from Samos Island present a very similar pattern in their 13C NMR spectra. The dry white DPO wine seems to contain fewer minor compounds with respect to the other two wines made by the same grape. Apart from the major pattern, the windows between 20 and 55 ppm, as well as from 110 to 210 ppm, are very clean. The spectrum of the semi-dry rosé wine shows a very similar pattern to the Muscat wines, suggesting (at a qualitative level) that the common geography determines the composition observable at 13C NMR more than the specific type of grape.
2.3. Ileia Samples
A total of four wines arising from Ileia were analyzed: one white (Albariño) and three red (Augoustiatis, Daphne Nera–Mavrodafni, and Refosco) (Figure 3).
Figure 3.
13C NMR spectra of Ileia wines.
Concerning the wines from Ileia (Figure 3), the three made from red grapes share a very similar 13C spectrum, with no relevant differences. The patterns change for the white Albariño, which has a characteristic group of signals between 90 and 110 ppm.
2.4. Ioannina Samples
Two wines from Ileia were analyzed: one red and one white from, respectively, grapes of the type Vlahiko and Debina (Figure 4).
Figure 4.
13C NMR spectra of Zitsa (Ioannina) wines.
Vlahiko and Debina wines from Zitsa (Ioannina) look very different in the 13C NMR spectra. A first important difference is represented by the relative concentration of chemicals; as the samples were analyzed in pure form, the richness of signals and their qualitative intensity are indicative of the relative organic compounds’ availability in the wine. In this context, Debina wine is richer in its organic fraction, and important patterns can be observed (Figure 4) especially in the portion ranging from 55 to 82 ppm, and from 90 to 115 ppm.
2.5. Meteora Samples
The three wines considered from Meteora were prepared from grapes Malagouzia and Assyrtiko (white) and Limniona (red). The 13C NMR spectra are reported in Figure 5.
Figure 5.
13C NMR spectra of Meteora wines.
The three analyzed wines from Meteora show different patterns in the 13C NMR spectra. In general, Assyrtiko and Limniona samples seem richer in composition when compared to the Malagouzia wines, suggesting once again that the difference in grapes can be sometimes overwhelmed by the same geographical origin. This qualitative observation sets the basis for a quantitative classification based on geography by means of an appropriate treatment of 13C data with statistics [].
2.6. Korinthos Samples
Two Agiorgitiko wines (one red and one rosé), and a blended Syrah–Merlot–Cabernet (red) from Korinthos were analyzed (Figure 6).
Figure 6.
13C NMR spectra of Korinthos wines.
The 13C NMR spectra of the three samples from Korinthos are different for each sample (Figure 6). Semi-sweet red PGI wine (Agiorgitiko) results are richer in composition, maybe due to the specific preparation process. The 13C pattern registered for the other Agiorgitiko wine (dry rosé PGI) seems a less rich version (in terms of composition) of the sweet red one made from the same grape, as all the relevant signals are common in both samples, with the red sweet wine showing many additional patterns.
2.7. Macedonia Samples
Six samples from Macedonia were considered for analysis: three prepared from mono-varietal grapes (Malagouzia, Syrah, and Xinomavro) and three blended (Syrah–Xinomavro, Xinomavro–Mavroudi–Sefka, Merlot–Xinomavro, Figure 7).
Figure 7.
13C NMR spectra of Macedonia wines.
Regarding the Macedonia samples, the monovarietal or the blended nature of the wine does not seem to have been the origin of the differences in their organic composition. Malagouzia, Syrah, Xinomavro, and Merlot–Xinomavro wines show a very similar pattern, which indicates, indeed, a not particularly rich composition. On the contrary, Syrah–Xinomavro and Xinomavro–Mavroudi–Sefka show the presence of several different organic carbons, with comparable patterns.
3. Conclusions
The qualitative analysis of 13C NMR spectra relative to Grecian wines produced from different grapes confirmed the possibility of employing NMR spectroscopy for wine classification. Nevertheless, the different spectral patterns observed can be related to the grape type as well as to the geographical origin. Non-homogeneous trends were observed in samples from the same geographical area. In this context, in order to employ the methodology herein presented to discriminate within different wines, some additional analytical steps need to be performed. More information can be extracted from the 13C NMR spectra by opportune multivariate statistical techniques.
4. Methods
Wine samples were collected from their original bottles and analyzed in pure form (0.4 mL). Proton-decoupled 13C NMR analysis, in the presence of 30 mL of D2O containing 10% of tetramethylsilane (TMS, internal reference) (Sigma-Aldrich Italy) was then conducted. As TMS is almost insoluble in D2O, when this reference was not used, the typical signal at 60.1 ppm of glucose, common to all the samples, was taken as an internal reference for scale adjustment []. The NMR measurements were taken using a Bruker NEO 500 spectrometer equipped with a 5 mm pulsed-field z-gradient broadband BBFO probe and a variable-temperature unit operating at 125 MHz for the carbon nucleus. The following acquisition parameters were applied for each measurement: time domain 32K, 2500 scans, and a spectral width of 240 ppm. The spectral data from the 13C NMR analysis were processed as follows: Fourier transformation was applied and apodization with an exponent = 0.1 was performed, followed by an automatic baseline and phase corrections. The resulting spectra were studied in the range between 0 and 210 ppm. Spectral manipulation was performed using the Bruker Top Spin software [].
Author Contributions
Conceptualization, I.K.K. and A.M.; methodology, A.M.; validation, A.M.; investigation, A.M.; resources, A.M., I.K.K. and A.V.B.; data curation, A.M.; writing—original draft preparation, I.K.K. and A.M.; writing—review and editing, I.K.K., C.P. and S.B.; visualization, I.K.K., V.K.K., A.M.; supervision A.M. All authors have read and agreed to the published version of the manuscript.
Funding
This research received no external funding.
Acknowledgments
The authors are grateful to the following wineries/estates: Zoinos Winery Zitsa, Ioannina; Papagiannakos Domaine, Markopoulo, Athens; I. Papadopoulos-I.Kalaitzidis Co., Drama; Theopetra Estate, Meteora, Tsililis K. S.A; Ktima Biblia Chora, Paggaio, Kavala; Ktima Gerovassiliou, Epanomi, Macedonia; Merkouri Estate, Korakochori, Ileia, Peloponnese; UWC SAMOS, Malagari, Samos Island; Diamantakis Winery, Heraklion, Crete; SEMÉLI ESTATE, Nemea, Korinthos; VAENI Naoussa-Agricultural Viticultural Winemaking Co. of Naoussa, for the supply of the wine samples. The technical assistance of Dionysia Sykalia during the collection of wine samples is greatly acknowledged.
Conflicts of Interest
The authors declare no conflict of interest.
References
- Son, H.S.; Kim, K.M.; Frans, V.D.B.; Hwang, G.S.; Park, W.M.; Lee, C.H. 1H NMR nuclear magnetic resonance-based metabolomic characterization of wines by grape varieties and production areas. J. Agric. Food Chem. 2008, 56, 8007–8016. [Google Scholar] [CrossRef] [PubMed]
- Karabagias, I.K.; Sykalia, D.; Mannu, A.; Badeka, A.V. Physico-chemical parameters complemented with aroma compounds fired up the varietal discrimination of wine using statistics. Eur. Food Res. Technol. 2020, 1–16. [Google Scholar] [CrossRef]
- Mandrile, L.; Zeppa, G.; Giovannozzi, A.M.; Rossi, A.M. Controlling protected designation of origin of wine by Raman spectroscopy. Food Chem. 2016, 211, 260–267. [Google Scholar] [CrossRef] [PubMed]
- Amargianitaki, M.; Spyros, A. NMR-based metabolomics in wine quality control and authentication. Chem. Biol. Technol. Agric. 2017, 4, 9. [Google Scholar] [CrossRef]
- Hu, B.; Cao, Y.; Zhu, J.; Xu, W.; Wu, W. Analysis of metabolites in chardonnay dry white wine with various inactive yeasts by 1H NMR spectroscopy combined with pattern recognition analysis. AMB Express 2019, 9, 140. [Google Scholar] [CrossRef] [PubMed]
- Mannu, A.; Karabagias, I.K.; Di Pietro, M.E.; Baldino, S.; Karabagias, V.K.; Badeka, A.V. 13C NMR-Based Chemical Fingerprint for the Varietal and Geographical Discrimination of Wines. Foods 2020, 9, 1040. [Google Scholar] [CrossRef] [PubMed]
- Bagno, A.; Rastrelli, F.; Saielli, G. Prediction of the 1H and 13C NMR Spectra of r-D-Glucose in Water by DFT Methods and MD Simulations. J. Org. Chem. 2007, 72, 7373–7381. [Google Scholar] [CrossRef] [PubMed]
- TopSpinsoftware from Bruker. Available online: https://www.bruker.com/service/support-upgrades/software-downloads/nmr.html (accessed on 6 August 2020).
© 2020 by the authors. Licensee MDPI, Basel, Switzerland. This article is an open access article distributed under the terms and conditions of the Creative Commons Attribution (CC BY) license (http://creativecommons.org/licenses/by/4.0/).