Data Descriptor

An Update to the TraVA Database: Time Series of Capsella bursa-pastoris Shoot Apical Meristems during Transition to Flowering

by
Anna V. Klepikova
1,* and
Artem S. Kasianov
1,2
1
Institute for Information Transmission Problems of the Russian Academy of Sciences, 127051 Moscow, Russia
2
N.I. Vavilov Institute of General Genetics, Russian Academy of Sciences, 119991 Moscow, Russia
*
Author to whom correspondence should be addressed.
Submission received: 14 May 2020 / Revised: 26 June 2020 / Accepted: 28 June 2020 / Published: 30 June 2020

Abstract

:
Transition to flowering is a crucial part of plant life directly affecting the fitness of a plant. Time series of transcriptomes is a useful tool for the investigation of process dynamics and can be used for the identification of novel genes and gene networks involved in the process. We present a detailed time series of polyploid Capsella bursa-pastoris shoot apical meristems created with RNA-seq. The time series covers transition to flowering and can be used for thorough analysis of the process. To make the data easy to access, we uploaded them in our database Transcriptome Variation Analysis (TraVA), which provides a convenient depiction of the gene expression profiles, the differential expression analysis between the homeologs and quick data extraction.
Dataset License: CC-BY

1. Summary

The ability to produce flowers and seed-covering fruits is a major achievement of Angiosperms, which gave rise to the enormous diversity and wide distribution of this taxon. A critical stage in the life of Angiosperm plants is the transition to flowering. The precise determination of flowering time ensures the reproductive success of a plant, relies on various environmental and endogenous stimuli and, thus, is subjected to natural selection, as was shown for various annual (Arabidopsis thaliana, rice, Brassica rapa [1,2]) and perennial (Boechera stricta, orchid Myrmecophila christinae [3,4]) plants. The main regulators of floral transition are thoroughly described in the model plant A. thaliana (reviewed in [5]), and the orthologs of the A. thaliana regulatory genes are often the targets of selection in other species [6].
Transcriptomic time series were shown to be a suitable tool for the analysis of process dynamics [7]. Transition to flowering was analyzed with time series in several papers on A. thaliana [8,9], which allowed the identification of cellular processes and participants beyond the known regulators of the reproductive switch.
Capsella bursa-pastoris is a recent allopolyploid plant and a close relative of A. thaliana. Since its emergence 100,000–300,000 years ago [10], C. bursa-pastoris has spread all across the world; such a wide habitat area leads to different, environmentally dependent flowering strategies, as has been explored in population studies [11,12]. In our previous study of the different C. bursa-pastoris organs, we noted that duplicated floral transition regulators may be undergoing a divergence of function [13]. In the current study, we created a transcriptomic time series dataset of C. bursa-pastoris shoot apical meristems (SAMs), as the SAM is the plant structure where the main processes of floral transition occur. The dataset is available for easy access to gene expression profiles in our database Transcriptome Variance Analysis (TraVA, travadb.org), and the raw data in a public repository as well.

2. Data Description

2.1. Time Series of Capsella Shoot Apical Meristems

We have constructed an RNA-seq-based time series of C. bursa-pastoris shoot apical meristems under long-day (16 h light/8 h dark) conditions. The close relationship between C. bursa-pastoris and the model object A. thaliana provides ample opportunities for interspecies comparisons in an evolutionary context. We aimed to make the Capsella time series comparable with a time series of A. thaliana SAMs [9], so we reproduced the plant growing conditions (day length, light quality, temperature, humidity) and sample harvesting techniques, including hand dissection of the SAM and tissue fixation. As a result, we obtained nine samples of C. bursa-pastoris SAMs collected from 11 to 16 days after germination (DAG). A brief description of the samples is given in Table 1. Two biological replicates consisting of 15 plants each were harvested for every sample. At the early stages of the time series, the plant SAM exclusively formed rosette leaves and at the latest stage the SAM produced floral primordia; our dataset covers the transition to flowering and can be used for the analysis of the process.
RNA extracted from the SAM samples was sequenced on an Illumina platform. At least 9.3 M uniquely mapped on the genes reads were generated for each sample (Table 1). To show that the time series is suitable to use in floral transition studies, we analyzed the expression profiles of the Capsella orthologs of several A. thaliana regulators of flowering—genes LEAFY (LFY), SUPPRESSOR OF OVEREXPRESSION OF CO 1 (SOC1) and APETALA 1 (AP1) (Figure 1). As expected, expression of SOC1 and LFY increased at the early stages of floral transition [14,15]. Beginning with stage M6, expression of both the AP1 homeologs was elevated, as in the A. thaliana SAM time series [9].

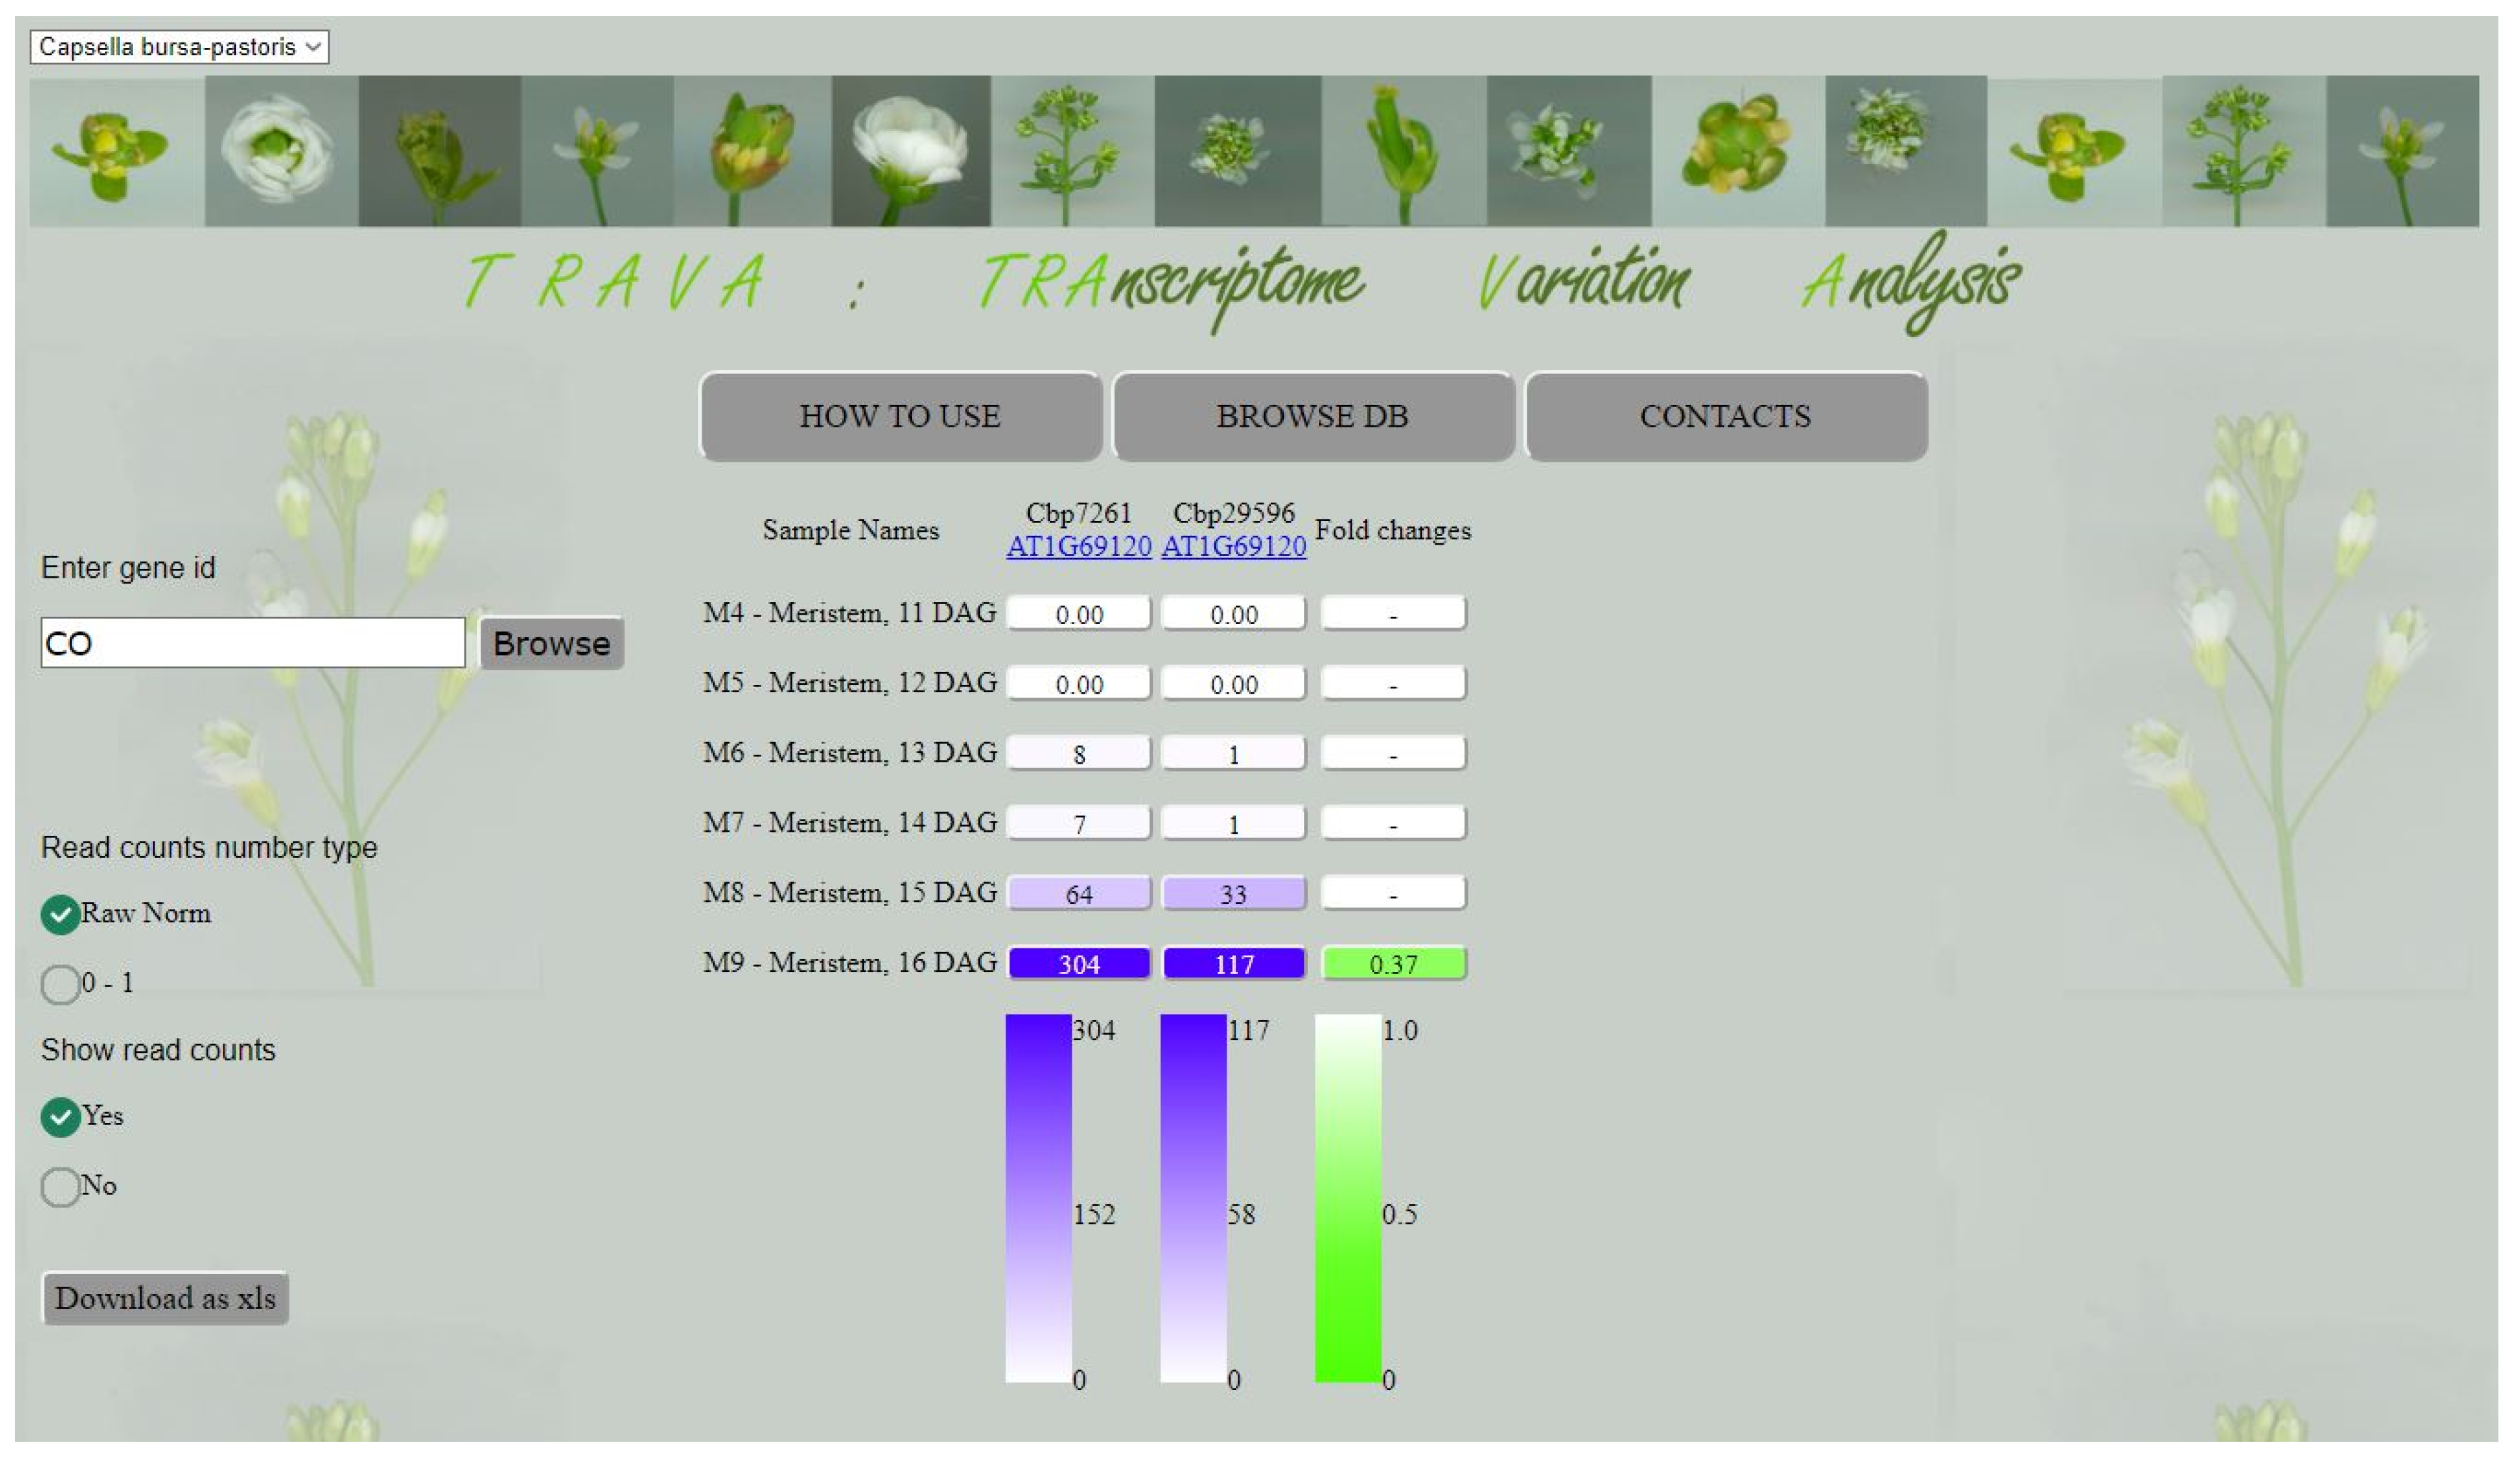
2.2. An Update of Transcriptome Variance Analysis Database

The transcriptomic database TraVA (travadb.org) was created for gene expression profile display, differential expression analysis and intergenic transcription comparison. Detailed transcriptome maps of such plants as A. thaliana, tomato or C. bursa-pastoris form the main body of the database [9,13,16]. We consistently aim to increase the diversity of the datasets and analysis types in TraVA; in the current update, we added a time series of C. bursa-pastoris SAMs.
A substantial part of the Capsella genes has orthologs in the A. thaliana genome, which facilitate the search for a gene of interest. Our search engine supports the C. bursa-pastoris gene identifier as well as A. thaliana gene id and gene names (Figure 2). As C. bursa-pastoris is a tetraploid plant, the majority of its genes form homeologous pairs with one gene coming from the C. rubella parental species (Subgenome A of C. bursa-pastoris) and the second homeolog from C. orientalis (Subgenome B) [10]. The expression profile of the searched gene is pictured along with its homeolog (Figure 1).
Our database provides several modes of transcription profile representation: absolute read counts normalized on library size (as in the “DESeq” package [18], Raw Norm mode on Figure 1) and the relative normalized read counts (divided by the maximum expression value for a given gene (0–1 mode); in both cases the read count values can be shown or hidden. The color chart ensures a clear picture of gene expression.
One of the main purposes of the TraVA database is an easily available differential expression analysis. In the Capsella SAM time series dataset, as well as in our previously published C. bursa-pastoris transcriptome map, we focused on the comparison of the expression level of the homeologous genes. We used the “DESeq2” package [19] to compare the expression of Homeolog B with Homeolog A in each sample. The fold changes of the significantly differentially expressed genes are indicated in the third column (Figure 1).
Gene expression profiles and the results of the differential expression analysis can be downloaded in the .xls format.

2.3. The Area of Dataset Application

A detailed time series of C. bursa-pastoris SAMs is a powerful source for the analyses of transition to flowering. Its representation in the TraVA database allows easy and quick access to gene expression profiles. Together with the possibility to search for the Capsella orthologs of the A. thaliana genes, it facilitates the analysis of possible floral regulators and their involvement in the different stages of the transition process.

3. Methods

3.1. Plant Growth and Sample Collection

Seeds of C. bursa-pastoris were planted on a mix of 1/2 vermiculite:1/2 soil and kept at 4 °C for 7 days. Then they were transferred to a climatic chamber (Pol-eko Aparatura, Poland) with preset long day (16 h light/8 h dark cycle) conditions, at 22 °C and with 50% relative humidity. Four Philips Master TL5 HO 54W/840 lamps at each of the two shelves were used as the light source. Shoot apical meristems (SAM) were collected from 8 till 16 days after germination (DAG) at 10–11 h after turning on the light. Each sample was harvested in two biological replicates containing 15 plants. Hand-dissected material was fixed in RNAlater (Qiagen, Venlo, The Netherlands).

3.2. RNA Extraction and Sequencing

Total RNA was extracted using the RNeasy Mini Kit (Qiagen, Venlo, the Netherlands) following the manufacturer’s protocol and immediately used for Illumina cDNA library construction to avoid degradation. TruSeq RNA Sample Prep Kits v2 (Illumina, San Diego, CA, USA) was used for polyA mRNA collection in 0.4 of the recommended volume and all the subsequent stages were performed with the NEBNext Ultra II RNA Library Prep Kit for Illumina (New England BioLabs, Ipswich, MA, USA) following the manufacturer’s protocol in 0.5 of the recommended volume. cDNA libraries were sequenced on the NextSeq500 (Illumina, San Diego, CA, USA) in a single mode with an 84 bp read length.

3.3. Data Processing

Reads were trimmed using the CLC Genomics Workbench 9.5.4 with the parameters “quality scores—0.005; trim ambiguous nucleotides—2; remove 5′ terminal nucleotides—1; remove 3′ terminal nucleotides—1; discard reads below length 25”. Read mapping on the genome-based custom reference transcriptome was performed as described in [13] with the CLC Genomics Workbench 9.5.4 and the parameters “only unique mapping allowed, % of length aligned = 100, % of mismatches = 1”. The total number of uniquely mapped reads was used as a measure of gene expression level. Differentially expressed homeologous pairs in a given sample were identified by comparison of the expression level of Homeolog B in the sample with the expression level of the corresponding Homeolog A in the same sample. Differential expression was calculated with the R package “DESeq2” [19], and a fold change > 2 and false discovery rate (FDR) < 0.05 were used as the thresholds.

3.4. Data Availability

RNA-seq data were deposited in the NCBI database under BioProject No PRJNA632857.

Author Contributions

Conceptualization, A.V.K.; methodology, A.V.K.; software, A.S.K.; data curation, A.V.K. and A.S.K.; writing—original draft preparation, A.V.K.; writing—review and editing, A.V.K. and A.S.K.; visualization, A.S.K.; funding acquisition, A.V.K. All authors have read and agreed to the published version of the manuscript.

Funding

The TraVA database was updated with support via a budgetary subsidy to IITP RAS (The Laboratory of Plant Genomics, Russian Academy of Sciences: 0053-2019-0005). The creation of the C. bursa-pastoris time series dataset was funded by the RFBR according to the research project № 18-34-00682.

Acknowledgments

The authors are grateful to Aleksey A. Penin and Maria D. Logacheva for useful comments on the manuscript.

Conflicts of Interest

The authors declare no conflict of interest.

References

  1. Izawa, T. Adaptation of flowering-time by natural and artificial selection in Arabidopsis and rice. J. Exp. Bot. 2007, 58, 3091–3097. [Google Scholar] [CrossRef] [PubMed] [Green Version]
  2. Franks, S.J.; Sim, S.; Weis, A.E. Rapid evolution of flowering time by an annual plant in response to a climate fluctuation. Proc. Natl. Acad. Sci. USA 2007, 104, 1278–1282. [Google Scholar] [CrossRef] [PubMed] [Green Version]
  3. Parra-Tabla, V.; Vargas, C.F. Phenology and Phenotypic Natural Selection on the Flowering Time of a Deceit-pollinated Tropical Orchid, Myrmecophila christinae. Ann. Bot. 2004, 94, 243–250. [Google Scholar] [CrossRef] [PubMed] [Green Version]
  4. Anderson, J.T.; Lee, C.-R.; Mitchell-Olds, T. Life-history QTLs and natural selection on flowering time in boechera stricta, a perennial relative of arabidopsis: Flowering time in Boechera stricta. Evolution 2011, 65, 771–787. [Google Scholar] [CrossRef] [PubMed] [Green Version]
  5. Conti, L. Hormonal control of the floral transition: Can one catch them all? Dev. Biol. 2017, 430, 288–301. [Google Scholar] [CrossRef] [PubMed]
  6. Gaudinier, A.; Blackman, B.K. Evolutionary processes from the perspective of flowering time diversity. New Phytol. 2020, 225, 1883–1898. [Google Scholar] [CrossRef] [PubMed] [Green Version]
  7. Bar-Joseph, Z.; Gitter, A.; Simon, I. Studying and modelling dynamic biological processes using time-series gene expression data. Nat. Rev. Genet. 2012, 13, 552–564. [Google Scholar] [CrossRef] [PubMed]
  8. Torti, S.; Fornara, F.; Vincent, C.; Andrés, F.; Nordström, K.; Göbel, U.; Knoll, D.; Schoof, H.; Coupland, G. Analysis of the Arabidopsis shoot meristem transcriptome during floral transition identifies distinct regulatory patterns and a leucine-rich repeat protein that promotes flowering. Plant Cell 2012, 24, 444–462. [Google Scholar] [CrossRef] [PubMed] [Green Version]
  9. Klepikova, A.V.; Logacheva, M.D.; Dmitriev, S.E.; Penin, A.A. RNA-seq analysis of an apical meristem time series reveals a critical point in Arabidopsis thaliana flower initiation. BMC Genom. 2015, 16. [Google Scholar] [CrossRef] [PubMed] [Green Version]
  10. Douglas, G.M.; Gos, G.; Steige, K.A.; Salcedo, A.; Holm, K.; Josephs, E.B.; Arunkumar, R.; Ågren, J.A.; Hazzouri, K.M.; Wang, W.; et al. Hybrid origins and the earliest stages of diploidization in the highly successful recent polyploid Capsella bursa-pastoris. Proc. Natl. Acad. Sci. USA 2015, 112, 2806–2811. [Google Scholar] [CrossRef] [PubMed] [Green Version]
  11. Huang, H.-R.; Yan, P.-C.; Lascoux, M.; Ge, X.-J. Flowering time and transcriptome variation in Capsella bursa-pastoris (Brassicaceae). New Phytol. 2012, 194, 676–689. [Google Scholar] [CrossRef] [PubMed]
  12. Toorop, P.E.; Campos Cuerva, R.; Begg, G.S.; Locardi, B.; Squire, G.R.; Iannetta, P.P.M. Co-adaptation of seed dormancy and flowering time in the arable weed Capsella bursa-pastoris (shepherd’s purse). Ann. Bot. 2012, 109, 481–489. [Google Scholar] [CrossRef] [Green Version]
  13. Kasianov, A.S.; Klepikova, A.V.; Kulakovskiy, I.V.; Gerasimov, E.S.; Fedotova, A.V.; Besedina, E.G.; Kondrashov, A.S.; Logacheva, M.D.; Penin, A.A. High-quality genome assembly of Capsella bursa-pastoris reveals asymmetry of regulatory elements at early stages of Polyploid genome evolution. Plant J. 2017, 91, 278–291. [Google Scholar] [CrossRef] [PubMed] [Green Version]
  14. Borner, R.; Kampmann, G.; Chandler, J.; Gleissner, R.; Wisman, E.; Apel, K.; Melzer, S. A MADS domain gene involved in the transition to flowering in Arabidopsis. Plant J. 2000, 24, 591–599. [Google Scholar] [CrossRef] [PubMed]
  15. Lee, J.; Oh, M.; Park, H.; Lee, I. SOC1 translocated to the nucleus by interaction with AGL24 directly regulates leafy. Plant J. 2008, 55, 832–843. [Google Scholar] [CrossRef] [PubMed]
  16. Penin, A.A.; Klepikova, A.V.; Kasianov, A.S.; Gerasimov, E.S.; Logacheva, M.D. Comparative Analysis of Developmental Transcriptome Maps of Arabidopsis thaliana and Solanum lycopersicum. Genes 2019, 10, 50. [Google Scholar] [CrossRef] [PubMed] [Green Version]
  17. Song, Y.H.; Kubota, A.; Kwon, M.S.; Covington, M.F.; Lee, N.; Taagen, E.R.; Laboy Cintrón, D.; Hwang, D.Y.; Akiyama, R.; Hodge, S.K.; et al. Molecular basis of flowering under natural long-day conditions in Arabidopsis. Nat. Plants 2018, 4, 824–835. [Google Scholar] [CrossRef] [PubMed]
  18. Anders, S.; Huber, W. Differential expression analysis for sequence count data. Genome Biol. 2010, 11, R106. [Google Scholar] [CrossRef] [PubMed] [Green Version]
  19. Love, M.I.; Huber, W.; Anders, S. Moderated estimation of fold change and dispersion for RNA-seq data with DESeq2. Genome Biol. 2014, 15, 550. [Google Scholar] [CrossRef] [PubMed] [Green Version]
Figure 1. Expression profiles of the C. bursa-pastoris orthologs of the A. thaliana regulators of transition to flowering. Homeologs from Subgenome A (see below) are marked as “X_A” in the legend, and homeologs from Subgenome B as “X_B”. Expression values are given as the total number that was uniquely mapped on the gene reads, normalized on library size and averaged over two biological replicates. Error bars represent the standard deviation.
Data 05 00058 g001
Figure 2. The interface of database TraVA. Arabidopsis gene name CO (CONSTANS, major activator of flowering under long day conditions [17]) was used as the query, and its Capsella orthologs Cbp7261 and Cbp29596 are shown on the figure. The SAM samples are displayed in rows, the homeolog from Subgenome A is depicted in the second column (Cbp7261 in this example), and Homeolog B in the third column (Cbp29596). The fourth column represents the fold change if the homeologs are differentially expressed in the sample.
Data 05 00058 g002
Table 1. Time series samples description.
Sample IDDAGRosette Diameter, mm (Avg ± SD, 10 Plants)Exact Number of Leaf/Floral PrimordiaNumber of Uniquely Mapped on Homeologs Reads (rep1/rep2)r2 for Biological Replicates
M41139.9 ± 1.415/011,280,688/12,029,7450.96
M51244.8 ± 1.219/011,842,692/13,430,9040.90
M61359.6 ± 2.320/013,055,110/15,358,7430.93
M71478.0 ± 2.320/016,918,804/14,085,9460.97
M81594.7 ± 2.524/09,323,196/10,942,3280.97
M91695.3 ± 2.224/59,851,007/10,426,4460.97

