A Database for the Radio Frequency Fingerprinting of Bluetooth Devices


Abstract
1. Introduction
2. Data Acquisition and Processing
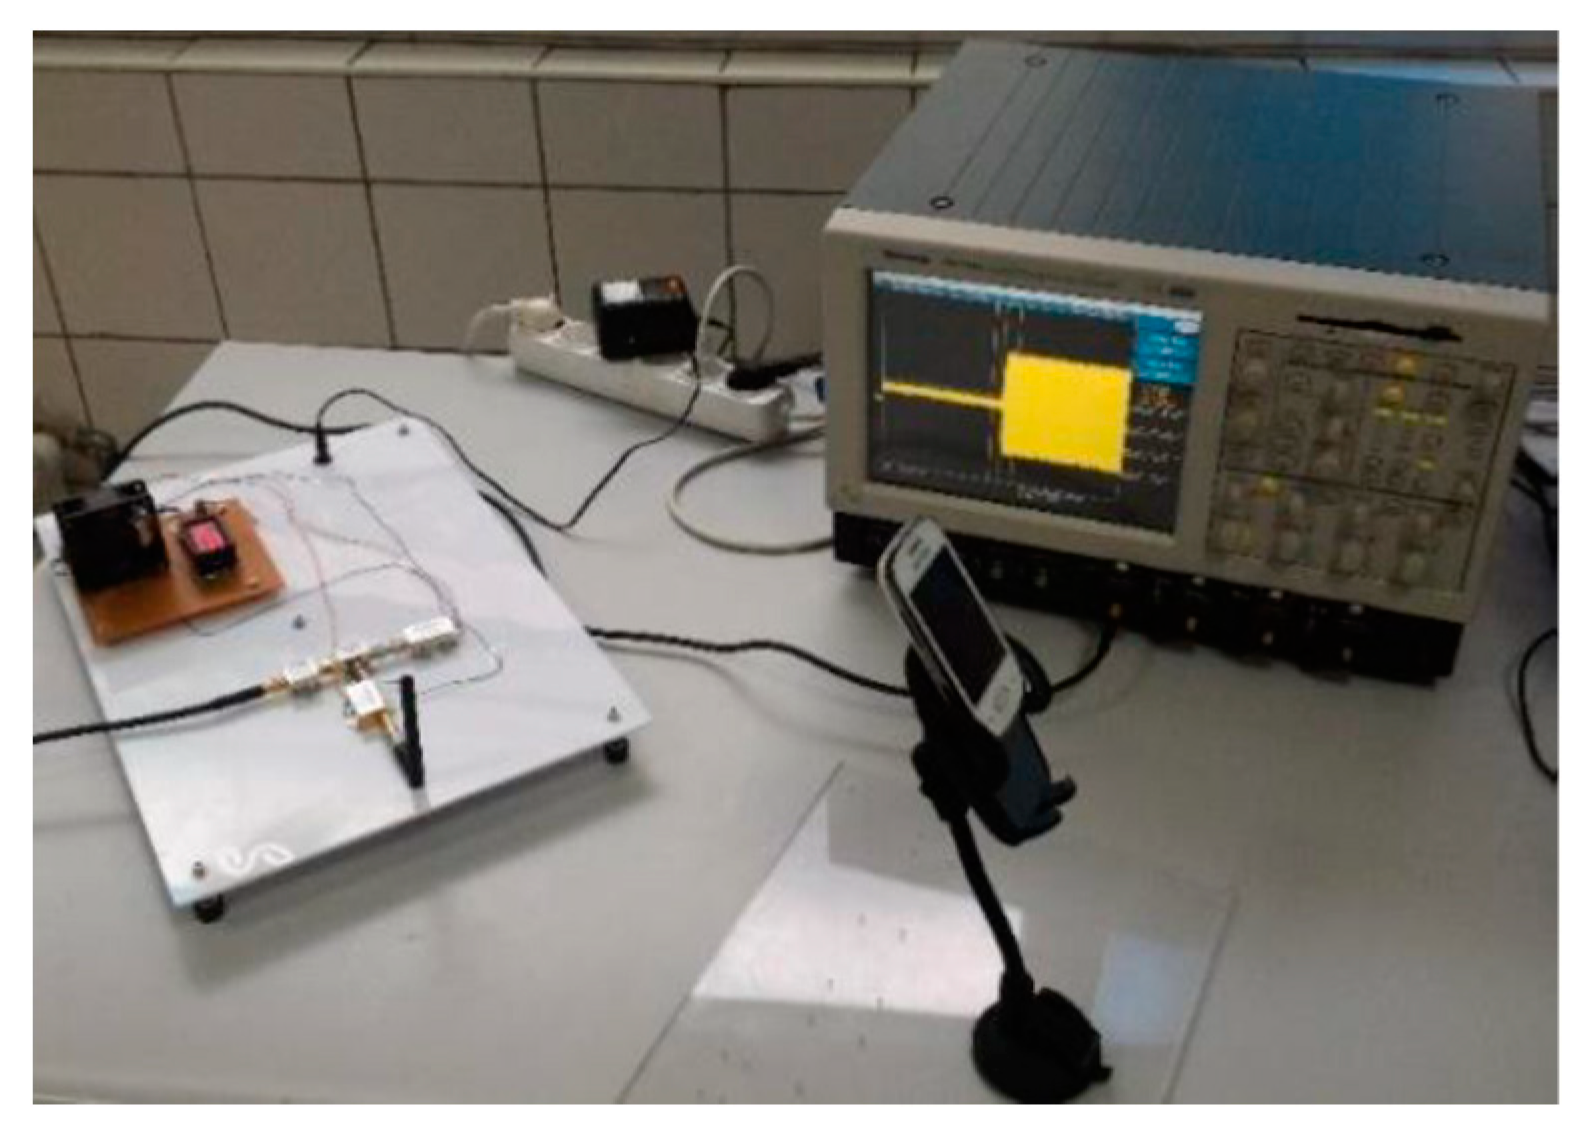
2.1. Data Acquisition System
2.1.1. Direct Sampling
2.1.2. Sampling with RF Front End
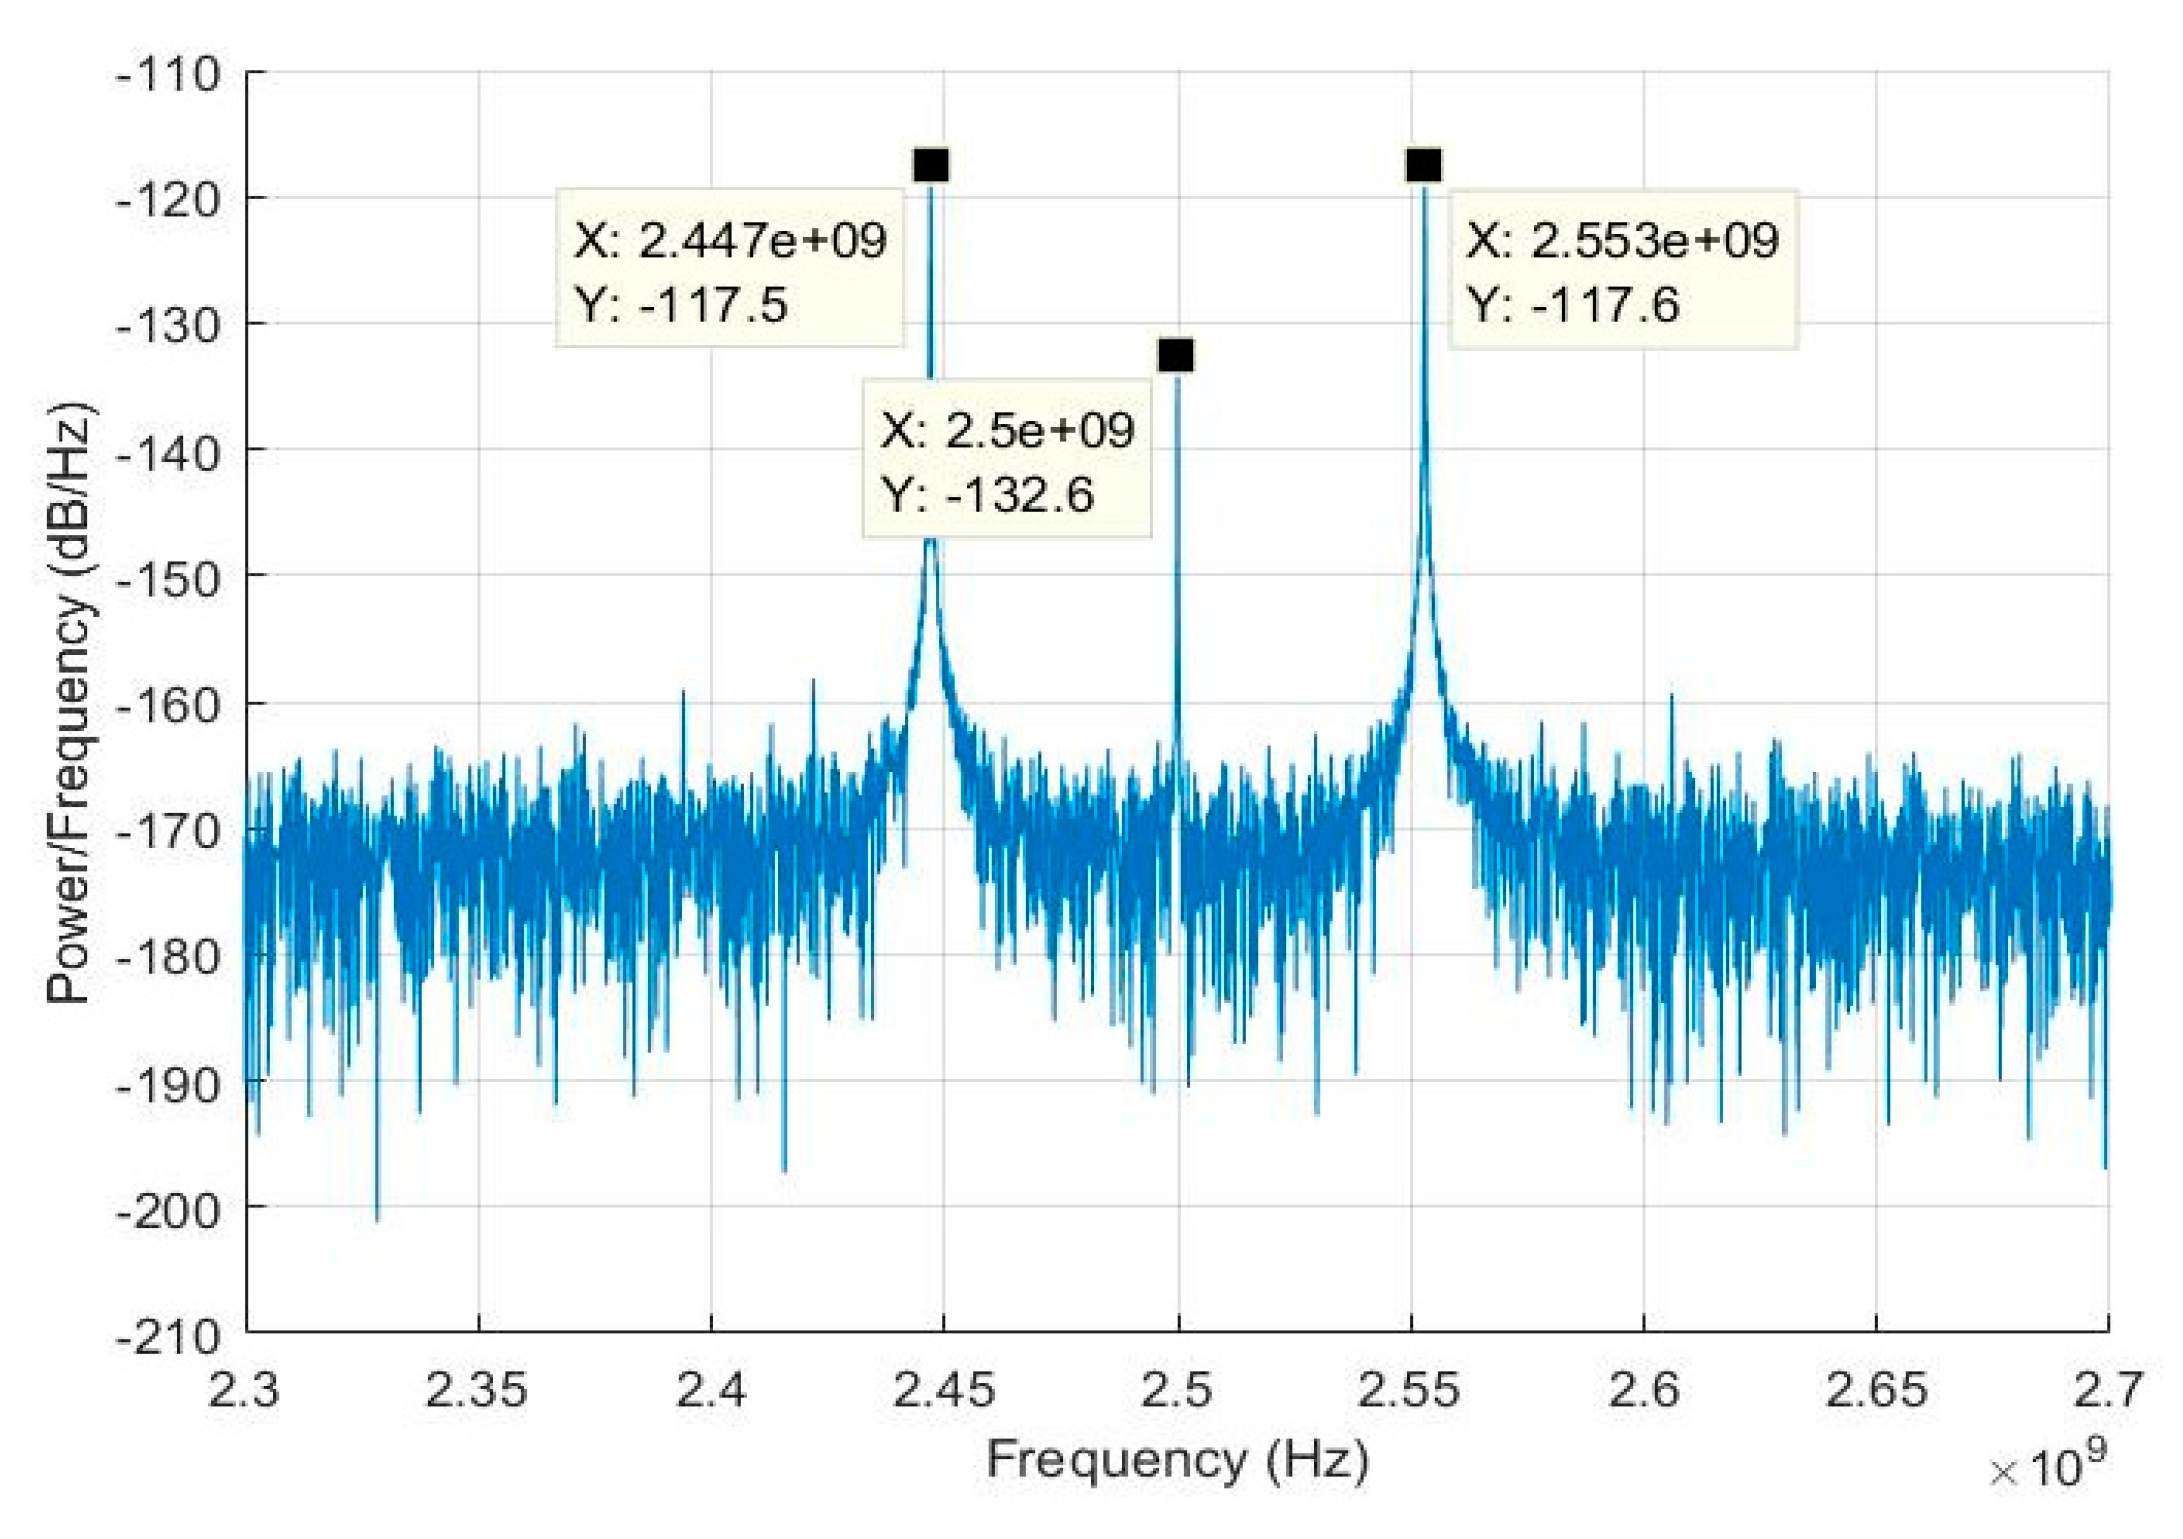
2.2. BT Signal Capturing
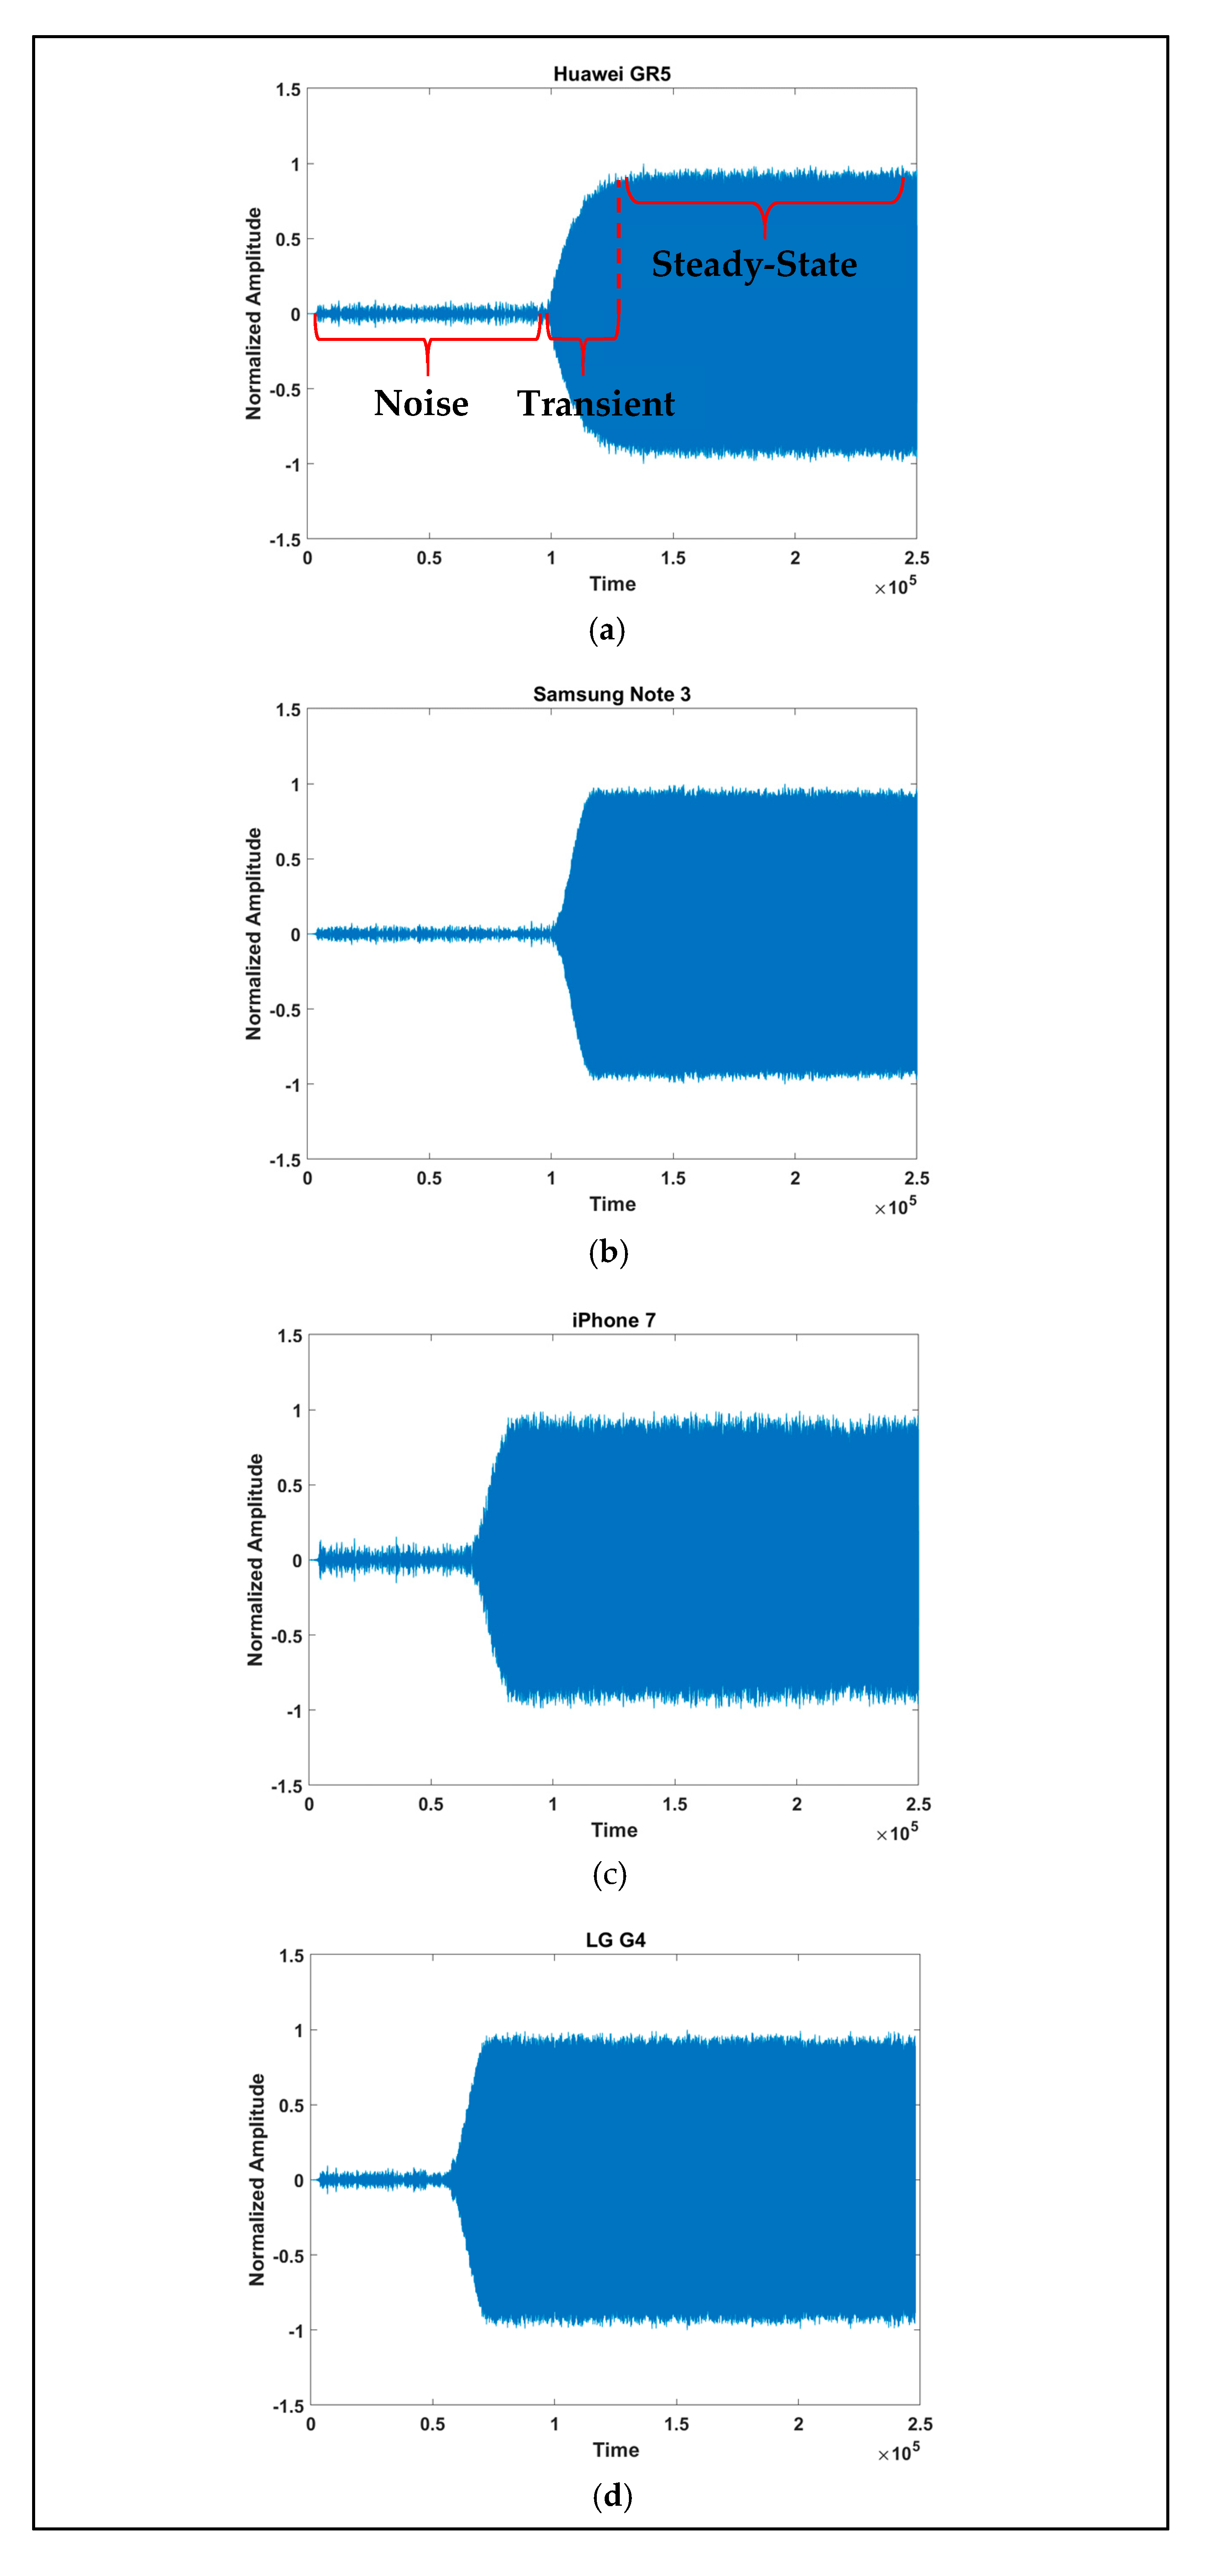
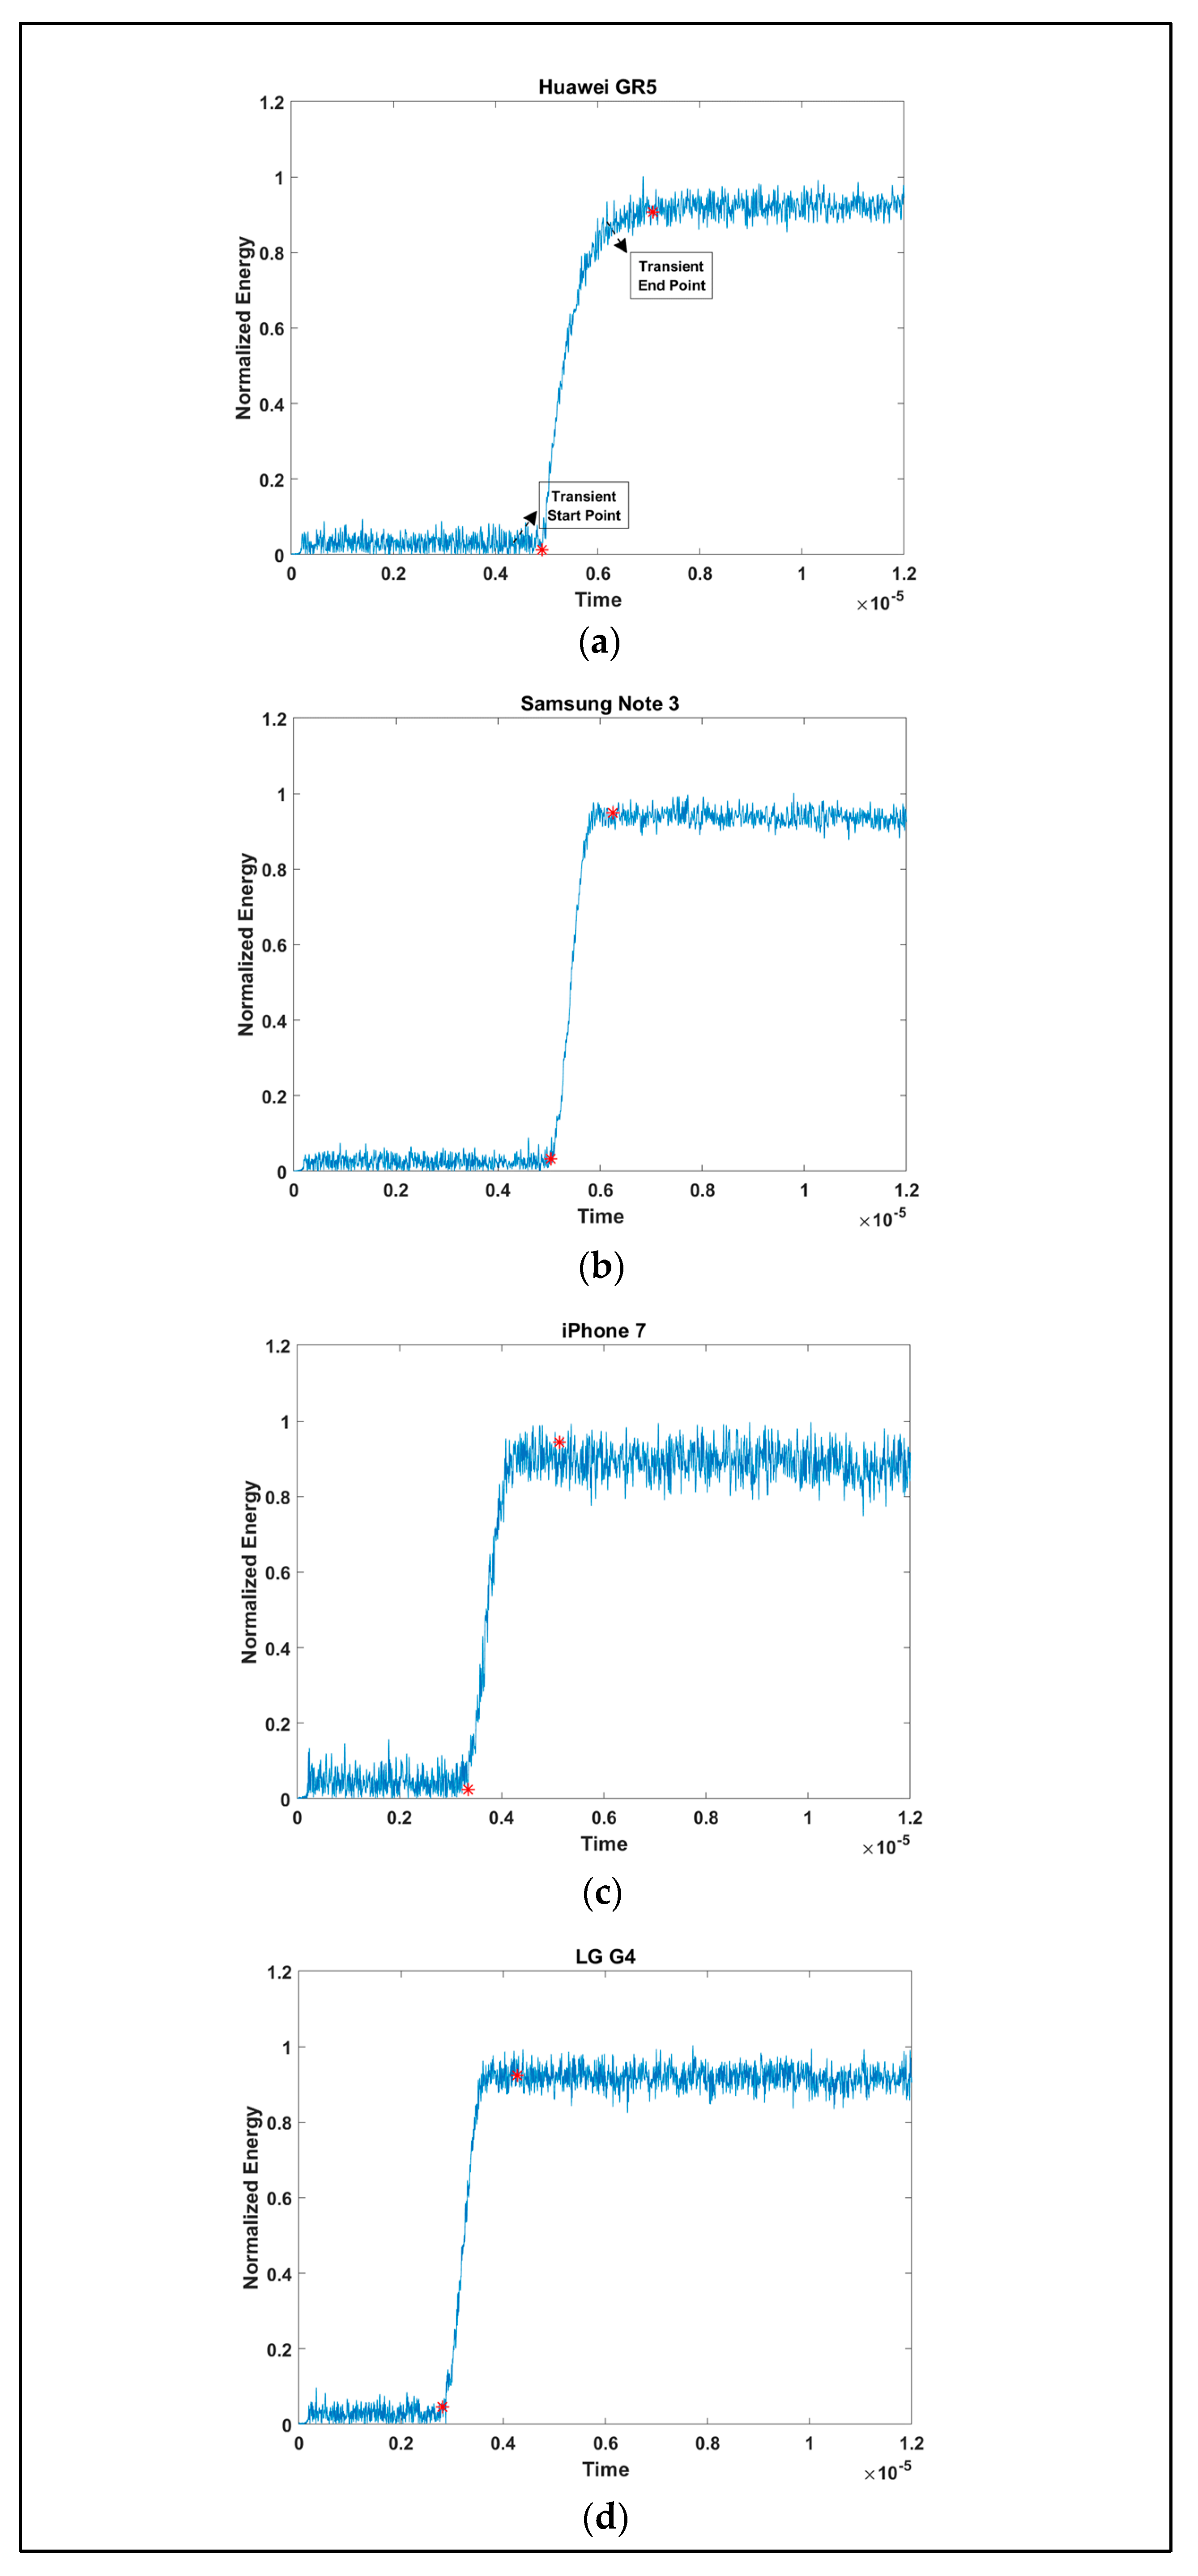
2.3. Preprocessing
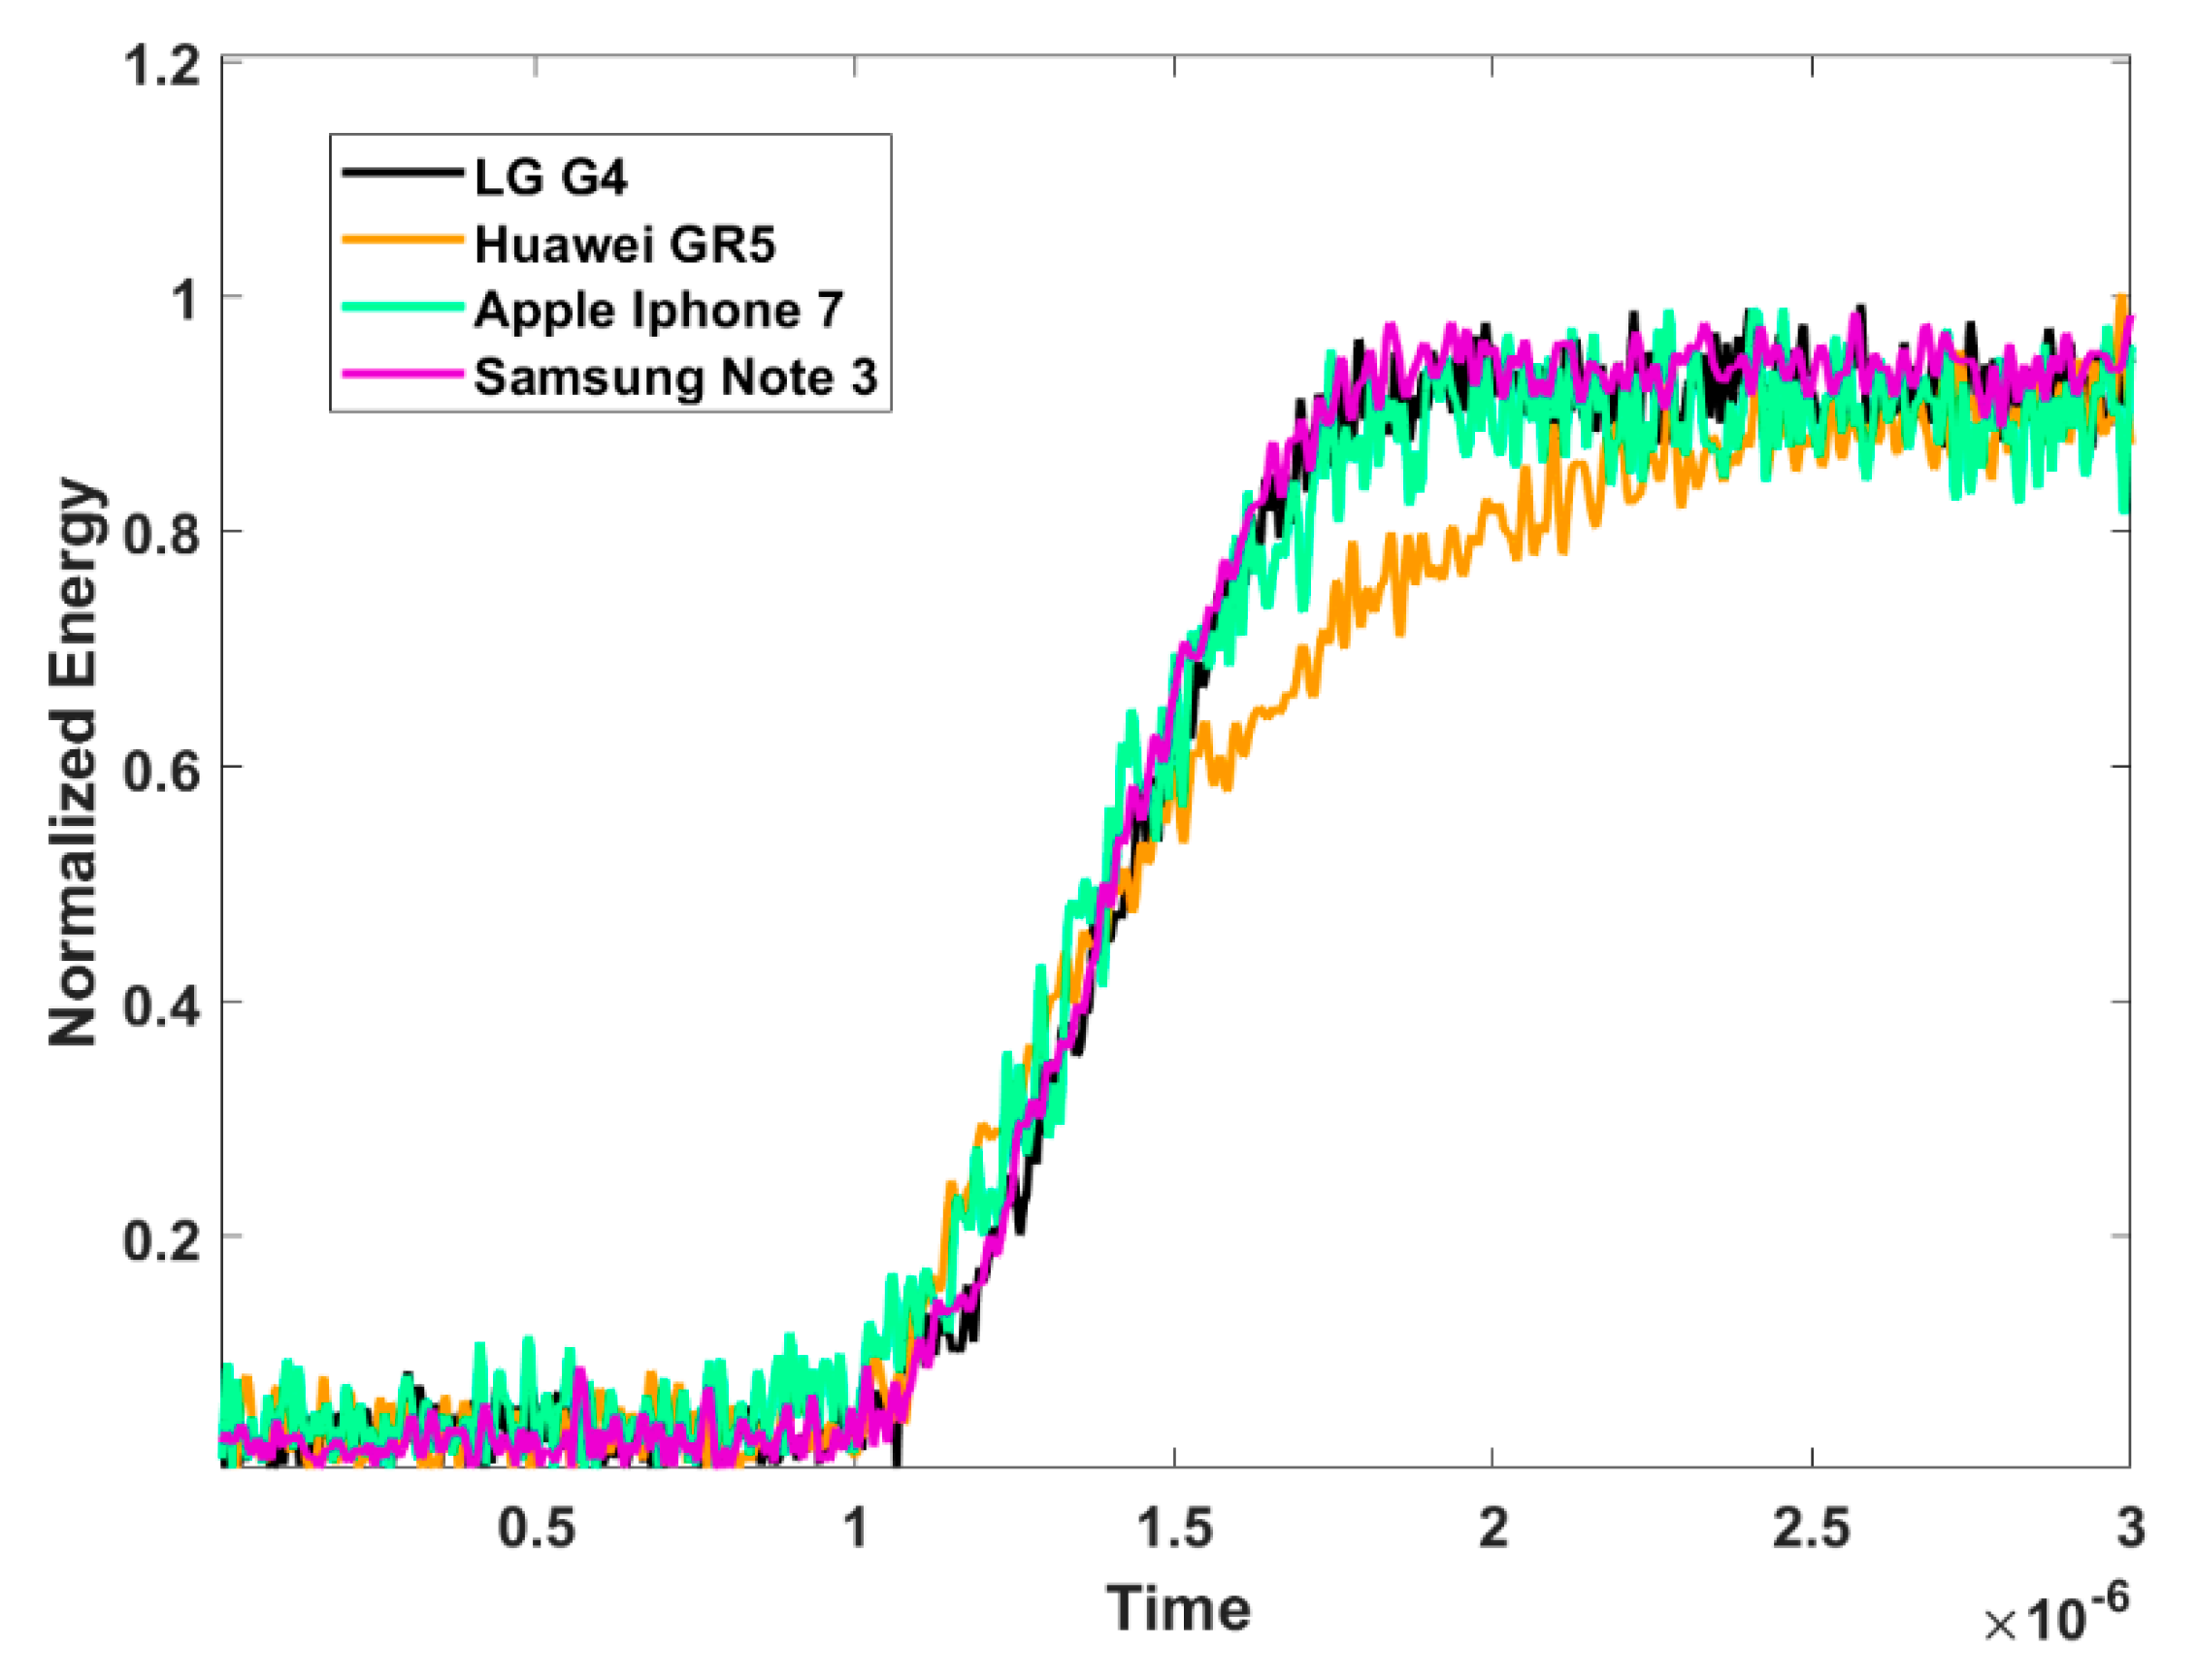
3. Data Usage Example
3.1. Device Identification Using Instantaneous Signal Characteristics
3.2. Device Identification Using Time Frequency Energy Distribution (TFED) Features
3.3. Discussion
4. Conclusions
Author Contributions
Funding
Conflicts of Interest
References
- Bolle, R.M.; Connell, J.H.; Pankanti, S.; Ratha, N.K.; Senior, A.W. Guide to Biometrics; Springer Science & Business Media: Berlin, Germany, 2013. [Google Scholar]
- Danev, B.; Luecken, H.; Capkun, S.; El Defrawy, K. Attacks on physical-layer identification. In Proceedings of the 3rd ACM Conference on Wireless Network Security, Hoboken, NJ, USA, 22–24 March 2010; pp. 89–98. [Google Scholar]
- Talbot, C.M.; Temple, M.A.; Carbino, T.J.; Betances, J.A. Detecting rogue attacks on commercial wireless Insteon home automation systems. Comput. Secur. 2017, 74, 296–307. [Google Scholar] [CrossRef]
- Merchant, K.; Revay, S.; Stantchev, G.; Nousain, B. Deep learning for RF device fingerprinting in cognitive communication networks. IEEE J. Sel. Top. Signal Process. 2018, 12, 160–167. [Google Scholar] [CrossRef]
- Ramsey, B.W.; Stubbs, T.D.; Mullins, B.E.; Temple, M.A.; Buckner, M.A. Wireless infrastructure protection using low-cost radio frequency fingerprinting receivers. Int. J. Crit. Infrastruct. Prot. 2015, 8, 27–39. [Google Scholar] [CrossRef]
- Rehman, S.U.; Sowerby, K.W.; Coghill, C. Radio-frequency fingerprinting for mitigating primary user emulation attack in low-end cognitive radios. IET Commun. 2014, 8, 1274–1284. [Google Scholar] [CrossRef]
- Reising, D.R.; Temple, M.A.; Jackson, J.A. Authorized and rogue device discrimination using dimensionally reduced RF-DNA fingerprints. IEEE Trans. Inf. Forensics Secur. 2015, 10, 1180–1192. [Google Scholar] [CrossRef]
- Rehman, S.U.; Sowerby, K.; Coghill, C. Analysis of receiver front end on the performance of rf fingerprinting. In Proceedings of the 2012 IEEE 23rd International Symposium on Personal, Indoor and Mobile Radio Communications-(PIMRC), Sydney, NSW, Australia, 9–12 September 2012; pp. 2494–2499. [Google Scholar]
- Uzundurukan, E.; Ali, A.M.; Dalveren, Y.; Kara, A. Performance analysis of modular RF front end for RF fingerprinting of bluetooth devices. Wirel. Pers. Commun. 2020, 112, 2519–2531. [Google Scholar] [CrossRef]
- Ali, A.M.; Uzundurukan, E.; Kara, A. Assessment of features and classifiers for Bluetooth RF fingerprinting. IEEE Access 2019, 7, 50524–50535. [Google Scholar] [CrossRef]
- Aghnaiya, A.; Ali, A.M.; Kara, A. Variational mode decomposition-based radio frequency fingerprinting of bluetooth devices. IEEE Access 2019, 7, 144054–144058. [Google Scholar] [CrossRef]
- Aghnaiya, A.; Dalveren, Y.; Kara, A. On the performance of variational mode decomposition-based radio frequency fingerprinting of bluetooth devices. Sensors 2020, 20, 1704. [Google Scholar] [CrossRef] [PubMed]
- Klein, R.W.; Temple, M.A.; Mendenhall, M.J. Application of wavelet-based RF fingerprinting to enhance wireless network security. J. Commun. Netw. 2009, 11, 544–555. [Google Scholar] [CrossRef]
- Yuan, Y.; Huang, Z.; Wu, H.; Wang, X. Specific emitter identification based on Hilbert–Huang transform-based time–frequency–energy distribution features. IET Commun. 2014, 8, 2404–2412. [Google Scholar] [CrossRef]
- Rehman, S.U.; Sowerby, K.; Coghill, C. RF fingerprint extraction from the energy envelope of an instantaneous transient signal. In Proceedings of the 2012 Australian Communications Theory Workshop (AusCTW), Wellington, New Zealand, 30 January–2 February 2012; pp. 90–95. [Google Scholar]
- Klein, R.W.; Temple, M.A.; Mendenhall, M.J. Application of wavelet denoising to improve OFDM-based signal detection and classification. Secur. Commun. Netw. 2010, 3, 71–82. [Google Scholar] [CrossRef]
- Ali, A.M.; Uzundurukan, E.; Kara, A. Improvements on transient signal detection for RF fingerprinting. In Proceedings of the 2017 25th Signal Processing and Communications Applications Conference (SIU), Antalya, Turkey, 15–18 May 2017; pp. 1–4. [Google Scholar]


| Dataset A (5 Gsps) | Dataset B (10 Gsps) | Dataset C (20 Gsps) | Dataset D (250 Msps) | ||||
|---|---|---|---|---|---|---|---|
| Brand | Model | Brand | Model | Brand | Model | Brand | Model |
| Apple | iPhone 5 | Apple | iPhone 4s | Apple | iPhone 5s | Apple | iPhone 4s |
| Apple | iPhone 5s | Apple | iPhone 7 | Apple | iPhone 6s | Apple | iPhone 5 |
| Apple | iPhone 6 | Apple | iPhone 7 Plus | Apple | iPhone 6s Plus | Apple | iPhone 5s |
| Apple | iPhone 6s | LG | V20 | Apple | iPhone 7 | Apple | iPhone 6 |
| LG | G4 | Samsung | J7 | Huawei | Gr5 | Apple | iPhone 6s |
| Samsung | Note 3 | Samsung | Note 2 | LG | G4 | Apple | iPhone 7 |
| Samsung | S5 | Samsung | S7 Edge | Samsung | Note 3 | Apple | iPhone 7 Plus |
| Sony | Xperia M5 | Xiaomi | Mi 6 | Samsung | S3 | LG | G4 |
| Samsung | S3 Duos | LG | V20 | ||||
| Samsung | S4 | Samsung | J7 | ||||
| Sony | C4 | Samsung | Note 2 | ||||
| Samsung | Note 3 | ||||||
| Samsung | S5 | ||||||
| Samsung | S7 Edge | ||||||
| Sony | Xperia M5 | ||||||
| Xiaomi | Mi6 | ||||||
| Dataset | Classifier | Training Accuracy | Test Accuracy |
|---|---|---|---|
| A | SVM | 100% | 99.2% |
| B | 99.7% | 97.9% | |
| C | 99.8% | 99.0% | |
| D | 99.6% | 96.9% | |
| A | NN | 100% | 99.6% |
| B | 100% | 97.3% | |
| C | 100% | 99.4% | |
| D | 100% | 96.5% |
| Feature Number | Feature Name |
|---|---|
| 1 | Duration of transient signal |
| 2 | Total energy of transient energy |
| 3 | Total energy of transient energy envelope |
| 4 | Variance of transient energy envelope |
| 5 | Standard deviation of instantaneous phase of transient signal |
| 6 | Entropy of instantaneous phase of transient signal |
| 7 | Length of transient energy distribution |
| 8 | Slope of transient energy distribution |
| 9 | Variance of summation of transient energy distribution |
| 10 | Maximum of summation of transient energy distribution |
| 11 | Third order polynomial fitting coefficient of summation of transient energy distribution |
| 12 | Maximum of summation of transient energy distribution |
| 13 | Variance of summation of transient energy distribution |
| Classifier | Smoothed Features Accuracy | Un-smoothed Features Accuracy |
|---|---|---|
| L-SVM | 99.8% | 97.2% |
| CDT | 99.6% | 97.6% |
| LDA | 99.7% | 91.3% |
© 2020 by the authors. Licensee MDPI, Basel, Switzerland. This article is an open access article distributed under the terms and conditions of the Creative Commons Attribution (CC BY) license (http://creativecommons.org/licenses/by/4.0/).
Share and Cite
Uzundurukan, E.; Dalveren, Y.; Kara, A. A Database for the Radio Frequency Fingerprinting of Bluetooth Devices. Data 2020, 5, 55. https://doi.org/10.3390/data5020055
Uzundurukan E, Dalveren Y, Kara A. A Database for the Radio Frequency Fingerprinting of Bluetooth Devices. Data. 2020; 5(2):55. https://doi.org/10.3390/data5020055
Chicago/Turabian StyleUzundurukan, Emre, Yaser Dalveren, and Ali Kara. 2020. "A Database for the Radio Frequency Fingerprinting of Bluetooth Devices" Data 5, no. 2: 55. https://doi.org/10.3390/data5020055
APA StyleUzundurukan, E., Dalveren, Y., & Kara, A. (2020). A Database for the Radio Frequency Fingerprinting of Bluetooth Devices. Data, 5(2), 55. https://doi.org/10.3390/data5020055