1. Introduction
Photovoltaic (PV) systems under solar lighting have a long history dating back to the 18th century [
1]. Long-term research has led to the maturity of this type of energy harvesting with different fields of application [
2]: from power production and heating [
3] to outer space energy supply [
4]. Due to growing enthusiasm for the Internet of Things and Industry 4.0 revolution [
5], a new application domain has been opened in recent years to supply embedded devices and cyber-physical systems [
6]. The addition of a small PV module to supply an ultra-low power device has shown promising results [
7]. This combination can be used to build energy neutral and battery-less systems for long lasting operation even in remote locations [
8].
Integration of PV in new applications shows both similarities and differences with the classic solar PV energy harvesting. In contrast to the quest for optimal operation as a shared goal for both types, embedded device applications aim for energy neutrality as a key aspect. This requires specific analysis of a PV module in the application environment. Although some embedded devices are being used outdoors under solar light, others are restricted to indoor conditions. Some examples such as in [
9] even take these conditions to an extreme by use of PV harvesting in environments with low light intensity such as a warehouse [
10,
11]. In these environments, artificial lighting is dominant while temperature is much more limited compared to the outdoor environment. Moreover, the small size of PV modules and low intensity artificial light leads to a much lower scale of harvested energy than the solar counterpart.
Different aspects of solar PV systems have been analyzed intensively, from electrochemical design [
12], parameter estimation [
13], and maximum power point tracking [
14] to light analysis [
15]. Even Standard Testing Condition (STC) AM1.5 is proposed as a part of the IEC60904-3 standard [
16], explaining a specific lighting situation to enable comparison of PV modules’ performances. In contrast, there are a limited number of works on the indoor performance and analysis of small scale PV modules [
2]. In addition to smaller physical size of indoor PV device than a typical solar module, light absorbed by them has a different spectrum [
17]. Moreover, the artificial lighting spectrum is extensively dependent on the type of light source, manufacturer, and physical structure of operational environments. This makes the definition of a unique standard measurement condition for indoor lighting measurement impossible. Hence, evaluation of developed methods and models cannot be simply guaranteed. Consequently, available analyses are limited to case-studies that are only reliable in their respected environments. Researchers prove and analyze their system in a very limited range of lighting because controlling their environmental conditions is hard, if not impossible. Not only are these experiments not reproducible, but also changes in the lighting are mostly not controlled and measured randomly.
Therefore, this work addresses this issue by providing not only multiple data-sets collected in a controlled environment, but also presents a setup for collection of this type of data. These data can be used for analysis of the indoor PV in different environmental conditions and also for the evolvement of methodologies from solar energy to adapt to the indoor conditions as well. Therefore, this paper is structured in a way that the physical structure of the measurement platform is explained first. Next, the developed measurement board including different sensors and their signaling is introduced. Afterwards, a procedure of measuring voltage–current curve of a PV module in low lighting is described. Finally, data collection and distribution of data in data-sets are discussed. In addition to this paper, data-sets can be accessed publicly from [
18].
2. Measurement Platform
To assure reliable, constant, and reproducible lighting, a structure is required separating measurement environment from the general lighting. A cabinet sized 1100 × 660 × 660 mm is used as the structure with its interior coated with professional dark colored, light absorbing materials. Not only does this coating add a layer of protection against uncontrolled light, but it also prohibits light reflections inside the cabinet that can cause heterogeneous lighting. Although similar physical structure for the measurement of indoor light has been suggested in [
17,
19], they address issues on providing a homogeneous lighting when the light intensity has to be changed.
To enable smooth and accurate light intensity control, light source is an integration sphere here with a diameter of 500 mm coated with a Barium Sulfate layer. This sphere is connected on top of the cabinet with an opening of size 190 mm as the light output of sphere to the cabinet. The integration sphere has five entry openings, each with a 40 mm diameter as the light entry point to the sphere. Design of this integration sphere is in a way that the light provided by each source reflects multiple times (in theory infinite times) before passing through the output to the cabinet. Each entry opening is equipped with a mechanical diaphragm that can control the amount of light into the sphere. To avoid overheating of light sources during long measurement sessions, light entries are cooled using a water circulation system. The overall structure of this measurement system can be seen in
Figure 1.
The main benefit of using an integration sphere is that the outcoming light has a homogeneous distribution at each height. This is critical while it is not possible to mount all measuring devices at an exact similar point—specially because, in addition to the PV module, light intensity has to be measured as well. By mounting all measuring elements on a single measurement board and putting it in the measurement cabinet at a flat surface, they will receive the same light intensity.
Although this cabinet isolates measurement environment from its surroundings, heat from light sources and operation of devices inside the cabinet can still increase the internal temperature. As the cabinet does not include an air conditioning system, a ventilation system pushes fresh air from the bottom of the cabinet. However, this air passes through a light maze to avoid any changes in the lighting. In this way, the temperature of the cabinet will be constantly equal to the room temperature which is a common office space with air conditioning, changing only in a limited range.
3. Measurement Board
In addition to the PV module that has to be evaluated during each measurement, environmental data including light intensity and temperature are required. Temperature measurement principles are well established and multiple sensors are available for its measurement. In this setup, a MCP9808 sensor [
20] produced by
Microchip as a digital sensor with I2C interface is used, delivering a good accuracy measurement with high resolution.
In contrast to the temperature measurement, light can be measured in different types including spectroscopy and integrative form. In spectroscopy, the intensity of each wavelength in the visible light range is measured separately. In contrast, integrative measurements are a summation of the intensity of the whole range presented by a single value. Although it is possible to extract the integrative value from a measured spectrum, this conversion is not reversible due to the nature of spectroscopy measurement. In addition to the representation form of measurement, there are two concepts of measuring light, namely:
radiometry and
photometry. Their difference is in the sensitivity of the measurement at each wavelength. Radiometry is the measurement in its pure form, which has to be scaled according to the human eye sensitivity curve to find the photometry data [
21].
Irradiance with the unit of [
] is to address the radiometry data, while
illuminance is for the photometry with the unit of [
] or [
].
Both radiometry and photometry data can be measured with a single spectrometer. While integration of spectrum data provides integrative values, use of spectrometers is not feasible for most applications because of their complexity, cost, weight, and size. Therefore, specific sensors are available which cater to integrative measurement directly. Pyranometers are very common for solar applications, used for irradiance measurement. However, their size and cost makes them not feasible for indoor embedded systems. On the contrary, there are multiple small size integrative photometry sensors available with reasonable size and price. This is mainly due to their usage in consumer electronic devices such as mobile phones and home TV setups.
A BLACK-Comet spectrometer from Stellar Inc. is used here. It has a wavelength range of 200 nm to 1100 nm and can be governed by a control PC via a USB connection. To have an accurate measurement, light is being probed with a 2-inch StellarSphere IC2 integration sphere with a 180° field of view and a wavelength range of 200 nm to 1700 nm. This integration sphere transfers the light probe to the spectrometer through a fiber optic connection. Both types of spectroscopy data can be measured directly using this combination in the whole desired indoor range of light.
For the integrative data, energy of spectrum can be simply accumulated. However, due to common use of integrative photometry sensors in embedded systems, two digital light measurement sensors are integrated in the system. First,
Max44009 [
22] is an ultra-low power sensor produced by
Maxim Integrated. The secondary sensor that has a higher accuracy and resolution is
TSL2561 [
23] from
AMS AG. It has two channels to deliver measurements in separate ranges. However, the whole range measurement is used here. Similar to the temperature sensor, these light sensors use I2C protocol to communicate.
A Raspberry Pi is used for communication and setting of integrative light and temperature sensors while connected to the control PC as well. The reason for using a separate system rather than the main control PC is the ability of on-site measurement for those systems that does not require spectroscopy data. In these cases, Raspberry pi can control the measurement without a higher controlling unit. Before each measurement experiment, Raspberry Pi initializes all sensors to measure in a periodic manner with a constant sample time.
Regardless of homogeneous light from the integration sphere on top of the measurement cabinet, all of these devices are mounted on a single board (shown in
Figure 2) near the PV module to reduce chance of difference in the absorbed light.
All measuring components are positioned in a circle with a diameter of less than 100 mm which can be simply located in the center of light cylinder of integration sphere output with a diameter of 190 mm. However, it has to be noted that this applies a restriction on the maximum size of a possible PV module that can be measured in this setup. While both probe hole and farthest sensor subsequently have distances of about 30 mm and 20 mm from the edge of the PV module, the longest side of module has to be shorter than 170 mm. Furthermore, the diagonal distance of the PV module has to be inside the circular area of homogeneous light surface, leading to a 154 mm diagonal limitation on the PV module as well.
The PV module is fixed to the board using a double-sided tape while two jumpers are used for its electrical connection. Therefore, the PV module can be simply changed in a very short time period.
4. Voltage–Current Curve Measurement
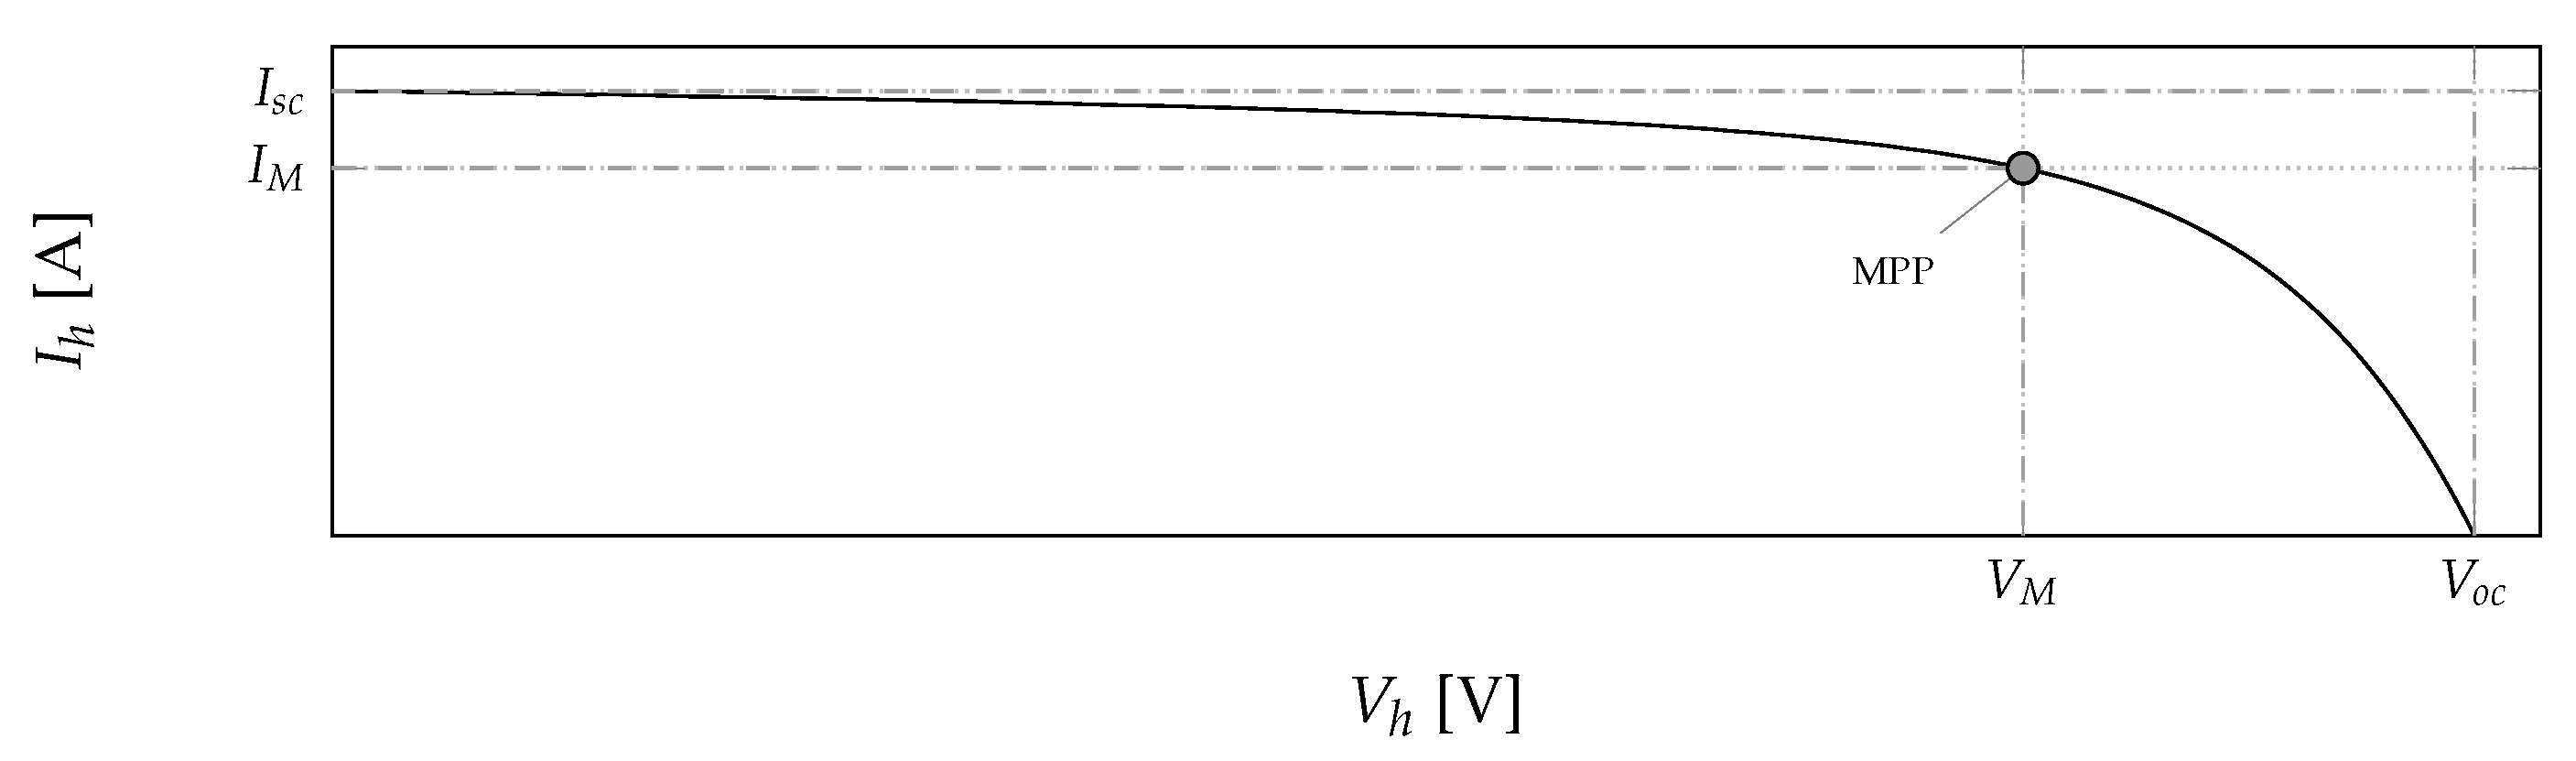
The typical curve of a PV cell is commonly known and formulated based on its physical semiconductor structure. It has a double source form both bent and connected to each other at the Maximum Power Point (MPP) as shown in
Figure 3.
This curve changes based on light intensity and type in addition to the temperature. Consequently, measurement of this curve has to be repeated for different environmental conditions. A common method of measuring this curve is to change a variable impedance connected to the PV module. This is commonly starting from zero to measure the short circuit current (
) value or the cross point from the
y-axis in
Figure 3. By increasing the value of this impedance, the curve can be spanned until the crossing point from the
x-axis to measure the open circuit voltage (
).
For this measurement, a
Keysight B2902A Source Measurement Unit (SMU) [
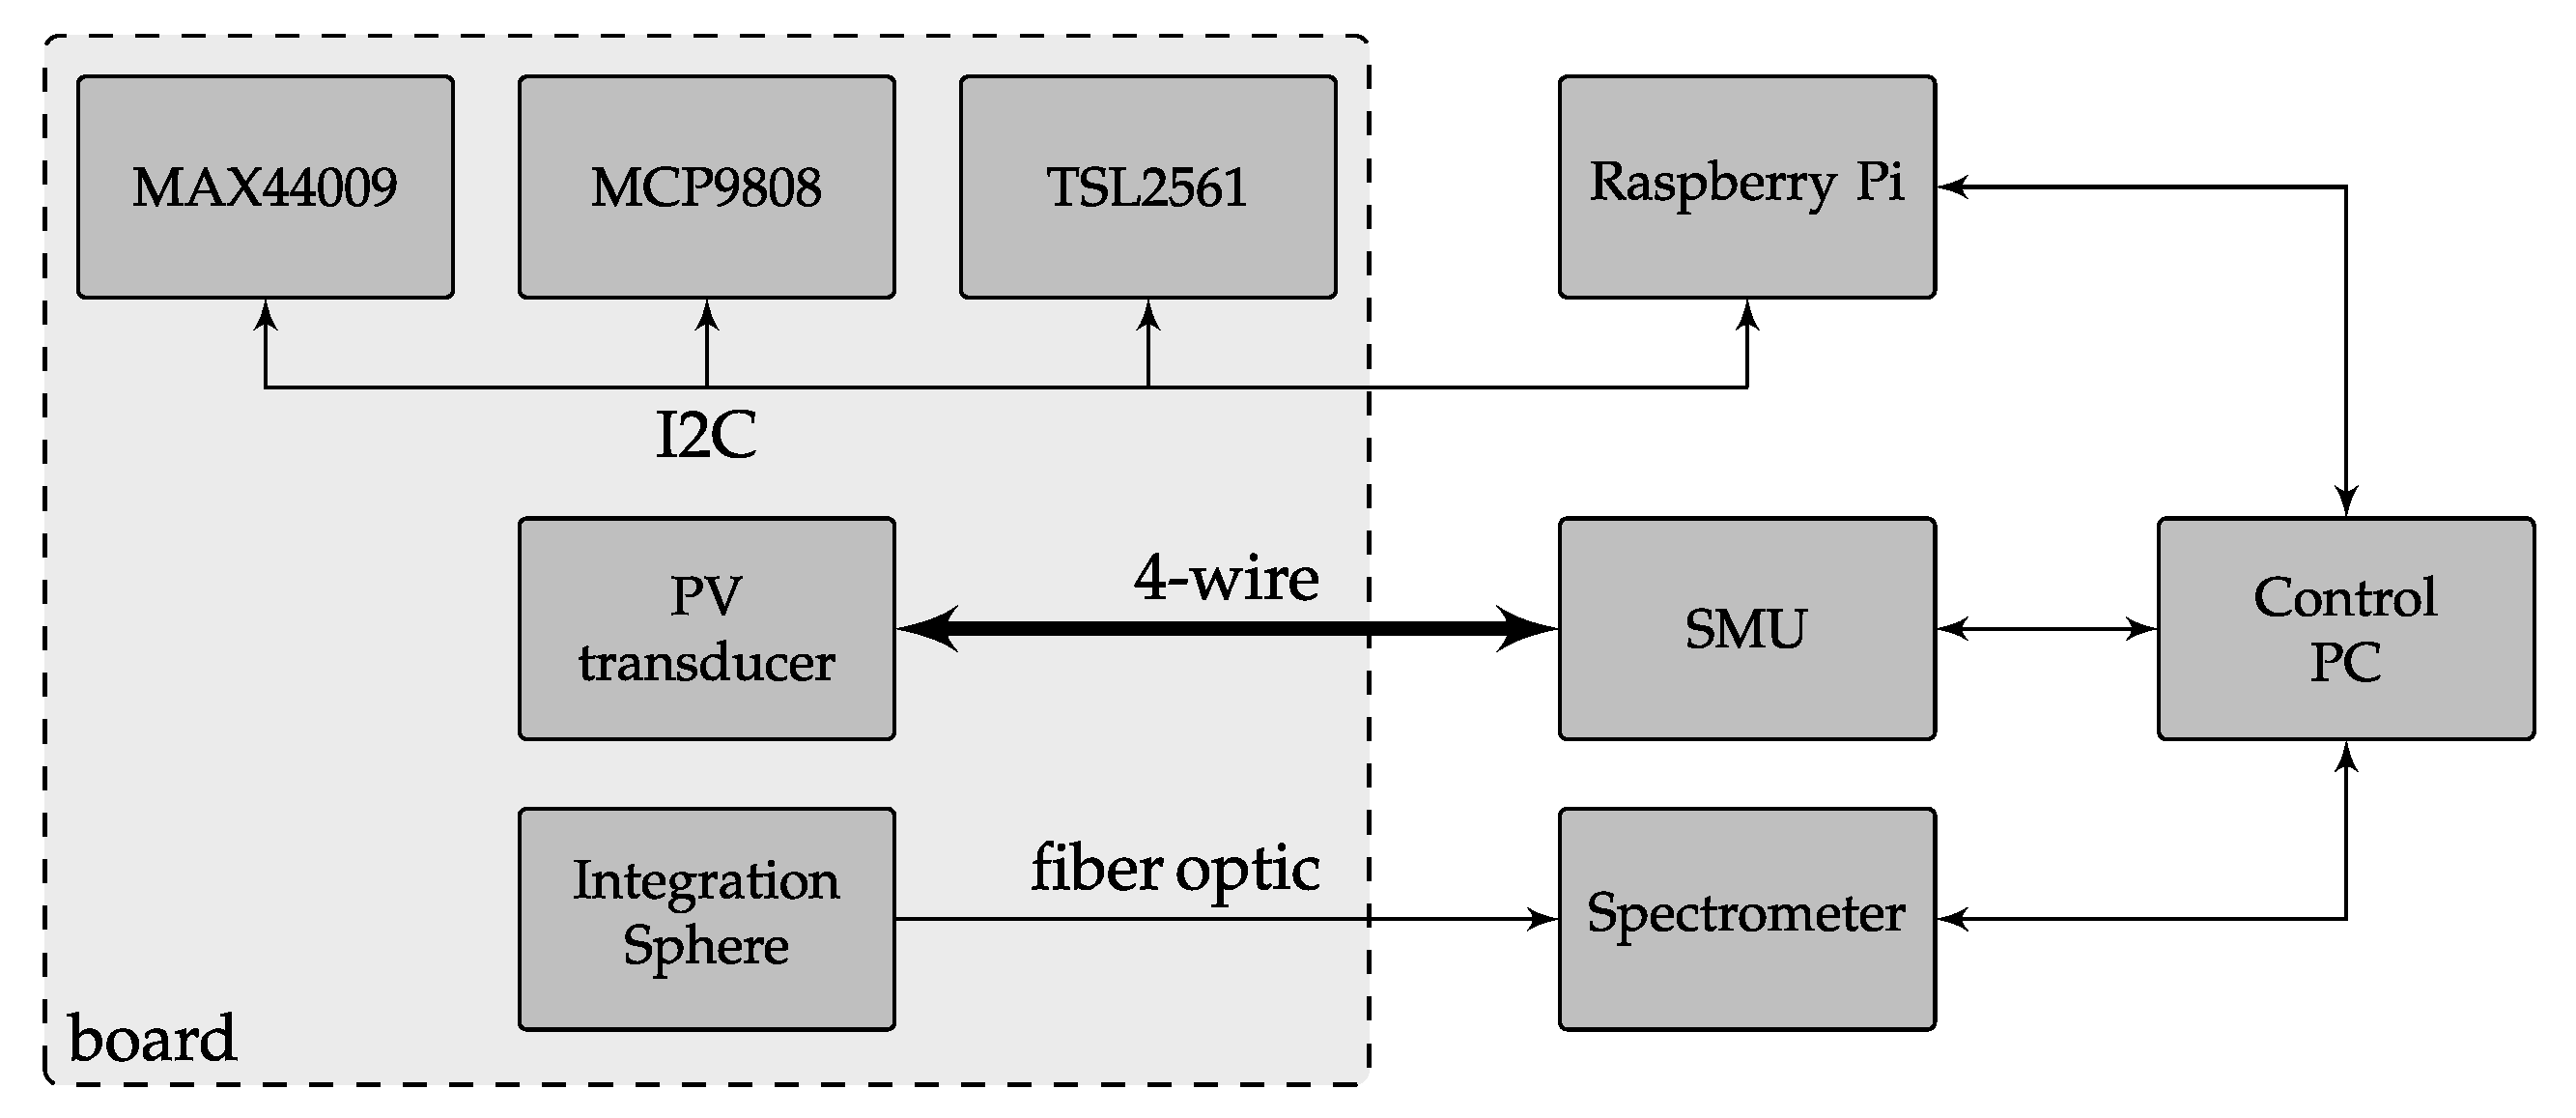
24] is used that is able to operate in all four quadrants. This device has a resolution of 10 fA and 100 nV, making it a perfect candidate for high accuracy measurements in low light conditions. To assure non-destructive measurement, SMU is connected to the PV module using a 4-wire (Kelvin) connection. This SMU is connected to the control PC on the other side, using a USB connection. The overall signaling of the measurement system can be seen in
Figure 4.
SMU uses a shunt resistor for the current measurement that changes according to the maximum passed current. Hence, proper peak current has to be set to reach the best possible resolution. To avoid sudden automatic change of shunt resistor during measurement, peak current value has to be set before measurement starts. From the voltage–current curve in
Figure 3,
is the highest possible current for a measurement experiment as long as light intensity and temperature does not change. Therefore, before the beginning of the experiment, this current is measured by setting the SMU to a zero impedance and measuring the current. Next, according to internal limits of SMU, the proper shunt resistor is set.
For changing the impedance, it is simply possible to set the SMU as a voltage source and measure the delivered current because of its 4-quadrant identity. However, selection of the voltage range has to be done carefully, especially near the open circuit section to avoid damaging the PV module. On the other hand, some PV parameter estimation methods require knowledge of the curve slope at the axis crossing points. Measurement with a small region beyond the axis would be beneficiary for better calculation of the derivation. Consequently, voltage source starts from a marginally small negative value, growing slowly while the current is being measured simultaneously. Voltage sweeping proceeds until the current reaches a small negative value. According to the lighting intensity, the scale of current can be different. Hence, stopping current limit has to be relative to the
to avoid a change in the shunt resistor. Considering all of these steps, the procedure of voltage–current curve measurement can be summarized in Algorithm 1.
| Algorithm 1: Process of measuring a voltage–current curve of a PV module |
 |
5. Data Collection
For a complete experiment, three sets of measurements have to proceed in parallel, namely:
Environmental data measurement, including temperature and integrative photometry
Spectroscopy, both radiometry and photometry
Measurement of voltage–current curve
Hence, a MATLAB program running a script on the control PC orchestrates the procedure as presented in Algorithm 2:
| Algorithm 2: Process of a complete experiment of PV data collection |
 |
While this process will be called an experiment, it has to be repeated in different environmental conditions. Therefore, after setting the lighting condition, each experiment is repeated three times to control and reduce the noise in data. In case of no clear discrepancy in the data, the average value of each parameter from all experiments is stored. Those experiments with large differences between trials are removed to avoid any doubt in the data-set.
For the collection of data-set, three different indoor PV modules with dissimilar technologies are selected with specifications presented in
Table 1 when
and
subsequently present number of series and parallel cells in each module.
For each of these modules, light has been manipulated in a range. All modules have been measured under a warm (W) white LED light source from
CXM-32 series of
LUMINUS [
25]. For analysis of the effect of light type, the Solems module has been measured under another light from the same series and specification only with a cold (C) tune of light. To include the effect of temperature on the behavior, this module has been measured multiple times in different temperatures as well. At the end, four data-sets are collected for which an abstract representation of their light intensity and temperature can be seen in
Figure 5.
6. Real World Low Light Measurement
All data-sets until now have been measured in the cabinet that assures stable and controlled lighting conditions and can be used for systematic analysis. However, real case indoor scenarios are more complex with reflections from different objects and surfaces. Therefore, the measurement system has been taken into the PhyNetLab [
10], which is a warehouse for experimental tests. These types of data can be used for the evaluation of methods and models from data-sets in the controlled environment in real case scenarios. In spite of LED lighting from ceiling, the industrial nature of the environment makes the lighting more complex. A data-set measured in different positions and height of this environment are also included which can be used for the evaluation of real case scenarios.
An abstract overview of all available data-sets can be seen in
Table 2.
There are different reasons for fluctuation in the number of experiments in data-sets. At first, cold white LED light sources have a higher maximum power than their warm light counterparts, which enable measurements in a larger range of intensities, leading to a larger Solems-C data-set. The Solems-W data-set is larger than others with warm white LED because experiments are repeated in different temperatures to include its effect as well. Finally, Solems-H has more experiments while it is from measurements in different physical points in the warehouse with more than a 500 surface.
7. Structure of Data-Sets
All five data-sets use the same structure, although they have different numbers of experiments. Two data formats are available in these data-sets. On one hand, each data-set (including all its experiments) is stored as a MATLAB structure. On the other hand, data about each experiment are available in the CSV format.
The MATLAB structure is made of multiple rows with each row representing a single measurement experiment. Each experiment includes:
- Name
a unique identifier of experiment made as a combination of the PV module name, lighting type, temperature and light intensity
- Temperature
in Kelvin
- TSL
Integrative photometry from TSL sensor in []
- Maxim
Integrative photometry from Maxim sensor in []
- Radiometry
which is the spectrometry of irradiance as a table with columns of wavelength in [nm] and intensity in []
- Photometry
which is the spectrometry of illuminance as a table with columns of wavelength in [nm] and intensity in []
- VI
a table including measured voltage in [V] and current in [A]
For the naming of each experiment, only the manufacturer name is included while warm and cold white LED types are shown subsequently by W and C; and H is used for the real case scenario in the warehousing hall. To distinguish experiments from each other, both temperature and intensity are multiplied by ten to build a four digit value. It should be noted that, for the light intensity, the value from a TSL sensor is used here. For instance, a measurement of the Conrad module in warm white LED at 298.9156 K and intensity of is named: Conrad_W_2989_0376.mat.
To enable usage of this data for researchers without access to the MATLAB software, data from each experiment are stored in a single folder including different CSV files. Folder naming of experiments uses the same protocol as MATLAB data naming. All folders from a data-set (one PV module under a type of lighting) are collected together, leading to five main folders. Each experiment folder includes four pieces of CSV data including:
- General
including data name, temperature in [], value from Maxim and TSL sensors in [] in
addition to the integrative irradiance and illuminance from spectroscopy data
- Photometry
spectrometry of illuminance as a table with columns of wavelength in [] and intensity in []
- Radiometry
spectrometry of irradiance as a table with columns of wavelength in [] and intensity in []
- VI
measured voltage in [] and current in []
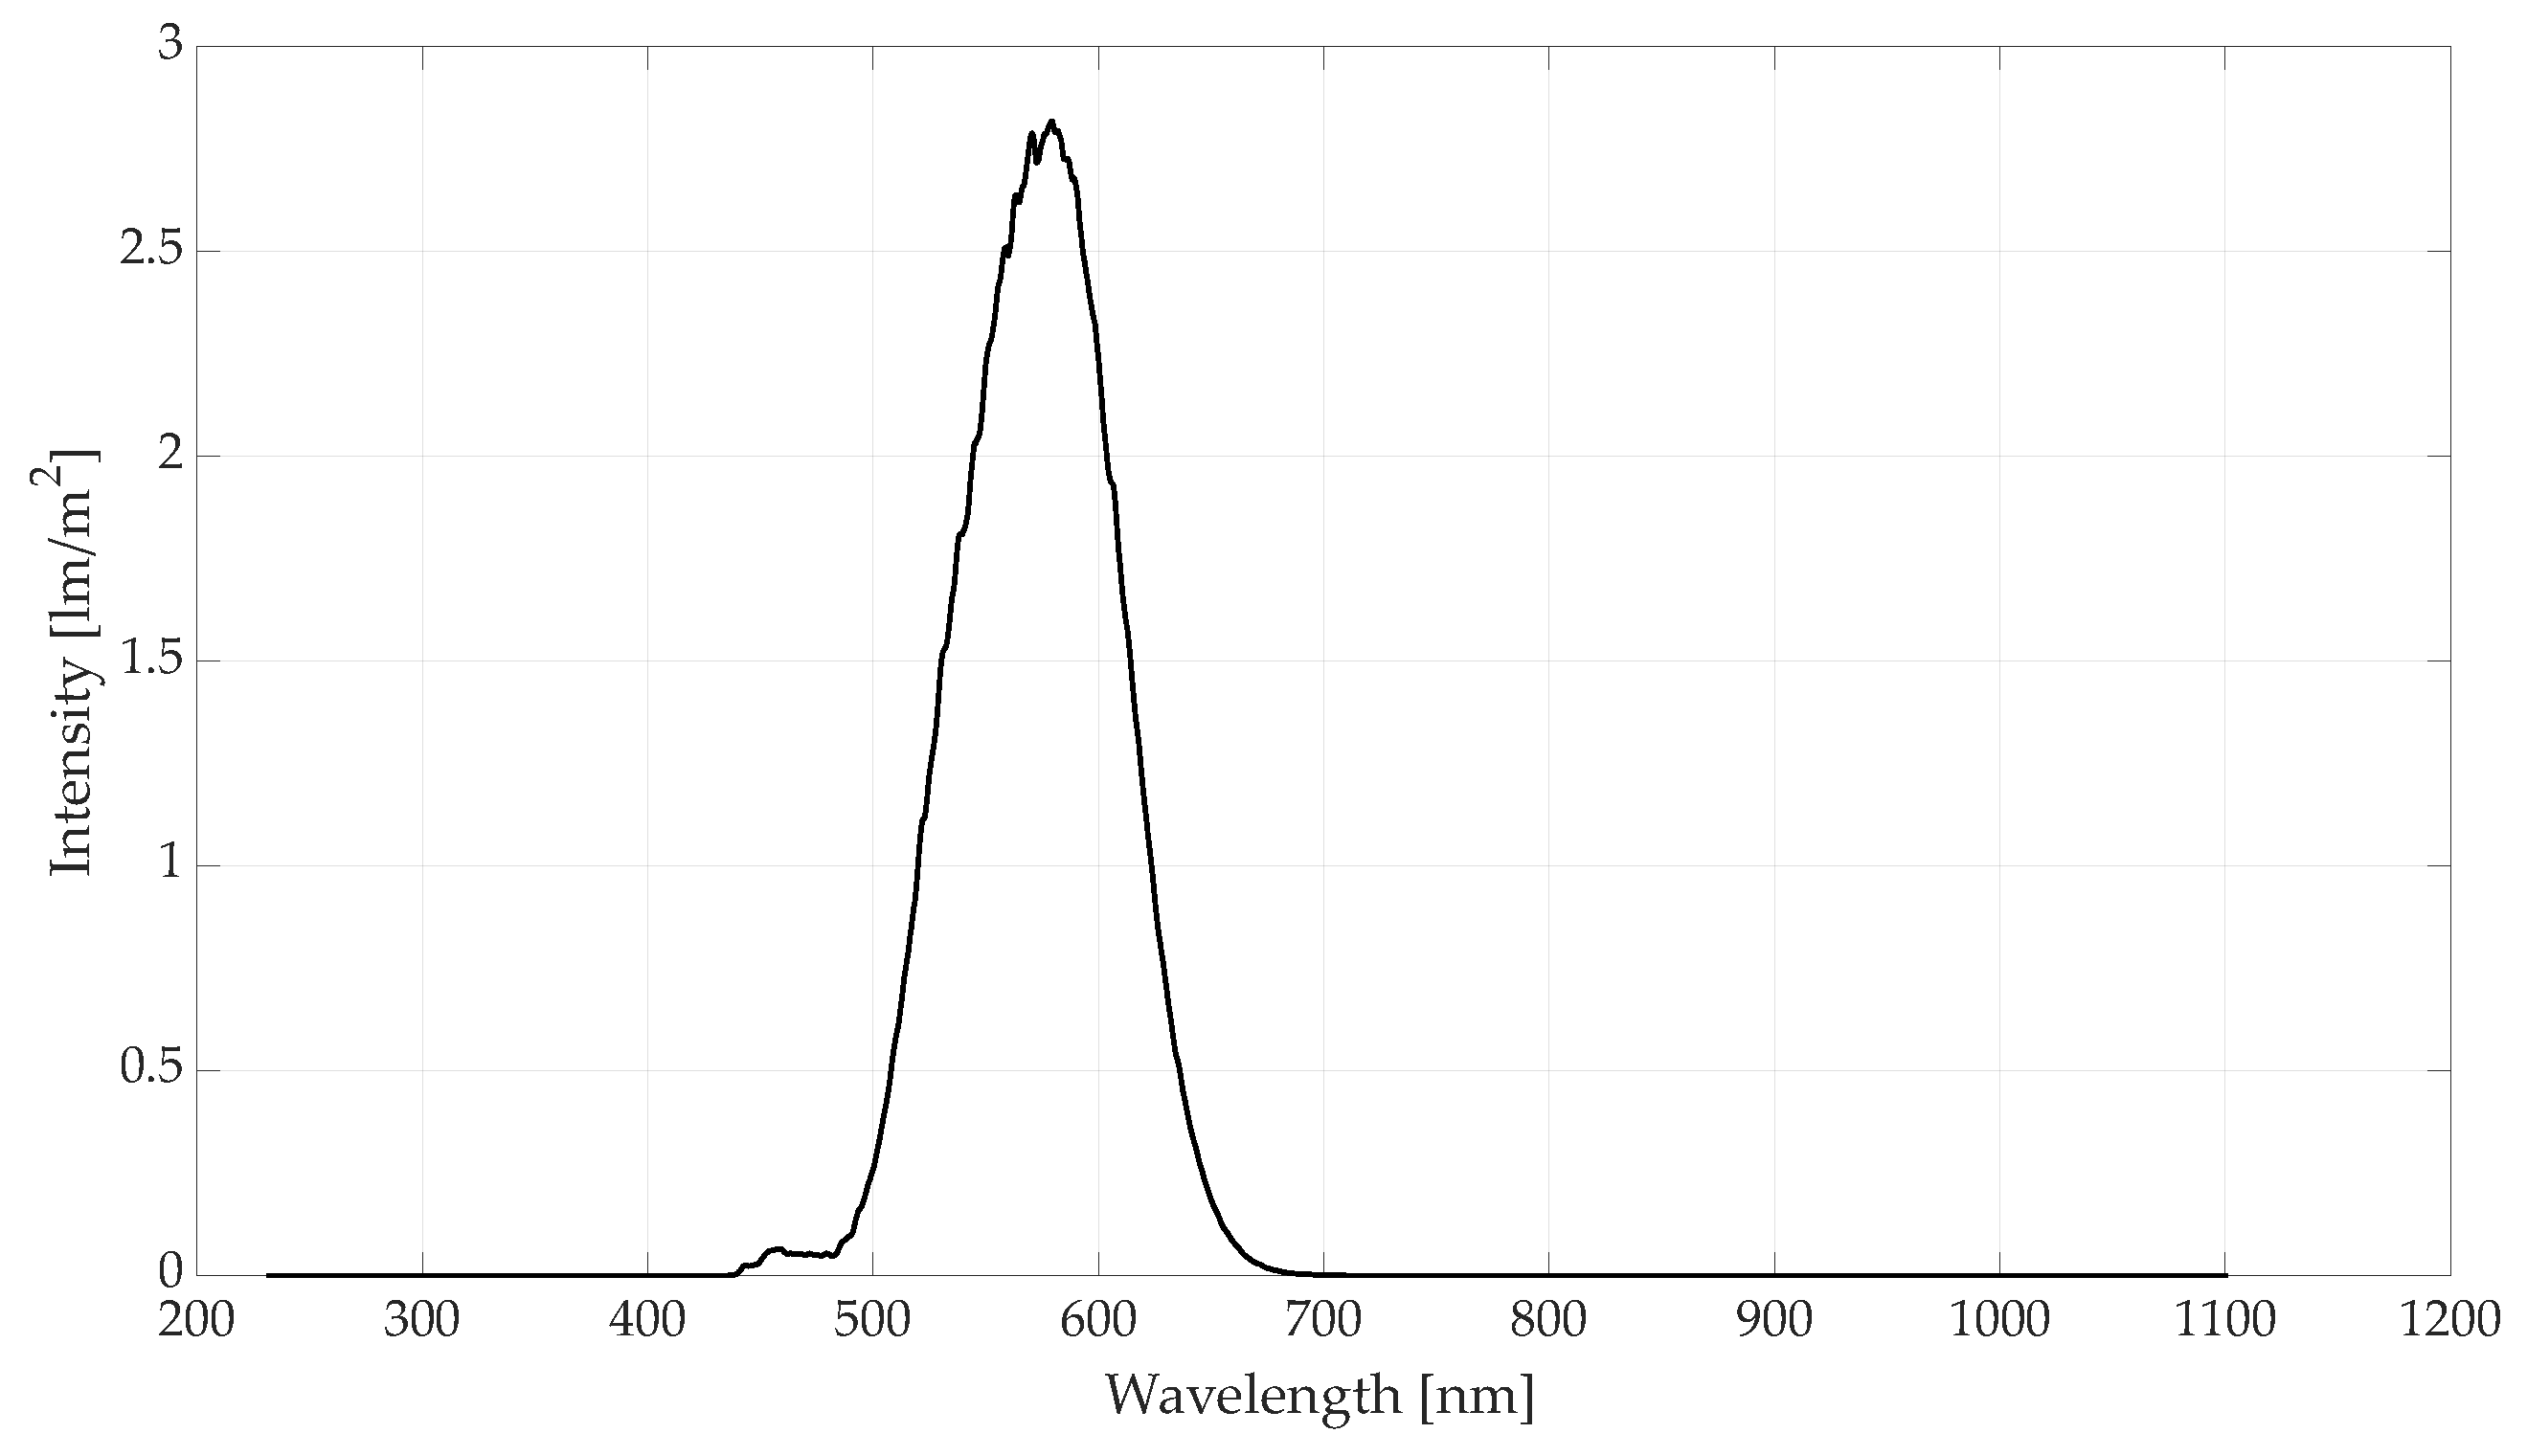
In addition to this information, figures of radiometry, photometry, and voltage–current curves are stored in PNG format for visual review. An example of measured curves for the experiment “Solems_W_2993_2401” are shown in
Figure 6,
Figure 7 and
Figure 8 subsequently for radiometry, photometry and voltage–current curves.
8. Conclusions
Within this work, a physical structure, electrical platform, and algorithms for measuring the behavior of small scale PV modules for indoor lighting is discussed, in addition to providing the collected data. The suggested setup separates the measurement platform from the environment, enabling control of the light intensity. Light is measured both in spectroscopy and integrative form for either radiometry and photometry. Furthermore, the voltage–current curves of PV modules are measured with high accuracy. Four different data-sets each with multiple experiments are measured, providing information for different modules, light intensities, and temperatures. Moreover, another data-set provides similar measurements from a warehouse as a real world application for integration of indoor PV modules in industrial ultra-low power embedded systems.


