1. Introduction
Self-harm (SH), is a major cause of premature and preventable death in people of all ages. While suicide ideation lacks a consensus on how the complex factors interact to influence mortality rates [
1] and therefore does not easily permit a quantitative assessment, self-harm consists of a “preoccupation with deliberately hurting oneself without conscious suicidal intent, often resulting in damage to body tissue” [
2]. This allows the intertwining factors of self-harm to become well reported, and remotely remove the subjective determinants of suicide and suicide ideation. The self-harm drivers have been described through the contextual awareness of suicide ideation as socio-economic [
3] as well as environmental [
4]. While the socio-economic and environmental factors seem to affect more men than women, there is an inherent complexity forwarded by the many different relations self-harm has at the social, economic and environmental level. Factors such as age [
5,
6], poverty [
7], immigration [
8], employment [
9], the surrounding environment [
10], as well as the economy [
11] have been forwarded as relevant for suicidal thoughts and intentional self-harm. This socio-economic complexity brings a convincing argument that the context of geographical space and thus the surrounding landscape, is a relevant driver for suicidal ideation that must be further assessed. The availability of spatially explicit data on self-harm, allows one to model the characteristics of spatio-topological relations that quantify the characteristics of the geographical characteristics of surrounding environment. Enabling integration within a spatial analytical framework thus, allows us to create quantitative models that respond to geographical stressors for self-harm. Environmental characteristics can directly have a positive outcome on well-being, and it is increasingly acknowledged that proximity and interaction with natural landscapes and other green spaces constitute important settings for cognitive respite, while providing calming settings and reducing symptomology for depression and anxiety, thus reducing disposition for self-harm [
12,
13]. In fact, there is growing evidence to suggest that the interaction with natural environments can be associated to specific mental health benefits, as the ability to focus attention and improve recovery from emotional states [
14]. Recent research based in attitudinal surveys have shown not only that people develop particular attitudes to naturalistic spaces, wild landscapes and natural vegetation, being influenced by them [
13], but also that nature has a significant positive impact in psychological and mental health-related aspects. Moreover, as shown in several studies the interaction with natural environments (by natural environments the absence of artificial and built-up environments, where vegetation, ecosystems and green areas are predominantly abundant is understood) a help to alleviate symptoms of Alzheimer’s dementia, stress and depression. This leads directly to sustained improvements in their mental health and a mitigation of specific causes of suicide and intentional self-harm [
15,
16,
17]. In the context of dense urban environments, it is of utmost importance to perceive the integration of green urban spaces and functional land use phenotypes [
18].
The regional aspects of the complexity of self-harm should be assessed by monitoring the patterns over geographical space [
19]. Given the rapid change of Ontario’s urban environments [
20], it is important to quantify the impacts of the multi-dimensional aspects of land use and landscape change within self-harm. At this juncture, it is important to coin the relation between suicide, self-harm and sustainable development. The World Health Organization (WHO) in its sustainable development goals (Goal 3) remits to the need of creating a robust framework as to: “Ensure healthy lives and promote well-being for all at all ages”. This well-being encompasses the reduction of premature mortality by 2030, through the promotion of subjective well-being and metal health. The mitigation of ideation of suicide therefore, is of significant importance to support healthy and sustainable lifestyles. The complexity of sustainable development has a strong spatial impendence that may efficiently be measured throughout spatial analytical techniques [
21].
Cases of suicides have been modeled geographically through the use of sociological and geographic data in spatial clusters analyses in the past. In many of these studies, utilizing geographic characteristics in socio-economic based case studies allowed to enhance the relationship of demographic factors within suicide research, suggesting a link between geographical space, and socio-economic findings. For instance, the fact that the relationship between increasing suicide rates as socio-economic levels decrease [
10] may be influenced by the heterogeneous geographical characteristics of the area [
22]. The relationship can be more easily visualized through the reorganization of the socio-economic factors into a geographic enumeration unit [
23]. As with most processes, epidemiology studies benefit from interacting at a single spatial scale [
24], allowing a standardized observation of social, economic and environmental factors and the contextual input of individuals [
25,
26]. In Canada, census metropolitan areas (CMA), census agglomerations (CA), census tracts (CT) and neighborhoods (N) have commonly been used to aggregate data for multilevel analysis of regional variations for epidemiology and suicide studies [
27]. One of the assumptions regarding spatial autocorrelation coefficient of the residuals can be tested through the Moran’s I index for suicide [
28]. By assessing different types of self-injuries along metropolitan areas such as Toronto, we attempt to clarify the spatial distribution of self-inflicted injuries at the regional level in urban land use perimeters, but further extend the issue to details of urban topology and quantifiable land use metrics. Thus, this paper starts out with the spatial autocorrelation of self-harm along Toronto’s census metropolitan area.
Once local spatial autocorrelation indicators are assessed, this paper continues by examining the characteristics of urban morphology by integration of a series of metrics. Self-harm categories behave differently over geographical space depending on land use types, and are thus explored in a geographic information system and through addition of a stepwise regression approach. Adopting a positivist relation to geographic analysis, a quantitative analysis frames an explanatory model to promote the characteristics of spatial distribution of self-harm rates. This combined assessment allows us to answer the following issues, pertinent within the understanding of the characteristics of land use and self-harm along urban spaces: (i) how does self-harm aggregate over urban space? (ii) does urban sprawl influence self-harm? and (iii) are land use and land typologies influential factors for propensity of self-harm? The Methodology section depicts our methodology, which hosts a spatial narrative with a deducting approach starting with global indicators and moving on towards the local scale and applying the different metrics of urban typology. Results and discussion section adopt an interdisciplinary approach of the importance of a combination of land use science as well as spatial analytical methods for better understanding patterns in self-harm, and the Conclusions section draws with future recommendations for self-injuries and resulting characteristics over urban land, to consolidate findings of self-harm within landscape research.
2. Study Area
North America has experienced differing growth patterns over the last decades. These changes in the North American growth rates, have witnessed the appearance of hubs of economic activity often located in rapidly growing urban regions. While these silos show unprecedented growth in their metropolitan regions and lead to a growing economic boom, former industrial regions, have become largely abandoned and are facing the increase in brown fields [
29]. These disparities have a direct backlash on the wellbeing of individuals, as employment and social stability become much less in such regions. In this sense, the North American economy seems to report a concerning pattern of asymmetric growth of regions, where coastal urban hubs are bound for an incremental development, and rural areas bound to less favorable social and economic circumstances [
18]. One of the fastest growing hubs in the North American economy is Toronto’s Census Metropolitan Area (
Figure 1).
The Toronto CMA, having a population of 5.5 million is expected to continue to grow over the coming years. It is not impossible to imagine Toronto becoming in a couple of decades Canada’s first megacity [
30]. With the advent of rapid urbanization, significant social, economic and environmental challenges are expected, where thus appropriate planning is required to guarantee continued economic growth, sustainable development, as well as wellbeing. In 2006, the Growth Plan for the Greater Golden Horseshoe, reported that 40% of the expected population increase might be absorbed into existing infrastructure [
31]. More expansion will be needed for an additional 2.7 million people in the Greater Golden Horseshoe, where the main metropolitan area constitutes the Toronto CMA.
4. Methodology
The methodology consisted of a series of distinct steps to allow us to infer spatial analytics of self-harm within the urban metropolitan region of Toronto CMA. The first step consisted in data organization and cleaning, as described in the section Data. This was expanded by (i) creating some preliminary spatial analysis for visualization of the distribution of self-harm density per census tract. This was followed by (ii) creating spatial autocorrelation algorithms to (a) understand the global distribution of spatial autocorrelation, and (b) should we find significant global spatial autocorrelation assess the hotspots of significance at local level through local spatial autocorrelation indices for the different categories of self-harm. Finding that the hotspots of self-injuries varied by category, allowed us to integrate the analysis over the distribution of land use and landscape patterns. This was conducted by (iii) compiling a series of relevant land use metrics: (a) urban dispersion (UD), (b) green space index (GSI) and (c) land use diversity (LUD). Additionally, (iv) archaeological and historical data were integrated in the GIS framework to offer an integrated vision of land use and landscape of the Toronto DA. Correlation was interpreted for the variables offering thus a conciliatory vision of the pertinence of land use and landscape as factors for self-harm.
4.1. Preliminary Spatial Analysis
Available location attributes corresponding to the forward sortation area (FSA) level within the National Ambulatory Care Reporting System (NACRS) inventory allowed geocoding the database in a geographic information system. Further to geocoding of self-harm, data was clipped for the Toronto census metropolitan area (CMA). Next, data was normalized and aggregated per census tract as described in the data section above. An initial exploratory data analysis was conducted to identify underlying spatial patterns in the distribution of self-harm and geographical variations registered per census tract for the main categories. Certain census tracts registered higher distributions of self-harm per category, reasoning the importance to further assess through a stepwise regression the relevance of land use and landscape response variables as illustrated further in the methodology. The integrative methodology allowed us to develop the spatial assessment of self-harm.
4.2. Spatial Autocorrelation of Self-Harm
Further to this, the first step consisted in understanding if there was a significant global spatial autocorrelation for self-harm within the census metropolitan area. This was assessed by calculating the Global Moran’s I for the incidence of self-injuries per census tract. To allow data consistency of this parametric test, the normalized self-harm ratio was used. The following Moran’s I equation was performed for calculation purposes:
where
zi is the deviation of an attribute for feature I from its mean (
zi-
),
wi,j is the spatial weight between feature
i and
j,
n is equal to the total number of features and
is the aggregate of all the spatial weights. The hypothesis was tested and confirmed for significant spatial autocorrelation at global level as discussed in the results section, allowing us to integrate global spatial autocorrelation indicators for the main categories found in the sample. Local spatial autocorrelation was assessed by means of the Local Getis-Ord Gi* statistic, which contains as follows:
where
xj is the attribute value for feature
j,
wi,j is the spatial weight between feature
i and
j,
n is equal to the total number of features and:
The Gi* statistic is a z-score, as such no additional calculations are necessary.
This statistic allowed to generate hot spots of where high or low values are clustered spatially. Contrary to incident intensity, the resulting z-score permitted an analysis at the census tract level of the resulting z-score. This data was thus combined with the different land use metrics for further analysis.
4.3. Land Use and Landscape Metrics
There are several advantages of using land use and landscape metrics to understand the geographical impact of self-harm within Toronto CMA. A first advantage, consists that socioeconomic change are a direct consequence of land use transitions, that within a more robust understanding of the geomorphological and landscape characteristics, allow us to assess the demographic characteristics at local level. The oftentimes complex and heterogeneous dynamics of land use justify thus the integration of a series of metrics to assess the multi-dimensional characteristics on self-harm. In this analysis, the extension and typologies of different areas are considered, forming a functional land use mosaic allowing the assessment of diverse quantifiable patterns, regarding the composition of the landscape as well as its configuration [
32]. These distinct dimensions have an effect not only on a discrete spatial surface such as an entire region and contribute to understanding the fragmentation of urban regions. Landscape metrics are commonly used in the study of habitat fragmentation, however, have in recent years become increasingly used for different anthropogenic studies.
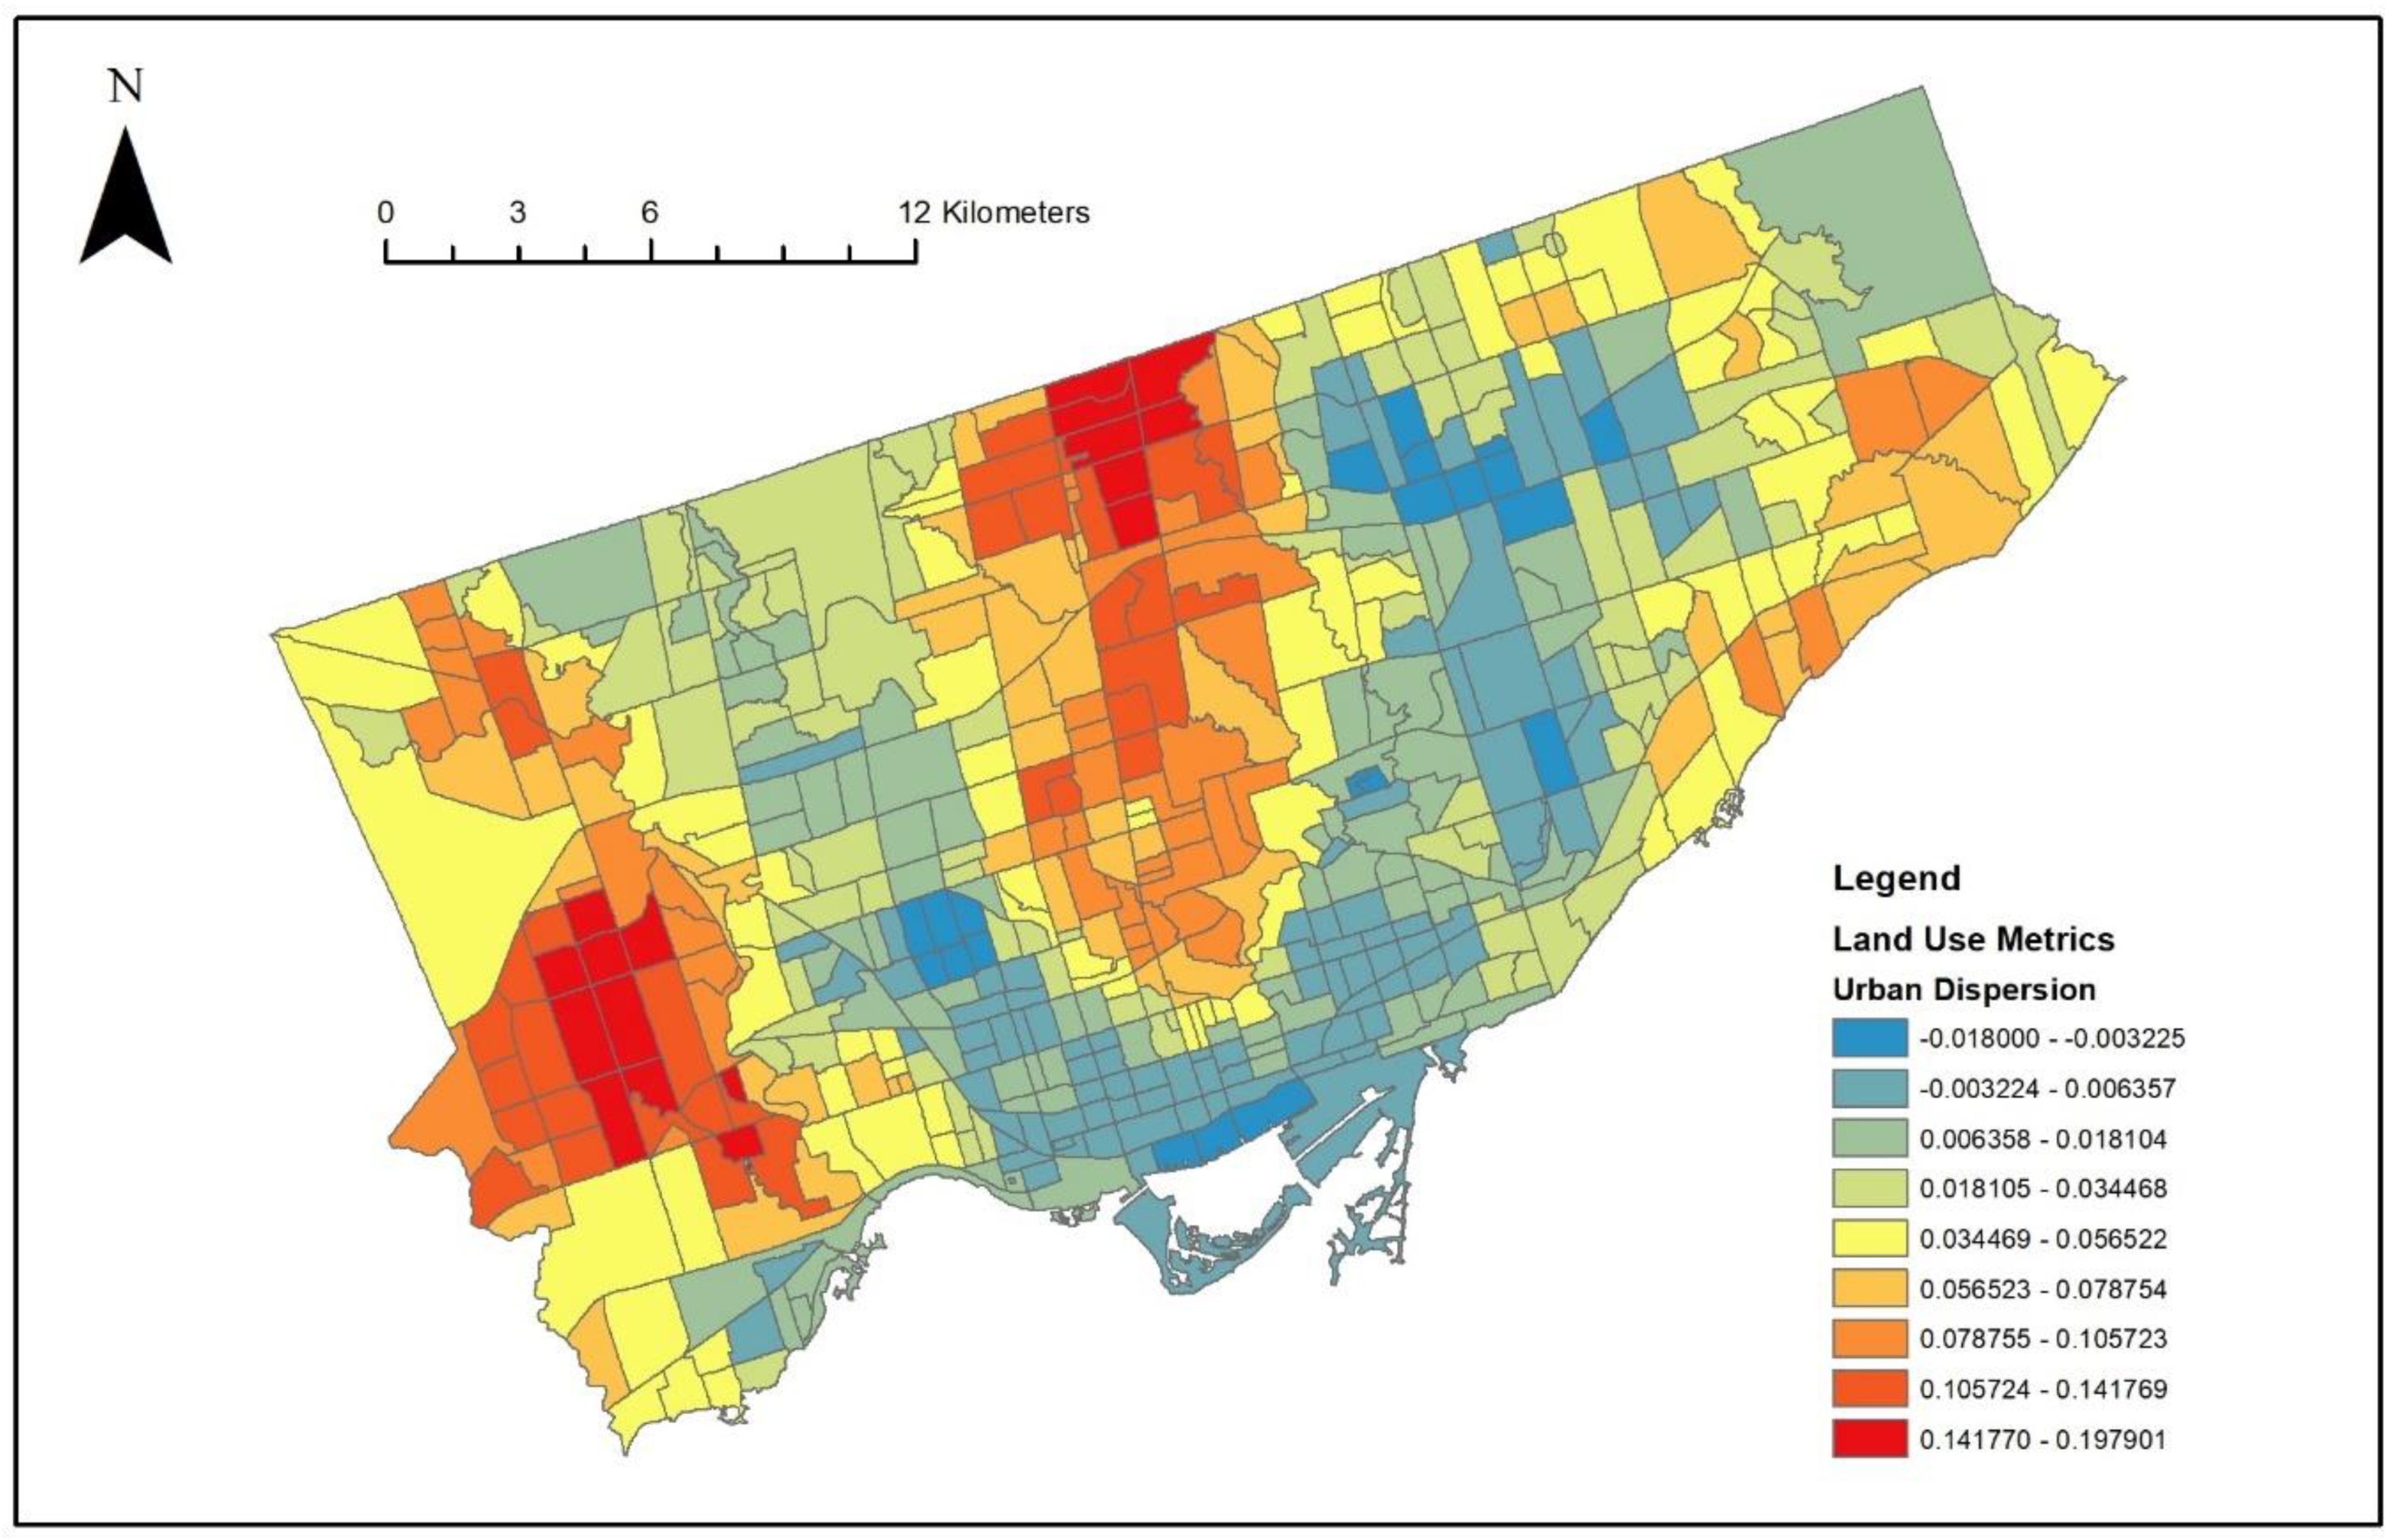
4.3.1. Urban Dispersion (UD)
Sprawl metrics consist of a quantification of urban sprawl within Toronto CMA for both timestamps of 2000 and 2010, and were registered by means of (i) dispersion (D) and (ii) sprawl/mix (SM) incidence. Where dispersion is calculated by means of:
where
U corresponds to the urban density footprint in the timestamp
n and the previous timestamp in
n − 1, and A_CT the area within a census tract (
Figure 4).
4.3.2. Green Space Index (GSI)
The green space index was calculated by means summing the following variables: (i) tree area, (ii) grass and shrub area from the forest and land cover data and (iii) green space data from Ontario landcover data. The polygonal data was then geometrically calculated to have a corresponding area in square meters. (
Figure 5)
4.3.3. Land Use Diversity (LUD)
Land use abundance was calculated by identifying the total land use categories in the Toronto land use data set per census tract. The polygonal information was further assessed into geometric areas in square meters for each census tract, offering an integrative vision of the spatially explicit characteristics of each category.
5. Results and Discussion
5.1. Spatial Distribution
The geocoded point data of SI instances allowed for additional summarization at the census tract level and some preliminary descriptive statistics. Given the difference in population density within census tracts in Toronto, the SI count data was normalized to census tracts as to correspond to a measure of intensity, by means dividing SI counts by population within the according census tract (
Figure 6)
Furthermore, a nominal query suggests that cases falling within the rubric of “intentional self-harm” in Toronto, corresponds to a total of 3840 cases with the following distribution by sex: 2342 female, 1502 male and one other. Clustering the identified self-harm list, further allowed to aggregate the data into 362 primary causes of which an additional disaggregation of considering a count per typology greater than 35 instances a selection of 19 main International Statistical Classification of Diseases and Related Health Problems (ICD) causes with the distribution as follows (
Table 2).
This distribution represented a total of 2486 cases for 2012. As can be assessed, poisoning and mood disorders constitute over 68 percent of the sample. A total of 15.53 percent was constituted by self-harm episodes related to neurotic, stress-related and somatoform disorders. Symptoms and signs involving cognition, perception, emotional state and behavior summed a relative percentage of 5.59% while injuries to elbow, forearm, wrist and hand a total of only slightly over 10 percent of the sample. The incorporation of geographical characteristics suggests a strong link to the environment brought by (i) accessibility to drugs, medicaments and biological substances, (ii) the impact of the environment and land use within mood (affective) disorders and (iii) the impact of the urban environment to neurotic, stress-related and somatoform disorders. These categories are tacitly spatial in nature, and deserve further spatially explicit analysis. This sample was thus additionally assessed at spatial level to understand the prevalence of global and local spatial autocorrelation. Typologies of SI varied greatly depending on geographical location.
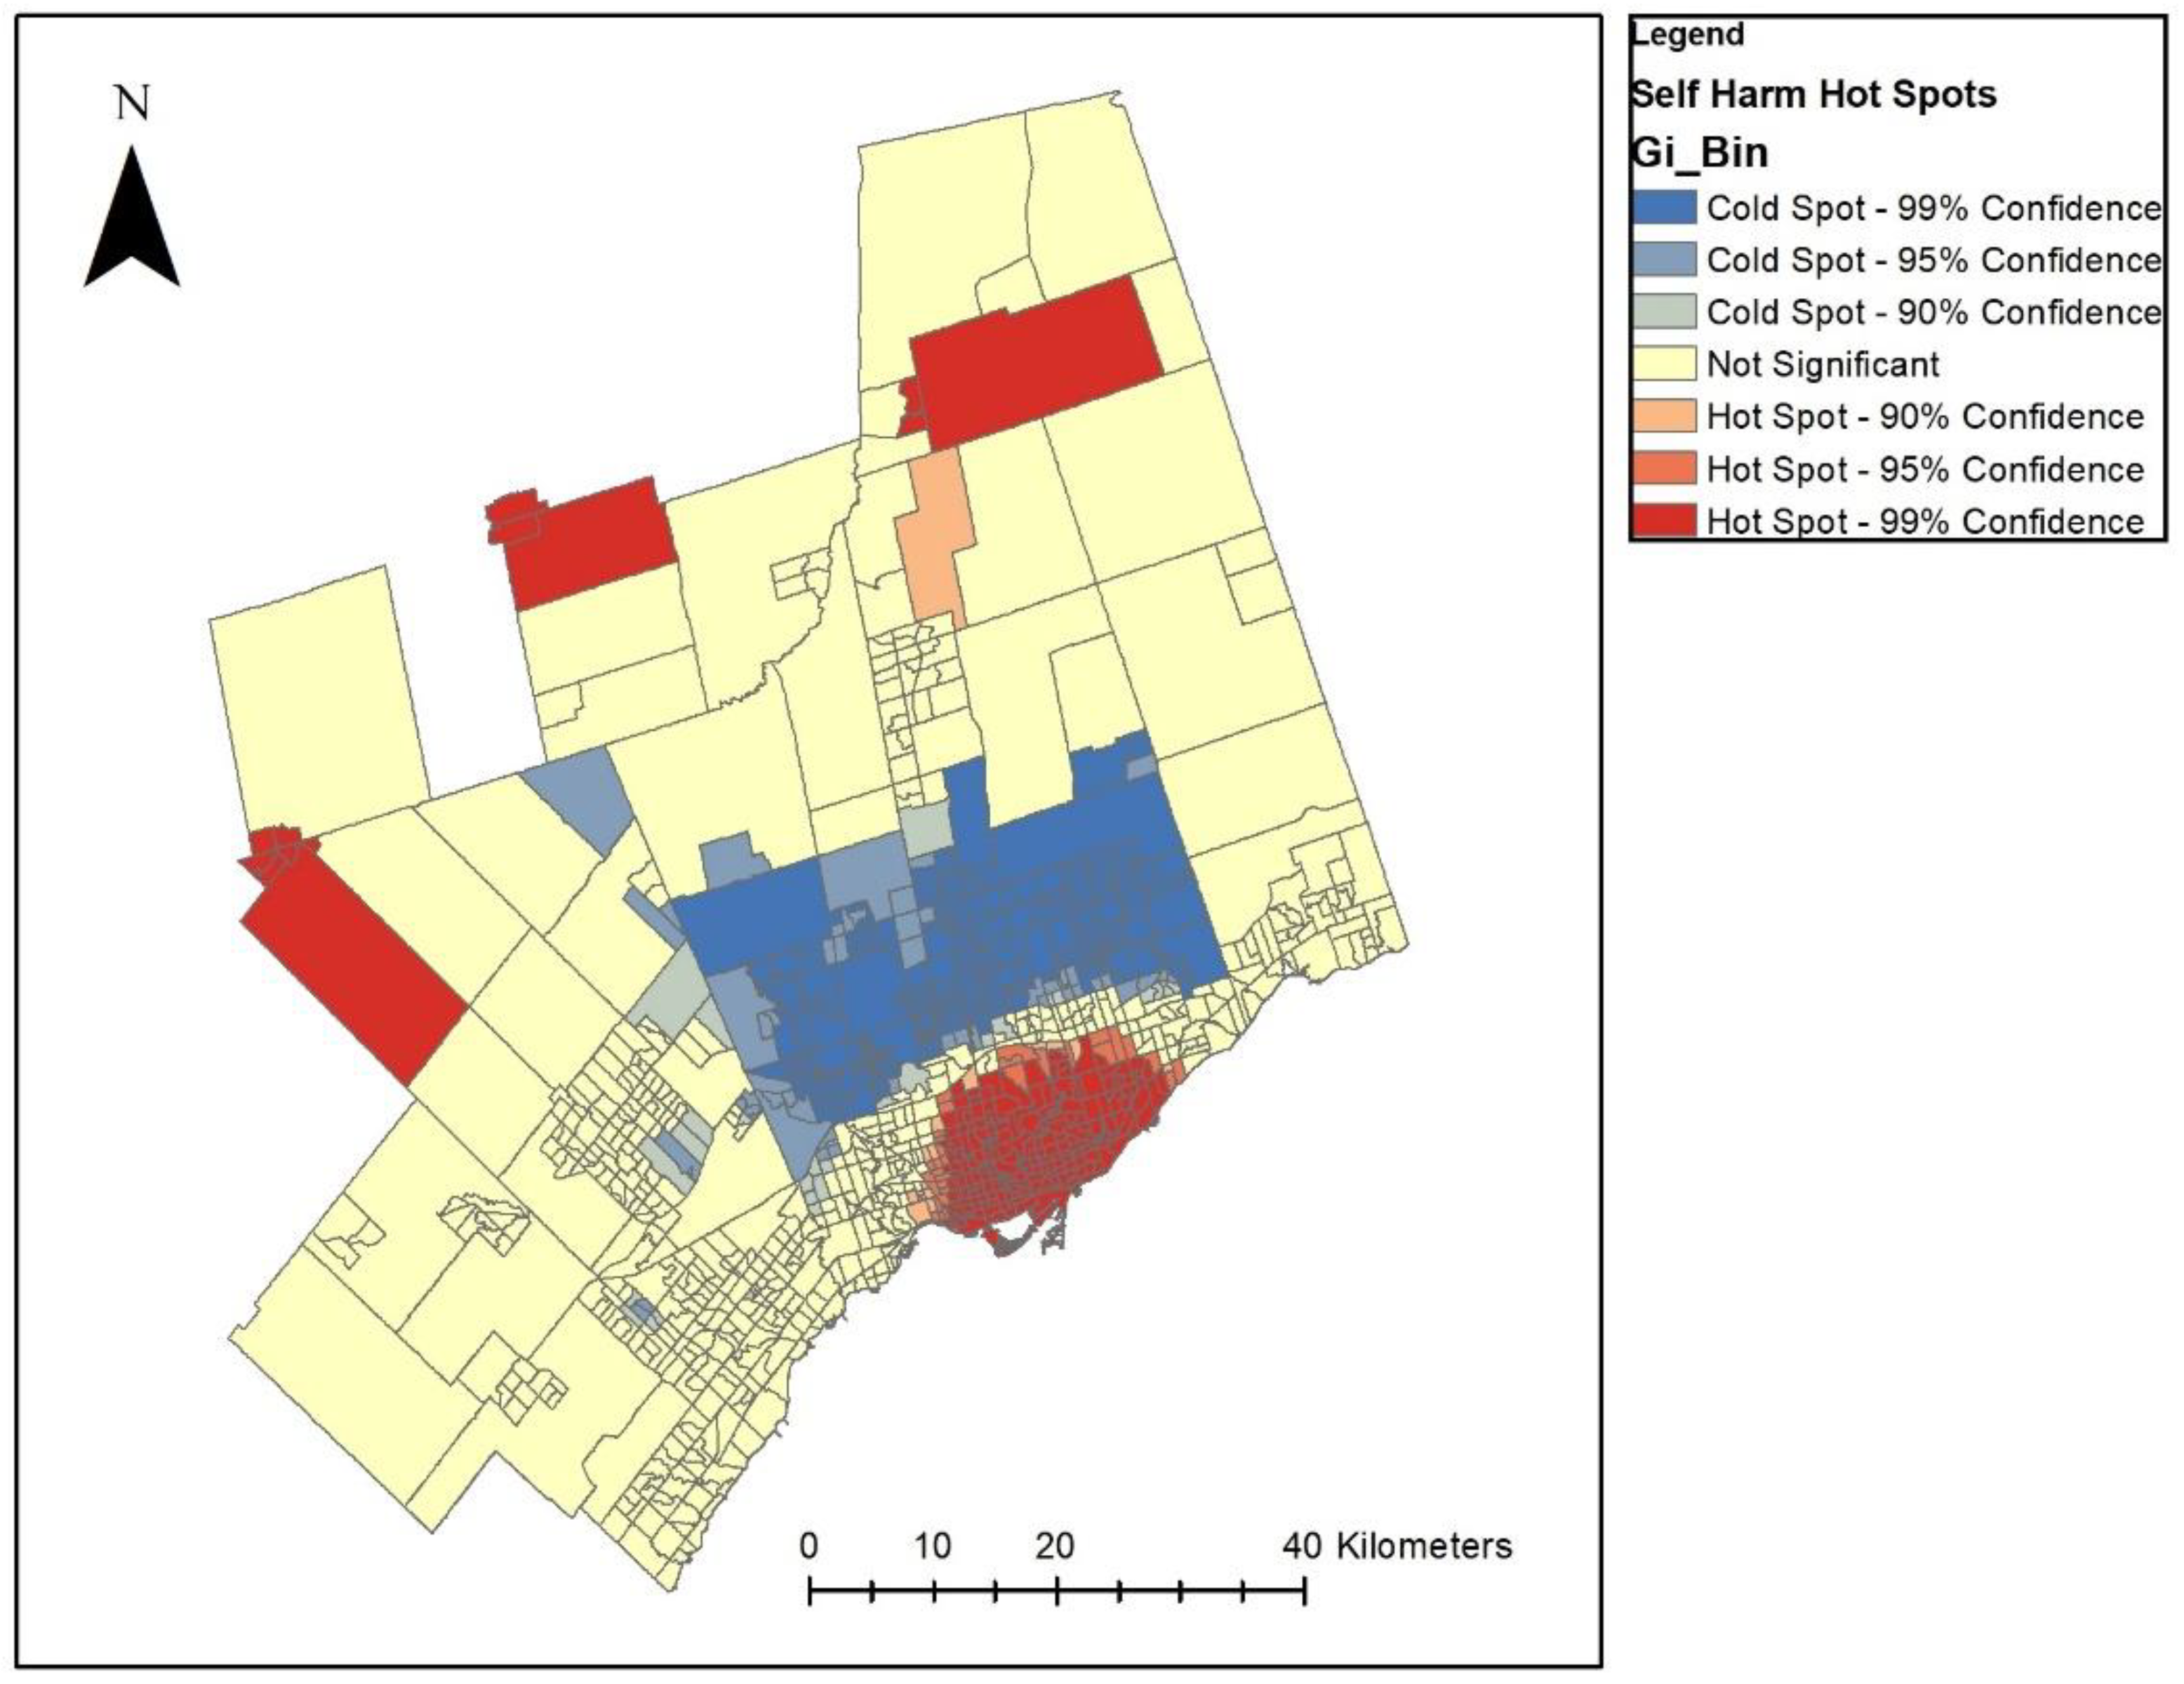
5.2. Global and Local Spatial Autocorrelation
Determination of global spatial autocorrelation was performed for the self-harm density per census tract. An inverse distance was used for spatial relationships was used, suggesting neighboring features have a larger influence on the computations together with Euclidean distances. A strong relation to global spatial autocorrelation was found through the significant Moran’s 𝐼 statistic (𝐼 = 0.07248,
p < 0.001). This justified further analysis at a local level of existing hotspots as well as a typology related analysis for local clustering. The Getis-Ord Gi* was conducted for all self-harm incidents (
Figure 7).
A significant hotspot exists for the downtown Toronto core. Additionally, cold spots for self-harm were identified in the northern part of the Greater Toronto Area (GTA). Within the northern extremes of the Toronto CMA, several hot spots were found as follows: (i) to the northwest of the Toronto CMA encompassing the towns of: Orangeville, Coulterville, Caledon and Alton. (ii) To the north of the GTA, including the settlements of Alliston, and (iii) to the north-east of the GTA holding the settlements east of Cook’s Bay, in the community of Keswick.
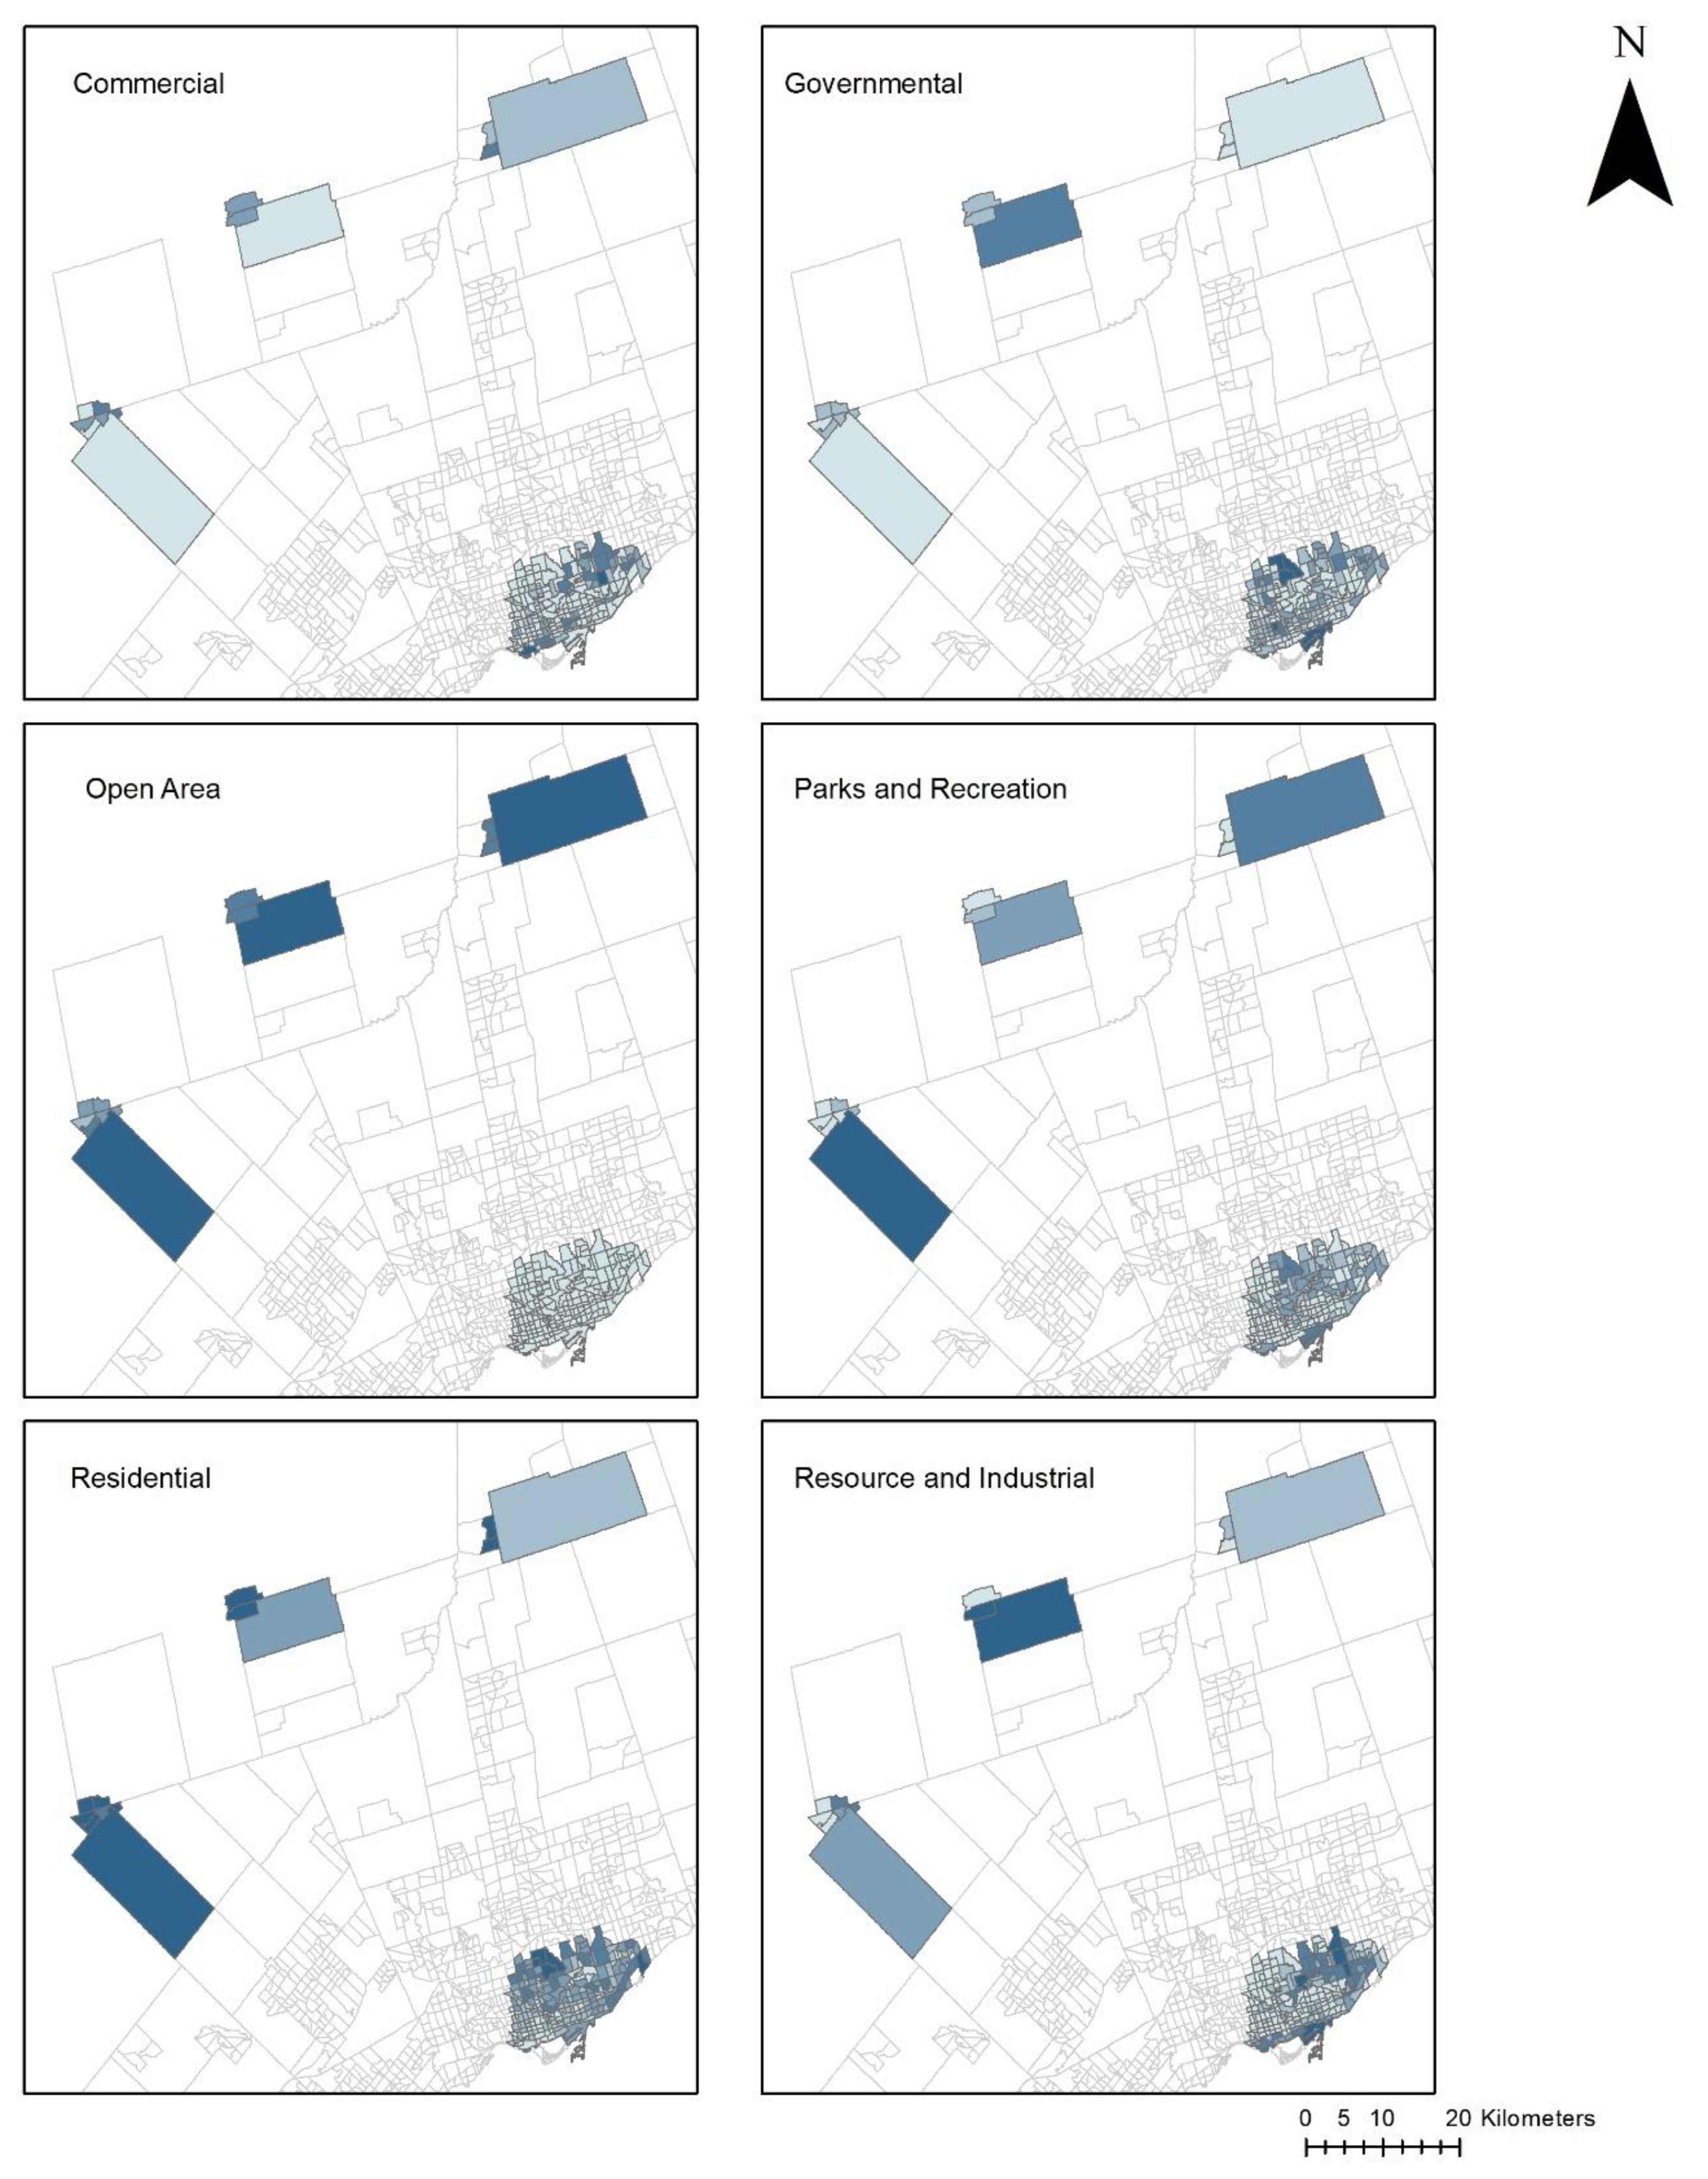
5.3. Land Use and Landscape Analytics
Compiled land use data allowed us to assess the overall distribution of land use types by category for the identified hot spots. The following result was obtained for the land use cover for 2010 in km
2 (
Figure 8). To achieve the spatial distribution of land use abundance per census a spatial join was conducted at census tract level. This join entailed a combination of the census tracts together with the land use data for 2010 downloaded by 2010. The initial polygons of land use types within the DMTI vector shape file, were then geometrically calculated to obtain the total area, which was then computed for each individual census tract. It is interesting to note that all land use types manifest different patterns of abundance within the hot spots. For instance, open areas are intrinsically located in northern area, while the area of exiting open areas the downtown Toronto core is comparatively absent. Additionally, parks and recreation areas seem to be to be sparse in certain census tracts within downtown Toronto, while the northern part of the Toronto CMA suggests existence of natural environments. These different geomorphological characteristics suggest that land use is a complex system that must be assessed within the transitions of self-harm within urban areas.
A closer inspection within the Toronto Dissemination Area (DA) allowed us to further assess the local patterns of self-harm within the urban core. This was achieved by generating a count of total occurrences within the DA. These results were compiled per census tract, and the local Getis-Ord Gi*.
Figure 9 represents the count per census tract (left) and the integrated hot and cold spots for self-injury.
It has been proven that the relationship between increasing suicide rates as socio-economic levels decrease [
10] and there is resounding evidence that this may be influenced by the heterogeneous geographical characteristics of place [
33]. The relationship can be more easily visualized through the reorganization of the socio-economic factors into a geographic enumeration unit [
23], and therefore with current information of metropolitan areas, understanding self-harm within the context of spatial planning becomes an important challenge. As with most processes, health studies benefit from interacting at a single spatial scale [
24] with the best scale unique to the case being studied. The variety of the geographic units and observed factors are dependent on the individual and contextual inputs [
25,
26]. Characteristics of individual or contextual effects plus the geography attributes are necessary for modeling determinants of health [
27]. With the additional information of location-based analysis, integrative planning can be targeted at sensitive areas and have a stronger benefit [
33]. The aggregation of the characteristics to a regional level also serves as an effective way to maintain privacy when dealing with sensitive health data. In Canada, Census Metropolitan Areas, Census Agglomerations, Census Tracts and neighborhoods have commonly been used to aggregate data for multilevel analysis of regional variations [
34]. When aggregating the data, regional statistics generated from connected observations areas may have an inherent bias and inefficient estimates of the processing rates. To mitigate this issue the dependent variable should be given a spatial dependency, as a way to separate the effect from the spatial heterogeneity of the independent variables. To effectively model regional levels, a multilevel model can be used to separate and analyze large-scale and individual effects (Wang and Hu, 2013).
With low level approaches, including general least squares [
11], geographically weighted regression [
28] and ordinary least squares (OLS) regression, the effects of the neighborhood and health characteristics on individuals of social capital, self-rated health and mortality has been underestimated [
35]. To ensure an effective use of the OLS methods the basic assumptions of linear regression need to be met [
36]. One of the assumptions regarding spatial autocorrelation coefficient of the residuals can be tested through the Moran’s I index. Supplementary statistics for measuring the heteroskedasticity and error distribution can then be used to check the OLS assumptions, before utilizing a Lagrange multiplier (LM) diagnostic for justifying an alternative spatial model [
37].
This paper found supporting evidence that the landscape is an intrinsic part of self-harm, and should be considered as a complementary threshold for local decision making and policy implications following a closer inspection through an exploratory bivariate conditional auto-regression model for landscape metrics (
Table 3).
This study contributes to the self-harm literature in several novel ways. For one, most previous research aggregated males and females together during their analyses because it was presumed that self-harm impacts both genders alike and can be remedied collectively. Based on the results of this study, both the spatial distributions of self-harm incidents and inferential landscape findings varied by gender type. It is because of these findings, like medicine being prescribed specifically for gender-specific metabolization rates, therapists, public health officials and researchers need to disaggregate all genders to improve healing outcomes. The exploratory spatial autoregression analysis from this study provided other new insights associated with gender differences, urban design, urbanization and sustainable development. Overall, when contrasting males and females, females were notably more influenced by the configuration of landscapes. To that end, six more grass/shrubs class configuration metrics and three more roads class configuration metrics were found statistically significant for females. Across the three categories of self-harm, the tree canopy class configuration metric perimeter-area fractal dimension (PARFRAC) was consistently the strongest predictor overall. PARFRAC was positively correlated with self-harm in all three instances and captures the shape complexity of tree canopy across Toronto neighborhoods. PARFRAC metric values range from 1 to 2; greater scores representing more convoluted and higher plane-filling perimeters, while a value of 1 results from a square with a straight perimeter. Using this finding as example, and allowing self-harm to be an indicator of human well-being, then another sustainable development paradox is exposed. That is, convoluted tree canopy within a landscape is largely accepted as more beneficial to biodiversity, ecological services, bio-geophysical systems and life-supporting ecosystems. In other words, based on the results from this study, what is good for environmental well-being is not good for human well-being. In an increasingly urbanizing world, this paradox is an important issue for sustainability scientists to address if humanity is ever to reach destination sustainability.


 ,
, 


