Article

Big Data Usage in European Countries: Cluster Analysis Approach

1
Faculty of Economics and Business, University of Zagreb, 10000 Zagreb, Croatia
2
Faculty of Organisation Studies, 8000 Novo Mesto, Slovenia
3
Faculty of Management, University of Primorska, 6000 Koper, Slovenia
4
Faculty of Organizational Sciences, University of Maribor, 4000 Kranj, Slovenia
*
Author to whom correspondence should be addressed.
Submission received: 3 February 2020 / Revised: 5 March 2020 / Accepted: 10 March 2020 / Published: 12 March 2020
(This article belongs to the Special Issue Challenges in Business Intelligence)

Abstract

:
The goal of this research was to investigate the level of digital divide among selected European countries according to the big data usage among their enterprises. For that purpose, we apply the K-means clustering methodology on the Eurostat data about the big data usage in European enterprises. The results indicate that there is a significant difference between selected European countries according to the overall usage of big data in their enterprises. Moreover, the enterprises that use internal experts also used diverse big data sources. Since the usage of diverse big data sources allows enterprises to gather more relevant information about their customers and competitors, this indicates that enterprises with stronger internal big data expertise also have a better chance of building strong competitiveness based on big data utilization. Finally, the substantial differences among the industries were found according to the level of big data usage.

1. Introduction

The development of information and communication technologies (ICTs) in the last several decades has an important role in the world’s socio-economic progress. Countries with higher levels of ICTs adoption enjoy better economic outcomes in return [1]. Nevertheless, digital society is still an elusive aspiration for some countries, which is, in turn, causing a digital divide both at the individual and at the enterprise level [2].
In 2003, a World Summit was held in Geneva, which addressed various technological issues, with the digital divide being one of them. A digital divide occurs when groups are formed with different levels of access to specific technological infrastructures, and it is often measured at the level of individual persons. On a psychosocial level, this divide can refer to those that embrace the new digital revolution and those that reject it, for various personal and demographic reasons [3]. However, recently, the digital divide has substantially decreased for some of the technologies [4].
On the other hand, new and upcoming technologies contribute to the digital divide among enterprises, which is especially worrisome, since enterprises nowadays heavily depend on ICTs as leverage for increasing their competitiveness. One of such technologies is big data, which is mainly driven by the emergence of Industry 4.0. The notion of Industry 4.0 (or Industrie 4.0), was initially proposed as a concept at the 2011 Hannover Fair, while in 2013, it became a German strategic initiative [5]. As remarked by Witkowski [6], the fourth industrial revolution (Industry 4.0) is facilitated with the development of the Internet of Things (IoT) and big data. These technologies enabled the automation and artificial intelligence to be implemented into industrial environments, making them “smart” [6]. Big data plays one of the most important roles in Industry 4.0 enterprises. The big data algorithms and technologies enable new business insights to be discovered and informed data-driven decisions to be made. Exploiting knowledge hidden in the big data improves organizational performance and competitive advantage [7]. Therefore, it is not surprising that Akoka et al. reported that 40% of ICT investment growth from 2012 until 2020 would be devoted to big data [8].
The generally accepted definition of big data refers to the large amounts of structured and unstructured data, usually collected on a real-time basis [9]. Big data complexity can be summarized by the 3V model of big data characteristics: Volume, Variety, and Velocity [9,10]. Volume embodies the size of the data that is measured in terabytes or larger units. Variety refers to diversity in the source and the structure of data. Velocity represents that data is generated, and collected, in streams. According to Brynjolfsson and McAfee, machine learning or deep learning is an inevitable part of the big data systems, due to their ability to learn from big data [11]. These insights are relevant since it is nearly impossible, if not impossible, for humans to generate any relevant insight from big data without the help of machine learning. For example, using machine learning on big data, businesses can detect and prevent several kinds of fraud, increasing their security and decreasing costs generated by computer crime [12]. In science, advances have been made in various fields, such as weather forecasting, natural disaster management, medicine, biology, and physics [13].
The benefits of machine learning and big data have been demonstrated in various industries, such as insurance, chemistry, and energy [14]. Other examples include customers and market intelligence, financial fraud, and stock market prediction in the financial industry. Big data usage is reported in the public services domain as well, where big data insights can foster innovations. Some of the additional implementations include public safety, smart health, smart grids and eGovernment [8].
However, one of the most relevant areas of big data utilization is in manufacturing. For instance, big data is used in the smart production process, for the demand planning and inventory management, as parts of supply chain management [15]. Industry 4.0, which is based on the concept of smart manufacturing, uses the advances in machine learning and big data, combined with advances in robotics, to create a partially autonomous manufacturing infrastructure, self-learning, and self-adapting. Usage of big data allows Industry 4.0 enterprises to integrate different products and platforms in collaborative systems [6]. Besides, due to the potential value of big data, manufacturing industries are experiencing “servitization” of their business, since the integrated data sources are used in predictive analytics [6], supporting the customer relationship management systems. Predictive maintenance is an additional area of big data utilization, where the advanced algorithms detect and fix faults, failures, and defects, and learn from past experiences to improve this process [16,17,18,19,20,21,22].
In the next years, big data is projected to continue its rapid ascent [23], with the increasing impact on both individuals and enterprises [24,25,26]. Despite the growing importance of big data in business and economic development, big data is still an underrepresented topic in management research [27]. Current literature mainly discusses big data concepts, methods, and application areas, but mainly from a technical perspective [10,23,27]. However, several questions emerge concerning big data that are operative and are thus relevant to big data adoption. Which data sources are the most used for big data analytics in the enterprise? Are there more differences between enterprises of a different size or between enterprises from different countries according to the big data usage? What is the source of expertise used by the enterprises for using big data; internal or external experts? What are the differences among industries in terms of big data utilization?
The proliferation of big data occurred due to the increasing amount of data collected from core information technology systems, digital platforms, and Internet traffic. Big data is compounded out of data from web, social media, mobile applications, different types of records and databases, geospatial data, surveys, scanned traditional documents, etc. [25]. Akoka et al. noted that the main sources of big data are social networks, mobile systems, and IoT devices [8]. Hence, big data analytics concerning the source of data can be classified into three domains: (i) analyzing their own big data from an enterprise’s smart devices or sensors; (ii) analyzing big data from the geolocation of portable devices; and (iii) analyzing big data generated from social media.
Recent studies have reported on the beneficial impact of big data analytics in diverse industries [8,23,27]. The source of different impact stems from the different nature of the data relevant for different industries, e.g., structured data, textual data, multimedia files, web and social media logs, network logs, internet-of-things, and mobile logs [10,28]. Castelo-Branco et al. investigated Industry 4.0 in EU countries [29]. Their findings suggest that differences in manufacturing digitization could be partially explained by enterprises’ big data maturity.
Since big data acquisition, management, and analytics have recently emerged, the skills relevant to big data are scarce on the labor market, as well as in the curriculum of bachelor and master educational programs [30]. To fill this gap, abundant massive open online courses and extracurricular courses have been launched, such as “Data Science and Big Data Analytics: Making Data-Driven Decisions” available at MIT [31]. Rohrbeck discussed that the availability to use internal ICT experts is a significant driver of profitability since such experts have in-depth knowledge about the enterprise data, processes, and strategical goals [32]. Due to the shortage of big data skills, enterprises likely employ both internal and external big data experts. However, the question emerges if the availability of internal experts could lead to a greater level of big data utilization.
In this work, we focus on the usage of big data in Europe, intending to investigate differences between European countries according to the usage of big data by their enterprises, since the digital divide at the enterprise level has been demonstrated for various ICTs. For that purpose, we analyzed the data about big data usage from Eurostat, which was collected as part of the European ICT usage survey [33], which includes the information about the overall usage of big data and usage of various big data sources (e.g., social media, internet of things), as well as usage of internal and external big data expertise.
We analyzed these data by using K-means cluster analysis, which is often used for analyzing the digital divide due to its ability to form homogenous groups of cases based on the usage of several variables [34,35]. Our analysis generated three clusters, which were in turn compared according to the level of usage of internal or external big data experts, and the level of big data usage in various industries. Results indicate that the big data digital divide is present in European countries, both at the country and industry level. Utilization of experts is also confirmed as a benefit to the big data utilization.
The paper is organized as follows. After the introduction section, the methodology section describes the data and statistical methods used. The third section presents the results of cluster analysis and compares the usage of internal or external big data expertise, and usage of big data in various industries. The final section summarizes the main ideas of the study and provides a discussion of theoretical and practical contributions.

2. Methodology

2.1. Data

For this research, we use the data set about the big data usage in enterprises obtained by Eurostat. Table 1 presents the variables used in the research. Data consists of two groups of variables: (i) sourced of big data used in enterprises and (ii) big data external or internal expertise employed in enterprises.
The data have been collected by the National Statistical Offices in 2018 for the 28 European countries. The dataset includes all of the European countries, as well as Norway, while leaving out the UK. Data have been collected on the enterprise level for the three groups of enterprises according to size (small, medium, and large). The size of the enterprise has been established based on the number of persons employed. The information about the usage of the following big data sources is collected: enterprise’s smart devices or sensors, geolocation of portable devices, and data generated from social media, or usage of any data source. Variables of usage of internal or external expertise for conducting big data analysis are also taken into account. Finally, the information about the enterprises’ industry is extracted from Eurostat.

2.2. Research Questions and Statistical Analysis

For the analysis of the big data digital divide in European countries, we pose three research questions: (i) RQ1. What is the level of big data digital divide among European countries according to the usage of big data technologies in small, medium, and large enterprises, taking into account various sources of big data?; (ii) RQ2. What is the impact of using internal or external big data experts for delivering big data solutions to the level of acceptance of big data?; (iii) RQ3. What is the level of big data usage in various industries, and how it is related to the level of acceptance of big data?
The first research question (RQ1) were addressed by using cluster analysis. Cluster analysis aims to decrease the dimensionality of a dataset by identifying homogenous groups of data [36]. The clustering of data instances resulted in groups with similar in-between features, while the data instances in different groups had significantly different features.
The first step in cluster analysis was to determine the characteristics, i.e., variables, that will be used for the segmentation of data [37,38]. The clustering variables are usually selected concerning the theory and the specific topic of the research [39]. Consequently, 12 observed variables on the big data utilization have been used for the clustering in our analysis. The second step in cluster analysis is to select the clustering method [39]. There are several clustering methods, but the most employed one is the non-hierarchical k-means clustering approach [40,41], due to its ability to reach a stable solution, which increases the trustworthiness of the results [39]. The third step in cluster analysis is choosing the number of clusters. In k-means, the number of clusters should be selected by the analyst, using the various rules or expert knowledge. There are several approaches proposed for this purpose [42]. We opted for observing the graph of the cost sequence to find the appropriate number of clusters [43], supplemented with the v-fold cross-validation approach to find the optimal number of clusters, and ensure the robustness of the solution [39,42,44]. Finally, after the cluster solution was found, the interpretation of clustering results can be made concerning the underlying theory and research domain.
To provide an answer to the first research question (RQ1), we analyzed the countries in clusters according to their geographical position, and utilized big data analysis among small, medium, and large enterprises.
The second research question (RQ2) was answered using ANOVA analysis to investigate the differences among countries in clusters according to the usage of internal or external expertise for delivering big data solutions.
ANOVA analysis was also used for answering the third research question (RQ3), to investigate the different levels of big data usage in European enterprises across various industries.

3. Results

3.1. Descriptive Statistics Analysis

Table 2 presents the descriptive statistics of the observed variables. Big data utilization was measured as a percentage of the enterprises using a certain big data source. Therefore, the data about the usage of various big data sources (enterprise’s smart devices or sensors, geolocation of portable devices, data generated from social media, or any data sources) among the small, medium, and large enterprises were examined.
Overall, ICTs are most often used by large enterprises that have the highest need for sophisticated ICT solutions, as well as sufficient financial and human resources for its implementation [3]. This trend was also observed in the big data usage presented in Table 1. On average, 33.5% of large enterprises use big data from any source. In detail, 19.89% of large enterprises use big data from the enterprise’s smart devices or sensors, and 13.71% of large enterprises use data from the geolocation of portable devices. Similarly, 13.5% of large enterprises exploit data insights from social media.
On the other side, for every big data source category, small enterprises have the lowest level of big data usage. This result indicates that small enterprises do not recognize the need for big data analysis or do not have the resources to conduct it. The lowest results are detected for the devices category, where only 3.21% of small enterprises indicate that they use big data from the enterprise’s smart devices or sensors. The situation is somewhat better when observing the utilization of big data from any source, with 10.57% of small enterprises using at least one of the big data sources.
Regarding the usage of internal or external big data expertise, 29.8% of the large enterprises use in-house experts for big data analysis. At the same time, 15.36% of the medium enterprises do the same, followed by 7.56% for small enterprises. Big data analysis is conducted by the external service provider in 12.6% of the large enterprises, 6.76% of the medium enterprises, and 3.92 of the small enterprises. This result indicates that small enterprises do not have sufficient human resources to utilize big data analysis.

3.2. K-Means Cluster Analysis

K-means clustering was applied using the variables presented in Table 2. To calculate the initial centroids, the maximum average distance was applied. Afterward, data instances have been iteratively assigned to the cluster with the closest centroid, using the Squared Euclidian distance. As already mentioned, k-means clustering starts with choosing the appropriate number of clusters. There are several approaches for deciding upon the number of clusters in k-means. Some of the approaches include the “elbow” method, thumb rule, information criterion, and cross-validation [42]. Along with these mathematically oriented and graphically assisted approaches, expert knowledge rooted in the theoretical background of the field is suitable for selecting the number of clusters in some situations [45]. However, this approach can result in common researcher bias. We opted for observing the graph of the cost sequence to find the appropriate number of clusters [44,46]. Additionally, v-fold cross-validation has been employed [44,47]. V-fold cross-validation selects random v samples of data that are divided into the validation set, and training set, to ensure the stability of the results. If the clustering algorithm works well, it provides similar partitions regardless of the sample drawn out from the original dataset [42].
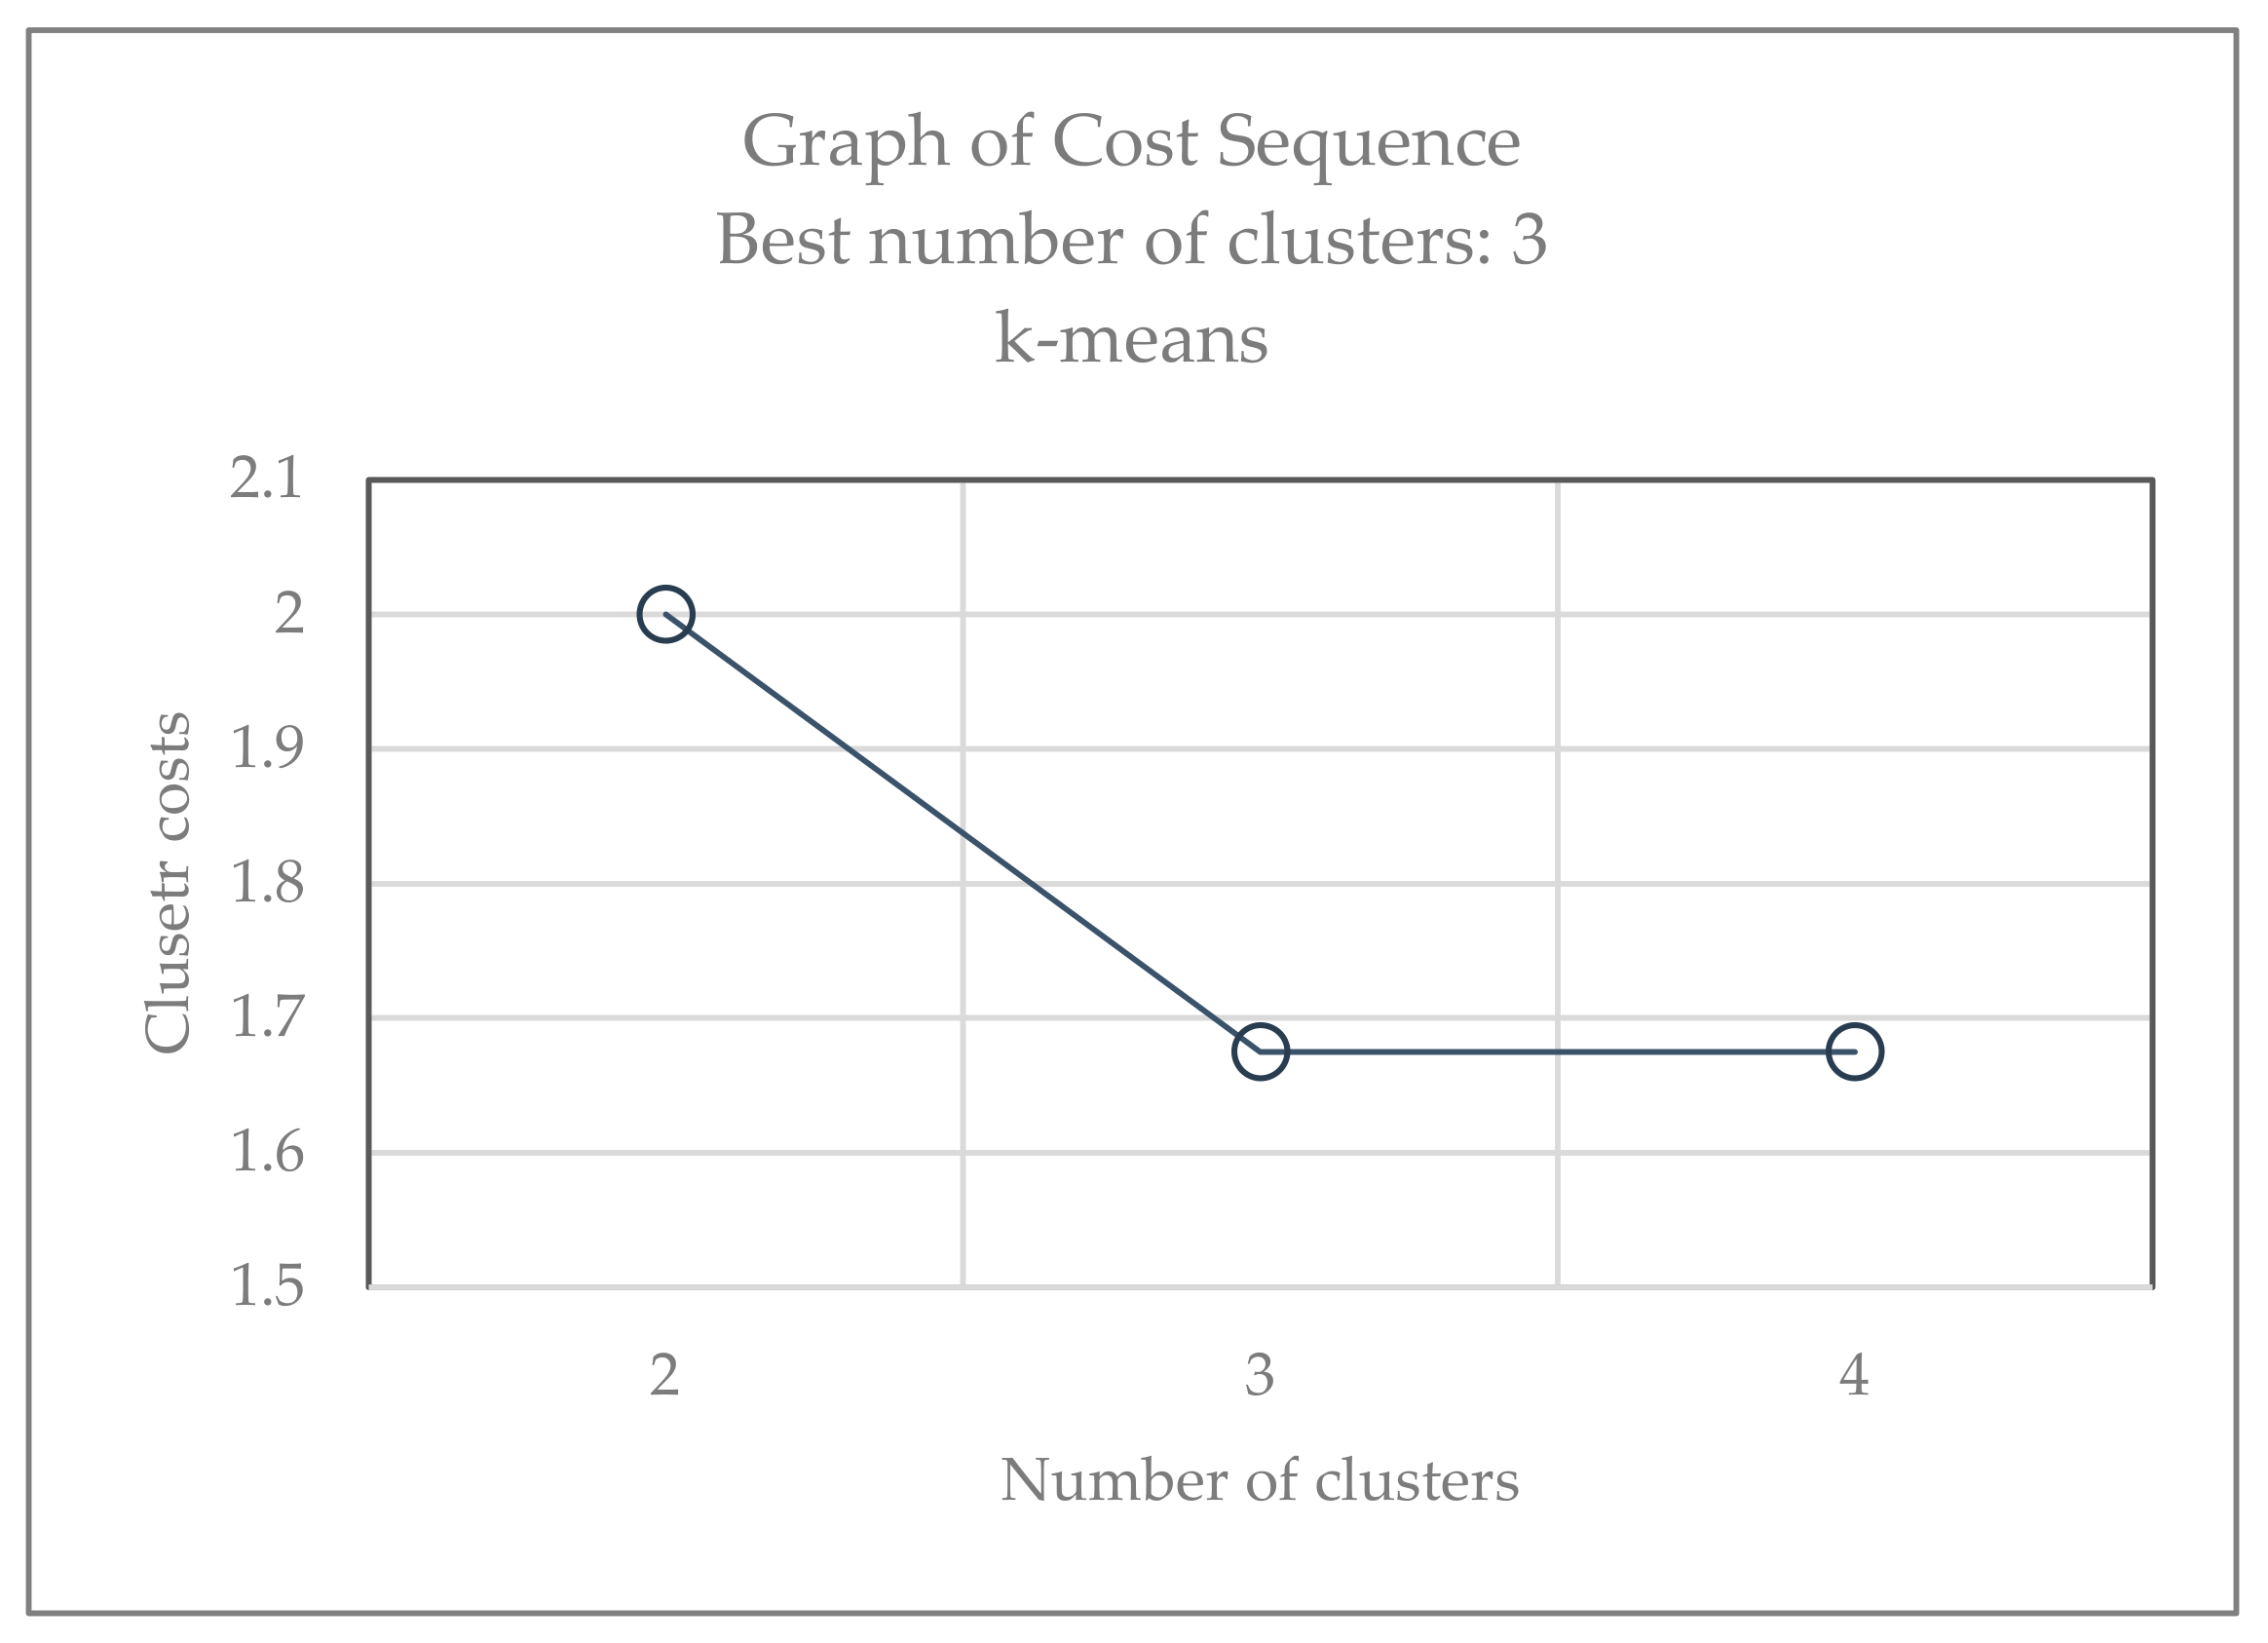
The graph of the cost sequence is presented in Figure 1, which shows an error function for the different numbers of cluster solutions.
The error function presented in Figure 1 can be defined as an “average distance of observations in testing samples to the cluster centroids to which the observations were assigned” [46]. The goal was to minimize the cost to the eligible level, and the “elbow” method [43] was used for this purpose. As is noticeable from Figure 1, the graph displays an elbow at three clusters. Increasing the number of clusters over three does not decrease the error function. Thus, the graph indicates that the three-cluster solution would be optimal in our case. Therefore, the k-means analysis was conducted with three clusters.
The ANOVA analysis of the clustering variables is shown in Table 3, indicating that all clustering variables are statistically significant for the formation of clusters. In other words, the average values of the variable across clusters are statistically different among each other, confirming that unique clusters of countries can be identified.
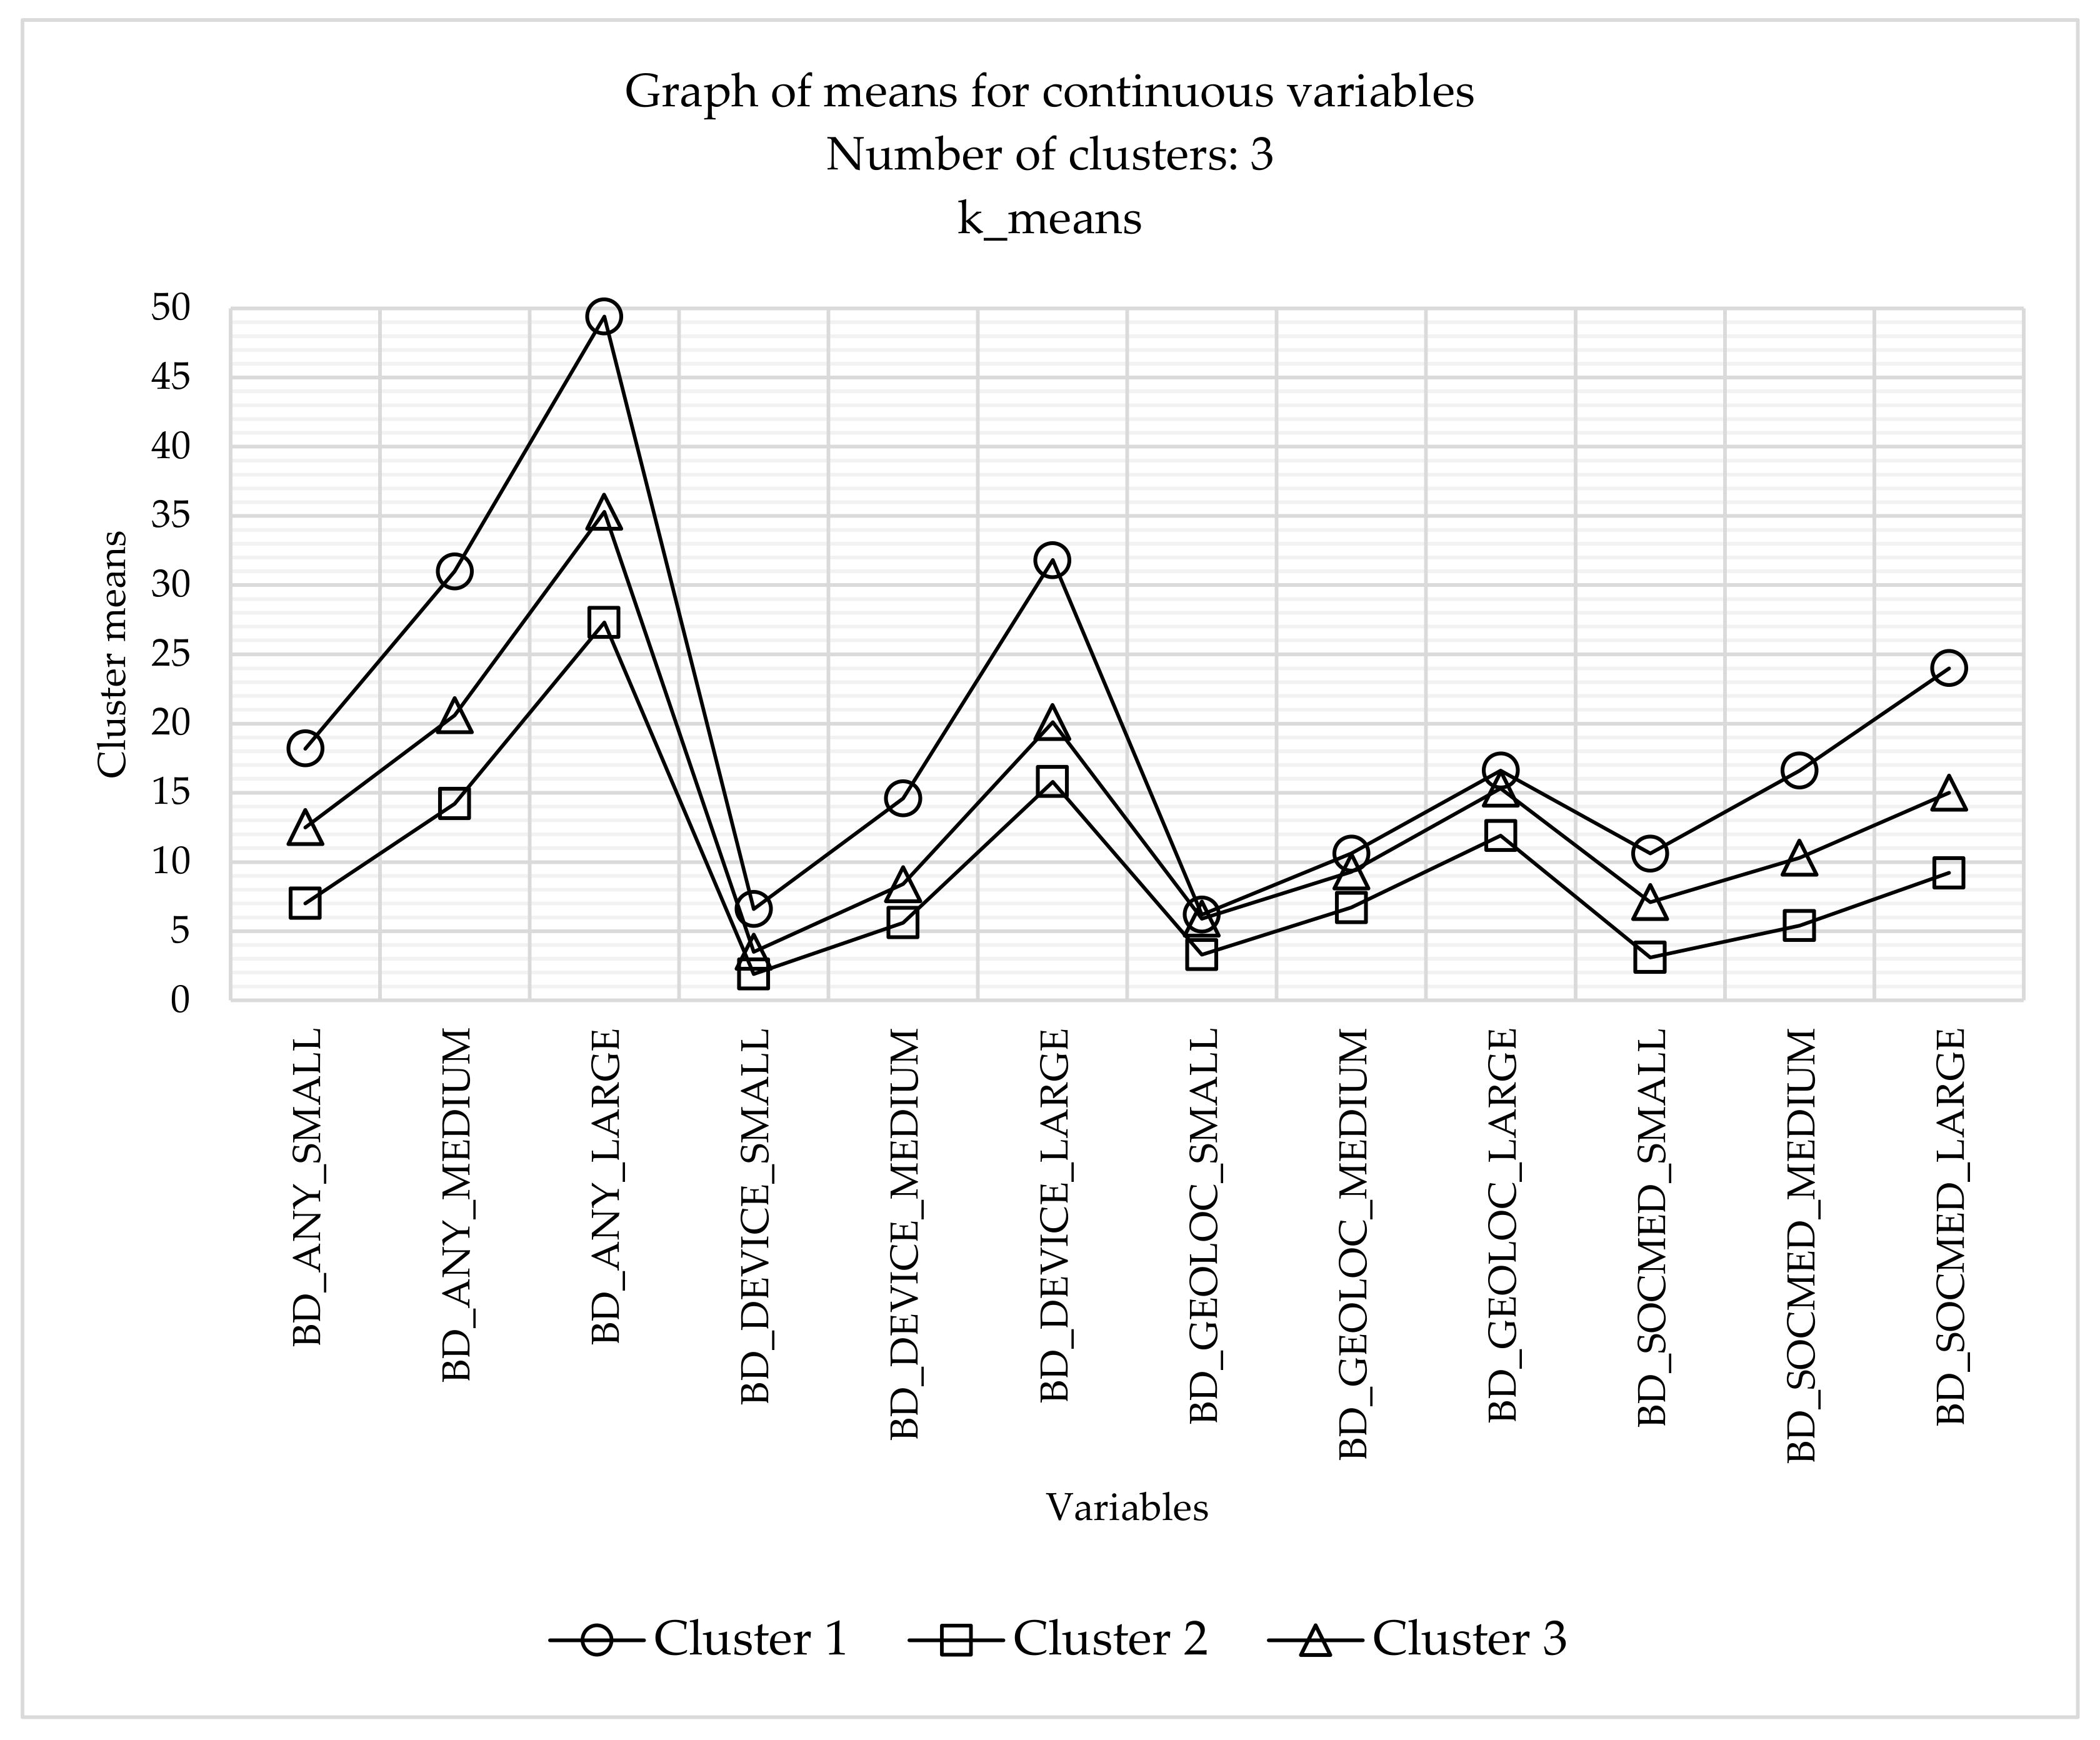
Countries that are members of Cluster 1 have the overall highest usage of big data analysis, taking into account all the observed variables, followed by Cluster 3 (Table 4). On the other hand, the lowest mean values are noticed for the enterprises of the European countries within Cluster 2. Moreover, large enterprises analyze big data more than medium and small ones, for almost all of the data sources analyzed. Figure 2 presents the graph of the clusters’ means of observed variables across the clusters.

3.3. Geographical Distribution of Clusters

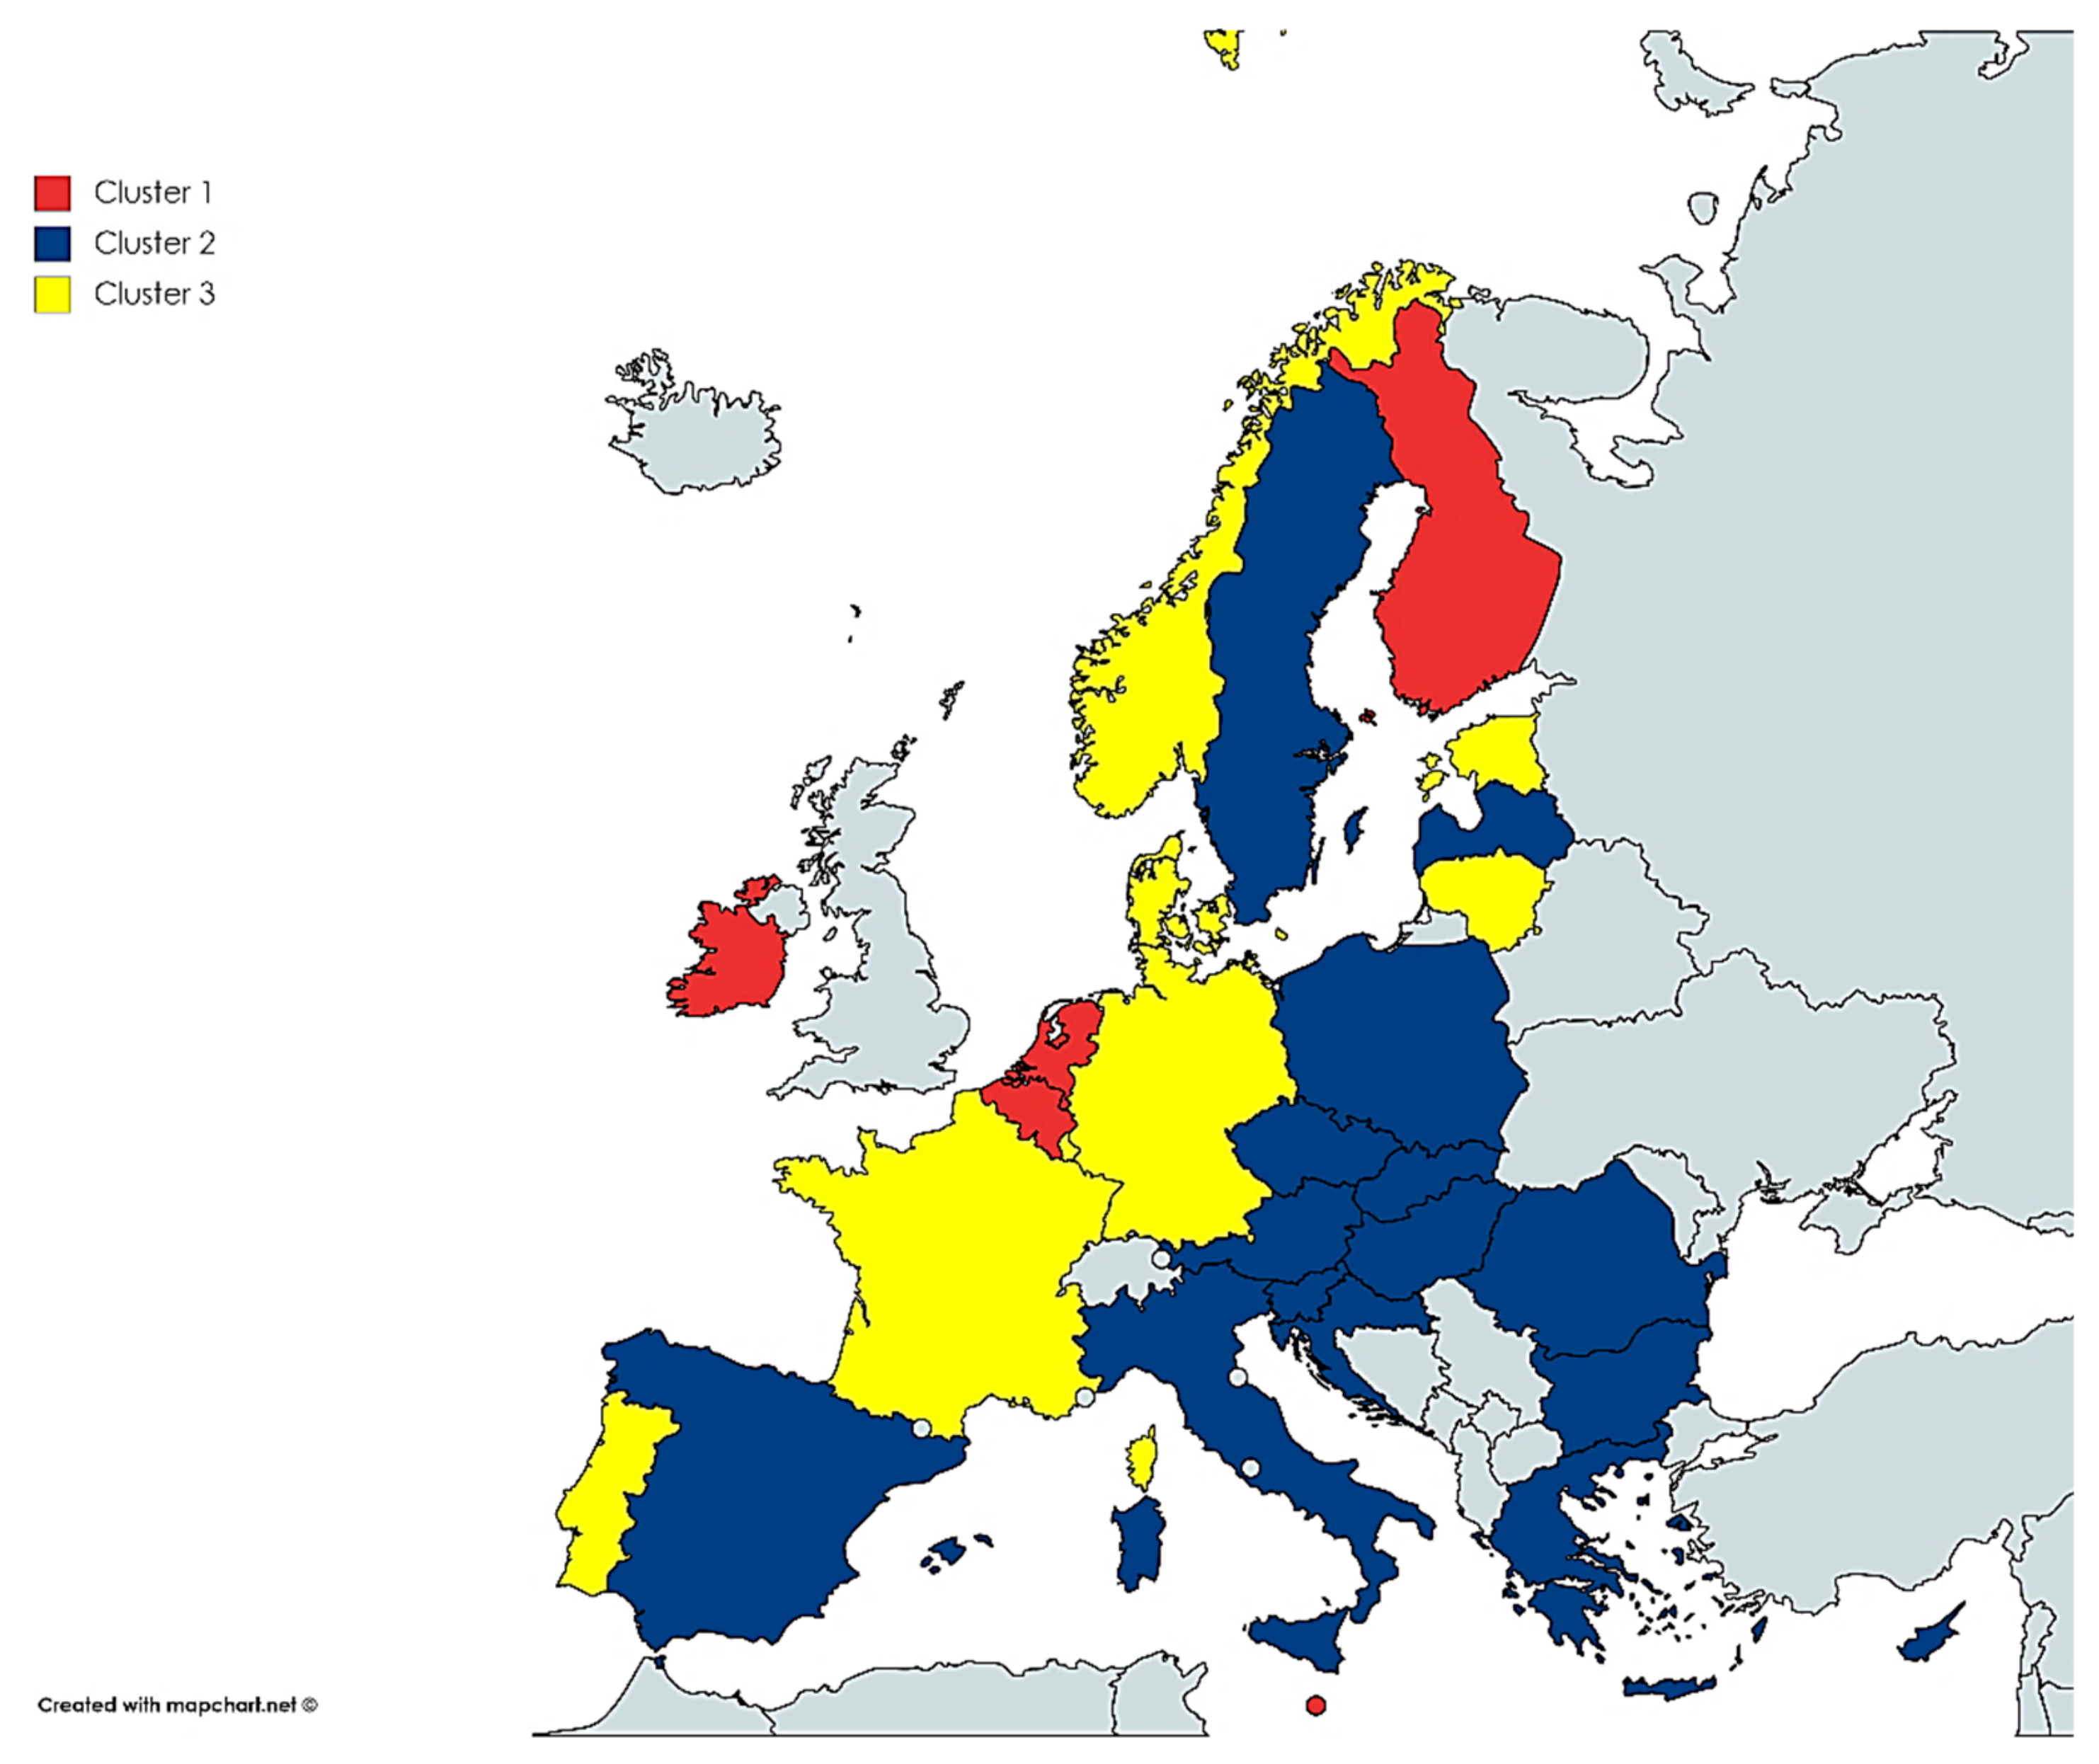
To provide an answer to the first research question (RQ1) that investigates the level of big data digital divide among European countries in small, medium, and large enterprises, taking into account various sources of big data, the geographical distribution of the clusters has been analyzed. Table 5 presents the distribution of the observed 28 European countries according to clusters, and Figure 3 presents the distribution of clusters of the European countries according to their geographical position. Cluster 1 has the highest mean values of all observed variables, and it contains the following countries: Belgium, Finland, Ireland, Malta, and the Netherlands, which is 18% of the observed sample. Cluster 2 comprises the majority of the observed countries, 15 of them, which is 54.5% of the observed sample, including Austria, Bulgaria, Croatia, Cyprus, Czechia, Greece, Hungary, Italy, Latvia, Poland, Romania, Slovakia, Slovenia, Spain, and Sweden. Cluster 3 comprises the following countries: Denmark, Estonia, France, Germany, Lithuania, Luxembourg, Portugal and Norway, which is 28.5% of the observed sample.
It can be noted that the countries in Cluster 1, in which enterprises use big data to the highest extent compared to the other two clusters, are among the most developed countries in Europe. Countries in Cluster 3 are also among the most developed, and they are following the countries in Cluster 1 according to the big data usage among their enterprises. Cluster 2 contains the largest number of post-transition countries that are lagging in terms of economic development, such as Bulgaria, Greece, Romania, Slovakia, and Croatia. This cluster also contains developed countries, such as Sweden and Austria. It can be concluded that the big data digital divide is present in European countries, especially among large companies, among which the difference between the clusters is the highest (Figure 2). Although our results are informative and indicate the substantial differences between the usage of big data between more developed and less developed European countries, they should be taken into account when considering the practices of the global economy according to which the enterprises often operate in more than one country, organized as subsidies or large multinational corporations.

3.4. Relationship between Big Data Utilization and Source of Expertise (Internal or External)

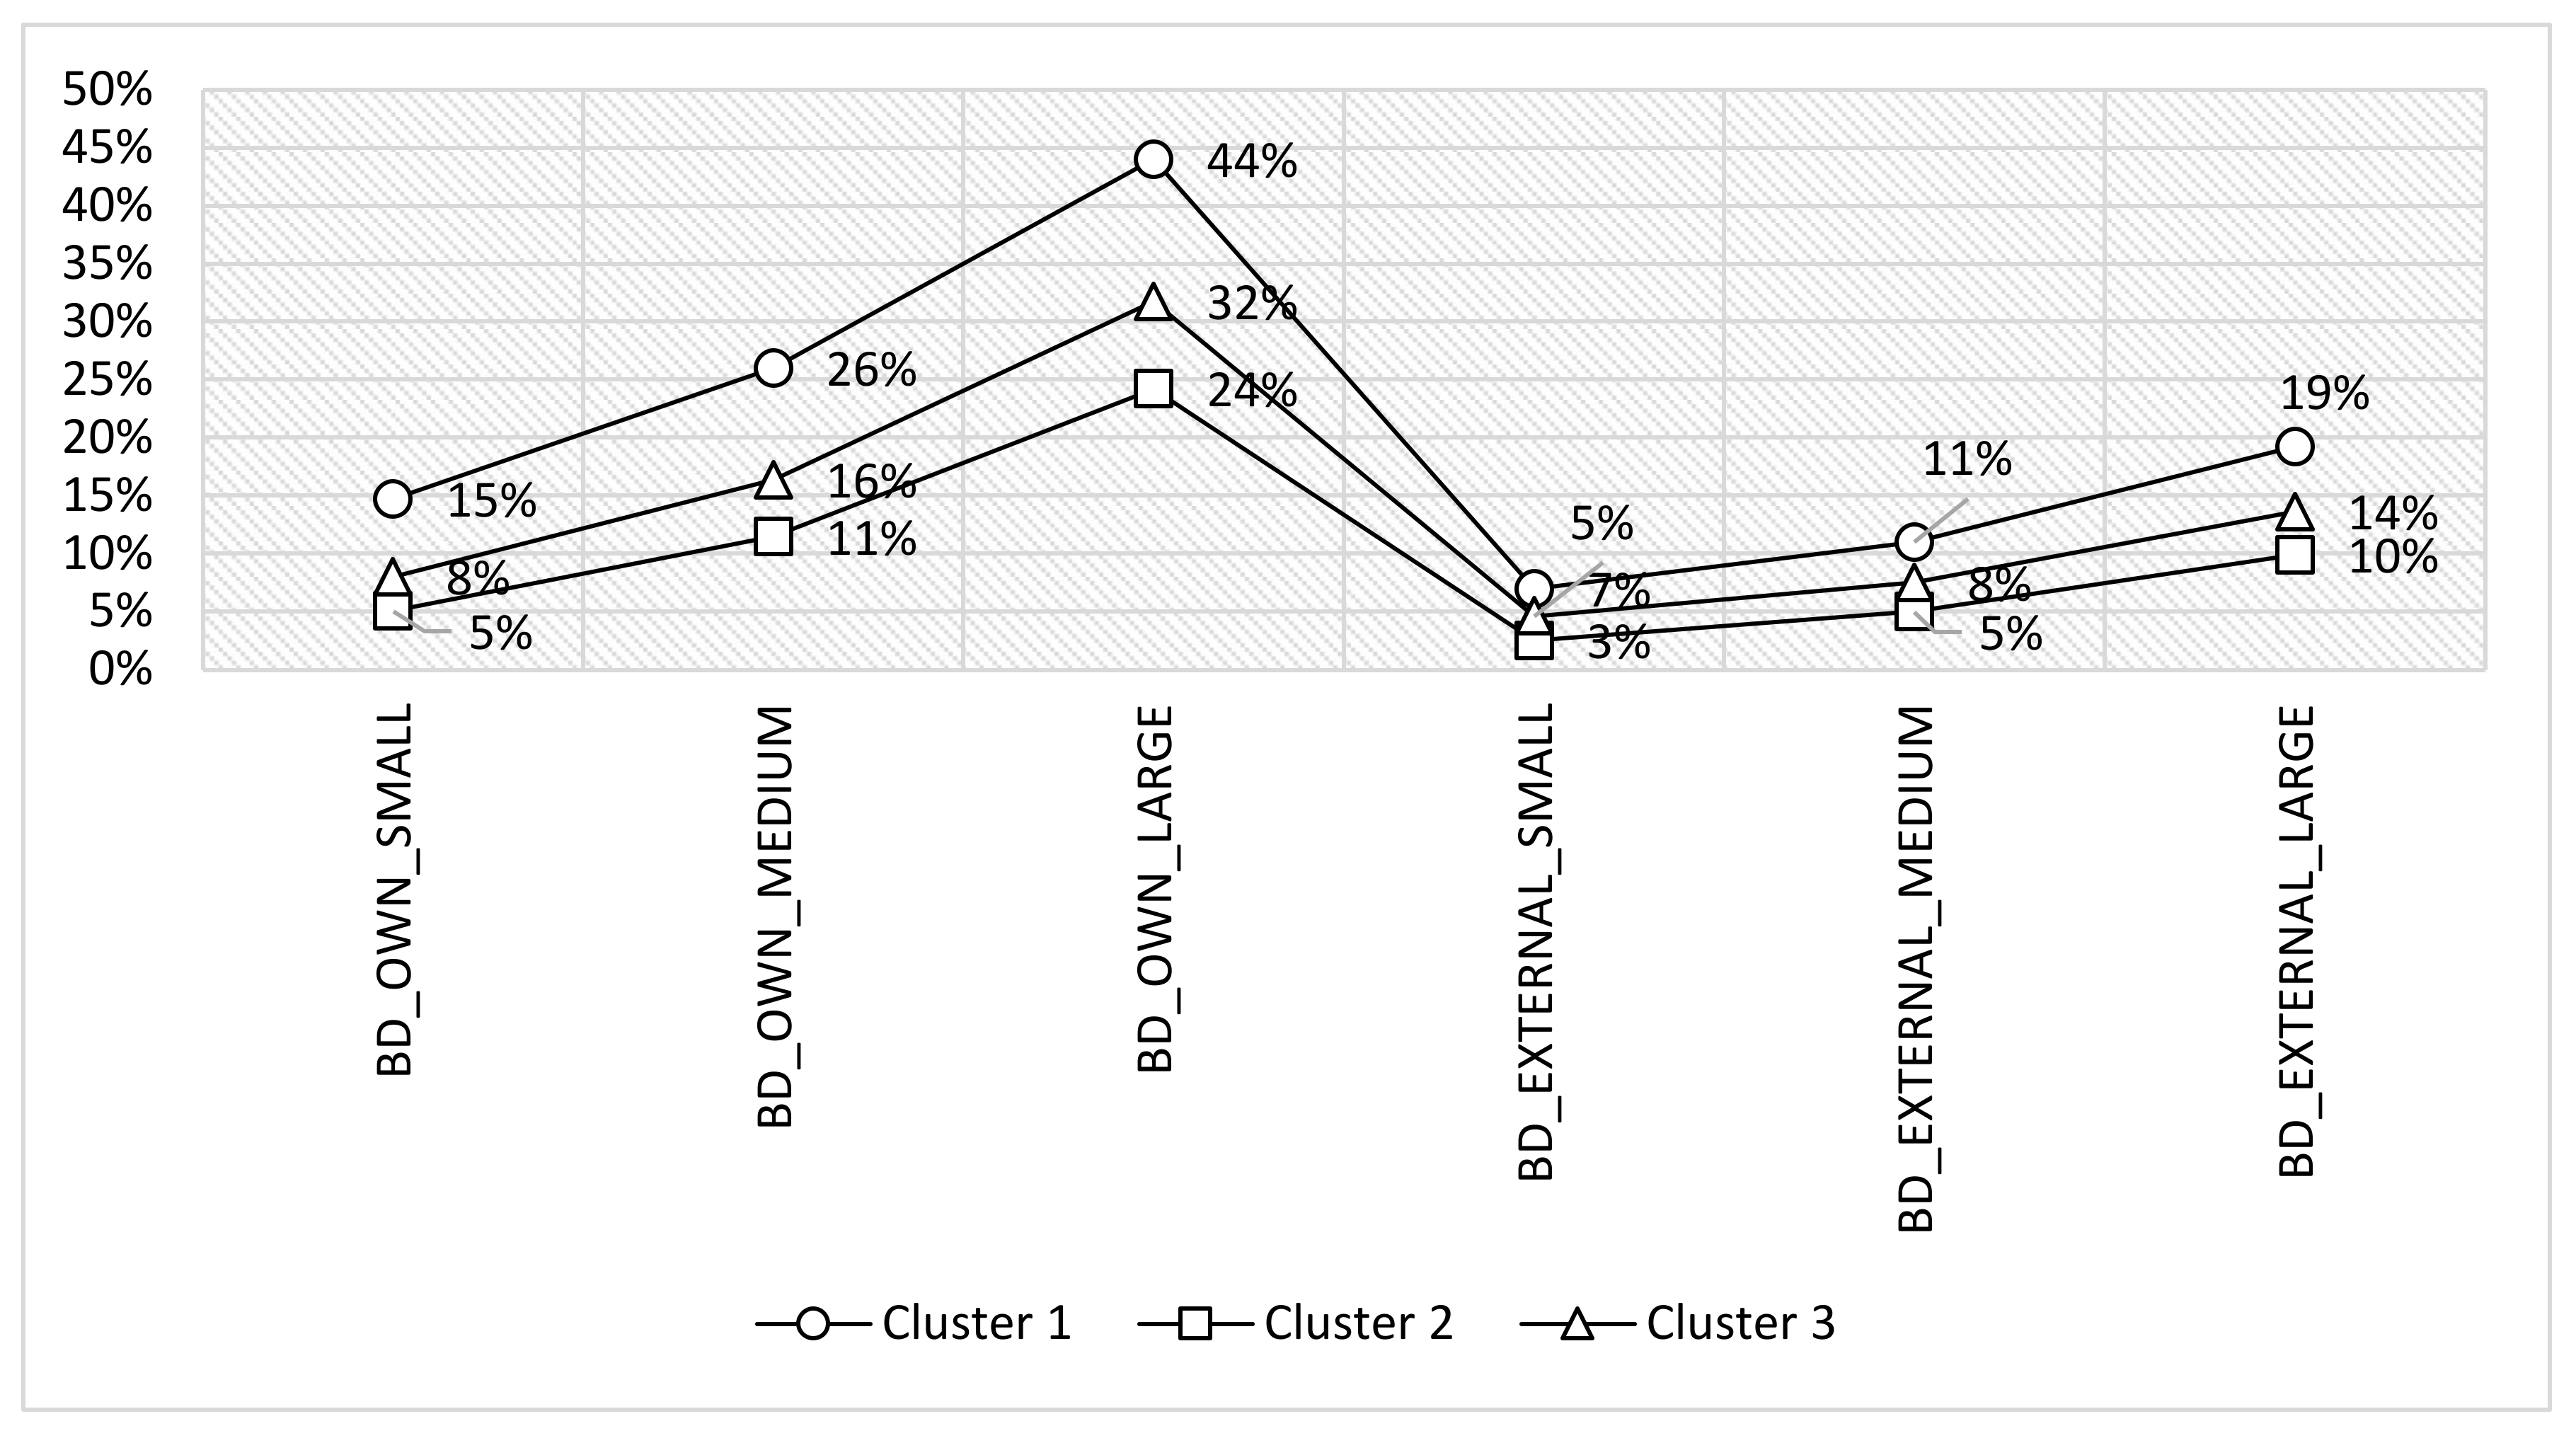
The second research question (RQ2) refers to the investigation of the relationship between big data utilization and source of expertise, which can be internal or external. Therefore, the average values of the big data source of expertise across clusters have been calculated and presented in Figure 4. The results of the analysis reveal that the highest average values are noticed the Cluster 1, followed by Cluster 2. Once again, the lowest average values, compared to other clusters, have been calculated for the countries belonging to Cluster 2. However, it can be noted that the differences are the largest between the clusters for the usage of internal expertise in large enterprises. A similar trend has been observed among medium-sized enterprises. On the other side, the differences are the smallest between the clusters for the usage of both external and internal expertise in small enterprises.
Table 6 presents in detail the mean values of the percentage of enterprises in each cluster according to the usage of external and internal expertise for big data analysis. For example, 14.75% of small enterprises are using the internal expertise for big data analysis in Cluster 1, 5.08% in Cluster 2, and 8% in Cluster 3. ANOVA analysis revealed that these differences are statistically significant for all the observed variables at a 1% significance level.
Since the usage of internal expertise is the highest in Cluster 1 compared to other two clusters, and the observed differences are lower according to the usage of external expertise, it can be concluded that the usage of internal expertise significantly contributes to the overall usage of big data in European enterprises, especially in the case of large and medium enterprises.

3.5. Relationship between Big Data Utilization and Industry Type

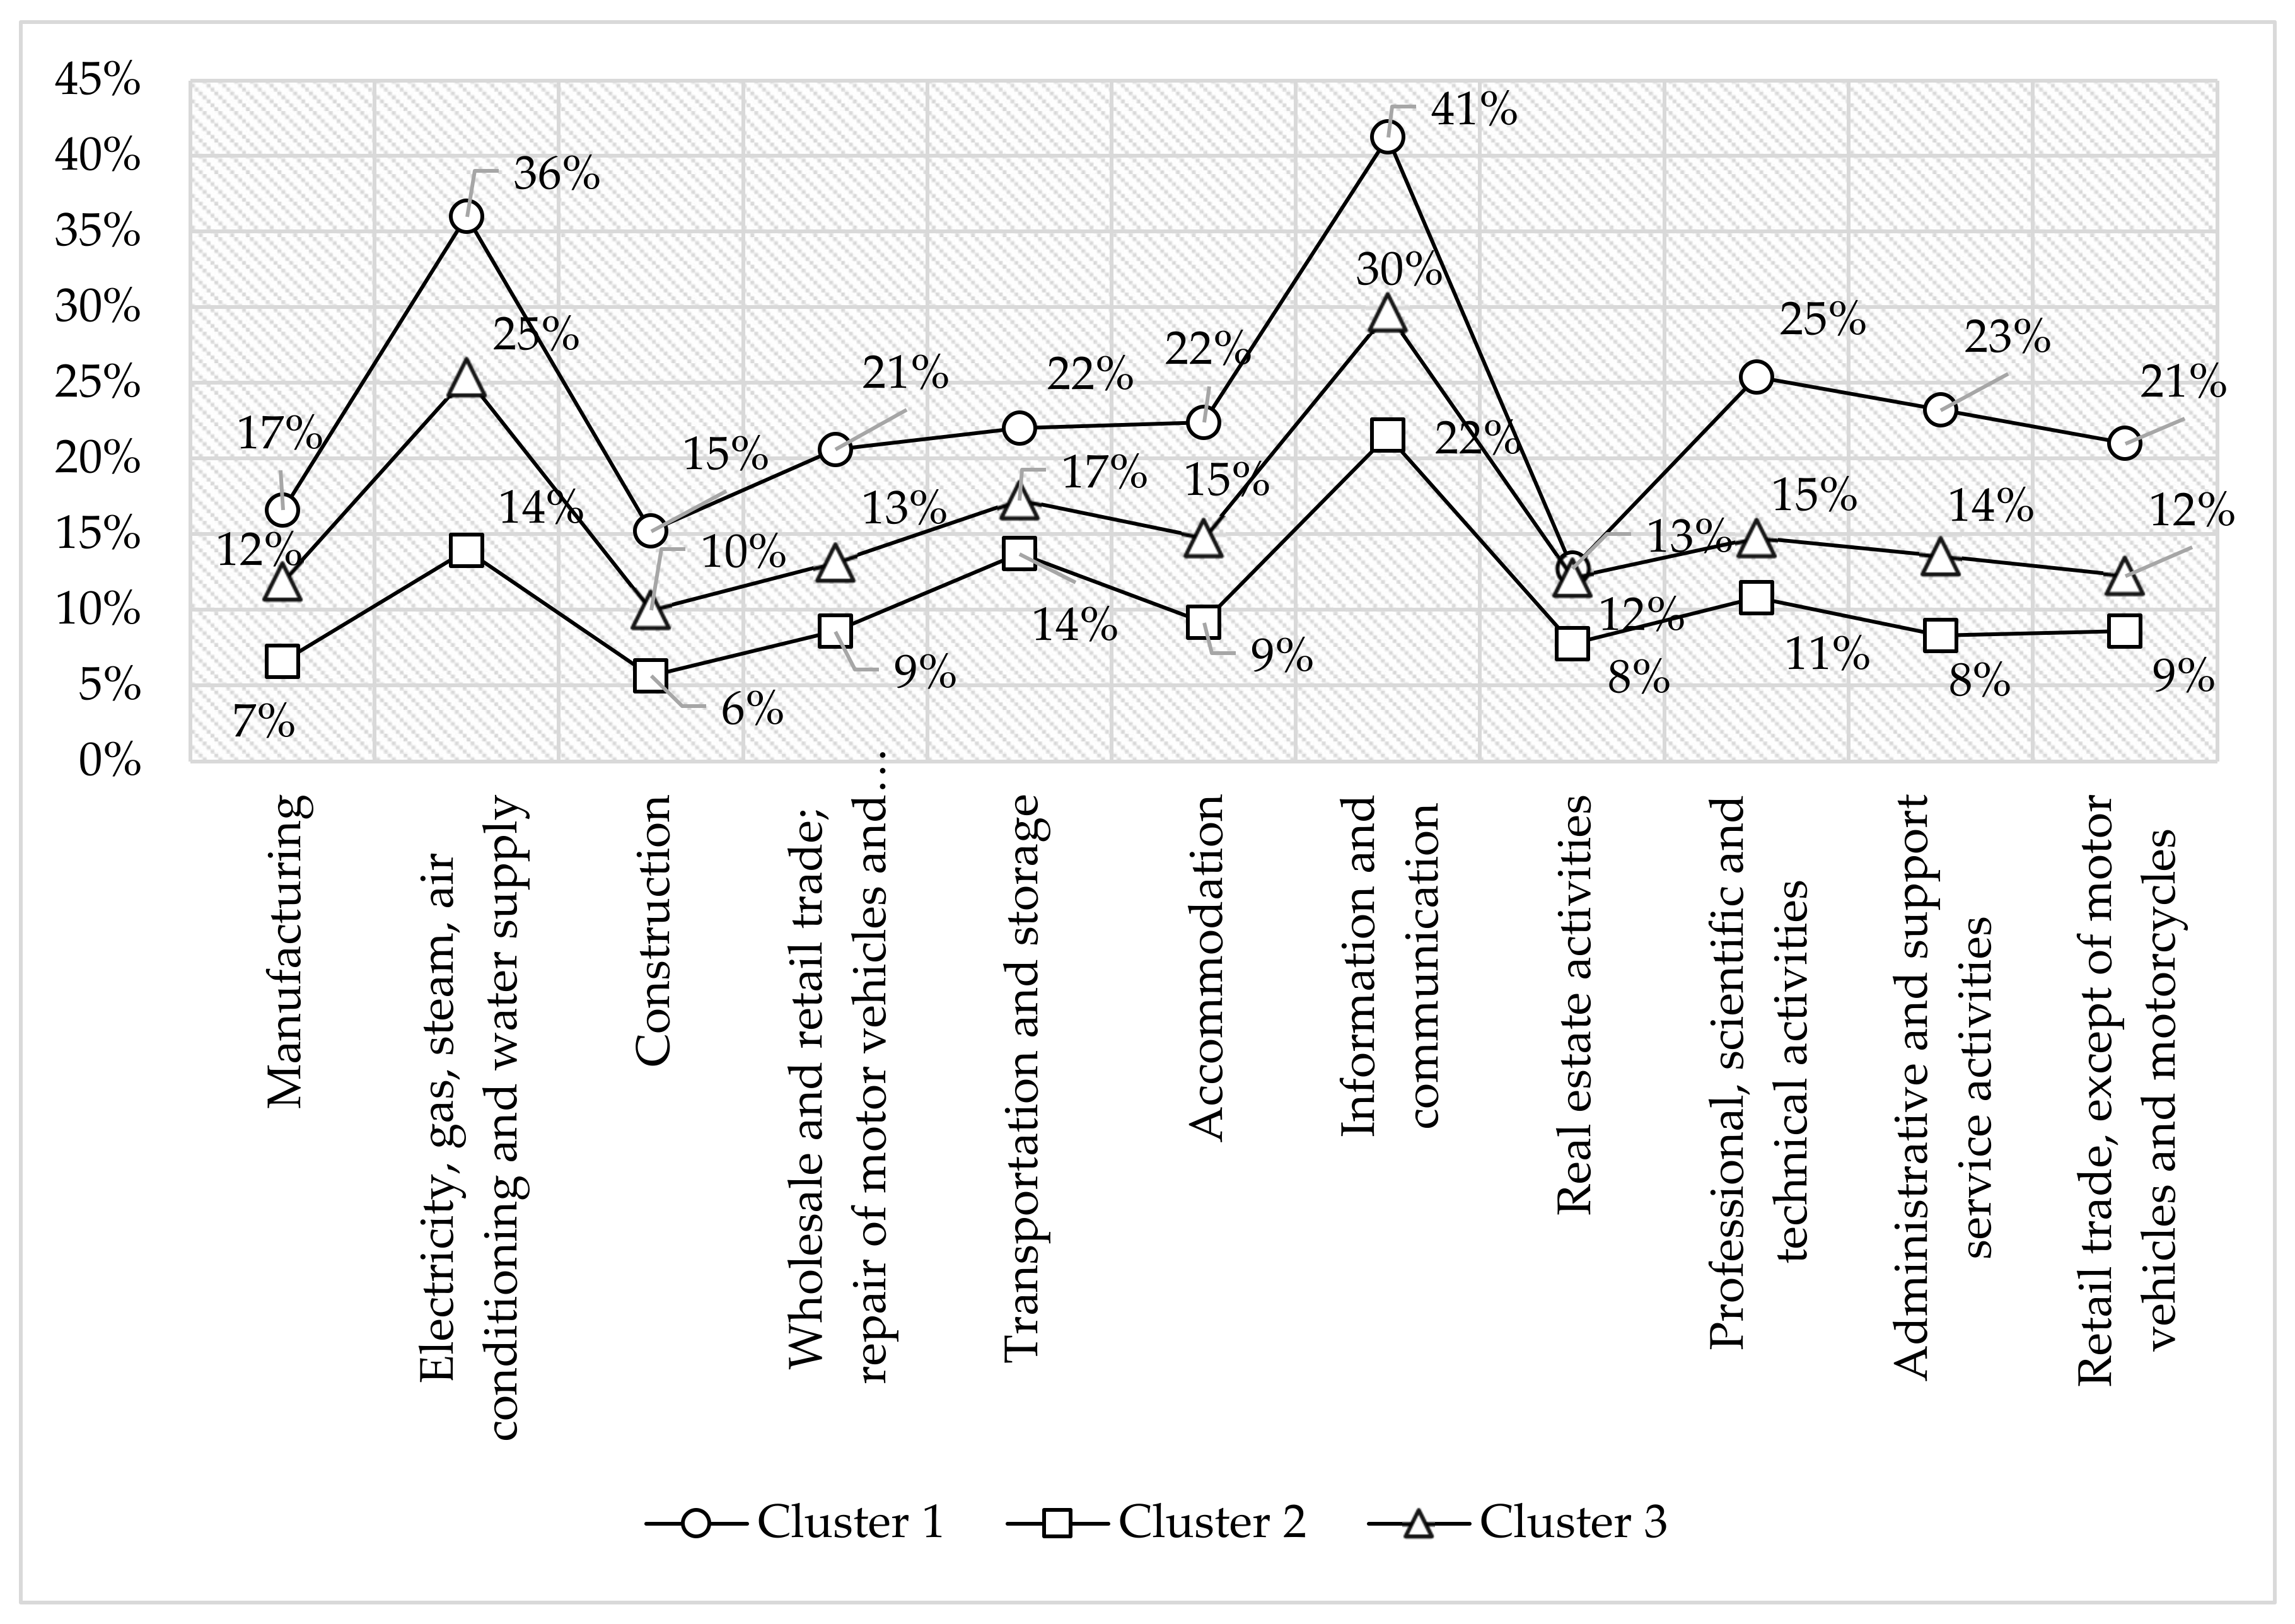
The last research question referred to the relationship between big data utilization and industry type (RQ3). Figure 5 presents the average usage of any big data source among countries in three clusters, according to specific industries. In all observed industry types, Cluster 1 achieved the highest average values regarding big data utilization in comparison to the other two clusters. In line with the results of other research questions, Cluster 2 has the lowest average values of big data usage for all the observed industry types. The highest average values have been achieved in the Information and communication industry, followed by Electricity, gas, steam, air conditioning, and water supply.
Table 7 presents the results of the descriptive statistics of big data usage across industry types, as well as the results of the ANOVA analysis. For example, 16.6% of manufacturing enterprises are using big data in Cluster 1, 6.57% in Cluster 2, and 11.89% in Cluster 3. For most of the industries, the ANOVA analysis revealed that the observed differences are statistically significant at a 1% level. However, differences are statistically significant at a 5% level of the following industries Transportation and storage as well as the Real estate activities industry. In these industries, the observed mean values are also the most similar between the observed clusters, indicating that in these clusters, enterprises behave similarly. This result could be partially explained by the fact that these industries are among the most globalized, with enterprises that often operate in more than one country.

4. Discussion and Conclusion

The goal of the research was to investigate the level of digital divide among European countries according to the big data on the country level, and among different industries. Usage of big data helps enterprises to improve their competitiveness [7], which can be obtained in the following manner. First, big data allows enterprises to gather information about their customers, from social media and additional online sources, thus contributing to the big data-driven customer intelligence. Second, big data allows enterprises to gather information about their competitors, from the competitors’ websites, and various secondary sources, such as stock exchanges, thus contributing to the big data-driven competitive intelligence. Third, big data supports companies in the utilization of Industry 4.0, thus contributing to the big data-driven process intelligence.
The first research question (RQ1) aims to reveal the differences among enterprises in European countries according to the usage of big data technologies in small, medium, and large enterprises. The results of the analysis revealed that the European countries can be divided into three homogenous clusters with distinctive differences between them according to the level of big data usage. The highest overall usage of big data is observed in Cluster 1, closely followed by Cluster 3, both of which mostly comprise the most developed European countries. The usage of big data is lowest in Cluster 2, which mostly comprises the post-transition developing European countries. Therefore, it can be concluded that the digital divide is present in European countries according to the usage of big data in its enterprise, however, taking into account the fact that a substantial number of enterprises operate in more than one country, such as multinational companies.
The second research question (RQ2) referred to the impact of using internal or external expertise for big data analysis. The results revealed that enterprises that use big data more often, rely, at the same time, on their internal experts far more than external service providers. This trend is more present in large enterprises compared to small and middle ones.
The third research question (RQ3) referred to the level of big data usage in various industries. The results revealed that in all observed industry types, enterprises belonging to Cluster 1 (the best performing cluster) had the highest average values compared to the other two clusters, while those from Cluster 3 had the lowest ones. Within the Cluster 1 results, the highest average values have been achieved by enterprises in Information and communication industry, followed by the Electricity, gas, steam, air conditioning, and water supply, which leads to the conclusion that such industries are the most efficient in big data utilization and its conversion to business value.
Our research contributes to several lines of research, resulting in the following theoretical contributions: (i) the confirmation of the research results about the leadership of Northern European countries in terms of the technological innovations; (ii) there are substantial differences between the industries in terms of big data usage, with the manufacturing industry lagging, which can be a signal of a worrisome trend of the European countries lagging behind other leaders of Industry 4.0, such as the USA and China; and (iii) large enterprises continue to be the most effective in the utilization of innovative technologies, which is also a signal of substantial obstacles faced by the small companies in the implementation of big data that could, in turn, further curb their growth and competitiveness. These contributions will be elaborated on with more details in the following sections.
First, we confirm the results of the previous research that the Northern European countries are leading according to the utilization of innovative industries, such as big data. Although the information technology development of the European Union is one of the highest in the world, a digital divide is manifested internally, among the member states [48,49]. Northern European countries still have a significantly greater percentage of citizens connected to the internet, in part likely to increasing capabilities of the hardware and decreasing cost of electronic goods and services, such as internet services, computer software, and accessories, as well as personal computers [3]. This indicates that Northern European countries tend to experience fewer negative effects of automation, as the jobs in these countries are more complex and harder to automate. Therefore, a high level of digital development prevents the negative impact of technologies both at the country and enterprise level. On the other side, the low level of digital development reinforces the negative impact of technologies in less developed countries. Although the digital divide has decreased at the personal level among the developed European countries [49], the digital divide at the country level is decreasing slowly due to its complex relationship with economic development. In the new digital divide, Industry 4.0 will play a significant role, and one of the major disadvantaged groups will be those with low levels of education. This is where the predicted job loss will mostly occur, as routine jobs will be replaced by those requiring analytical and problem-solving skills, flexibility in decision making, and higher levels of education and training in certain topics, such as computer science, mechanical and electronic engineering. Those with a mix of all of these skills, i.e., mechatronic experts, will have a particular advantage in this new industry. Moreover, it is worth noting that it is predicted that jobs requiring social and interpersonal skills, creativity, and innovation will increase [50].
Second, our results revealed that several industries are leading to big data utilization, such as information technology. However, this is likely to be the result of the overall technical competence of their employees, since our research results revealed that enterprises mostly rely on internal big data experts. On the other hand, it is worrisome that European manufacturing enterprises that should be the leaders in Industry 4.0 revolution are lagging in terms of big data usage.
Third, we confirmed previous research that large companies are leading in the implementation of innovative technologies, such as big data. Therefore, large enterprises will have a great advantage in this regard, as they will possess the top talent and resources, thereby being better able to decide on the right technologies. However, future small enterprises or garage start-ups, due to their groundbreaking new ideas, might be able to compete well on this kind of market as well, as this was the case with top firms, such as Google, Facebook, and Amazon [50].
The practical implications of our work indicate the need for interventions in educational programs. First, higher education institutions should consider the introduction of a strong bachelor and master curriculum with a focus on big data acquisition, management, and analysis. Second, massive open online courses and life-learning program about big data should be introduced at national levels, since internationally available courses (e.g., Udemy, Coursera) are not sufficient for fulfilling the demand for big data skills. Such programs should be specially tailored for the usage of open source big data software that could be used by small enterprises, to fasten their efficiency in acquiring internal expertise for big data, and at the same time decreasing their costs. Moreover, our results are useful for the enterprises itself, which may be reluctant to hire or educate big data experts due to possible costs. However, our research results indicate that the availability of internal experts is the strongest incentive for the utilization of big data analysis, which is, in turn, a path towards increased competitiveness.
Limitations of this study refer to the fact that the research has been conducted on a sample of selected European countries with different legislations, history, and level of economic development, which can all influence big data usage and acceptance within an enterprise from a certain country. Moreover, we focused our research on country-level data, while the data on an enterprise-level could gain results that could provide more evidence on the efficiency of enterprises in using big data for tactical, operational, and strategic decision-making. Finally, the global economy allows enterprises to operate in more than one country, which should be taken into account when evaluating the results of our research. For these reasons, future research should expand this study to enterprises worldwide, focusing on an enterprise level.
Author Contributions

Conceptualization, M.P.B.; methodology, M.P.B. and D.S.V.; validation, M.P.B., D.S.V., and L.I.; formal analysis, M.P.B.; data curation, M.P.B.; writing—original draft preparation, D.S.V., L.I., M.M., and T.B.; writing—review and editing, M.P.B.; visualization, T.B.; supervision, M.M. All authors have read and agreed to the published version of the manuscript.

Funding

This research was funded by the Croatian Science Foundation; grant number HRZZ-IP-2014-09-3729.

Acknowledgments

This research has been fully supported by the Croatian Science Foundation under the PROSPER (Process and Business Intelligence for Business Performance) project (IP-2014-09-3729).

Conflicts of Interest

The authors declare no conflict of interest.

References

  1. Cruz-Jesus, F.; Oliveira, T.; Bacao, F. The global digital divide. J. Glob. Inf. Manag. 2018, 26, 1–26. [Google Scholar] [CrossRef]
  2. Pejić Bach, M.; Zoroja, J.; Bosilj Vukšic, V. Review of corporate digital divide research: A decadal analysis (2003-2012). Int. J. Inf. Syst. Proj. Manag. 2013, 1, 41–55. [Google Scholar] [CrossRef]
  3. Hubregtse, S. The digital divide within the European Union. New Libr. World 2005, 106, 164–172. [Google Scholar] [CrossRef]
  4. Nishijima, M.; Ivanauskas, T.M.; Sarti, F.M. Evolution and determinants of digital divide in Brazil (2005–2013). Telecomm. Policy 2017, 41, 12–24. [Google Scholar] [CrossRef]
  5. Xu, L.; Xu, E.; Li, L. Industry 4.0: State of the art and future trends. Int. J. Prod. Res. 2018, 56, 2941–2962. [Google Scholar] [CrossRef] [Green Version]
  6. Witkowski, K. Internet of Things, Big data, Industry 4.0–Innovative solutions in logistics and supply chains management. Procedia Eng. 2017, 182, 763–769. [Google Scholar] [CrossRef]
  7. McAfee, A.; Brynjolfsson, E. Big data: The management revolution. Harv. Bus. Rev. 2012, 90, 60–68. [Google Scholar]
  8. Akoka, J.; Comyn-Wattiau, I.; Laoufi, N. Research on Big Data–A systematic mapping study. Comput. Stand. Inter. 2017, 54, 105–115. [Google Scholar] [CrossRef]
  9. Sagiroglu, S.; Sinanc, D. Big data: A review. In Proceedings of the 2013 International Conference on Collaboration Technologies and Systems (CTS), San Diego, CA, USA, 20–24 May 2013; pp. 42–47. [Google Scholar] [CrossRef]
  10. Gandomi, A.; Haider, M. Beyond the hype: Big data concepts, methods, and analytics. Int. J. Inf. Manag. 2015, 35, 137–144. [Google Scholar] [CrossRef] [Green Version]
  11. Brynjolfsson, E.; McAfee, A. The business of artificial intelligence: What it can and cannot do for your organization. Harv. Bus. Rev. 2017, 1–20. Available online: https://hbr.org/cover-story/2017/07/the-business-of-artificial-intelligence (accessed on 30 January 2020).
  12. Granville, V. Developing Analytic Talent: Becoming a Data Scientist; John Wiley & Sons: Indianapolis, IN, USA, 2014. [Google Scholar]
  13. Rao, A. CMS Releases More than One Petabyte of Open Data. CERN News. 2012. Available online: https://home.cern/news/news/experiments/cms-releases-more-one-petabyte-open-data (accessed on 30 January 2020).
  14. Ransbotham, S.; Gerbert, P.; Reeves, M.; Kiron, D.; Spira, M. Artificial intelligence in business gets real: Pioneering enterprises aim for AI at scale. MIT Sloan Manag. Rev. 2018. Available online: https://sloanreview.mit.edu/projects/artificial-intelligence-in-business-gets-real/ (accessed on 30 January 2020).
  15. Tiwari, S.; Wee, H.M.; Daryanto, Y. Big data analytics in supply chain management between 2010 and 2016: Insights to industries. Comput. Ind. Eng. 2018, 115, 319–330. [Google Scholar] [CrossRef]
  16. Li, S.; An, A.; Wu, H.; Hou, C.; Cai, Y.; Han, X.; Wang, Y. Policy to cope with deadlocks and livelocks for flexible manufacturing systems using the max′-controlled new smart siphons. IET Control Theory A. 2014, 8, 1607–1616. [Google Scholar] [CrossRef]
  17. Rathinasabapathy, R.; Elsass, M.J.; Josephson, J.R.; Davis, J.F. A smart manufacturing methodology for real time chemical process diagnosis using causal link assessment. AIChE J. 2016, 62, 3420–3431. [Google Scholar] [CrossRef]
  18. Moyne, J.; Iskandar, J. Big Data analytics for smart manufacturing: Case studies in semiconductor manufacturing. Processes 2017, 5, 39. [Google Scholar] [CrossRef] [Green Version]
  19. Ramakrishna, S.; Khong, T.C.; Leong, T.K. Smart manufacturing. Procedia Manuf. 2017, 12, 128–131. [Google Scholar] [CrossRef]
  20. Reis, M.; Gins, G. Industrial process monitoring in the Big data/Industry 4.0 era: From detection, to diagnosis, to prognosis. Processes 2017, 5, 35. [Google Scholar] [CrossRef] [Green Version]
  21. Caggiano, A. Cloud-based manufacturing process monitoring for smart diagnosis services. Int. J. Comput. Integr. Manuf. 2018, 31, 612–623. [Google Scholar] [CrossRef]
  22. He, Q.P.; Wang, J. Statistical process monitoring as a big data analytics tool for smart manufacturing. J. Process Control 2018, 67, 35–43. [Google Scholar] [CrossRef]
  23. Chen, H.; Chiang, R.H.L.; Storey, V.C. Business intelligence and analytics: From Big data to big impact. MIS Q. 2012, 36, 1165–1188. [Google Scholar] [CrossRef]
  24. Gepp, A.; Linnenluecke, M.K.; O’Neill, T.J.; Smith, T. Big data techniques in auditing research and practice: Current trends and future opportunities. J. Account. Lit. 2018, 40, 102–115. [Google Scholar] [CrossRef] [Green Version]
  25. Agnellutti, C. Big Data: An Exploration of Opportunities, Values, and Privacy Issues; Nova Science Publishers: New York, NY, USA, 2014. [Google Scholar]
  26. Zhu, W. Analysis of the application of Big data in intelligent tourism mode. In Proceedings of the 2016 4th International Conference on Electrical & Electronics Engineering and Computer Science (ICEEECS 2016), Jinan, China, 15–16 October 2016; pp. 1179–1183. [Google Scholar] [CrossRef] [Green Version]
  27. Sheng, J.; Amankwah-Amoah, J.; Wang, X. A multidisciplinary perspective of big data in management research. Int. J. Prod. Econ. 2017, 191, 97–112. [Google Scholar] [CrossRef]
  28. Hu, H.; Wen, Y.; Chua, T.S.; Li, X. Toward scalable systems for Big data analytics: A technology tutorial. IEEE Access 2014, 2, 652–687. [Google Scholar] [CrossRef]
  29. Castelo-Branco, I.; Cruz-Jesus, F.; Oliveira, T. Assessing Industry 4.0 readiness in manufacturing: Evidence for the European Union. Comput. Ind. 2019, 107, 22–32. [Google Scholar] [CrossRef]
  30. Gardiner, A.; Aasheim, C.; Rutner, P.; Williams, S. Skill requirements in Big data: A content analysis of job advertisements. J. Comput. Inform. Syst. 2018, 58, 374–384. [Google Scholar] [CrossRef]
  31. MIT xPRO. Data Science and Big data Analytics: Making Data-Driven Decisions; Massachusetts Institute of Technology: Cambridge, MA, USA, 2019; Available online: https://learn-xpro.mit.edu/data-science (accessed on 30 January 2020).
  32. Rohrbeck, R. Harnessing a network of experts for competitive advantage: Technology scouting in the ICT industry. RD Manag. 2010, 40, 169–180. [Google Scholar] [CrossRef]
  33. Eurostat. 1 in 10 EU Businesses Analyses Big Data; European Commission: Geneva, Switzerland, 2017; Available online: https://ec.europa.eu/eurostat/web/products-eurostat-news/-/EDN-20170516-1 (accessed on 30 January 2020).
  34. Doong, S.H.; Ho, S.C. The impact of ICT development on the global digital divide. Electron. Commer. Res. Appl. 2012, 11, 518–533. [Google Scholar] [CrossRef]
  35. Cuervo, M.R.V.; Menéndez, A.J.L. A multivariate framework for the analysis of the digital divide: Evidence for the European Union-15. Inform. Manag. 2006, 43, 756–766. [Google Scholar] [CrossRef]
  36. Nardo, M.; Saisana, M.; Salteli, A.A.; Tarantola, S.; Hoffmann, A.; Giovannini, E. Handbook on Constructing Composite Indicators: Methodology and User Guide; OECD: Paris, France, 2008. [Google Scholar] [CrossRef]
  37. Formann, A.K. Die Latent-Class-Analyse: Einführung in die Theorie und Anwendung; Beltz: Weinheim, Germany, 1984. [Google Scholar]
  38. Dolnicar, S. A Review of Unquestioned Standards in Using Cluster Analysis for Data-Driven Market Segmentation; University of Wollongong: Wollongong, NSW, Australia, 2002; Available online: https://ro.uow.edu.au/commpapers/273/ (accessed on 30 January 2020).
  39. Sarstedt, M.; Mooi, E. A Concise Guide to Market Research: The Process, Data, and Methods Using IBM SPSS Statistics, 2nd ed.; Springer: Berlin/Heidelberg, Germany, 2014. [Google Scholar] [CrossRef]
  40. Rokach, L.; Maimon, O. Clustering methods. In Data Mining and Knowledge Discovery Handbook; Maimon, O., Rokach, L., Eds.; Springer: Berlin/Heidelberg, Germany, 2005; pp. 321–352. [Google Scholar] [CrossRef]
  41. Omran, M.G.H.; Engelbrecht, A.P.; Salman, A. An overview of clustering methods. Intell. Data Anal. 2007, 11, 583–605. [Google Scholar] [CrossRef]
  42. Kodinariya, T.M.; Makwana, P.R. Review on determining number of cluster in K-Means clustering. Int. J. Adv. Res. Comput. Sci. Manag. Stud. 2013, 1, 90–95. Available online: http://www.ijarcsms.com/docs/paper/volume1/issue6/V1I6-0015.pdf (accessed on 30 January 2020).
  43. Syakur, M.A.; Khotimah, B.K.; Rochman, E.M.S.; Satoto, B.D. Integration K-Means clustering method and Elbow method for identification of the best customer profile cluster. IOP Conf. Ser. Mater. Sci. Eng. 2018, 336, 012017. [Google Scholar] [CrossRef] [Green Version]
  44. Kramarić, T.P.; Pejić Bach, M.; Dumičić, K.; Žmuk, B.; Žaja, M.M. Exploratory study of insurance enterprises in selected post-transition countries: Non-hierarchical cluster analysis. Cent. Eur. J. Oper. Res. 2018, 26, 783–807. [Google Scholar] [CrossRef]
  45. Pejić Bach, M.; Vlahović, N.; Pivar, J. Self-organizing maps for fraud profiling in leasing. In Proceedings of the 41st International Convention on Information and Communication Technology, Electronics and Microelectronics (MIPRO), Opatija, Croatia, 21–25 May 2018; pp. 1203–1208. [Google Scholar]
  46. Statistica Help Example 1: Automatic Selection of the Best Number of Clusters from the Data. Available online: https://documentation.statsoft.com/STATISTICAHelp.aspx?path=Gxx/GeneralizedEMandkMeansClusterAnalysis/Example1AutomaticSelectionoftheBestNumberofClustersfromtheData (accessed on 30 January 2020).
  47. Statistica Help Generalized EM and k-Means Cluster Analysis Introductory Overview. Available online: https://documentation.statsoft.com/STATISTICAHelp.aspx?path=GXX/GeneralizedEMandkMeansClusterAnalysis/GeneralizedEMandkMeansClusterAnalysisIntroductoryOverview (accessed on 30 January 2020).
  48. Cruz-Jesus, F.; Oliveira, T.; Bacao, F.; Irani, Z. Assessing the pattern between economic and digital development of countries. Inform. Syst. Front. 2017, 19, 835–854. [Google Scholar] [CrossRef]
  49. Cruz-Jesus, F.; Vicente, M.R.; Bacao, F.; Oliveira, T. The education-related digital divide: An analysis for the EU-28. Comput. Hum. Behav. 2016, 56, 72–82. [Google Scholar] [CrossRef]
  50. Makridakis, S. The forthcoming Artificial Intelligence (AI) revolution: Its impact on society and firms. Futures 2017, 90, 46–60. [Google Scholar] [CrossRef]
Figure 1. Graph of the cost sequence.
Data 05 00025 g001
Figure 2. Graph of the cluster means.
Data 05 00025 g002
Figure 3. European countries according to clusters. Grey color indicates countries that were not included in the analysis.
Data 05 00025 g003
Figure 4. Average values of the big data source of expertise (internal or external) across clusters.
Data 05 00025 g004
Figure 5. Average values of big data utilization across industry types and clusters.
Data 05 00025 g005
Table 1. Variables on big data utilization in European countries used in the research.
Variable CodeVariable DescriptionMeasurementSample 1,2
Source of big data used in enterprises
BD_ANY_SMALLEnterprises analyzing big data from any data sourcePercentage in a countrySmall enterprises
BD_ANY_MEDIUMMedium enterprises
BD_ANY_LARGELarge enterprises
BD_DEVICE_SMALLAnalyze own big data from an enterprise’s smart devices or sensorsPercentage in a countrySmall enterprises
BD_DEVICE_MEDIUMMedium enterprises
BD_DEVICE_LARGELarge enterprises
BD_GEOLOC_SMALLAnalyze big data from geolocation of portable devicesPercentage in a countrySmall enterprises
BD_GEOLOC_MEDIUMMedium enterprises
BD_GEOLOC_LARGELarge enterprises
BD_SOCMED_SMALLAnalyze big data generated from social mediaPercentage in a countrySmall enterprises
BD_SOCMED_MEDIUMMedium enterprises
BD_SOCMED_LARGELarge enterprises
The expertise of big data used in enterprises
BD_OWN_SMALLBig data analysis for the enterprise is done by the enterprise’s own employeesPercentage in a countrySmall enterprises
BD_OWN_MEDIUMMedium enterprises
BD_OWN_LARGELarge enterprises
BD_EXTERNAL_SMALLBig data analysis for the enterprise is done by an external service providerPercentage in a countrySmall enterprises
BD_EXTERNAL_MEDIUMMedium enterprises
BD_EXTERNAL_LARGELarge enterprises
1 Small enterprises (10–49 persons employed), without financial sector; Medium enterprises (50–249 persons employed), without financial sector; Large enterprises (250 persons employed or more), without the financial sector; 2 Data are obtained for the year 2018.
Table 2. Descriptive statistics of the observed variables.
VariableNMinimumMaximumMeanStd. Deviation
Source of big data used in enterprises (in %)
BD_ANY_SMALL3232110.5704.826
BD_ANY_MEDIUM3283719.0407.131
BD_ANY_LARGE32175533.5009.822
BD_DEVICE_SMALL32183.2101.988
BD_DEVICE_MEDIUM323198.0004.037
BD_DEVICE_LARGE3293519.8907.544
BD_GEOLOC_SMALL32194.5702.185
BD_GEOLOC_MEDIUM324138.1402.563
BD_GEOLOC_LARGE3262113.7103.867
BD_SOCMED_SMALL322145.6103.392
BD_SOCMED_MEDIUM323228.7904.833
BD_SOCMED_LARGE3252813.5006.697
BD_ALL_SMALL32041.6401.150
BD_ALL_MEDIUM32173.7601.877
BD_ALL_LARGE323239.5605.050
The expertise of big data used in enterprises (in %)
BD_OWN_SMALL322187.5603.980
BD_OWN_MEDIUM3263115.3606.082
BD_OWN_LARGE32135029.8008.827
BD_EXTERNAL_SMALL32173.9202.060
BD_EXTERNAL_MEDIUM322126.7602.818
BD_EXTERNAL_LARGE3252612.6005.485
Table 3. ANOVA analysis, k-means clustering, h = 12 variables, k = 3 clusters, n = 28 countries.
VariableBetweendfWithindfFp-Value
Source of big data used in enterprises
BD_ANY_SMALL512.0572116.8002554.8010.000 ***
BD_ANY_MEDIUM1086.6892286.2752547.4500.000 ***
BD_ANY_LARGE1871.3672733.6332531.8850.000 ***
BD_DEVICE_SMALL82.581224.1332542.7730.000 ***
BD_DEVICE_MEDIUM305.3252134.6752528.3390.000 ***
BD_DEVICE_LARGE960.6042576.0752520.8440.000 ***
BD_GEOLOC_SMALL49.849279.008257.8870.002 ***
BD_GEOLOC_MEDIUM69.7952107.633258.1060.002 ***
BD_GEOLOC_LARGE108.0812295.633254.5700.020 **
BD_SOCMED_SMALL234.870275.8082538.7280.000 ***
BD_SOCMED_MEDIUM494.4142136.3002545.3420.000 ***
BD_SOCMED_LARGE846.6002364.4002529.0410.000 ***
*** statistically significant at 1%; ** 5%.
Table 4. Cluster means, k-means clustering, h = 12 variables, k = 3 clusters, n = 28 countries.
VariableCluster 1Cluster 2Cluster 3
Source of big data used in enterprises (in %)
BD_ANY_SMALL18.27.012.5
BD_ANY_MEDIUM31.014.220.6
BD_ANY_LARGE49.427.335.3
BD_DEVICE_SMALL6.61.93.5
BD_DEVICE_MEDIUM14.65.68.4
BD_DEVICE_LARGE31.815.820.1
BD_GEOLOC_SMALL6.23.35.9
BD_GEOLOC_MEDIUM10.66.79.3
BD_GEOLOC_LARGE16.611.915.3
BD_SOCMED_SMALL10.63.17.1
BD_SOCMED_MEDIUM16.65.410.3
BD_SOCMED_LARGE24.09.215.0
Table 5. Distribution of countries according to clusters.
ClusterCountries
Cluster 1Belgium, Ireland, Malta, Netherlands, Finland
Cluster 2Bulgaria, Czechia, Greece, Spain, Croatia, Italy, Cyprus, Latvia, Hungary, Austria, Poland, Romania, Slovenia, Slovakia, Sweden
Cluster 3Denmark, Germany, Estonia, France, Lithuania, Luxembourg, Portugal, Norway
Table 6. Descriptive statistics of the source of big data expertise according to clusters; ANOVA analysis.
VariableClusterNMeanStd. DeviationStd. ErrorFSig.
BD_OWN_SMALL1514.7502.8721.43634.6160.000 ***
2155.0802.0600.571
388.0001.5120.535
BD_OWN_MEDIUM1526.0005.5982.79931.6240.000 ***
21511.4602.8760.798
3816.3802.2640.800
BD_OWN_LARGE1544.0004.5462.27321.6610.000 ***
21524.2305.9181.641
3831.7504.5901.623
BD_EXTERNAL_SMALL157.0000.0000.00020.9100.000 ***
2152.5401.1980.332
384.6301.5980.565
BD_EXTERNAL_MEDIUM1511.0001.1550.57717.3260.000 ***
2155.0001.6830.467
387.5002.2680.802
BD_EXTERNAL_LARGE1519.2506.7023.3516.9060.005 ***
2159.9203.4270.950
3813.6304.8971.731
*** statistically significant at 1%.
Table 7. Descriptive statistics of big data utilization across industry types and clusters; ANOVA analysis.
Industry TypeClusterNMeanStd. DeviationStd. ErrorFSig.
Manufacturing1516.6001.6730.74838.2180.000 ***
2156.5701.5550.416
3811.8903.4081.136
Electricity. gas. steam. air conditioning and water supply1536.0003.4642.00014.5000.000 ***
21513.9208.6932.411
3825.3804.4061.558
Construction1515.2003.9621.77215.6130.000 ***
2155.6402.4680.660
3810.0004.2431.414
Wholesale and retail trade; repair of motor vehicles and motorcycles1520.6003.5071.56832.1830.000 ***
2158.5702.9280.782
3813.1102.5220.841
Transportation and storage1522.0002.3451.0494.4230.023 **
21513.7104.0271.076
3817.2508.2942.932
Accommodation1522.40010.0654.5017.8630.002 ***
2159.1504.2401.176
3814.7506.9232.448
Information and communication1541.2506.5003.25020.5860.000 ***
21521.5405.4101.500
3829.6705.3151.772
Real estate activities1512.7504.2722.1363.9730.034 **
2157.7503.9341.136
3812.1303.9801.407
Professional. scientific and technical activities1525.4008.4733.78915.9770.000 ***
21510.7904.2281.130
3814.7503.1961.130
Administrative and support service activities1523.2002.2801.02028.0680.000 ***
2158.2903.7501.002
3813.5604.5581.519
Retail trade. except of motor vehicles and motorcycles1521.0007.1063.17814.7130.000 ***
2158.5703.8171.020
3812.2503.2401.146
*** statistically significant at 1%; ** 5%.