Point of Sale (POS) Data from a Supermarket: Transactions and Cashier Operations


Abstract
:1. Summary
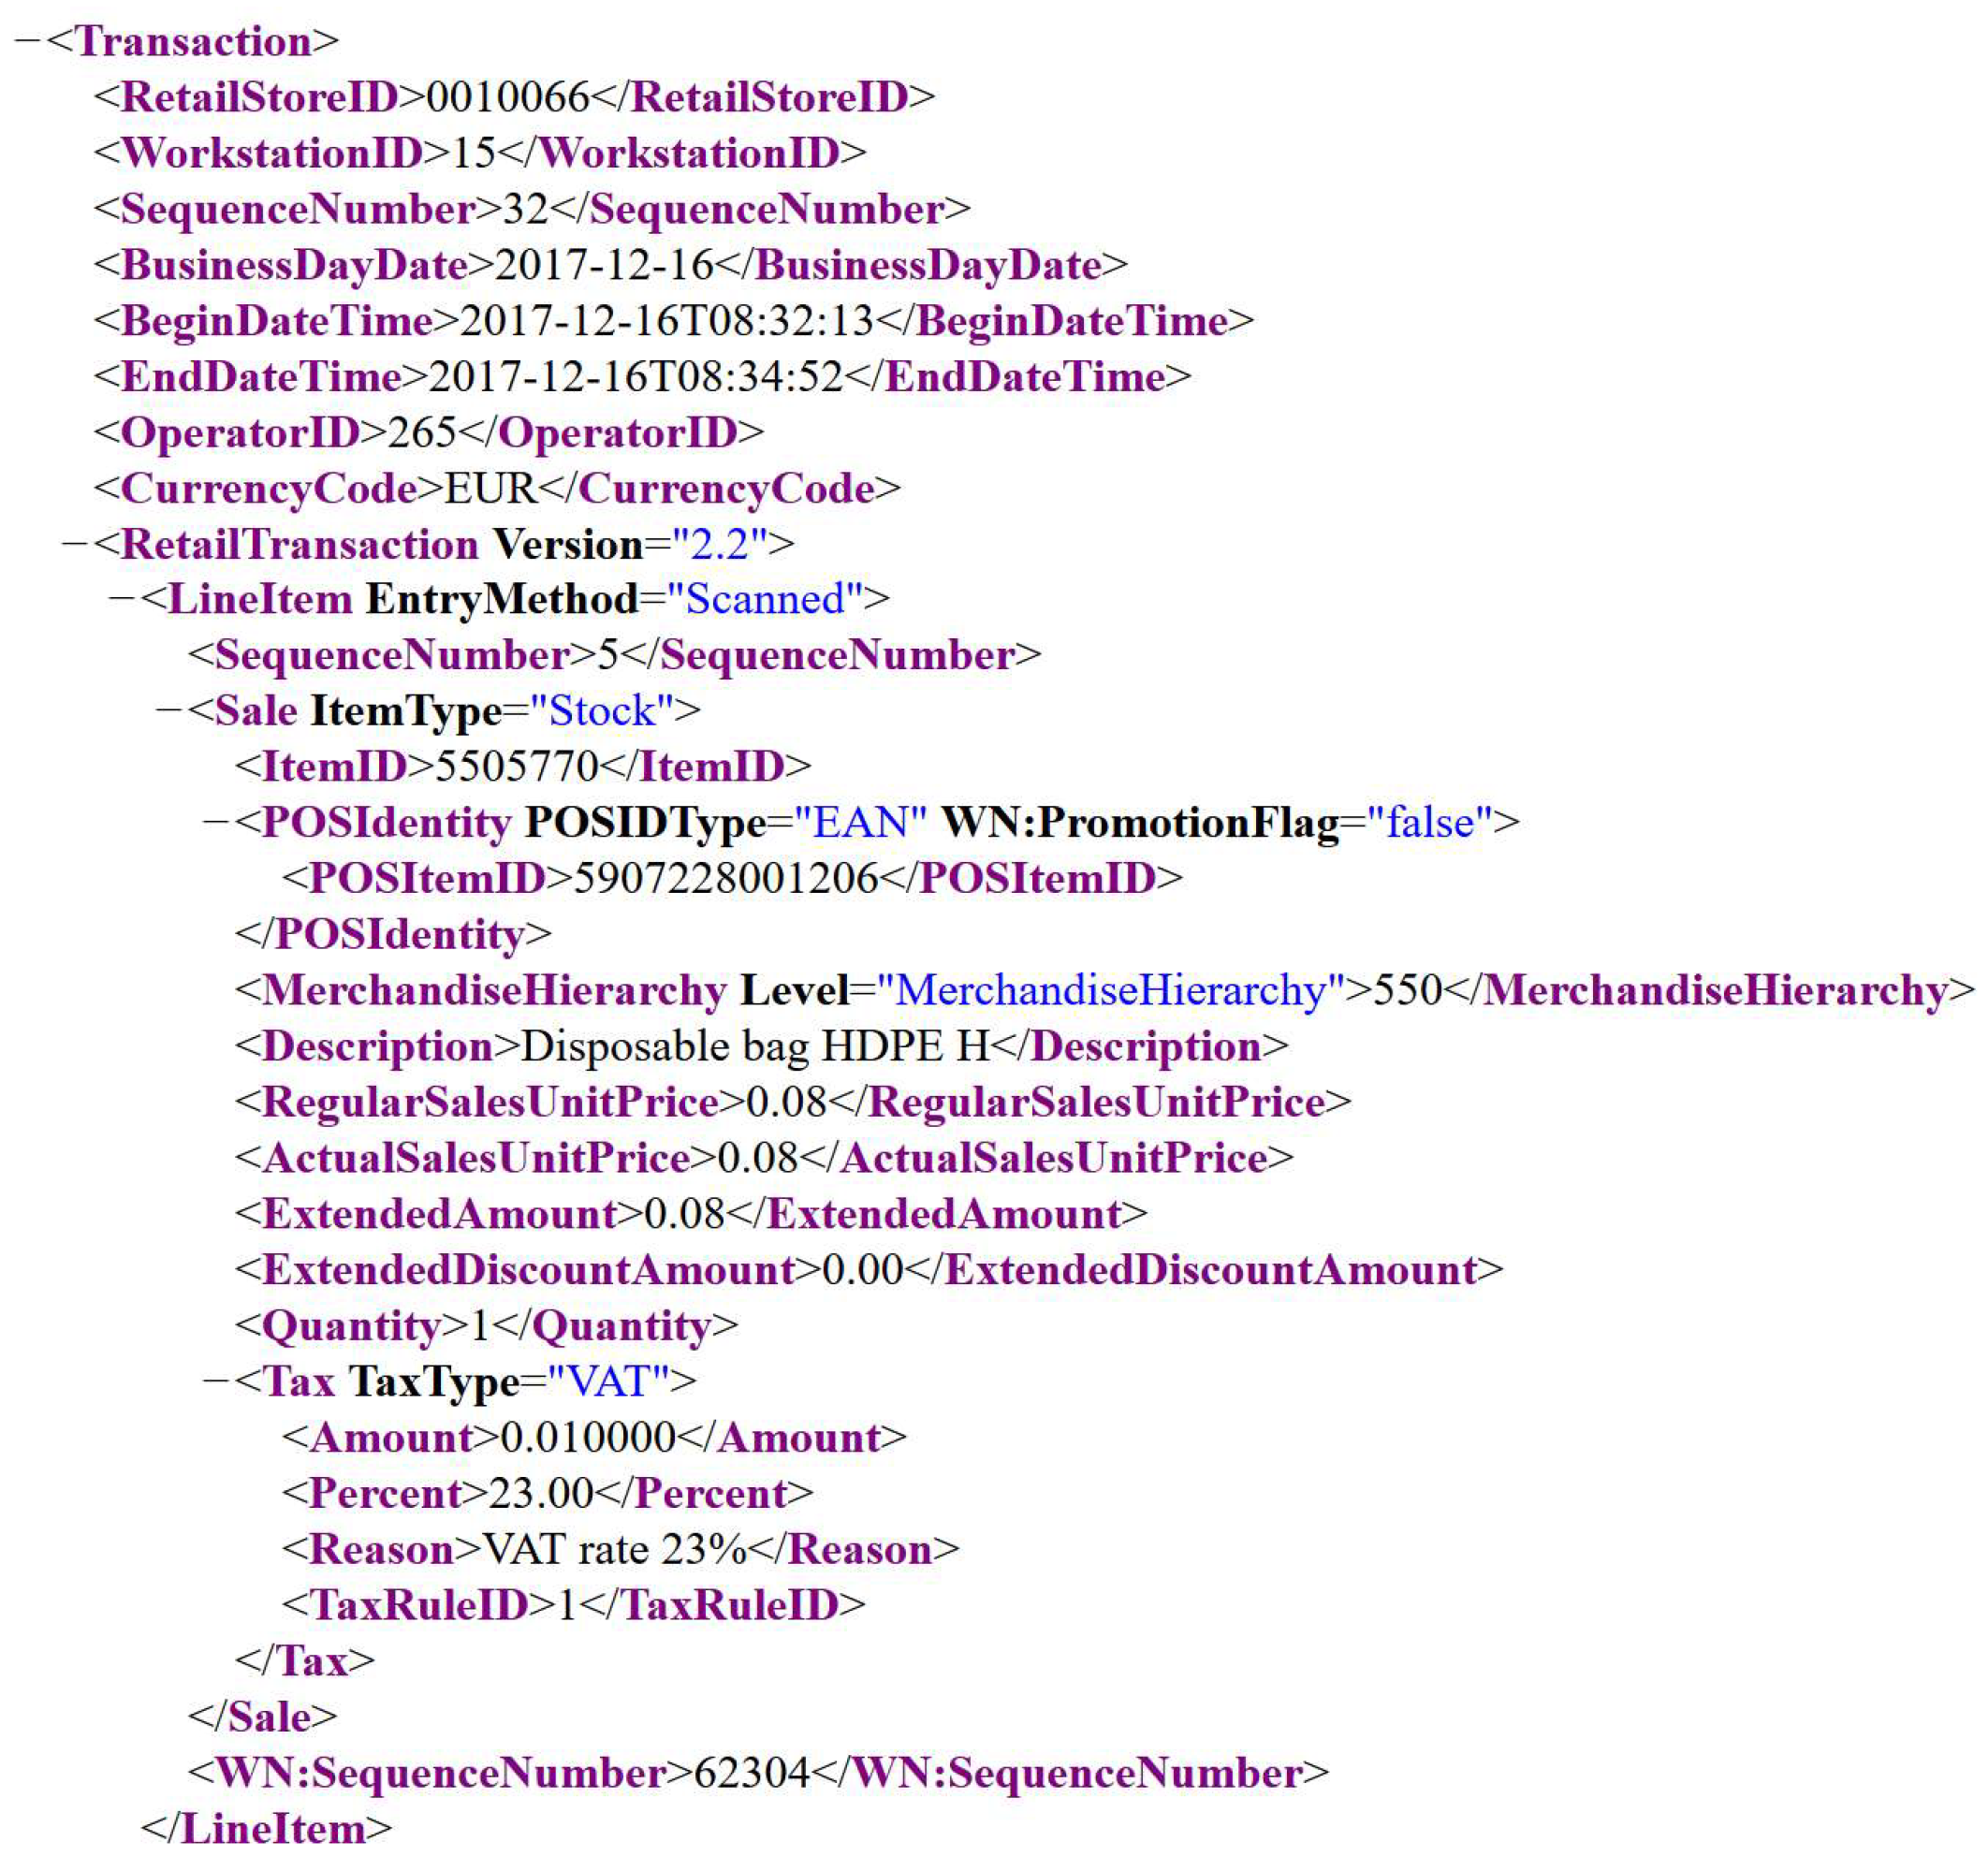
2. Data Description
3. Methods
Supplementary Materials
Author Contributions
Funding
Conflicts of Interest
References
- Mou, S.; Robb, D.J.; De Horatious, N. Retail store operations: Literature review and research directions. Eur. J. Oper. Res. 2018, 265, 399–422. [Google Scholar] [CrossRef]
- Bermana, O.; Larson, R.C. A queueing control model for retail services having back room operations and cross-trained workers. Comput. Oper. Res. 2004, 31, 201–222. [Google Scholar] [CrossRef]
- Rossetti, M.D.; Pham, A.T. Simulation modeling of customer checkout configurations. In Proceedings of the 2015 Winter Simulation Conference, Huntington Beach, CA, USA, 6–9 December 2015; pp. 1151–1162. [Google Scholar] [CrossRef]
- Kwak, J.K. Analysis on the effect of express checkouts in retail stores. J. Appl. Bus. Res. 2017, 33, 767–774. [Google Scholar] [CrossRef]
- Sturley, C.; Newing, A.; Heppenstall, A. Evaluating the potential of agent-based modelling to capture consumer grocery retail store choice behaviours. Int. Rev. Retail Distrib. Consumer Res. 2017, 28, 1–20. [Google Scholar] [CrossRef]
- Mas, A.; Moretti, E. Peers at work. Am. Econom. Rev. 2009, 99, 112–145. [Google Scholar] [CrossRef]
- Musalem, A.; Olivares, M.; Schilkrut, A. Retail in high definition: Monitoring customer assistance through video analytics. Columbia Bus. Sch. Res. Pap. 2016. [Google Scholar] [CrossRef]
- Larson, R.C. There’s more to a line than its wait. Tech. Rev. 1988, 91, 60–67. [Google Scholar]
- Statistical Tools for Finance and Insurance, 2nd ed.; Cizek, P.; Härdle, W.; Weron, R. (Eds.) Springer: Berlin, Germany, 2011. [Google Scholar] [CrossRef]


| Field | Type | Description |
|---|---|---|
| WorkstationGroupID | Integer | Type of checkout: 1—service, 8—self-service |
| TranID | Numeric | Transaction ID (date, store ID, checkout ID, sequence no.) |
| BeginDateTime | Date/Time | Date and time of transaction start |
| EndDateTime | Date/Time | Date and time of transaction end |
| OperatorID | Integer | Unique cashier ID |
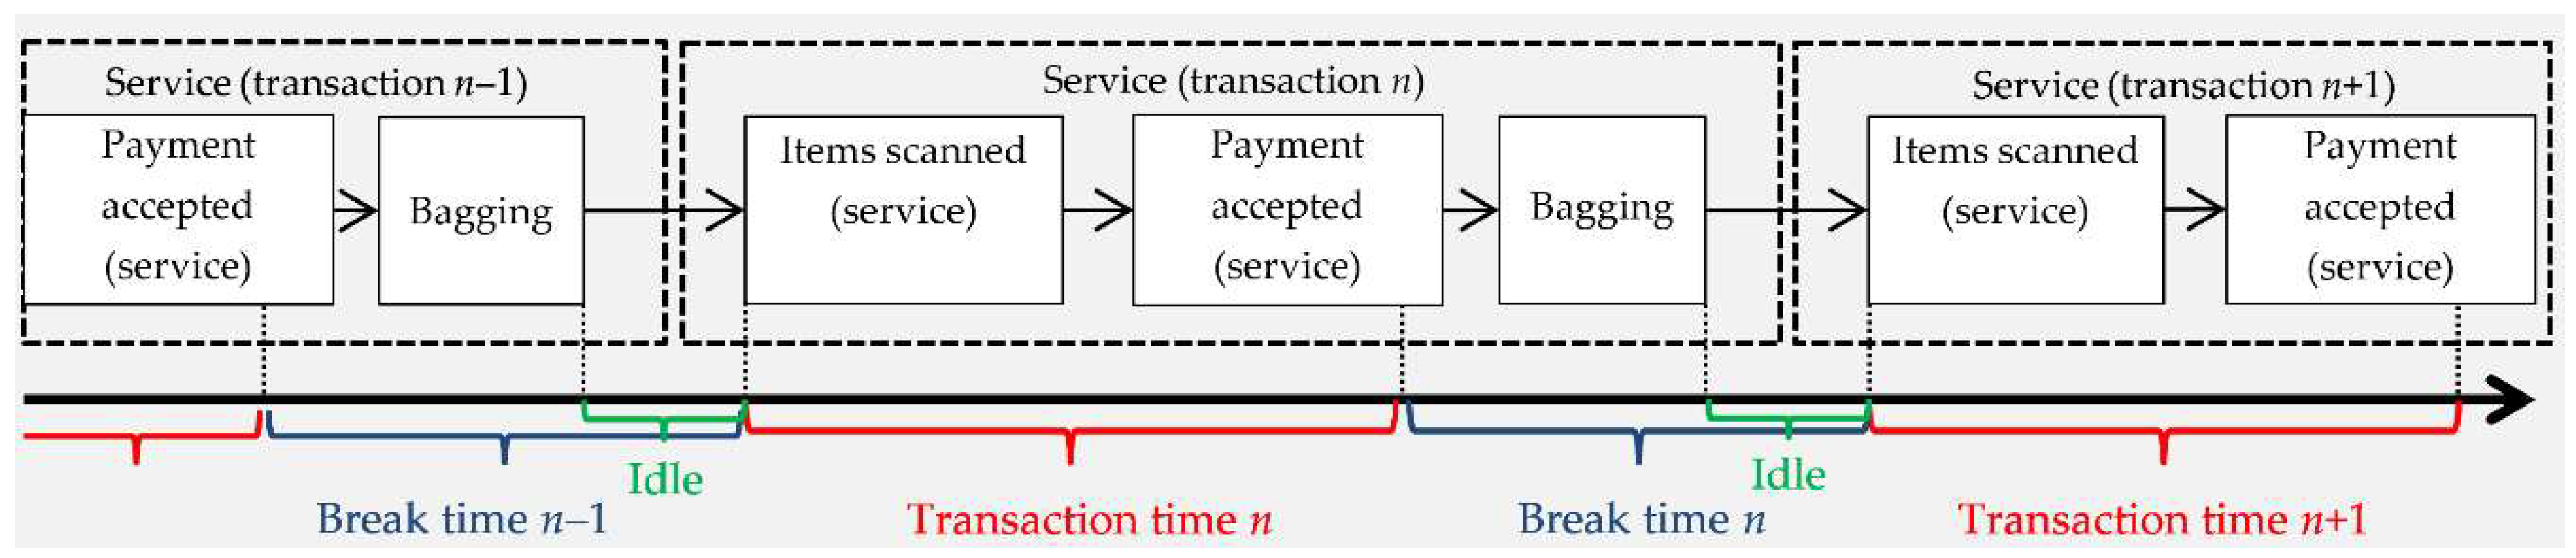
| TranTime | Integer | Transaction time in seconds 1 |
| BreakTime | Integer | Break (including idle) time in seconds 2 |
| ArtNum | Integer | Number of items, i.e., basket size |
| TNcash | True/False | Cash payment flag (true when transaction paid in cash) |
| TNcard | True/False | Card payment flag (true when transaction paid by a card) |
| Amount | Numeric | Transaction value |
| Field | Type | Description |
|---|---|---|
| WorkstationGroupID | Integer | Type of checkout: 1—service, 8—self-service |
| WorkstationID | Integer | Unique checkout ID |
| TranID | Numeric | Transaction ID (date, store ID, checkout ID, sequence no.) |
| BeginDateTime | Date/Time | Date and time of transaction start |
| OperatorID | Integer | Unique cashier ID |
| Items | Text | Operation identifier 1 |
© 2019 by the authors. Licensee MDPI, Basel, Switzerland. This article is an open access article distributed under the terms and conditions of the Creative Commons Attribution (CC BY) license (http://creativecommons.org/licenses/by/4.0/).
Share and Cite
Antczak, T.; Weron, R. Point of Sale (POS) Data from a Supermarket: Transactions and Cashier Operations. Data 2019, 4, 67. https://doi.org/10.3390/data4020067
Antczak T, Weron R. Point of Sale (POS) Data from a Supermarket: Transactions and Cashier Operations. Data. 2019; 4(2):67. https://doi.org/10.3390/data4020067
Chicago/Turabian StyleAntczak, Tomasz, and Rafał Weron. 2019. "Point of Sale (POS) Data from a Supermarket: Transactions and Cashier Operations" Data 4, no. 2: 67. https://doi.org/10.3390/data4020067
APA StyleAntczak, T., & Weron, R. (2019). Point of Sale (POS) Data from a Supermarket: Transactions and Cashier Operations. Data, 4(2), 67. https://doi.org/10.3390/data4020067