Article

Data Engineering for Affective Understanding Systems

Faculty of Information Technology, University of Petra, Amman 11196, Jordan
*
Author to whom correspondence should be addressed.
Submission received: 8 March 2019 / Revised: 3 April 2019 / Accepted: 16 April 2019 / Published: 18 April 2019

Abstract

:
Affective understanding is an area of affective computing which is concerned with advancing the ability of a computer to understand the affective state of its user. This area continues to receive attention in order to improve the human-computer interactions of automated systems and services. Systems within this area typically deal with big data from different sources, which require the attention of data engineers to collect, process, integrate and store. Although many studies are reported in this area, few look at the issues that should be considered when designing the data pipeline for a new system or study. By reviewing the literature of affective understanding systems one can deduct important issues to consider during this design process. This paper presents a design model that works as a guideline to assist data engineers when designing data pipelines for affective understanding systems, in order to avoid implementation faults that may increase cost and time. We illustrate the feasibility of this model by presenting its utilization to develop a stress detection application for drivers as a case study. This case study shows that failure to consider issues in the model causes major errors during implementation leading to highly expensive solutions and the wasting of resources. Some of these issues are emergent such as performance, thus implementing prototypes is recommended before finalizing the data pipeline design.

1. Introduction

Affective computing is an interdisciplinary field that is concerned with studying human affects and designing computers capable of interpreting and generating human-like affects. This field has increasingly received intensive attention due to its potential effect of improving human-computer interactions. Adding affect factors to education, customer service, robots and many other applications improve the accuracy and efficiency of these systems. For example, the detection of students’ affective state during learning using key logs, facial expressions and behavior logs, successfully identifies the D’Mello and Graesser patterns that encourage or inhibit learning [1,2]. Similarly, affective engineering utilizes customers’ psychological demands and feelings regarding the product design, size, color and texture to minimize the effort involved in product design management and to achieve better customer satisfaction [3]. In addition, affective understanding research assists in developing adaptive human-computer interfaces that accommodate users’ impairments including their affective states [4]. Recently, the advances in ubiquitous and wearable computing have promised a more real-time and non-obstructive capture of affect information and provided an individualized platform for affective interaction with the computer.
Schwark categorized affective computing into three major areas: affective understanding, affective generation, and application [5]. Many studies in the literature describe work in the affective understanding area which investigates different approaches to advance the ability of a computer to understand the affective state of its user using different modalities such as facial expressions, emotional speech, gestures, or physiological state. The recognition of the user affective state presents a special difficulty when several emotions coexist [6]. Applications in this area deal with extensive data that are in various formats and frequently updated, which characterize them as big data. In addition, the main responsibility of these applications is to analyze the unstructured data to come up with meaningful values, which is the role of a data scientist. Before a data scientist can start any data analysis, the data should be brought to a state suitable for data analysis, which is the task of a data engineer. Data engineering is the process of collecting data from several sources, then integrating them into a consistent and logically related set of data.
Most of the research reported in this area focuses on a four-level approach to describe work: (1) capturing signals from sensors, (2) extracting features, (3) analyzing data, and finally, (4) presenting results. However, there is little focus on highlighting the design issues that were considered when managing or engineering data. From a software engineering point of view, despite the variations between the studies, a generic design model can be extracted for research in this area, which benefits new researchers and facilitates the development of new approaches and studies.
The paper is organized as follows: Section 2 reviews several studies categorized under the affective understanding area. In Section 3, we propose a design model that raises some issues that need to be considered when developing applications in this area. Section 4 illustrates the feasibility of this model by applying it to the design process of a stress detection application for drivers. Finally, Section 5 describes the implementation of this application.

2. Related Work

The idea behind affective computing is to build computing systems that are capable of the perception of human emotions based on various information captured by sensors, then interpret these feelings, in order to respond intelligently. Thus, affective understanding typically relies on a three-step process of capturing, extracting and interpreting. Studies in this area reported in the literature present wide variations for performing these steps. Table 1 shows studies reviewed from the literature categorized according to the three-step process with a focus on studies that measure stress since we will present our application in Section 4 that is concerned with measuring stress.
We can draw common conclusions from these studies:
  • A variety of data sources are used that can include images, videos, physiological data, environmental data, subjective self-evaluation, activities and text. This variation alongside with the naturally large amount of some of them and the high frequency of their generation categorizes data in these studies as “big data” according to the recent definition of this term [30].
  • Data are either collected in a simulated lab environment or while performing real activities in a field environment. A lab environment is more controlled, which ensures better focus on the studied parameters; however, users’ emotions within lab experiments may suffer from exaggeration or suppression [6]. Furthermore, in real environments, users usually perform more complex tasks, which require a higher cognitive load [4]. Thus, since the goal of these applications is the detection of affects in real environments, a system can only be useable when it proves efficient in a real environment.
  • Physiological features that were repeatedly reported in the literature to best predict stress are amplitude of the heart rate variability (HRV) and low frequency (LF)/high frequency (HF). In addition, electrocardiogram (ECG) and galvanic skin response (GSR) are particularly useful in the immediate identification of short-term stress events.
  • Interpretation methods vary from statistical methods, to neural networks, image and video recognition, etc.
Most of these studies focus on reporting the three stages of the process without giving any details of the design process of their work. Few studies report the design architectures of their application; hence they illustrate the data pipeline. For example, [14] presented a layered architecture for a wearable wireless suite that captures individual stress based on physiological data. The architecture is divided into five layers: (1) Network Layer, where Bluetooth is used to transmit data; (2) Windowing Layer to buffer sensor data into windows; (3) Features Layer, where features are calculated; (4) Inferencing Layer, where affects are inferenced from the features; finally, the Application Layer, where mobile phone applications are built to interact with the individual.
On the other hand, three-layer architecture for an intelligent emotion interactive system using wearable devices was described in [25]. The first layer is the user terminal layer, which includes wearable devices that collect physiological data. The second layer is the communication layer where preprocessed data are sent to a remote cloud. Finally, the third layer is the cloud-based service layer, which is responsible for data storage, feature extraction and classification, in addition to personal modeling of affect.
Rostaminia et al. described the data pipeline of W!NCE system design, which uses a wearable electrooculography (EOG) to identify upper facial expressions. The pipeline consists of three stages: Data collection and preprocessing, then motion artifact removal, and finally, the classification stage of the facial action units [31].
Hovsepian et al. described the design model they implemented to develop a mobile environment that detects individual stress. The model consists of the following steps:
(1)
Collect data and assign time stamps to them.
(2)
Interpolate lost data.
(3)
Identify poor quality data and screen it out.
(4)
Data normalization.
(5)
Aggregate data into one-minute blocks.
(6)
Train a Support Vector Machine (SVM) [23].
Clay and others suggest an overall architecture for interactive applications with a branch for emotion recognition. They added the three-level process (capture, analysis, interpretation) within the architecture of an interactive system (ARCH) reference model and the agent-based Model-View-Control (MVC) model [32]. In [10], the architecture of the fatigue detection system was described as a data pipeline consisting of data collection, preprocessing, data partitioning, and then, feature extraction.
Most of these architectures are influenced by the three-level process, which is a simplification of the design process of affective understanding applications. There are detailed design issues that are important to consider when designing a data pipeline, which affects the implementation stage. One example was clearly reported in [29], where 194 collected data from participants were reduced to 55 only, when differences in the size and resolution of participants’ mobiles distorted the analysis, forcing 70% of the collected data to be invalid.
In the next section, we will propose detailed design issues that are important to consider when designing a data pipeline for affective understanding applications. The effect of these issues may not become visible until later in the implementation. Thus, the proposed design model helps to prevent subtle issues that can cause problems during implementation.
We will devise our design model to suit data engineering for big data, which entails the following:
  • Bringing together big data from different technologies (sources), sometimes more than ten sources.
  • Choosing the right tool to integrate the data.
  • Making sure that the data used is clean, reliable and fit for purpose.
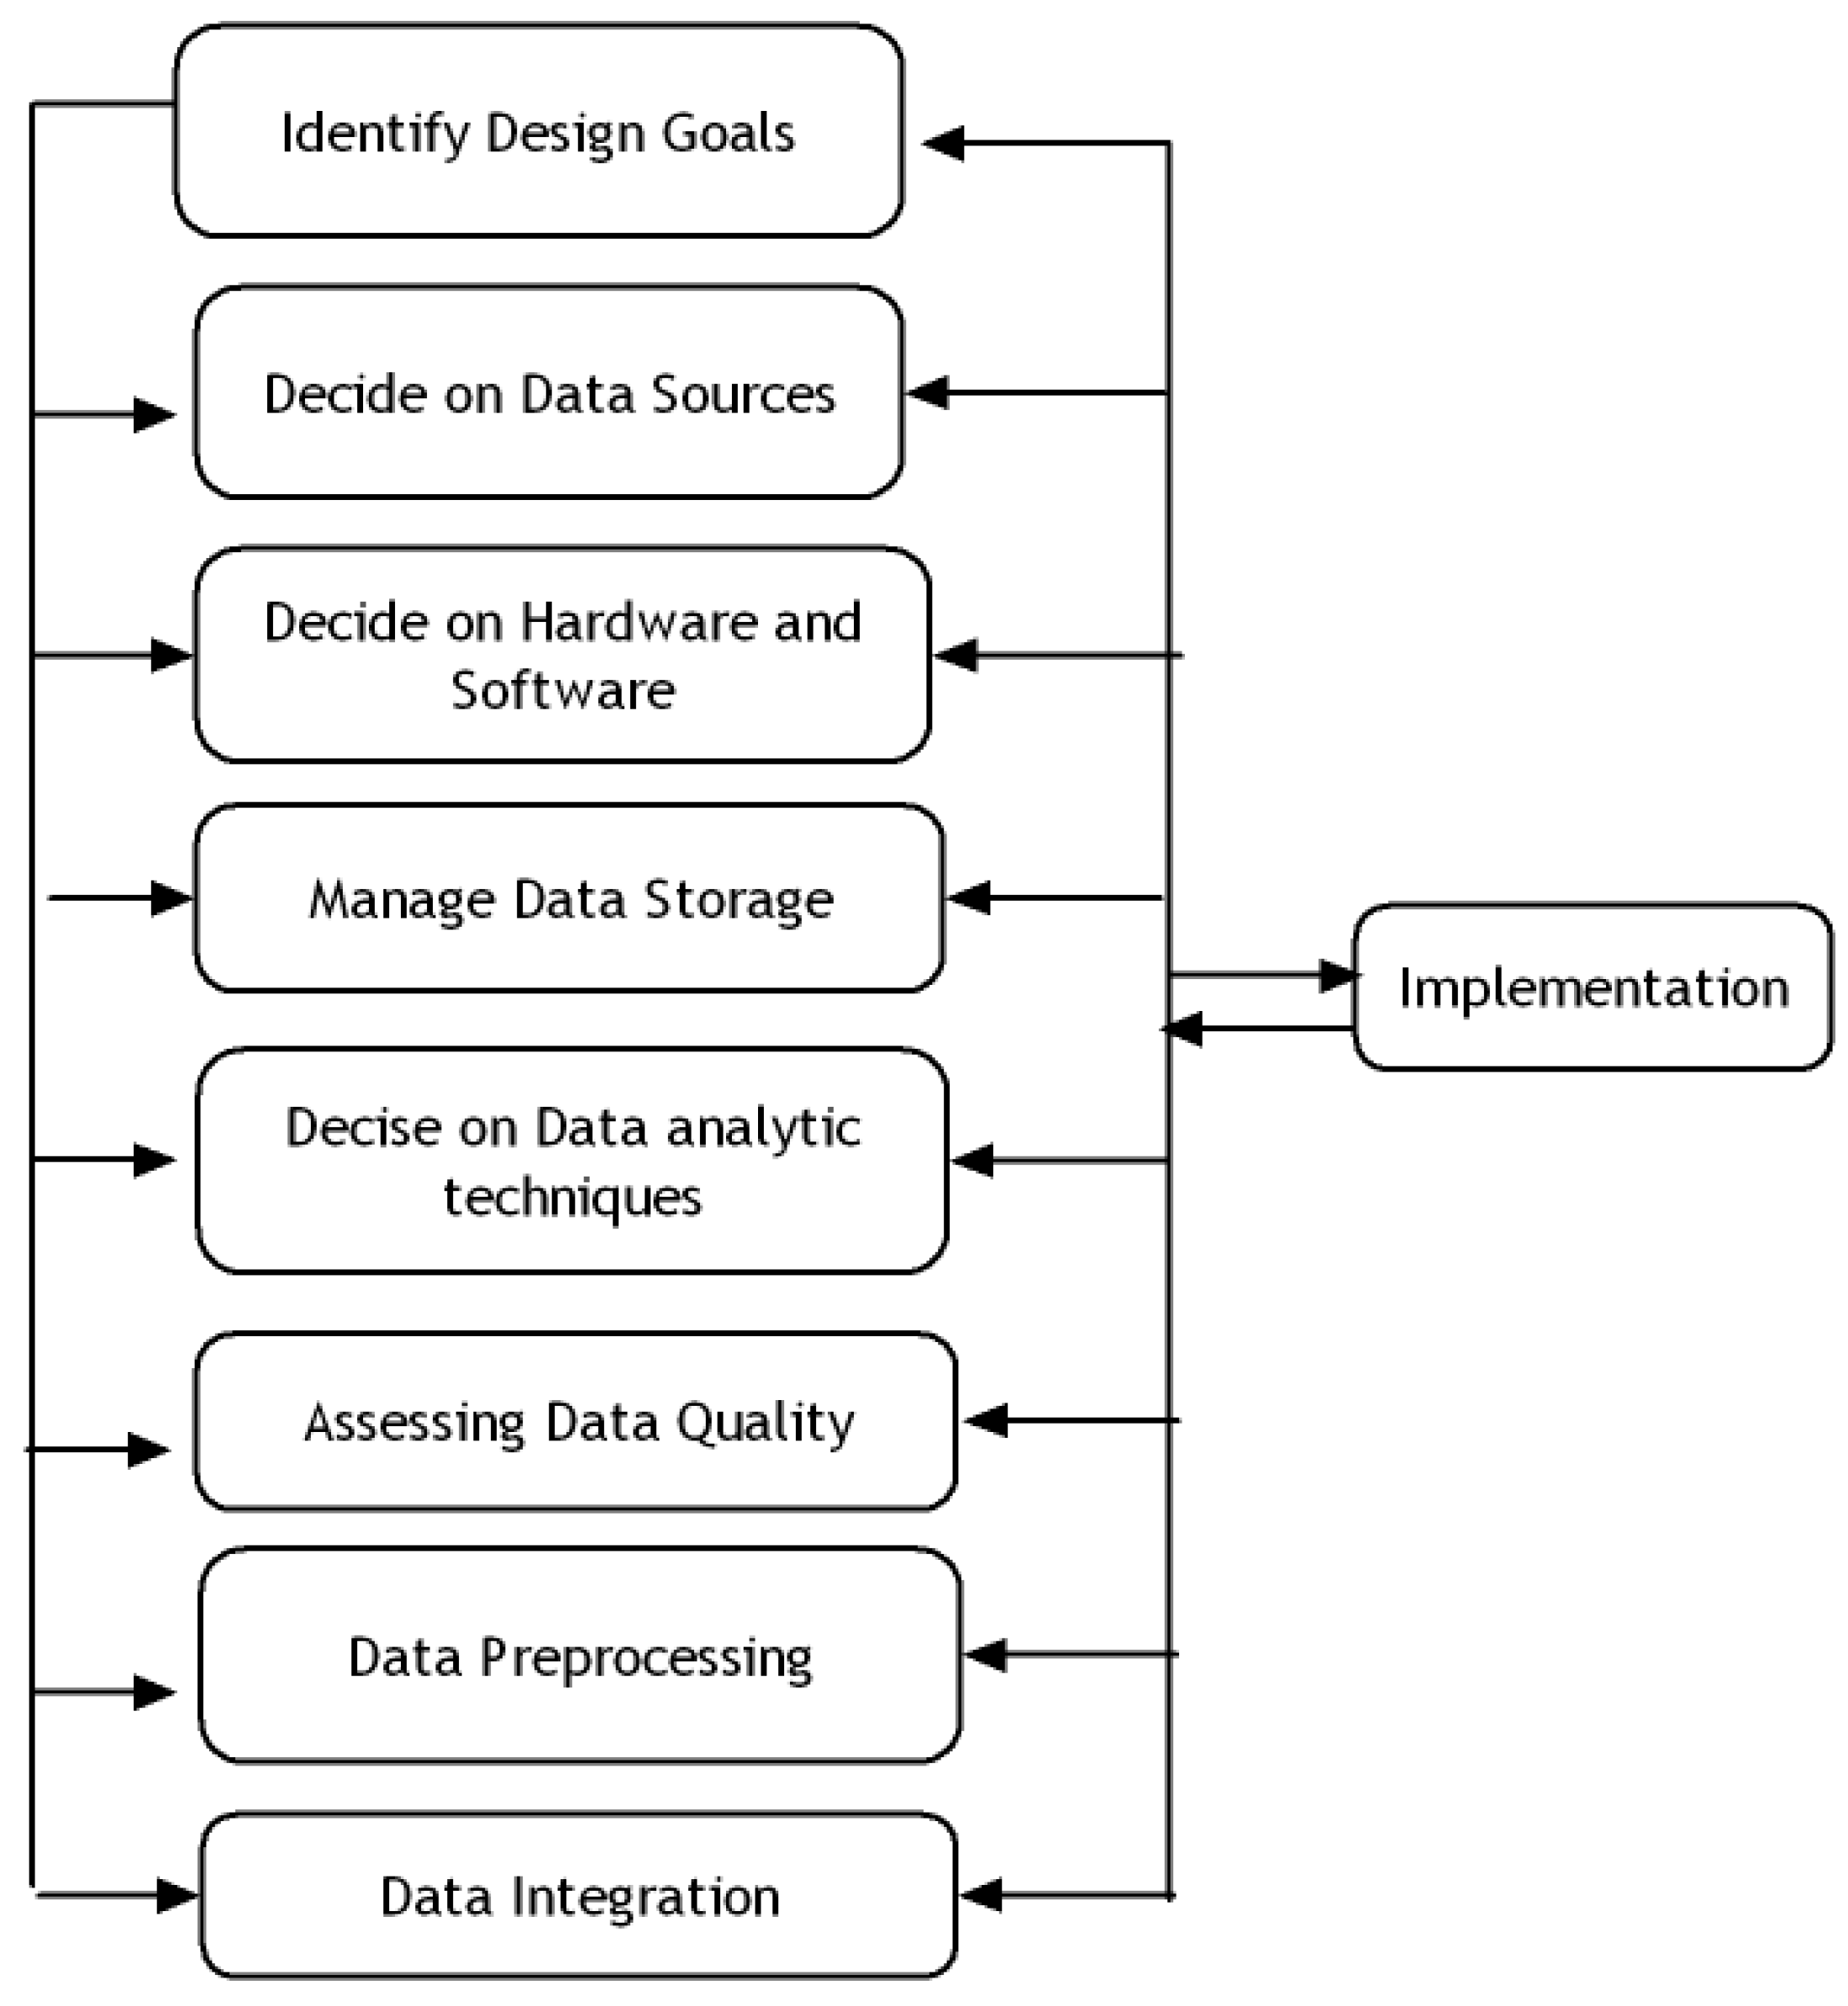
The term “data wrangling” has been used at some point of time to refer to the transformation of multi-sources data into something that can be useful for analysis. It may include reformatting, cleaning, correction of missing and erroneous values, and off-course integration [33]. Nnebedum states that data engineering is becoming a necessity in several domains and suggests a generic data pipeline for data analysis that consists of; defining the problem and objectives; defining the workflow and dataset; collecting the data; cleaning the data; analyzing the data; interpreting and challenging the results; presenting the results [34].

3. Design Model

Figure 1 shows the proposed data design model for developing affective understanding systems or studies. The model depicts the activities of designing a data pipeline. Each activity addresses one of the issues extracted from the previous literature review. The design process is highly iterative, where results from one activity are likely to affect previous ones. In the next subsections, we will illustrate each activity.

3.1. Identify Design Goals

The first step in the design process is to explicitly identify the qualities that the system should focus on. Some of these design goals are based on the application domain, while others are elicited from the user. Some examples of design goals for such applications are: real time vs offline, non-obstructive, ubiquitous, cost, or other non-functional requirements.
Each design goal will direct the design process into different issues, for example, real-time systems will require considering low latency, performance and data streaming.

3.2. Decide on Data Sources

In this activity, we need to identify the type of data that will be collected to detect affects. Data sources are categorized into two types: Internal and environmental. Internal data sources will detect either the physiological or psychological state of the user using one or more modality such as facial, gesture, body tracking, acoustic, or self-evaluation. A lot of physiological data are correlated with certain affects e.g., electroencephalography (EEG), electrocardiogram (ECG), electromyography (EMG), blood pressure, blood oxygen, and respiration can be detected. Meanwhile, environmental data sources represent a wider range of contextual cues such as location, activity or social that affect the user.

3.3. Decide on Hardware and Software

Using commercially off-the-shelf devices or sensors is one option to be considered for detecting the required data. However, this option may create difficulties when integrating these sensors with other components of the system. The other option is to devise your own hardware and software to capture required data, which entails high cost and risk. For example, Ertin et al. [14] did not only devise a wearable wireless sensor suite for collecting physiological data but also compared their sensor readings with commercially available sensors. Also, Boateng and Kotz devised StressAware, which is a wearable device based on a commercial heart-rate monitor that measures the stress level of an individual on a three-level scale of low, medium, and high [27].
An earlier decision of a non-obstructive, ubiquitous design goal will limit options of hardware/software devices at this point. However, the advances that have been made in wearable devices and smart mobile applications are promising. For example, Rodrigues et al. [26] uses Vital JacketR (VJ), which is a wearable biomonitoring t-shirt, Mohino-Herranz et al. [35] uses a wearable vest, and Ertin et al. [14] uses a wireless sensor suite. Also, the most recent innovation of wearable electrooculography (EOG) captures electrical potentials between the cornea and ocular fundus, allowing the measurement of facial expressions [31].
A recent study by Witten et al. [36] investigates the effect of the surrounding environment and human activity on the detected signals from wireless devices, which affect the stability of the performance of the analysis techniques. Thus, suggesting the importance of detecting the context of the system’s real deployment environment and the adaptation of the system’s recognition process to this context.

3.4. Manage Data Storage

Deciding how to manage persisting data entails many issues. Whether data will be stored locally at the captured device side, or sent immediately to a central location will require different subsequent decisions of available storage space, network requirements and quality of network service. In terms of storage space, unstructured data such as images and videos need large storage space; while, physiological data generate large amounts of data at different frequencies (e.g., EMG data produce up to 2048 signals per second (SPS), while skin conductance produces 32 SPS).
Alongside data storage management comes other issues of data security and privacy, user authentications and authorizations.

3.5. Decide on Data Analytic Techniques

Although analyzing the data is performed at a later stage, after data is engineered, the choice of analysis technique may affect the required data format from the data pipeline. It is evident from the previous literature review that data analytic techniques are numerous and dependent on the type of data. Selecting the appropriate model or algorithm for the problem and being able to tune the algorithm parameters are not straight forward tasks. In [23], Hovsepian et al. suggested two criteria to consider when evaluating a computational model for affect interpretation: Validation of the results in lab and field environments, and high accuracy. Thus, eliciting input from users is necessary to accurately assess the detected affect. Usually, two methods are used for eliciting data from users about their experienced affect: Ecological Momentary Assessment (EMA) and recall-based self-report. EMA puts a greater burden on the user to evaluate their feelings while performing actions. Meanwhile, recall-based self-report suffers from degradation of the accuracy caused by retrospection [37].

3.6. Assessing Data Quality

It is important to devise methods to assess and improve data quality. In order to do so, first, data quality issues must be categorized into four types: Accuracy, completeness, redundancy and integrity [30]. All four categories form challenges when dealing with big data. However, data integrity is the most challenging when dealing with data from multiple sources. Next, choose suitable methods to overcome the quality issues. For instance, there are different methods to handle lost data reported in the literature such as interpolation or repetition [14,23,25].

3.7. Data Preprocessing

Different data preprocessing methods are required for different types of data in order to filter, clean invalid data, extract features, or compress size. The design choice of whether to perform data preprocessing at the device side or centrally at a data center is affected by the previous choice of hardware and software.

3.8. Data Integration

Many studies show that the accuracy of affective understanding increases when using a combination of modalities [5,23,25]. However, integration of signals is not an easy task due to a number of reasons:
  • Proprietary software of devices that acquire signals may only work offline or be difficult to integrate with other components of the system.
  • Availability of data at different times or rates. For example, subjective self-evaluation may not be available until the end of the experiment.
  • Some signals suffer from latency and discontinuity.
  • It is common to use time-stamps to correlate data, but sometimes time-space labels mismatch when devices are not synchronized.

4. Detecting Driver Stress Application

In this section, we will apply the design model proposed previously to a system that we developed to detect the driver stress. As we have seen from the reviewed literature, many studies focused on detecting human stress, since repeated exposure to stress has been associated with physical diseases as well as behavioral and social issues [23]. Driving a car is a daily activity that has been connected with numerous mental processes that form a challenge/stress to many individuals, especially in big cities.

4.1. Design Goals

Although detecting the driver stress online while driving is the ultimate goal, the objective of our application is to consider many factors that may affect drivers and to extract the factors that best correlate with stress. Two design goals were elicited from stakeholders: A non-obstructive system and reduced cost. Thus, two factors reinforced the decision of moving towards an offline non-obstructive stress detection system. On one hand, the cost of a real-time detection system (which will be shown later), and on the other hand, the choice of hardware and software selected.
The following assumptions and conditions were set for the system:
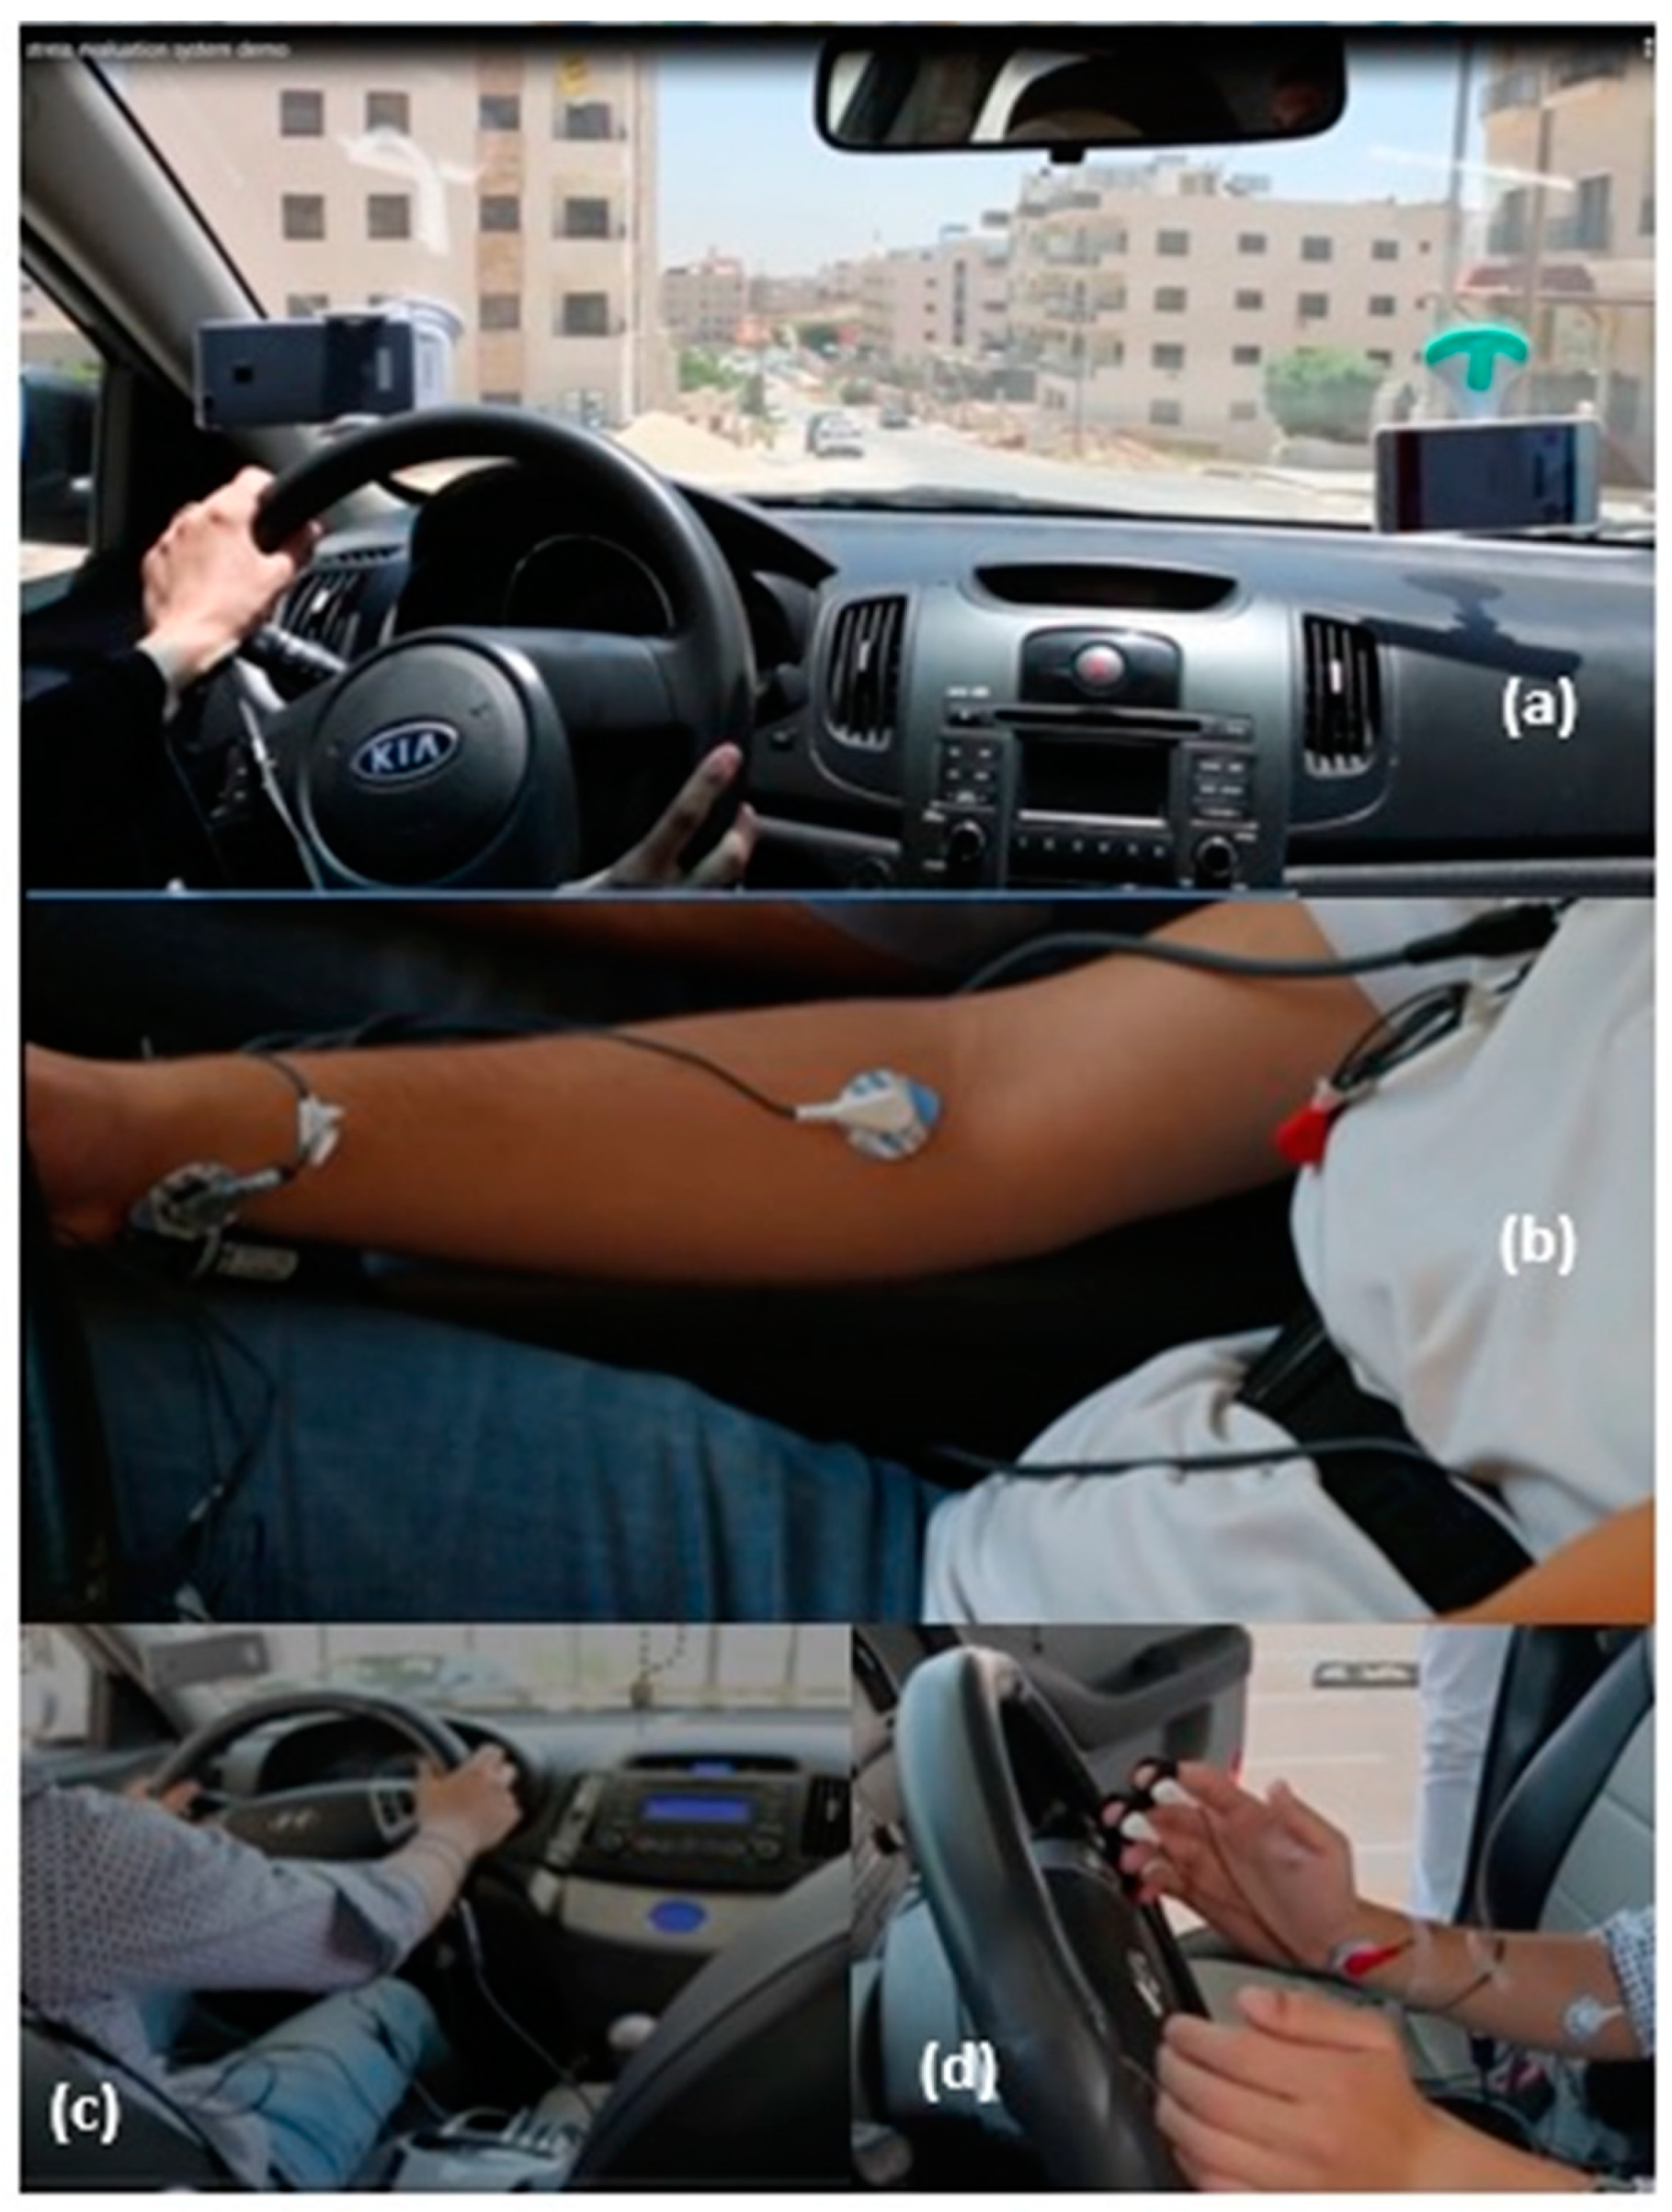
  • No car alteration is needed. The test is conducted on the participant’s own car. Rational: Driving a new car or an altered car may introduce an additional element of stress for some people.
  • All devices for measuring physiological indicators are wearable in a minimally obstructive way. Rational: Obstructive tools introduce an element of stress while driving.
  • Data should be collected at different times of the day, different weather conditions, different routes, different ages, and different genders. Rational: Variations of data enhance the detection of patterns.
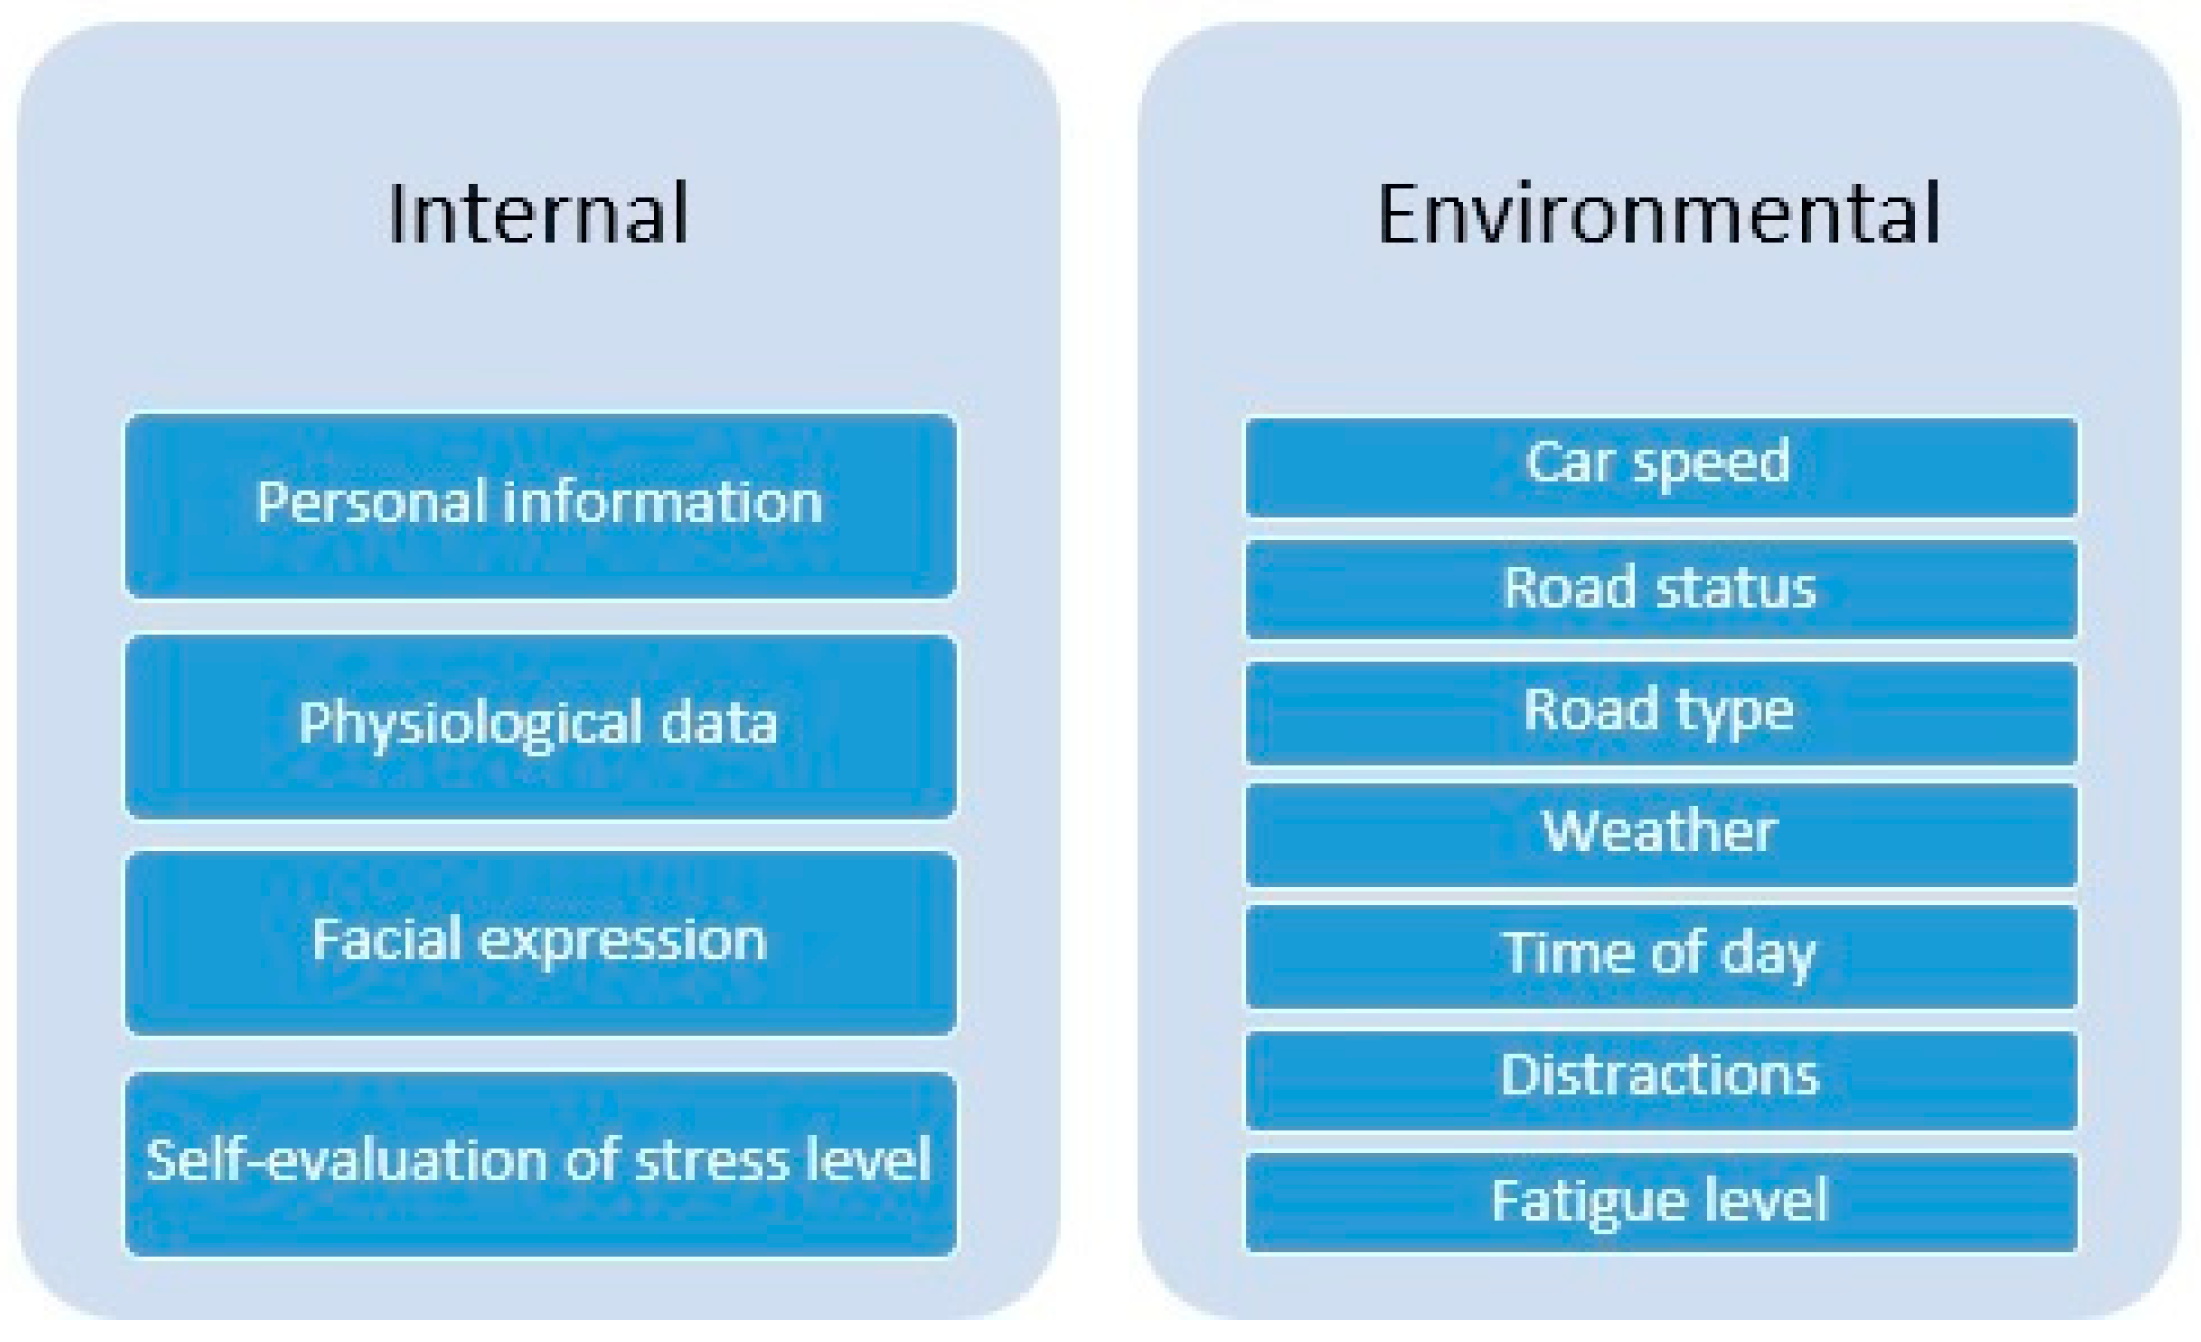
4.2. Data Sources

To meet the objectives of our application, we had to consider as many factors as possible that may affect the driver while driving. Therefore, we decided to collect the following data:
(1)
Personal information about the driver including (age, gender, number of driving years, daily driving hours, number of accidents in general and in the previous year, illnesses, personal stress symptoms, and personal evaluation of driving skills, driving style and general stress level while driving). This data is collected before a driving experiment.
(2)
Physiological data while driving (ECG, EMG of trapezius muscle, GSR skin conductance (GSR/SC), respiration rate).
(3)
Self-evaluation of the stress level collected offline after the experiment, with contextual cues of the road images to overcome the drawbacks of recall-based self-report method as suggested in [37].
(4)
Road status while driving.
(5)
Facial expressions while driving.
(6)
Environmental conditions of the experiment (weather, time of day, distractions inside the car, fatigue level and stress level before the experiment).
(7)
Car speed and road type while driving.
Figure 2 shows data sources considered for our system categorized into internal and environmental.

4.3. Hardware and Software

To collect physiological data, we used a Nexus 10 device (MindMedia, The Netherlands), which measures all the physiological data previously mentioned and provides a number of features calculated from the raw data. Nexus 10 is a minimally obstructive device that collects ambulatory data and provides propriety software to import, manage and export the data as csv files for further usage. The only obstruction is the wires of the ECG and GSR sensors attached to the driver’s hand.
In order to collect road status, facial expressions, car speed and road type, a mobile application was developed. We had a design option to consider at this point:
  • Send road status and real-time facial expressions to a central data center requires high-quality wireless network at all locations while driving, which is impossible to ensure as network quality of services vary depending on car location, in addition to the high cost of moving intensive data such as images or videos over a wireless network.
  • Alternatively, we can store the road status and facial expressions data locally on the mobile phone during the experiment then move it offline for integration.
The latter option was chosen to meet the cost design goal.
The mobile application uses the location Application Programming Interface (APIs) available in Google Play services, which supports Global Positioning System (GPS) to track the car location and calculate its speed.

4.4. Data Storage

Recording road status and facial expressions as videos require ample space especially, with the high-quality capabilities of today’s smart phones. Instead, sequential images may be recorded with suitable frequencies to reduce the cost of storage. When reviewing the literature, window sizes for computing stress varied from 5 m to 0.5 s. Therefore, a window size of 2 s was decided upon for our application.
Physiological data recording rates are different depending on the modality. Table 2 shows the different rates of the collected data.
Fifteen features were exported from physiological data from BioTrace software of the Nexus 10 device. Data exported were time stamped with the highest recording rate of 2048 in order not to lose any data. At this rate, a 40-min driving experiment produces a 500 MB physiological data file.
Only personal information and self-rating were stored online using a web platform. We did consider the option of storing all the data on a cloud. However, the size of the full data set produced from a 40-min driving experiment is 1 GB, which raises the cost of data storage beyond the target.

4.5. Data Analytic Techniques

Since we chose an offline recognition system in our first step, we used the well-known data mining tool Waikato Environment for Knowledge Analysis (WEKA) [38] to process the data. Analyzing the full data exported from the BioTrace software of the Nexus 10 device with the highest recording rate of 2048 requires the utilization of Apache Hadoop to handle big data by distributed processing of datasets. We use deep learning for image recognition to extract the number of cars, which indicates the cognitive load on the driver.
There are many data analytical techniques that can be used for stress diagnosis. Such analysis techniques are machine-learning-based and can use clustering or classification techniques, among others, for that purpose. Examples of machine learning methods that were used for stress diagnosis are; classification methods as Artificial Neural Networks (ANN); Support Vector Machine (SVM); case-based reasoning (CBR) [39]; hidden Markov models (HMM); Bayesian techniques; decision trees; genetic algorithms; clustering methods as k-Means; fuzzy-logic-based techniques [40].

4.6. Assessing Data Quality

This step validated that all the required data had been correctly recorded in an experiment. Many problems occur which cause missing data such as:
  • Loose electrodes, which caused missing physiological data (e.g., ECG or EMG).
  • Errors in the mobile application or shortage of internal storage or memory storage of the mobile device, which caused loss of images recording.
  • Distorted images due to car movement.
  • Loss of GPS signals, which cause missing GPS locations and incorrect car speeds.

4.7. Data Preprocessing

Images were taken every 2 s, while physiological data were exported at a rate of 2048 signals per seconds. Therefore, in order to integrate these two sources of data, one option was to repeat the image information according to the physiological data rate. As previously mentioned, analyzing the full data at the highest recording rate requires the utilization of Apache Hadoop. Due to the difficulty of facilitating this solution, we decided as the first round of analysis to reduce the physiological data rate to match the image rate. Hence, root mean square (RMS) of the features were calculated for a window of 2 s to facilitate the correlation between the physiological data and the rest of the mobile application data. The average of the features was also calculated for every window (2 s) at the beginning. However, the results of averaging some features (especially ECG) were found to remove sometimes the extreme changes in the specified window, which might affect later analysis. Thus, all physiological data was preprocessed to get the RMS values for a window of 2 s.
Facial and road images require preprocessing and analytic techniques beyond the scope of this paper.

4.8. Data Integration

Physiological data, road images, face images, GPS and car speed are all time stamped. The root mean square data of the features were integrated with car speed and location. It was only when data was integrated that a loss of road, face, GPS and car speed information was realized. This was due to the performance capabilities of the mobile application, which dropped 1 frame every 0.8 s. Solutions that may be suggested to solve this problem are either interpolate data in the missing frames, repeat data in the missing frames, or increase the window size to 3 s. This performance issue would not have been discovered without an actual implementation of a prototype of the mobile application. That is why, in the proposed design model, see Figure 1, the implementation stage also provides feedback to the design process and may change its decisions.

5. Implementation

The system described above was implemented. Figure 3 shows the system setup in the car.
Two types of experiments were performed to collect the data set: Fixed route and free route experiments. In total, 136 experiments were recorded along a two years period covering different weather conditions (sunshine, rain and fog). Experiments were divided into four different stages forming four different sets. Stages 1 and 4 were free routs, one with post evaluation of stress and one without. In stage 2, 30 experiments were performed using a fixed pre-planned route, which contained highway driving, narrow roads between residential areas, inclined roads, roundabouts, tunnels and bridges. Stage 3 was a shorter fixed route with highway driving and roundabouts. All experiments covered different hours during the day, including morning and afternoon rush hours and night times. The experiments were categorized according to their times into five categories: 6–9 a.m., 9–1 a.m., 1–4 p.m., 4–8 p.m., 8–1 p.m. A total of 29 drivers participated in the experiments covering an age range between 19 to 60 years old (18 male participants and 11 female participants).

6. Discussion

When we first started this study, we planned to follow the three-level approach commonly described in the literature. Therefore, we collected the data of stage 1 which consisted initially of 82 experiments. Then, we extracted the features of interest and integrated the data from different sources to start the data analysis phase. We did not check the quality of the recorded data until the end of the collection process. Consequent to the data validation process, 52 experiments from this set were dropped due to missing data for the reasons mentioned previously. During the integration process, we discovered the mobile application performance problem, which dropped one image from the road and the face recording every 0.8 s. In order to compensate for missing frames during data integration, one previous row of data was repeated instead of the missing raw, which required extra time, effort and cost to handle. In addition, when integrating set 1, the correlation of time stamps of the mobile application and the Nexus 10 software had to be done manually.
All these lessons that were learned when collecting the first data set have been taken into consideration in the next sets. However, after causing a delay in the project plan. Thus, losing 63% of the collected data in set 1, initiated the need for a more detailed data pipeline design model for systems under the affective understanding area, which has been presented in this paper.

7. Future Work

Currently, image recognition using a deep learning technique is being applied to road images to recognize the number of cars in front of the driver’s car, which indicates the cognitive load of the driver. In order to validate the accuracy of the automatic recognition technique, we will compare the results with manual recognition.
We have several issues to investigate in the future: First, we will study the problem of predicting car drivers’ stress levels when driving based on the collected data sets through the application of data mining classifiers such as Random Forest, K-Nearest Neighbor, Artificial Neural Network, and Support Vector Machines. Second, we will use feature selection approaches to identify the factors that potentially increase drivers’ levels of stress. Finally, a facial recognition technique will be utilized to recognize the drivers’ emotions from ten emotional states: Anger, disgust, fear, happiness, sadness, boredom, interest and unsure, concentrating and bothered.

8. Conclusions

The design of a data pipeline for big data, which has multiple sources, variation of the data production rates and high volume is not an easy task and requires a number of decisions that are highly iterative where each decision affects others. In this paper, we present a design model that considers issues that must be addressed when designing a data pipeline for systems under the affective understanding area. Failure to consider these issues causes major errors during implementation leading to highly expensive solutions and the wasting of resources. Some of these issues are emergent such as performance, thus implementing prototypes is recommended before finalizing the design. Our experience from the reported case study showed how important it is to visualize and design the full data pipeline using pilot parts of a system or even mockups or stubs with a small test data set in order to discover flaws in the data pipeline which can later be expensive to repair.

Author Contributions

Conceptualization, N.E.-K.; Data curation, N.E.-K., M.A., W.H. and A.A.B.; Formal analysis, M.A. and W.H.; Methodology, N.E.-K.; Project administration, N.E.-K. and G.I.; Software, A.A.B.; Validation, N.E.-K., M.A., W.H. and A.A.B.; Writing—original draft, N.E.-K.

Funding

The authors would like to acknowledge the support provided by the Deanship of Scientific Research at University of Petra for funding this work through project No. 4/3/2017.

Conflicts of Interest

The authors declare no conflict of interest.

References

  1. Alexandra, J.M.; Andres, L.; Ocumpaugh, J.; Baker, R.S.; Slater, S.; Paquette, L.; Jiang, Y.; Karumbaiah, S.; Bosch, N.; Munshi, A.; et al. Affect Sequences and Learning in Betty’s Brain. In Proceedings of the 9th International Conference on Learning Analytics & Knowledge, Tempe, AZ, USA, 4–8 March 2019. [Google Scholar]
  2. Vea, A.; Mesina, M.R.; Toriaga, R.P.; Padlan, N. Development of an Intelligent Agent that Detects Student’s Negative Affect while Making a Computer Program. In Proceedings of the International Conference on Advances in Image Processing, Bangkok, Thailand, 25–27 August 2017. [Google Scholar]
  3. Liu, C.; Tong, L. Developing Automatic Form and Design System Using Integrated Grey Relational Analysis and Affective Engineering. Appl. Sci. 2018, 8, 91. [Google Scholar] [CrossRef]
  4. Sarsenbayeva, Z.; Berkel, N.; Hettiachchi, D.; Jiang, W.; Dingler, T.; Velloso, E.; Kostakos, V.; Goncalves, J. Measuring the Effects of Stress on Mobile Interaction. Proc. ACM Interact. Mob. Wearable Ubiquitous Technol. 2019, 3. [Google Scholar] [CrossRef]
  5. Schwark, J.D. Toward a Taxonomy of Affective Computing. Int. J. Hum. Comput. Interact. 2015, 31, 761–768. [Google Scholar] [CrossRef]
  6. Zhalehpour, S.; Onder, O.; Akhtar, Z.; Erdem, C. BAUM-1: A Spontaneous Audio-Visual Face Database of Affective and Mental States. IEEE Trans. Affect. Comput. 2017, 8, 300–313. [Google Scholar] [CrossRef]
  7. Healey, J.; Picard, R.W. Detecting Stress During Real-World Driving Tasks Using Physiological Sensors. IEEE Trans. Intell. Transp. Syst. 2005, 6, 156–166. [Google Scholar] [CrossRef] [Green Version]
  8. Schießl, C. Stress and Strain while driving. In Proceedings of the Young Researchers Seminar 2007, European Conference of Transport Research Institutes (ECTRI), Brno, Czech Republic, 27–30 May 2007. [Google Scholar]
  9. Taelman, J.; Vandeput, S.; Spaepen, A.; Van Huffel, S. Influence of Mental Stress on Heart Rate and Heart Rate Variability. In Proceedings of the 4th European Conference of the International Federation for Medical and Biological Engineering, IFMBE Proceedings, Antwerp, Belgium, 23–27 November 2008; Vander Sloten, J., Verdonck, P., Nyssen, M., Haueisen, J., Eds.; Springer: Berlin/Heidelberg, Germany, 2009. [Google Scholar]
  10. Bundele, M.; Banerjee, R. Detection of fatigue of vehicular driver using skin conductance and oximetry pulse: A neural network approach. In Proceedings of the 11th International Conference on Information Integration and Web-based Applications & Services, Kuala Lumpur, Malaysia, 14–16 December 2009; pp. 739–744. [Google Scholar]
  11. Wijsman, J.; Grundlehner, B.; Penders, J.; Hermens, H. Trapezius Muscle EMG as Predictor of Mental Stress. ACM Trans. Embed. Comput. Syst. 2010, 12, 155–163. [Google Scholar]
  12. Rigas, G.; Goletsis, Y.; Bougia, P.; Fotiadis, D. Towards Driver’s State Recognition on Real Driving Conditions. Int. J. Veh. Technol. 2011, 2011, 617210. [Google Scholar] [CrossRef]
  13. Bakker, J.; Pechenizkiy, M.; Sidorova, N. What’s your current stress level? In Proceedings of the 2011 IEEE 11th International Conference on Data Mining Workshops, Vancouver, BC, Canada, 11 December 2011; pp. 573–580. [Google Scholar]
  14. Ertin, E.; Stohs, N.; Kumar, S.; Raij, A.; Al’Absi, M.; Shah, S.; Jeong, J.W. AutoSense: Unobtrusively wearable sensor suite for inferring the onset, causality, and consequences of stress in the field. In Proceedings of the 9th ACM Conference on Embedded Networked Sensor Systems (SenSys 2011), Seattle, WA, USA, 1–4 November 2011; pp. 274–287. [Google Scholar]
  15. Hernandez, J.; Morris, R.; Picard, R. Call Center Stress Recognition with Person-Specific Models. In Proceedings of the International Conference on Affective Computing and Intelligent Interaction (ACII 2011), Memphis, TN, USA, 9–12 October 2011; D’Mello, S., Calvo, R., Eds.; Springer: Berlin/Heidelberg, Germany, 2011; pp. 125–134. [Google Scholar]
  16. Paschero, M.; Vescovo, G.D.; Benucci, L.; Rizzi, A.; Santello, M.; Fabbri, G.; Mascioloi, F. A real time classifier for emotion and stress recognition in a vehicle driver. In Proceedings of the International Symposium on Industrial Electronics (ISIE), Hangzhou, China, 28–31 May 2012; pp. 1690–1695. [Google Scholar]
  17. Schneegass, S.; Pfleging, B.; Broy, N.; Schmidt, A.; Heinrich, F. A Data Set of Real World Driving to Assess Driver Workload. In Proceedings of the 5th International Conference on Automotive User Interfaces and Interactive Vehicular Applications (AutomotiveUI ’13), Eindhoven, The Netherlands, 28–30 October 2013. [Google Scholar]
  18. Marcos-Ramiro, A.; Pizarro-Perez, D.; Marron-Romera, M.; Gatica-Perez, D. Automatic Blinking Detection towards Stress Discovery. In Proceedings of the 16th International Conference on Multimodal Interaction, Istanbul, Turkey, 12–16 November 2014; pp. 307–310. [Google Scholar]
  19. Luijcks, R.; Hermens, H.; Bodar, L.; Vossen, C.; Lousberg, R. Experimentally Induced Stress Validated by EMG Activity. PLoS ONE 2014, 9, e95215. [Google Scholar] [CrossRef] [PubMed]
  20. Liu, D.; Ulrich, M. Listen to Your Heart: Stress Prediction Using Consumer Heart Rate Sensors. Available online: http://cs229.stanford.edu/proj2013/LiuUlrich-ListenToYourHeart-StressPredictionUsingConsumerHeartRateSensors.pdf (accessed on 4 June 2018).
  21. Sun, D.; Paredes, P.; Canny, J. MouStress: Detecting Stress from Mouse Motion. In Proceedings of the SIGCHI Conference on Human Factors in Computing Systemss, Toronto, ON, Canada, 26 April–1 May 2014; ACM: New York, NY, USA, 2014; pp. 61–70. [Google Scholar]
  22. Różanowski, K.; Truszczyński, O.; Filipczak, K.; Madeyski, M. The level of driver personality and stress experienced as factors influencing behavior on the road. In Sustainable Development; WIT Transactions on The Built Environment; WIT Press: Southampton, UK, 2015; Volume 168, pp. 1009–1019. [Google Scholar]
  23. Hovsepian, K.; Al’Absi, M.; Ertin, E.; Kamarck, T.; Nakajima, M.; Kumar, S. cStress: Towards a Gold Standard for Continuous Stress Assessment in the Mobile Environment. In Proceedings of the ACM International Conference on Ubiquitous Computing (UbiComp 2015), Osaka, Japan, 7–11 September 2015; pp. 493–504. [Google Scholar]
  24. EL Haouij, N.; Ghozi, R.; Poggi, J.; Ghalila, S.; Jaidane, M. Feature extraction and selection of electrodermal reaction towards stress level recognition: Two real-world driving experiences. In Proceedings of the 47e Journées de Statistique de la Société Française de Statistique, Lille, France, 1–5 June 2015. [Google Scholar]
  25. Chen, M.; Zhang, Y.; Li, Y.; Hassan, M.M.; Alamri, A. AIWAC: Affective interaction through wearable computing and cloud technology. IEEE Wirel. Commun. 2015, 22, 20–27. [Google Scholar] [CrossRef]
  26. Rodrigues, J.; Kaiseler, M.; Aguiar, A.; Cunha, J.; Barros, J. A mobile sensing approach to stress detection and memory activation for public bus drivers. IEEE Trans. Intell. Transp. Syst. 2015, 16, 3294–3303. [Google Scholar] [CrossRef]
  27. Boateng, G.; Kotz, D. StressAware: An App for Real-Time Stress Monitoring on the Amulet Wearable Platform. In Proceedings of the IEEE MIT Undergraduate Research Technology Conference (URTC), Cambridge, MA, USA, 4–6 November 2016; pp. 1–4. [Google Scholar]
  28. Aigrain, J.; Spodenkiewicz, M.; Dubuisson, S.; Detyniecki, M.; Cohen, D.; Chetouani, M. Multimodal stress detection from multiple assessments. IEEE Trans. Affect. Comput. 2016, 99. [Google Scholar] [CrossRef]
  29. Mottelson, A.; Hornbæk, K. An Affect Detection Technique using Mobile Commodity Sensors in the Wild. In Proceedings of the 2016 ACM International Joint Conference on Pervasive and Ubiquitous Computing UbiComp’16, Heidelberg, Germany, 12–16 September 2016; pp. 781–792. [Google Scholar]
  30. Yanga, C.; Huangb, Q.; Lic, Z.; Liua, K.; Hua, F. Big Data and cloud computing: innovation opportunities and challenges. Int. J. Digit. Earth 2017, 10, 13–53. [Google Scholar] [CrossRef]
  31. Rostaminia, S.; Lamson, A.; Maji, S.; Rahman, T.; Ganesan, D. W!NCE: Unobtrusive Sensing of Upper Facial Action Units with EOG-based Eyewear. Proc. ACM Interact. Mob. Wearable Ubiquitous Technol. 2019, 3, 23. [Google Scholar] [CrossRef]
  32. Clay, A.; Couture, N.; Nigay, L. Engineering affective computing: A unifying software architecture. In Proceedings of the Affective Computing and Intelligent Interaction and Workshops, Amsterdam, The Netherlands, 10–12 September 2009. [Google Scholar]
  33. Kandel, S.; Paepcke, A.; Hellerstein, J.; Heer, J. Wrangler: Interactive Visual Specification of Data Transformation Scripts. In Proceedings of the ACM CHI Conference on Human Factors, Vancouver, BC, Canada, 7–12 May 2011. [Google Scholar]
  34. Nnebedum, V. Data Engineering: Using Data Analysis Techniques in Producing Data Driven Products. Int. J. Comput. Appl. 2017, 161, 13–16. [Google Scholar]
  35. Mohino-Herranz, I.; Gil-Pita, R.; Ferreira, J.; Rosa-Zurera, M.; Seoane, F. Assessment of Mental, Emotional and Physical Stress through Analysis of Physiological Signals Using Smartphones. Sensors 2015, 15, 25607–25627. [Google Scholar] [CrossRef] [PubMed]
  36. Zhang, F.; Niu, K.; Xiong, J.; Jin, B.; Gu, T.; Jiang, Y.; Zhang, D. Towards a Diffraction-based Sensing Approach on Human Activity Recognition. Proc. ACM Interact. Mob. Wearable Ubiquitous Technol. 2019, 3, 33. [Google Scholar] [CrossRef]
  37. Rahman, T.; Zhang, M.; Voida, S.; Choudhury, T. Towards Accurate Non-Intrusive Recollection of Stress Levels Using Mobile Sensing and Contextual Recall. In Proceedings of the 8th International Conference on Pervasive Computing Technologies for Healthcare, Oldenburg, Germany, 20–23 May 2014; pp. 166–169. [Google Scholar]
  38. Witten, I.; Hall, M.; Frank, E.; Holmes, G.; Pfahringer, B.; Reutemann, P.; Witten, I.H. The WEKA data mining software: An update. ACM SIGKDD Explor. Newsl. 2009, 11, 10–18. [Google Scholar]
  39. Barua, S.; Begun, S.; Ahmed, M.U. Supervised machine learning algorithms to diagnose stress for vehicle drivers based on physiological sensor signals. In Proceedings of the 12th International Conference on Wearable Micro and Nano Technologies for Personalized Health, Västerås, Sweden, 2–4 June 2015; Studies in Health Technology and Informatics. Volume 211, pp. 241–248. [Google Scholar]
  40. Meiring, G.; Myburgh, H.C. A review of intelligent driving style analysis systems and related artificial intelligence algorithms. Sensors 2015, 15, 30653–30682. [Google Scholar] [CrossRef] [PubMed]
Figure 1. Design Model for affective understanding systems and studies.
Data 04 00052 g001
Figure 2. Data sources considered in the stress detection system.
Data 04 00052 g002
Figure 3. (a) Camera setup in the car, one recording the road and the other recording the driver’s face. (b) Respiration belt and ECG sensors on the driver. (c) Car setup with a Nexus-10 device (d) GRS and ECG sensors on the driver.
Data 04 00052 g003
Table 1. Studies reviewed from literature.
Study/YearCaptured DataExtracted FeatureInterpretation ProcessLab/Real Study
Healey and Picard, 2005 [7]Electrocardiogram (EKG), electromyogram (EMG), skin conductivity, respiration, facial expression and Perceived stressNormalized ECG, EMG, Eight skin conductivity features, Heart rate variability (HRV), …ANOVA, confusion matrix, Correlation coefficientsReal Driving
Schießl, 2007 [8]Front and back camera views, distance from front car, breaks, steering, and velocity of the car, Subjective strain using questionnairesFourteen types of car manoeuversANOVA statistical methodReal driving + Lab simulation
Taelman et al., 2008 [9]Heart Rate (HR), HRVMean RR-intervals low frequency (LF)/high frequency (HF) ratios laboratory environment
Bundele and Banerjee 2009 [10]Skin conductance, Oxymetry PulseEighteen features of mean, standard deviation, frequency spectrum, …, ect.Multi-layer Neural Network.Real driving
Wijsman et al., 2010 [11]EMGEMG Root Mean square (RMS), amplitude, Frequency, GapsStatistical analysislaboratory environment
Rigas et al., 2011 [12]electrocardiogram (ECG), galvanic skin response (GSR), respiration, face video, weather, traffic and road visibilityFifteen different features (e.g., mean RR, LF/HF, Mean respiration …)4 classifiers: Support Vector Machine (SVM), Decision Tree, Native bayes and General Bayesian.Real driving
Bakker, Pechenizkiy, and Sidorova, 2011 [13]GSRChange detectionAdaptive Windowing (ADWIN)Real workplace
Ertin et al., 2011 [14]ECG, respiratory, skin temperature and GSRmean, variance, heart rate, and respiration rateArchitecture explainedField Study
Hernandez, Morris, and Picard, 2011 [15]skin conductance, subjective ratingsskin conductanceSupport Vector MachinesWork environment
Paschero et al., 2012 [16]Facial imagesfeature vector extraction, feature vector normalization and preprocessingclassification using neural networks multilayer perceptron (MLP) trained by error backpropagation (EBP) algorithm, then neuro-fuzzy algorithmlaboratory environment
Schneegass et al., 2013 [17]ECG, temperature, skin conductance, Global Positioning System (GPS) acceleration, face and road imagesECG, temperature, skin conductance, GPS acceleration, face and road imagesStatistical (ANOVA, t-test)Real driving
Marcos-Ramiro, 2014 [18]Face videoShannon’s entropy of blinking events; entropy, mean, and standard deviation of time between blinks, …, etc.per-pixel classification of extracted eye imagesjob interview database
Luijcks et al., 2014 [19]EMG, ECGMean, RMSStatistical analysislaboratory environment
Liu and Ulrich, 2014 [20]electrocardiogram (ECG)Heart rate variability (HRV) and ECG. Fourier Transform and take the logarithm of summed total power in 10Hz bandslinear SVMReal driving database
Sun, Paredes and Canny, 2014 [21]ECG and Mouse movementHRV, LF/HF, Power HF & LF, Mean and RMS of RR Mouse Width and distanceStatisticalLab Simulation
Rozanowski, et al., 2015 [22]Perceived stress questionnaire, personality questionnairesSubjective stress, coping style, number of mistakes, and reaction timeStatisticalLab Simulation
Hovsepian et al., 2015 [23]Respiration, ECG, Self-reported StressECG features (e.g., RR peaks) mean and median respiration, …)Support Vector Machines algorithmLab and field study
Haouij et al., 2015 [24]Electrodermal activity (EDA)six features are extracted from each 1-min segment: the mean, standard deviation, and four electrodermal response characteristicsRandom forest method for features ordering, the recognition analysis based on a Linear Discriminant Function (LDF).Real Driving
Chen et al., 2015 [25] electroencephalography (EEG), ECG, EMG, blood pressure, blood oxygen, respiration, facial video, social contents (text)EEG, ECG, EMG, blood pressure, blood oxygen, respiration, facial video, social contents (text)Not reportedReal application
Rodrigues et al., 2015 [26]ECG 3 axis accelerometer GPSof Heart Rate Variability (HRV).Not reportedReal Driving
Boateng and Kotz, 2016 [27]heart rate (HR), heartrate variability (HRV)14 HR and HRVSupport Vector Machine (SVM)laboratory environment
Aigrain et al., 2016 [28]EMG, GSR, skin temperature, respiration, Blood Volume Pressure (BVP) and HR. video of the face; video of the whole body.17 physiological features. 27 behavioral features.SVM with a linear kernel function.
Metric Learning for Kernel Regression.
laboratory environment
Mottelson and Hornbæk, 2016 [29]self-assessed affect, and motion sensor measurements on a mobile352 features selected from motion sensor measurements (e.g., Speed, precision)Many classification methods (e.g., k-Nearest Neighbor and SVM).Real life
Zhalehpour et al., 2017 [6]Frontal view of the face, half profile view of the face, audioFacial features (Local Phase Quantization and Patterns of Oriented Edge MagnitudesSVM classifier, decision level fusion technique, probability fusion approacheslaboratory environment
Sarsenbayeva et al., 2019 [4]HRV, self-reported anxiety levelsHF (High-Frequency) powers of the HRVANOVA statisticallaboratory environment
Table 2. Rates of the collected physiological data.
Data SignalRate of Recording Signal Per Second (SPS)
EEG256
EMG2048
GSR/skin conductance (SC)32
Respiration (RSP)32

