1. Summary
Tuberculosis (TB) remains one of the most widespread causes of death worldwide: around 10 million people around the world suffered from the developed TB disease in 2017 according to the current World Health Organization report [
1]. The goal of fighting this illness requires intensive laboratory investigations of the population growth of its main infectious agent,
Mycobacterium tuberculosis, as clinical samples, as well as in the context of the influence of anti-TB drugs. The latter is also quite important due to the emergence of multidrug-resistant TB [
1]. Simultaneously, one needs relevant mathematical models aimed not only at fitting growth data obtained in vitro, but also at connecting the respective growth functions and coefficients (e.g., the growth rate) with conditions characterizing a bacterial community and a medium where the growth occurs [
2]. Due to a complexity of factors affecting this growth, the development of such models is still active in the general bacterial case, as well as for mycobacterial growth, in particular, as described in [
3,
4,
5,
6]. In addition, there exists a demand on the experimental test datasets obtained in vitro of using clear standard mycobacterial cultures, which allows for testing such models and the premises of the growth mechanisms. The obtained data, which indicate an accelerated (instead of linear) growth of the population density logarithm between the end of the lag phase and the saturation, provide evidence of the importance of the growth rates’ stochasticity. An analysis of the curve fits resulted in an estimation of the first two moments of the growth rates’ probability distributions, showing its relevance to vital processes for mycobacterial culture.
Among the most popular modern methods of the express diagnostics of the mycobacterial growth, one can note the resazurin (also known as the Alamar Blue dye) assay based on the oxidation–reduction process leading to the color change of the blue non-fluorescent resazurin to highly fluorescent pink resorufin due to bacterial metabolism of viable cells [
7,
8,
9,
10,
11], i.e., it allows for estimating bacterial count, as well as taking into account physiological processes accompanying and controlling the multiplication of bacteria.
With respect o
M. tuberculosis, it should be pointed out that recent studies have indicated a high variability in the individual cells’ proliferation and growth rates even within a population of a uniform strain culture [
12,
13,
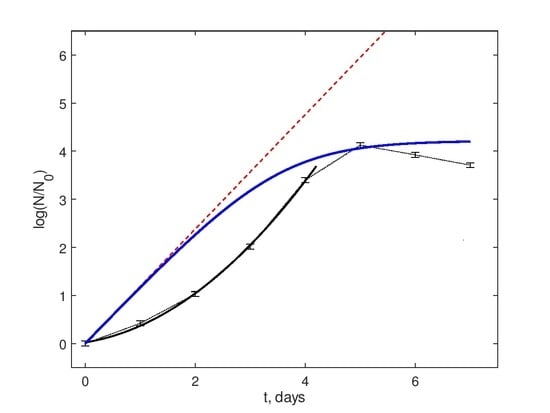
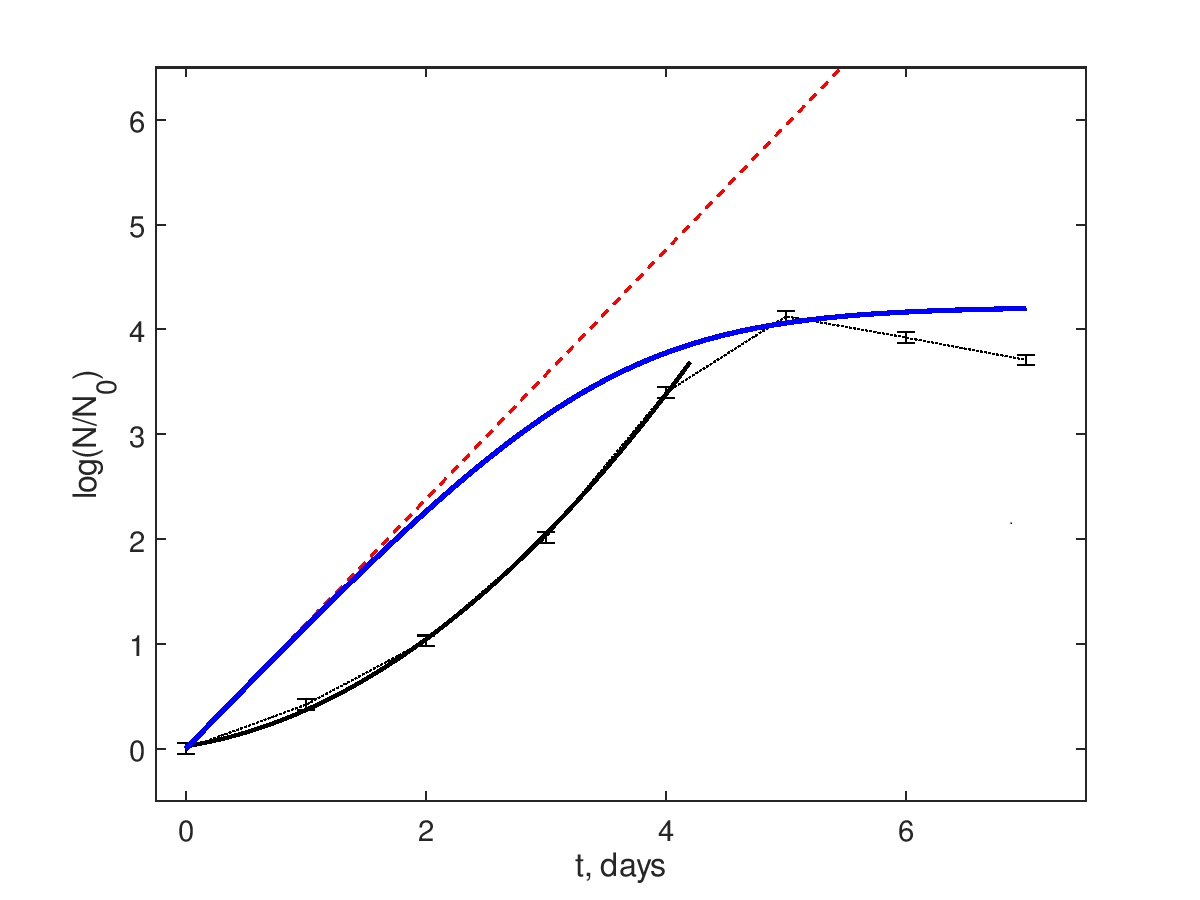
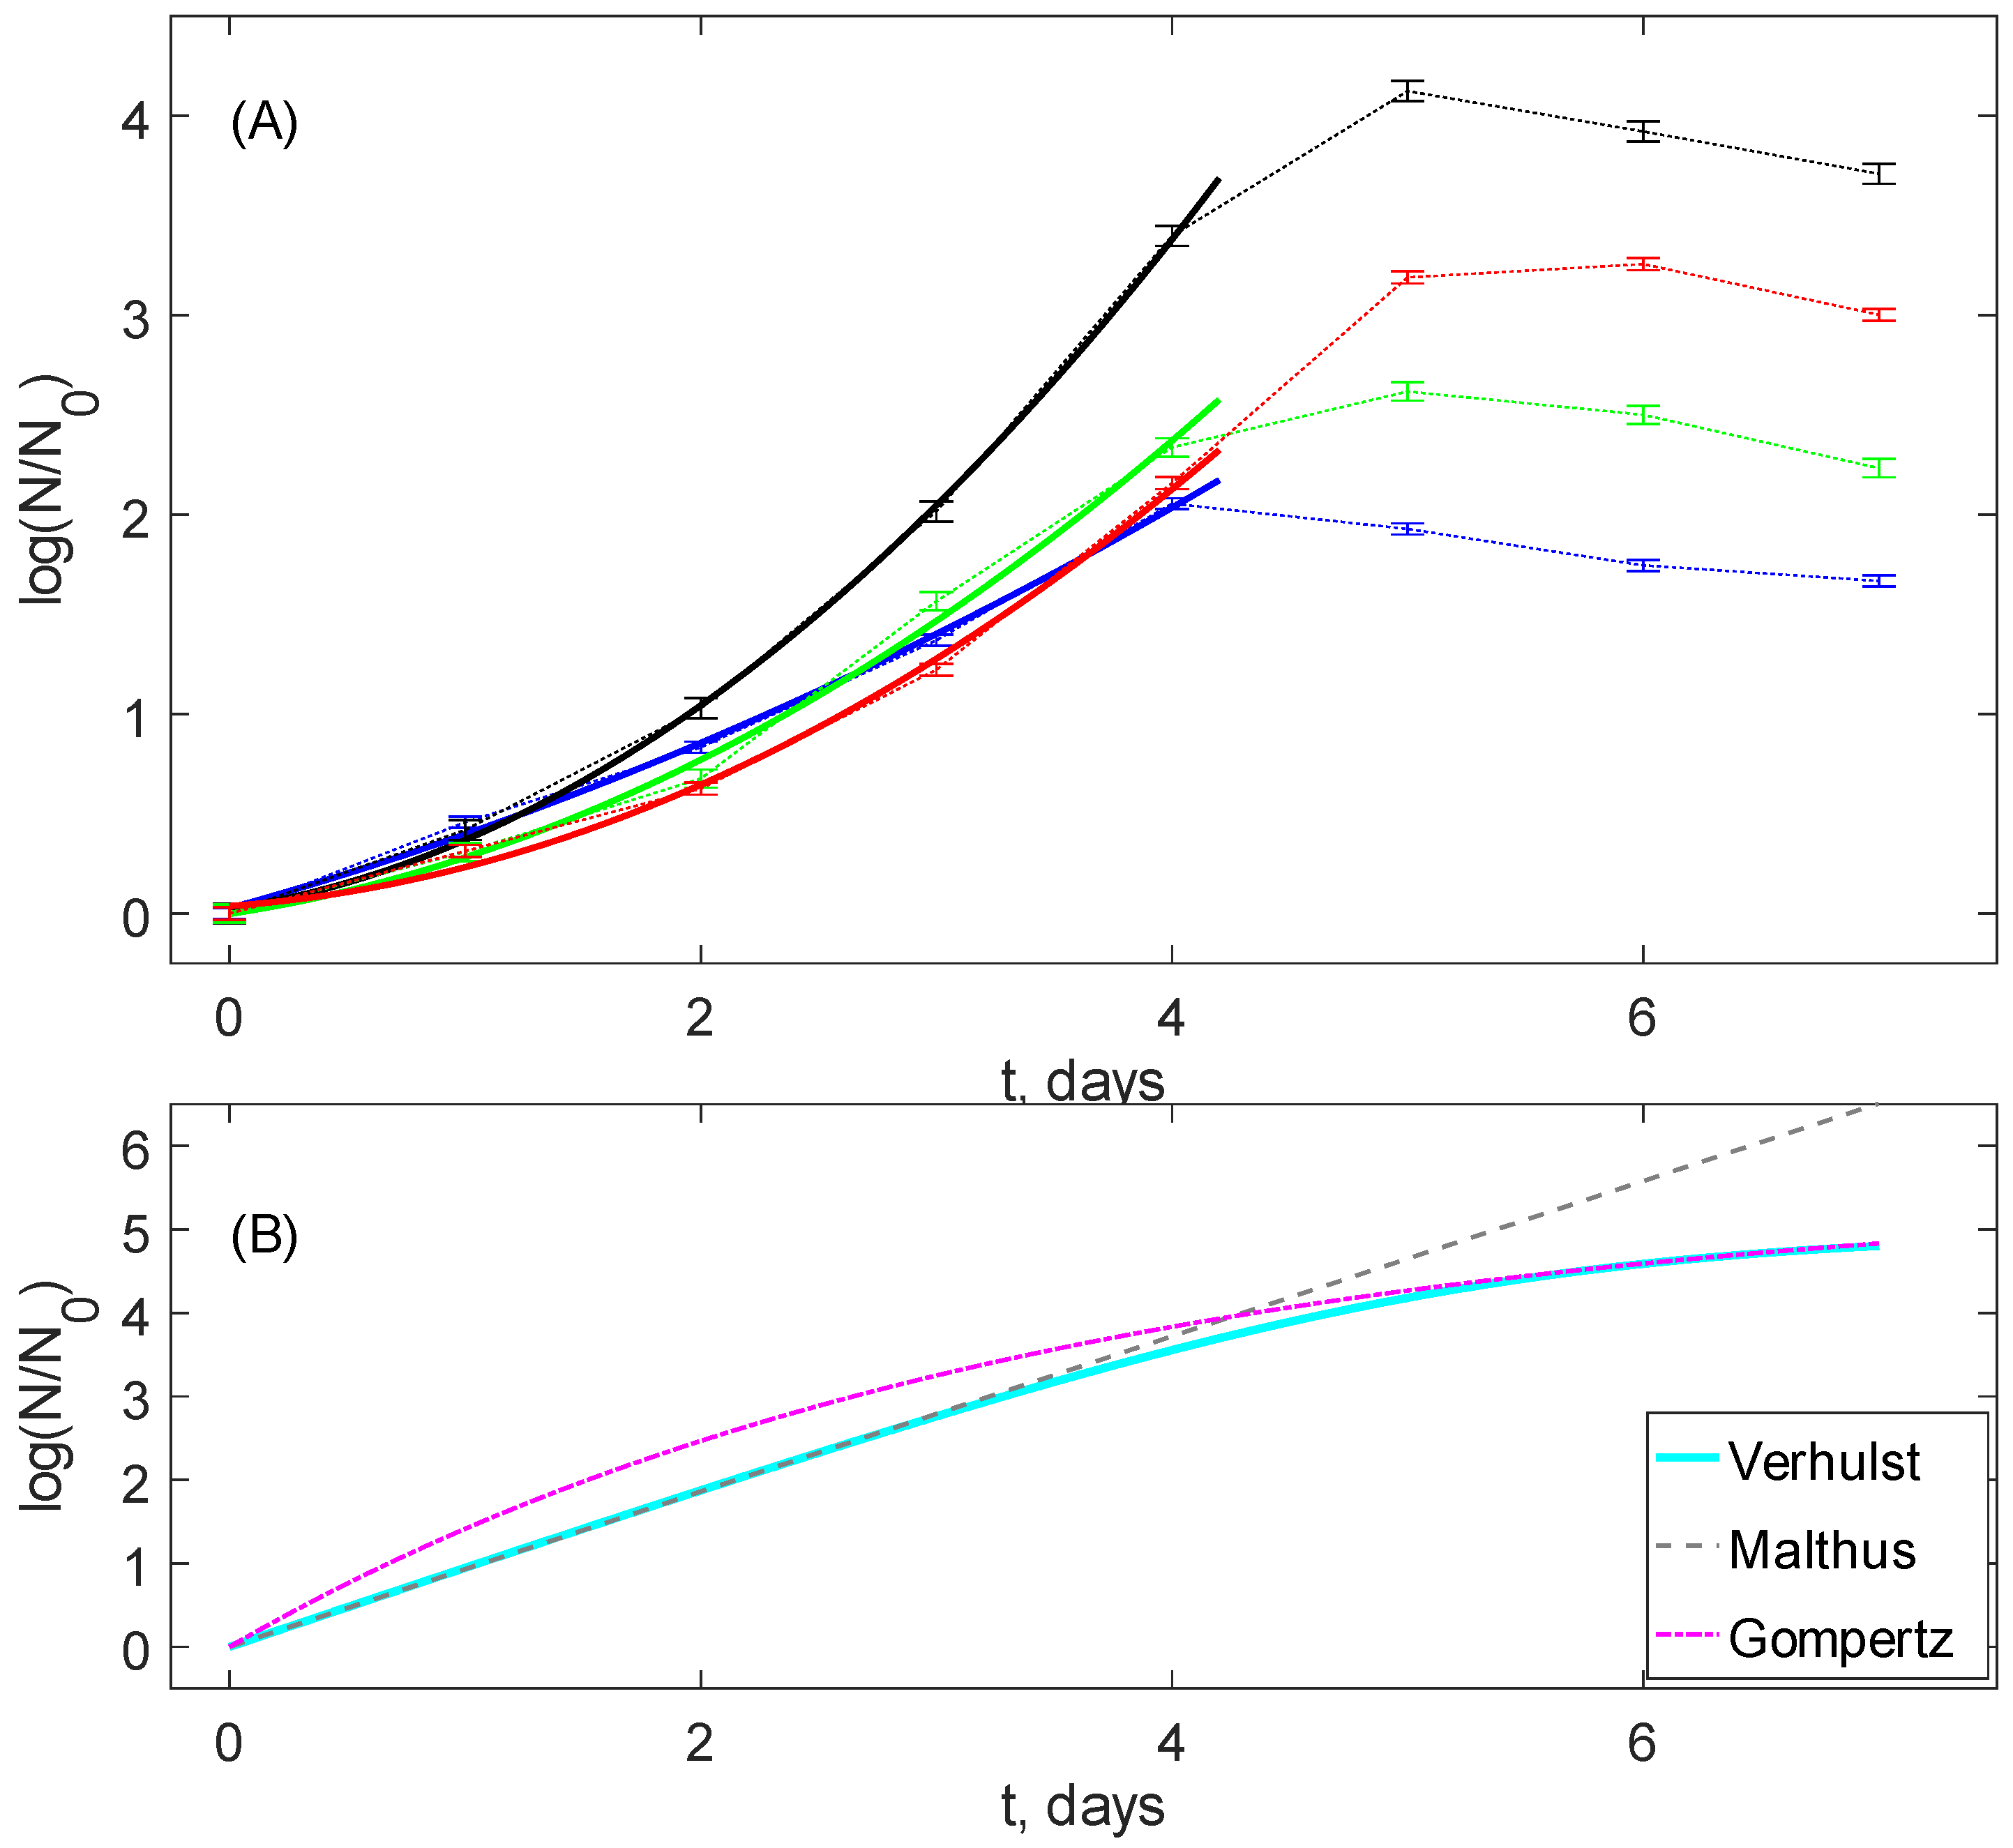
14]. This may induce deviations from the conventional behavior of bacterial growth curves, which normally include the lag-phase, the exponential growth phase, the saturation phase, and the decay phase, and, with respect to two intermediate phases in the aforementioned list, be modeled by the classic population growth models like Verhulst, Gompertz, Richards, etc. Some examples are shown in
Figure 1B.
Note that such models imply the existence of the exponential growth phase, i.e., the linearity of the population density N reduced to its value at the phase’s beginning in semi-logarithmic co-ordinates , where r is the growth rate. In a general case, there are concave up curves tending to the saturation due to a finite medium carrying capacity.
On the contrary, it has been recently revealed [
15] that the stochasticity in the growth rates, under quite general assumptions on their probability density distribution, results in the replacement of the semilogarithmic linearity with the quadratic logarithmic growth function
. Namely, a similar curve shape is detected in the experimental observations in
Figure 1A, and the details will be given in the section Data Description.
Thus, in order to investigate these stochastic effects on the growth curves of a mycobacterial population, we report a detailed study of the mycobacterial growth curves spectrophotometrically detected via the resazurin assay microtiter kit in the case of a variety of sample preparation conditions. All measurements reported are evaluated with the strain H37Rv of
Mycobacterium tuberculosis, which is a standard reference strain in TB research [
16].
2. Data Description
The dataset provided in this paper presents the dynamics of fluorescence activity recorded during the resazurin assay test with the strain H37Rv of M. tuberculosis taken from the strain library maintained by the Saint-Petersburg State Research Institute of Phthisiopulmonology acting under the Ministry of Health of the Russian Federation.
The details of samples’ preparation and measurement procedures evaluated under different initial conditions are given in the section “Method” below. The principal groups of data are listed in
Table 1. They represent four possible combinations of initial conditions for the mycobacterial cultures: two different initial dilutions determined the initial population density (found optically before placing the culture into the microplate kit) and two different generations cultured previously. To avoid possible bias, the data presented in Columns 1–8, 9–16, and 17–20 in the
Supplementary Data (the sheet “Raw data”), and referred to as “sample #” in the plots and discussions below, originate from experiments separated by two-month intervals between them; their initial seeds were prepared separately as well.
Data Processing and Analysis
Figure 1A shows typical data of fluorescence dynamics for all four groups. The data points denoted via markers were obtained as values averaged over eight individual wells of the microplate’s row. Since the measurement procedure was designed to start recordings after the lag-phase, the growth phase, the saturation phase, and the decay phase are visible. The time points for all data are depicted in the semi-logarithmic scale and normalized with respect to the first point. This visibly differs from the classic saturating growth shown in
Figure 1B. Namely, they are concave down up to the time moments very close to the saturation. This confirms that this behavior cannot be explained by the lag-phase effects and should be considered as the consequence of an existence of additional mechanisms affecting the active bacterial growth phase.
To reveal the respective growth law, we fitted five first data points for each sample (they were chosen as corresponding to the active growth phase, which does not reach the saturation guaranteed) by the quadratic polynomial using the standard MATLAB/OCTAVE function
polyfit, which calculates the best fit in a least-squares sense:
where
,
are the polynomial coefficients. The value of the constant term
shows a deviation of the logarithm of initial population
provided by the fit from its actual value
; in fact, it did not deviate from zero within the accuracy of data and, therefore, was negligible for all samples. The coefficient
takes into account the exponential component of the population growth function
; it is the leading term in the case of normal Malthusian growth of a uniform population and represents the average Malthusian growth rate otherwise. For this reason, we denoted it as
for uniformity with the stochastic growth model discussed below. This model argues that the distribution of growth rates leads to an emergence of the quadratic component with the rate
connected to the variance of the growth rates, i.e., the notation
is introduced.
One can see in
Figure 1A that these second-order polynomials satisfy the experimental data with high accuracy, the average correlation coefficient for all samples being equal to 0.99 and the standard deviation to 0.014. Thus, we can conclude that, in addition to the classic uniform average Malthusian growth (the term
in Equation (
1)), there exists an additional term
describing an accelerated growth (it is positive for all samples,
) far from the saturation conditions, but sufficiently after the lag phase.
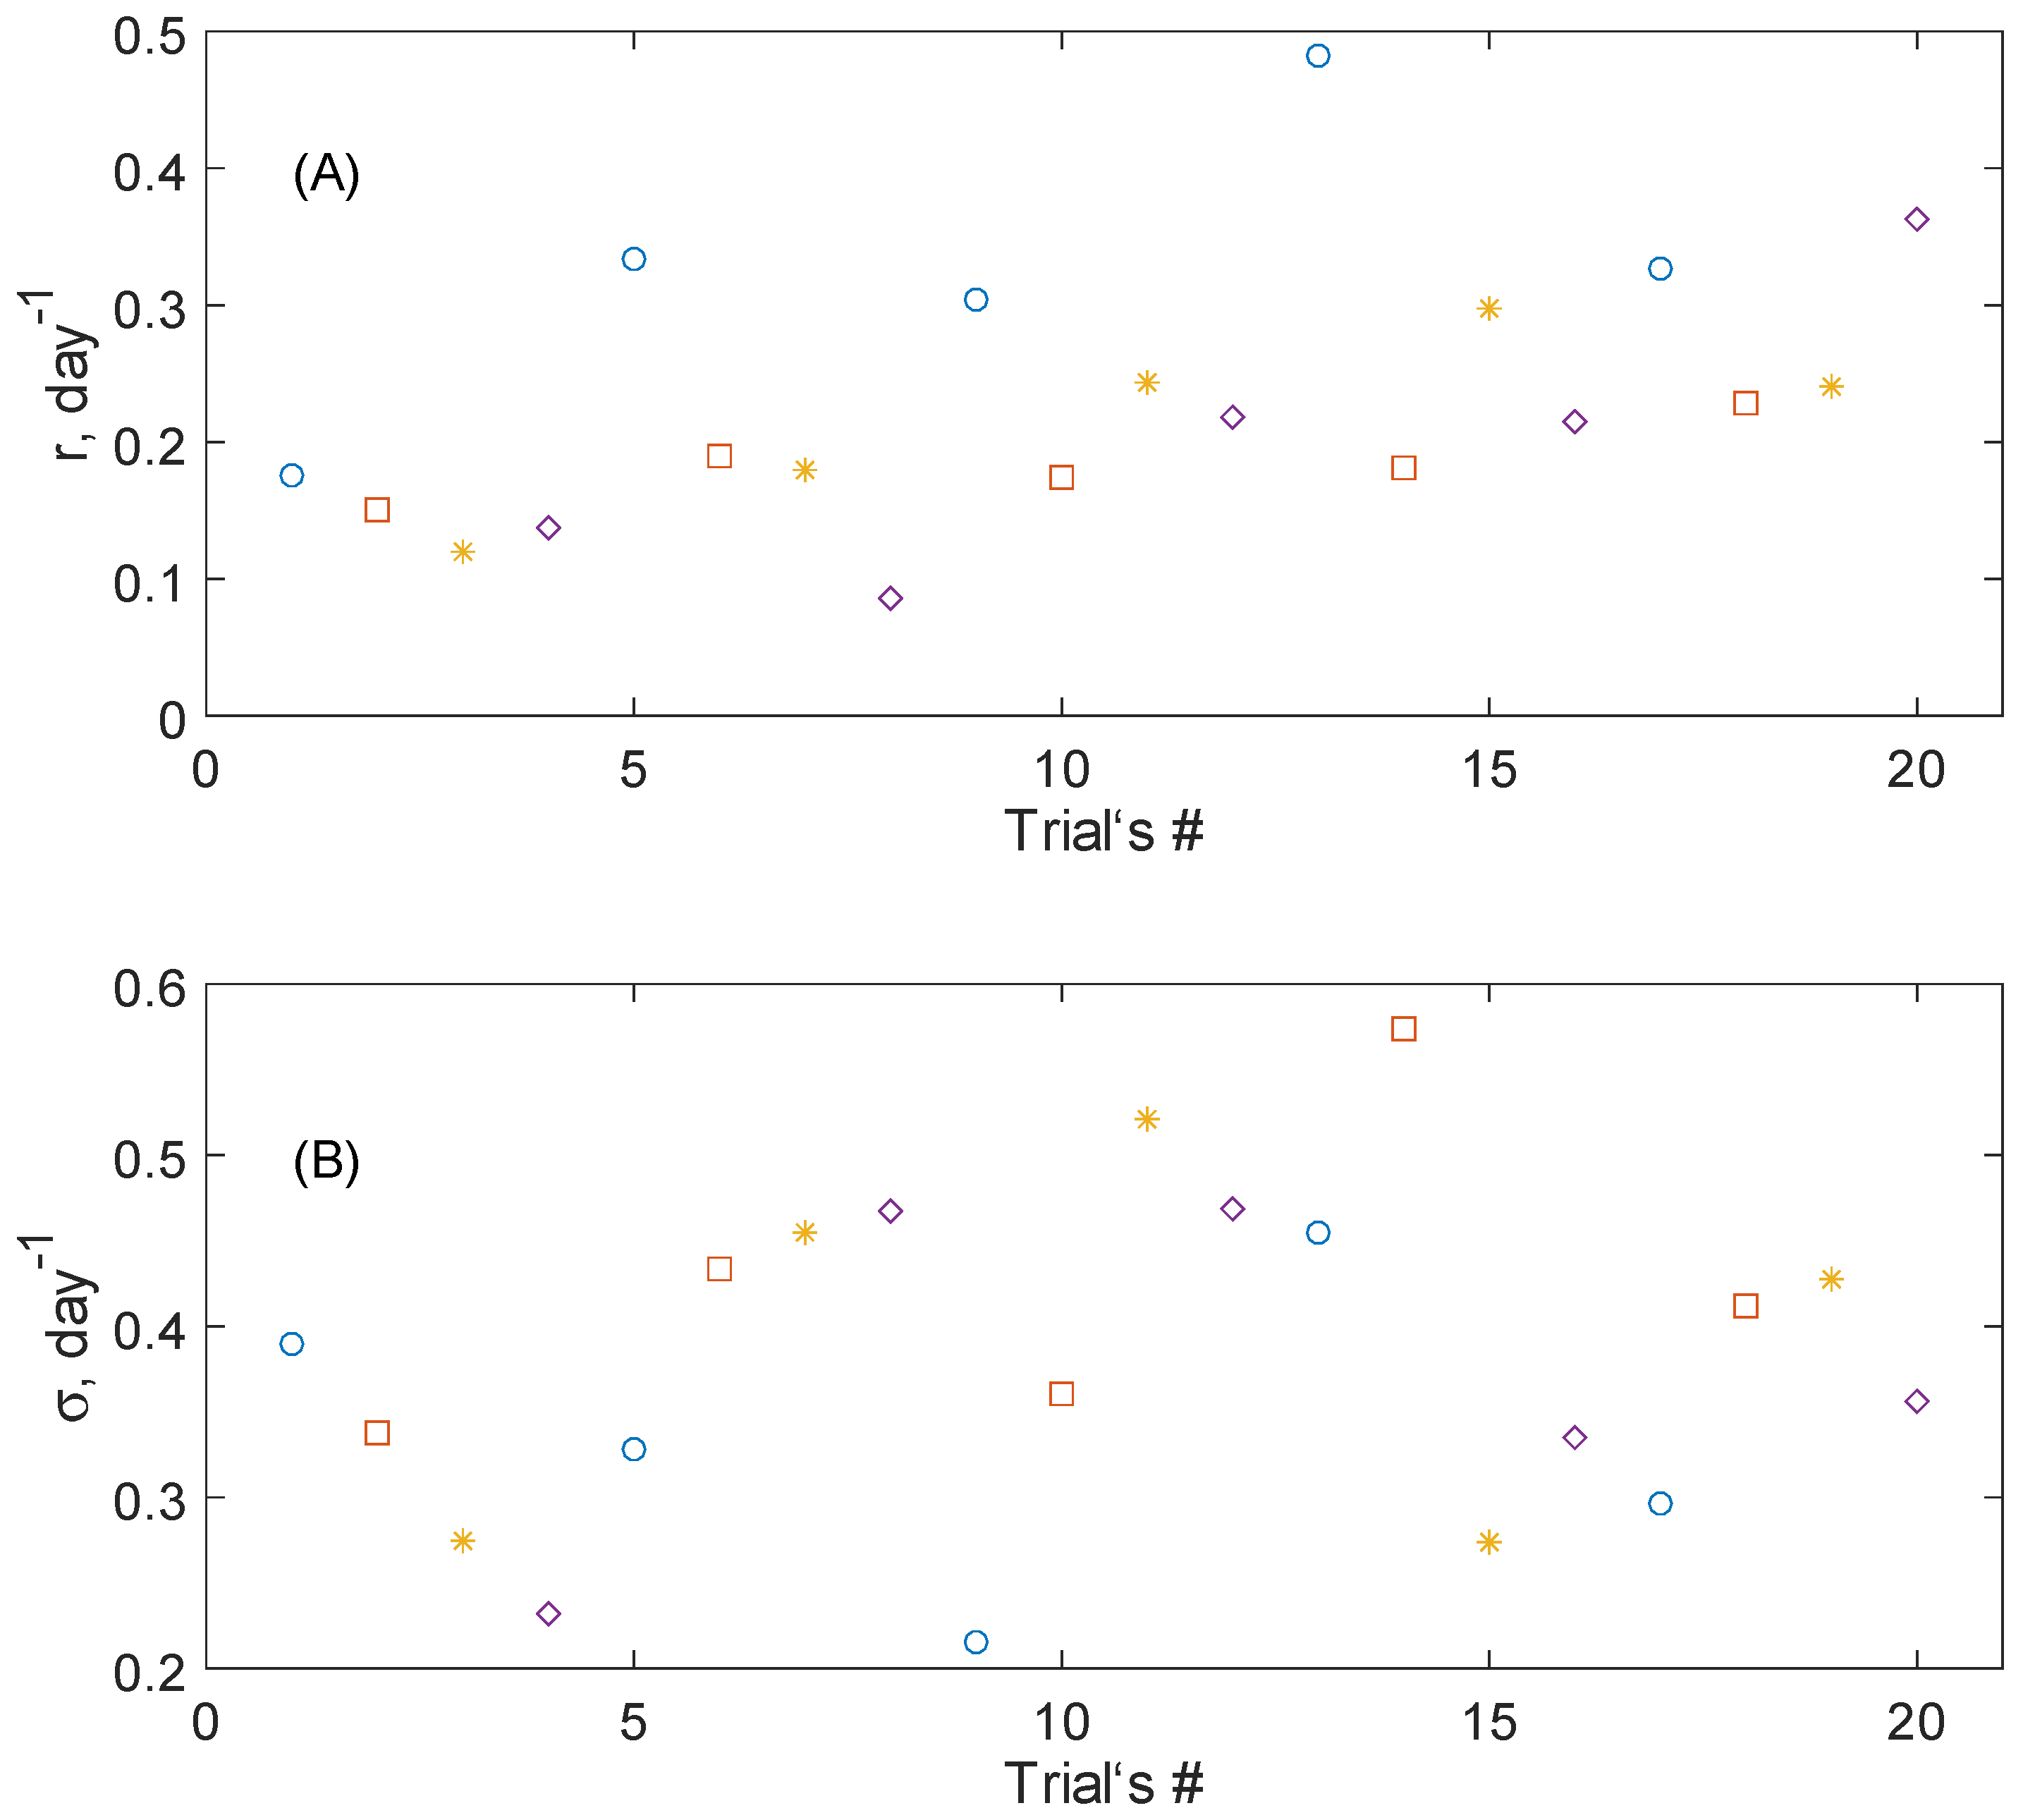
The distribution of
r and
σ for all trials marked with respect to the samples groups is shown in
Figure 2. One can see that the values of the average growth rates
r form a quite localized, bounded stripe with outliers with relatively larger values for Group 1;
σ values are distributed more uniformly among all groups. This conclusion is supported by the numerical value averaged over each group presented in
Table 1. For the first group,
was 1.5-times larger than for Groups 2–4, while the dispersion of
was not so drastic.
3. Data Discussion with Respect to the Stochastic Growth Model
Following [
15], let us consider the growing mycobacterial culture as consisting of multiple sub-populations
(individual bacteria, bacterial colonies, or even groups of colonies) parametrized by the variable
P, each of which grows exponentially within the chosen time interval between the lag-phase and the start of saturation:
where the partial growth rate
for each sub-population, and the initial value
is the same for all.
Assuming random variations of the individual growth rates, the observable quantity is the mean value for the whole population with respect to the probability density function
:
For simplicity, let us consider the growth rates parametrized as
and take
as the Gaussian normal distribution with the mean
r and the dispersion
. Then,
Note that we have taken negative
, which corresponds to a possible presence of initial bacteria, which become extinct during the experiment. In fact, more complex dependencies of the growth rate on the substrate consumption described by more complicated functions
, e.g., Jacob–Monod’s (Holling II), as well as more complex probability distributions
observable in population dynamics, can be reduced to the same Gaussian-based form (
2) within the considered characteristic time interval, introducing an effective mean growth rate
and an effective acceleration
; see [
15] for details.
Comparing Equations (
1) and (
2), we can conclude that the revealed fit corresponded to the growth of a mixed population, where the mean duplication time
varied from 52 h (for Group 1) to 92 h (for Group 2). These values belong to the reasoned generation time for
Mycobacterium tuberculosis, which can vary from 16–160 h in dependent of the internal (metabolic) or external (medium-based) conditions [
17,
18]. In addition, we stress that it is the mean value for the stochastic population with a wide dispersion of growth rates; compare
and
, which are similar in value. Moreover, for larger initial generations and/or lower initial concentrations,
, which indicates even the presence of dying bacteria. On the other hand, the upper limit of generation times within the standard deviation
varied within 25 and 27 h, and
lied within the more narrow interval of 16.3–17.2 h for the doubled standard deviation (subscripts 0.68 and 0.95 indicate the percentage bounds for the distributed population) that accurately corresponds to the known biological lower boundary for the mycobacterial duplication time.
4. Method
The principal protocol followed [
19] with some adjustments to the actual conditions of the experiment. The suspension of
M. tuberculosis was unfrozen for three weeks before the experiment and cultured on Löwenstein–Jensen medium. The suspension was prepared as follows: the bacterial culture was placed into a dry sterile tube together with 10 glass spheres (3–5 mm in diameter). The bacterial mass was rubbed with the shaker “Vortex”, and 3–4 drops of the Middlebrook 7H9 broth (Becton-Dickinson; Franklin Lakes, NJ, USA) were added, then the system was rubbed again. Then, 5 mL of the Middlebrook 7H9 broth were added, and the system was kept for 1 h to precipitate conglomerates. The upper part of the supernatant (2 mL) was processed to obtain a density equal to 1 McFarland unit. The obtained suspension was 40-times diluted by the Middlebrook broth supplied with 10% OADC (oleic acid, albumin, dextrose, and catalase) (Becton-Dickinson; Franklin Lakes, NJ, USA) and 0.01% water of resazurin (30 μL for a 200-μL volume prepared for distribution among the wells of the microtiter plate) and was inoculated into a 96-well plate.
Fluorescence was measured by the FLUOstar OPTIMA microplate-based multi-detection reader (
www.bmglabtech.com) with the excitation and emission wavelengths of 530 nm and 590 nm, respectively, during 7 days daily.
To process the obtained data and generate the numerical values given in
Table 1 and the figures, the free scientific software GNU OCTAVE (
https://www.gnu.org/software/octave/) was used with its standard functions of statistical analysis and polynomial fitting. The
Supplementary Material to this work contains the program code written for this goal, which directly used the data file in Excel format, provided there as well.
5. Conclusions and Outlooks
In this work, we presented a dataset that consists of the growth curves of the standard reference strain of Mycobacterium tuberculosis H37Rv obtained via the spectrophotometric resazurin assay, which exhibit a non-exponential shape even after completing the lag-phase. This phenomenon and the revealed growth parameters were interpreted as satisfying the recently proposed model of averaging over a non-homogenous population with the stochastic distribution of growth rates. This differs from the behavior of the accelerated growth during the lag-phase, where the reduplication of cells goes with one and the same growth rate, but starts from different time moments.
It should be pointed out that similar replacement of linear or concave down growth curves by the concave up one within the phase of an active growth may be traced back to the early stages of microbiological research [
20], but for a long time, was not under consideration since the paradigmatic mathematical models of the average single population multiplication operates with uniform communities, which do not exhibit such behavior.
However, recently, such non-standard features started to attract the attention of the research community involved in an application of dynamical and stochastic systems theory for modeling macroscopic growth dynamics [
21,
22,
23,
24]. The key aim of such research is to connect the revealed genetic/metabolic variability of individual microorganisms with the macroscopic dynamics of the whole population. With respect to this area of research,
Mycobacterium tuberculosis, which is known as having a relatively large variability range even within one standardized strain, seems to be a good prospective candidate as a model organism, and the reported data may play a role in the benchmarking for testing future, more detailed mathematical models of microbiological dynamics.


