Data Descriptor

A Uniform In Vitro Efficacy Dataset to Guide Antimicrobial Peptide Design

1
Department of Biochemistry, Indian Institute of Science, Bangalore 560012, India
2
Department of Computer Science, University of Texas, Austin, TX 78751, USA
3
Centre for Biosystems Science and Engineering, Indian Institute of Science, Bangalore 560012, India
*
Author to whom correspondence should be addressed.
Submission received: 16 December 2018 / Revised: 1 February 2019 / Accepted: 1 February 2019 / Published: 10 February 2019

Abstract

:
Antimicrobial peptides are ubiquitous molecules that form the innate immune system of organisms across all kingdoms of life. Despite their prevalence and early origins, they continue to remain potent natural antimicrobial agents. Antimicrobial peptides are therefore promising drug candidates in the face of overwhelming multi-drug resistance to conventional antibiotics. Over the past few decades, thousands of antimicrobial peptides have been characterized in vitro, and their efficacy data are now available in a multitude of public databases. Computational antimicrobial peptide design attempts typically use such data. However, utilizing heterogenous data aggregated from different sources presents significant drawbacks. In this report, we present a uniform dataset containing 20 antimicrobial peptides assayed against 30 organisms of Gram-negative, Gram-positive, mycobacterial, and fungal origin. We also present circular dichroism spectra for all antimicrobial peptides. We draw simple inferences from this data, and we discuss what characteristics are essential for antimicrobial peptide efficacy. We expect our uniform dataset to be useful for future projects involving computational antimicrobial peptide design.
Dataset License: CC0

1. Introduction

Antimicrobial peptides (AMPs) are essential components of the innate immune systems of a variety of organisms ranging from microbes to humans. Despite their abundance and early evolutionary development, they still possess efficacy against a broad spectrum of pathogens encountered naturally. AMPs therefore show promise as drug candidates [1] to combat infections resistant to current antibiotics [2].
Most antimicrobial peptides are short molecules, ranging from 6–50 residues [3]. They are typically amphiphilic with a net positive charge [4], although neutral [5] and negatively charged peptides [6] are also encountered. The primary mechanism of action of AMPs involves direct interaction with, and disruption of, the bacterial membrane. Positively charged antimicrobial peptides are attracted towards negatively charged phospholipid moieties, which facilitates AMP incorporation into the lipid bilayer. Post-incorporation, three models compete to explain AMP-induced membrane disruption: the toroidal-pore model [7], the barrel stave model [8], and the carpet model [9]. Although the mechanisms described in these models differ, all describe direct peptide incorporation and disruption of bacterial membranes, leading to death.
Secondary mechanisms of action for AMPs have also been proposed, which include inhibition of aerobic electron transport [10], inhibition of nucleotide [11,12]/protein [13] synthesis, promotion of ribosomal aggregation [14], membrane protein delocalization [15], and metabolic inhibition [14,16]. Adding a further layer of complexity, many natural antimicrobial peptides possess weak bactericidal activity. Rather than directly inhibiting bacterial growth, they are now known to act in concert with the host immune system through mechanisms including chemokine induction [17], histamine release [18], and angiogenesis modulation [19]. These immunomodulatory effects have only recently received attention.
Despite the complexities involved in understanding the mechanisms of action, several attempts at creating AMPs using rational design approaches have been made. Pexiganan [20], for example, is a rationally designed Magainin-2 derivative that displays superior bactericidal properties. Other design approaches have involved employing simple sequence repeats that mimic the biophysical features of natural antimicrobial peptides. Leu-lys repeats [21], trp-arg repeats [22], and trp-leu-lys repeats [23] have all displayed broad spectrum antimicrobial activity. A later study using more elaborate repeat patterns yielded similar results [24]. Computational approaches to AMP design have employed genetic algorithms [25], quantitative structure-activity relationship (QSAR) approaches [26], linguistic models [27], and long short-term memory (LSTM) neural networks [10].
A better understanding of the sequence and structural characteristics responsible for AMP activity would not only help to further understand the mechanisms of natural AMPs, but also form the basis for the de novo design of new AMPs. Essential to understanding these features is the availability of large datasets containing information on the efficacy of existing AMPs. Several databases curating thousands of antimicrobial peptides exist, such as the Antimicrobial Peptide Database (APD) [3], Yet Another Database of Antimicrobial Peptides (YADAMP) [28], the Collection of Antimicrobial Peptides (CAMP) [29], and Data Repository of Antimicrobial Peptides (DRAMP) [30]. In all cases, minimum inhibitory concentration (MIC) data from different sources are compiled to form a single database. This approach is entirely reasonable given the heterogeneous nature of efficacy data available, but nevertheless suffers from significant drawbacks:
  • Individual studies report MIC values obtained using varying protocols, which produce different results.
  • Different groups use different type cultures of the same organism for MIC estimation.
  • Negative data (MIC results for ineffective peptides) is seldom published.
Therefore, MIC values obtained from different sources, but compiled within the same dataset, cannot directly be compared. Furthermore, the lack of negative data limits computational design approaches that require diverse samples for training.
In this study, we report the MIC results of 20 AMPs possessing diverse sequences, and possessing varying efficacy against 30 organisms spanning Gram-negative, Gram-positive, mycobacterial, and fungal origin. We report 600 individual MIC assays. While this data is quantitatively inferior to existing AMP databases (that contain thousands of MIC values), it is qualitatively superior. All MIC experiments were performed on the same strains for every organism, performed using the same protocol, and performed in the same laboratory by the same personnel, ensuring uniformity across the dataset and allowing direct intra-dataset comparisons to be made. Circular dichroism data for the 20 AMPs are also provided. Furthermore, a preliminary analysis revealed sequential and structural traits responsible for AMP efficacy, enhancing the utility of our dataset for future AMP design projects.

2. Data Description

2.1. Minimum Inhibitory Concentration (MIC) Data

We synthesized and experimentally characterized 20 peptides designed using a long short-term memory (LSTM) network [10]. Ten sequences (NN2_0018 → NN2_0055) posed good antimicrobial activity and were described in our previous work [10]. Another 10 sequences (NN2_0000 → NN2_0009) possessed poor antimicrobial activity, and were previously not reported. However, with the failure of designs NN2_0000 → NN2_0009, NN2_0018 → NN2_0055 were designed with additional filters for charge and amphiphilicity. Although NN2_0000 → NN2_0009 are mostly ineffective and possess no therapeutic potential, they can still be used to understand the sequence and structural characteristics of effective peptides. Sequences for all 20 peptides are provided in Table 1. All 20 peptides were readily soluble in distilled water at concentrations ≥2 mg/mL. A broth microdilution method developed for cationic antimicrobial peptides [31] was used for MIC determination. For MIC assays, peptide concentrations of 0.25 μ g/mL → 128 μ g/mL were used. Based on their diversity and clinical relevance, we selected 30 cultures that were chosen for MIC testing. The cultures tested included Gram-negative, Gram-positive, mycobacterial, and fungal organisms. Most of our cultures were obtained from the Microbial Type Culture Collection (MTCC, Chandigarh, India). Minimum inhibitory concentrations (MICs) for all peptides and all cultures are provided in Table 2.
Some cultures displayed plaque or mucoid morphologies, which made the estimation of growth by optical density very difficult. In these cases, a fluorescence-based resazurin minimum bactericidal concentration (MBC) assay was performed instead. Weakly fluorescent resazurin is converted into highly fluorescent resorufin (excitation: 530 nm, emission: 590 nm), which provided an indirect measure of aerobic bacterial respiration.
Availability of MIC data: Minimum inhibitory concentration (MIC) data has been made available as a table in the supplementary information (Table S1). This table was prepared in the comma-separated value (.csv) file-format and contains six columns: peptide name, peptide sequence, organism, culture ID, MIC (in μ g/mL), and MIC (in μ M). Each row provides MIC data for a single peptide against a single organism. It should be noted that Table S1 is merely a machine-readable version of Table 1 and Table 2. Cultures with MIC values >128 μ g/mL are reported as blank cells.

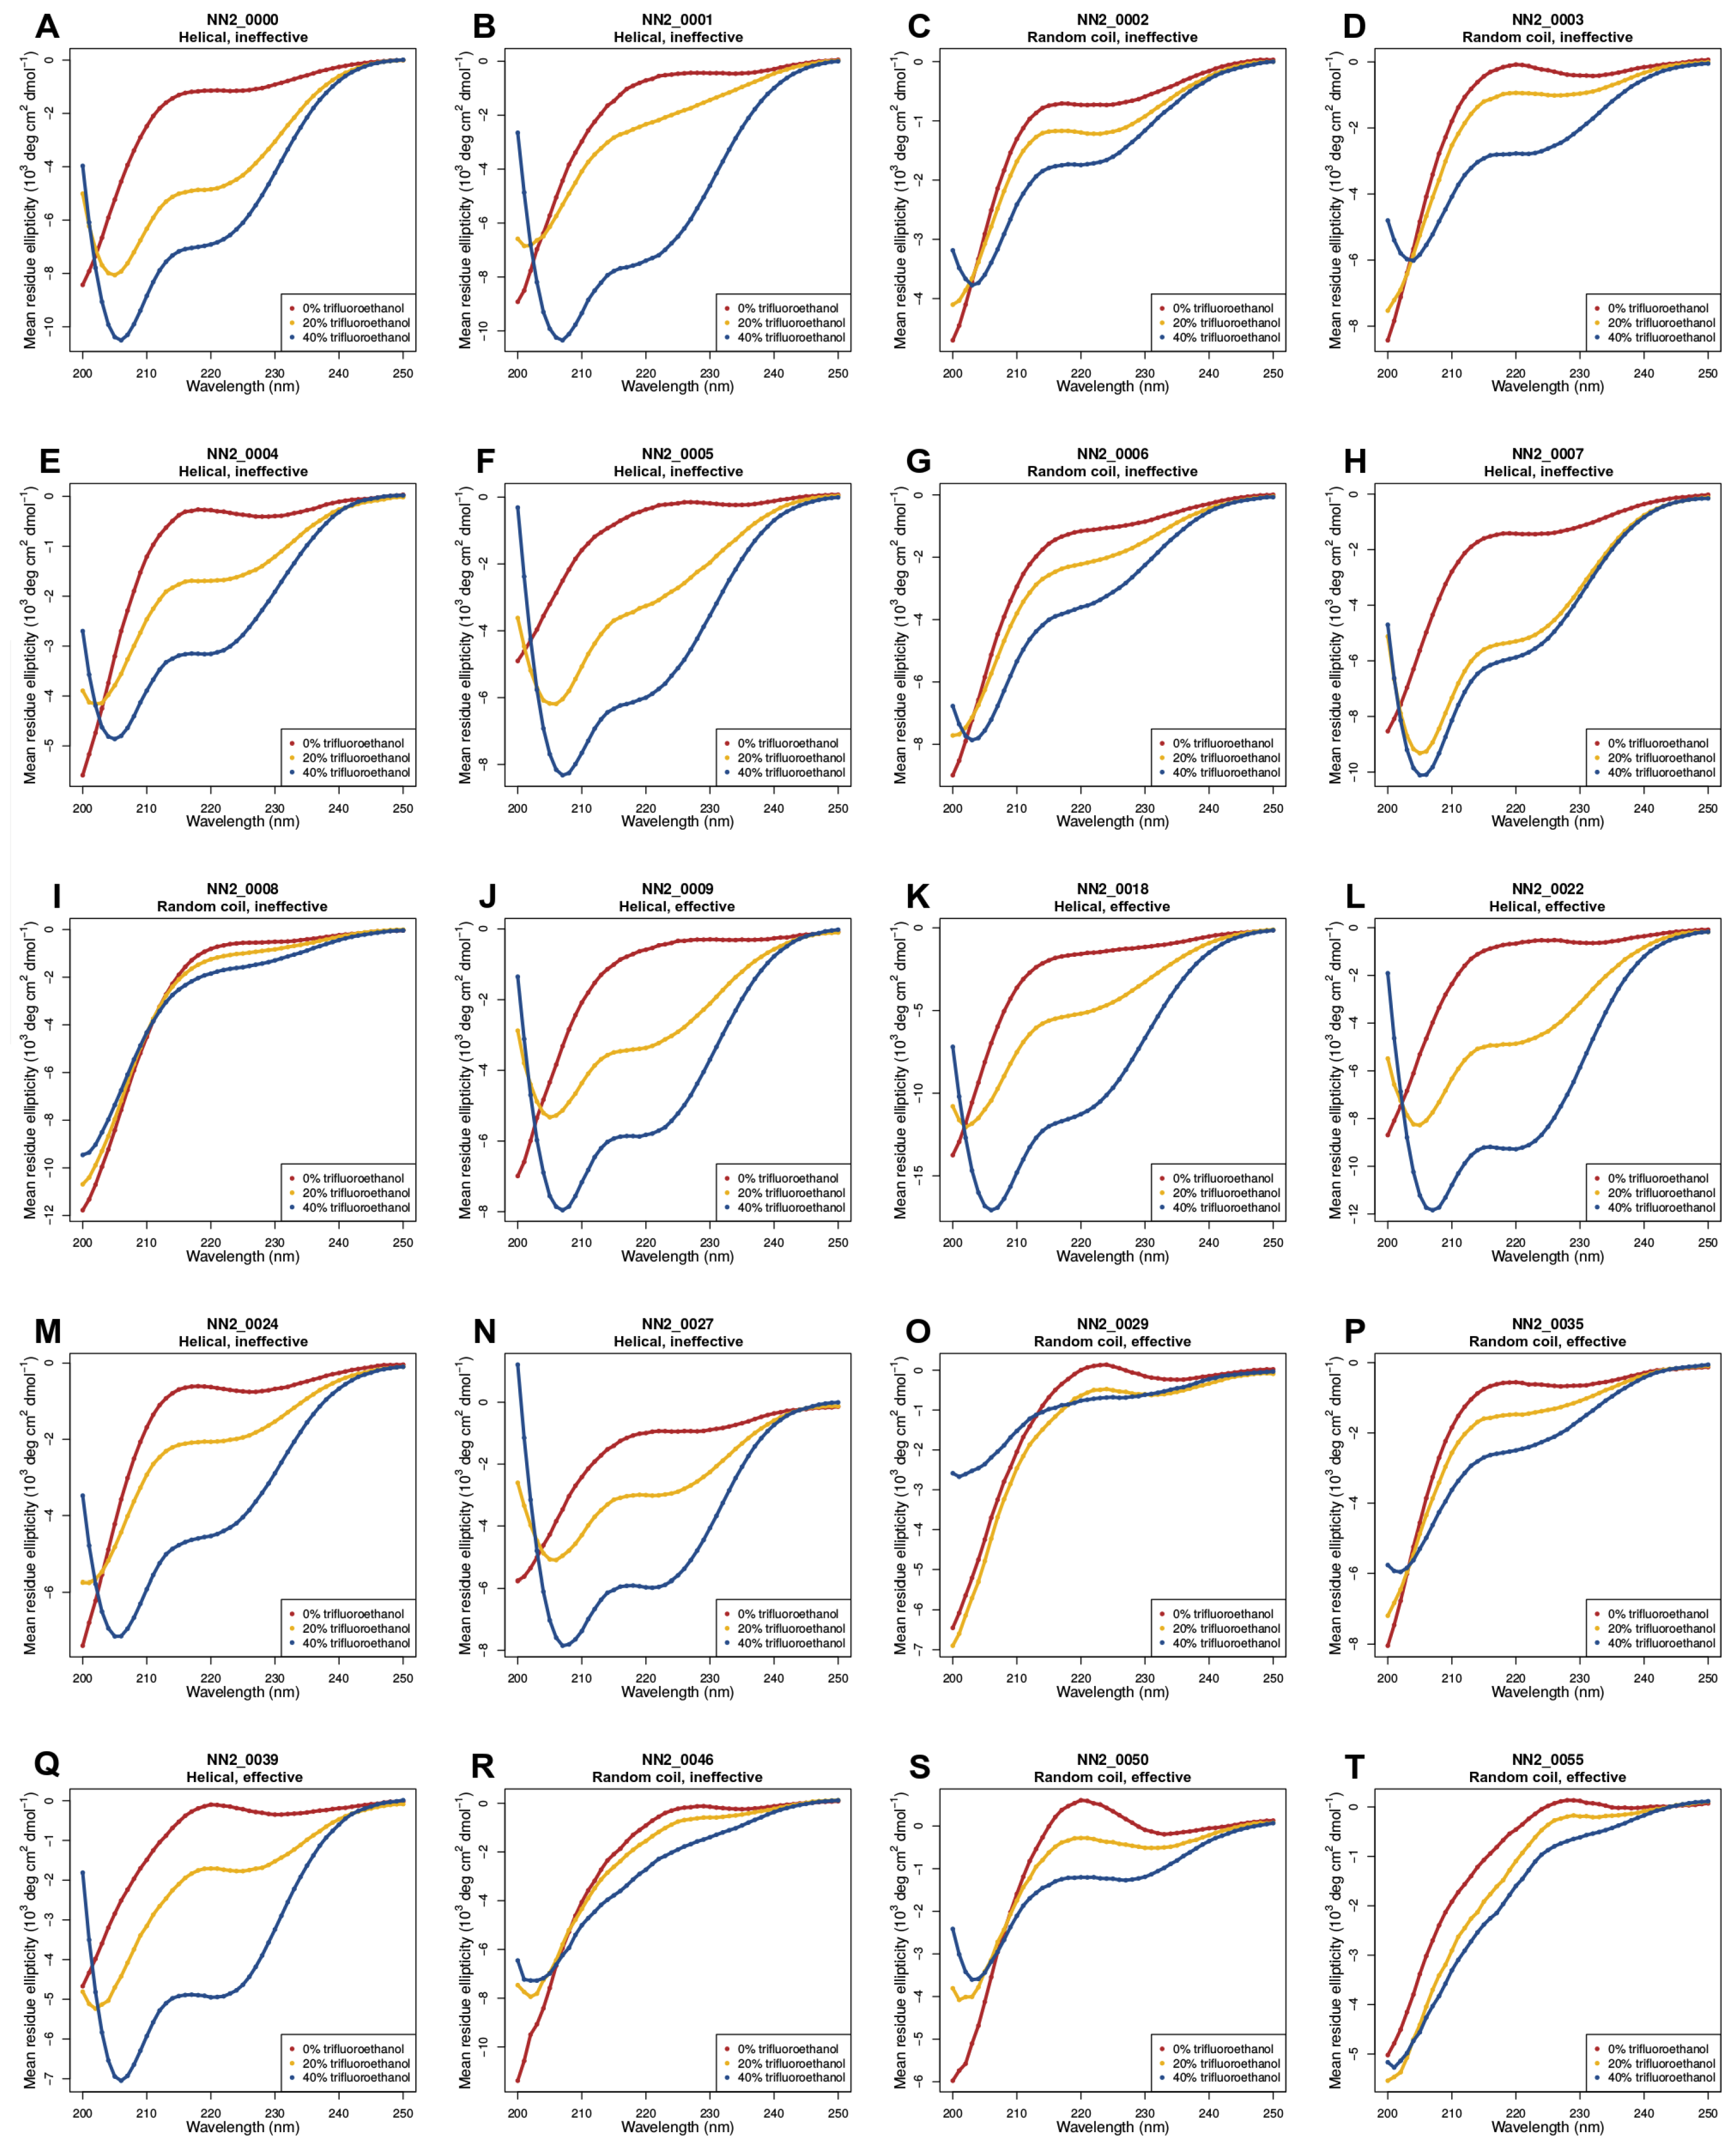
2.2. Circular Dichroism (CD) Data

Circular dichroism (CD) experiments were performed to investigate the secondary structural characteristics of all designed peptides. Near-UV CD experiments in trifluoroethanol (TFE) were performed to determine peptide helical content. Trifluoroethanol is a low-dielectric solvent that encourages helix formation. It is used to mimic the bacterial membrane environment [32,33] while investigating the properties of antimicrobial peptides. All CD spectra are depicted in Figure 1.
Availability of CD data: Raw circular dichroism (CD) data has been made available in the supplementary information (Dataset S1). Within Dataset S1, each folder (named NN2_0000 → NN2_0055) contains data on all buffer conditions tested for a single peptide (20 peptides/folders in total). Each folder contains three files containing raw ellipticity data for three buffer conditions: distilled water, 20% trifluoroethanol, and 40% trifluoroethanol (named distilled_water.txt, 20_trifluoroethanol.txt, and 40_trifluoroethanol.txt, respectively). Each data-file is in the standard Jasco Corp. (Easton, MD, USA) J-810 file-format. These files contain self-explanatory headers and three tab-separated columns: wavelength (nm), ellipticity (mdeg), HT voltage (Volts). It should be noted that a 0.33 mg/mL peptide was used for all conditions.

3. Preliminary Analyses

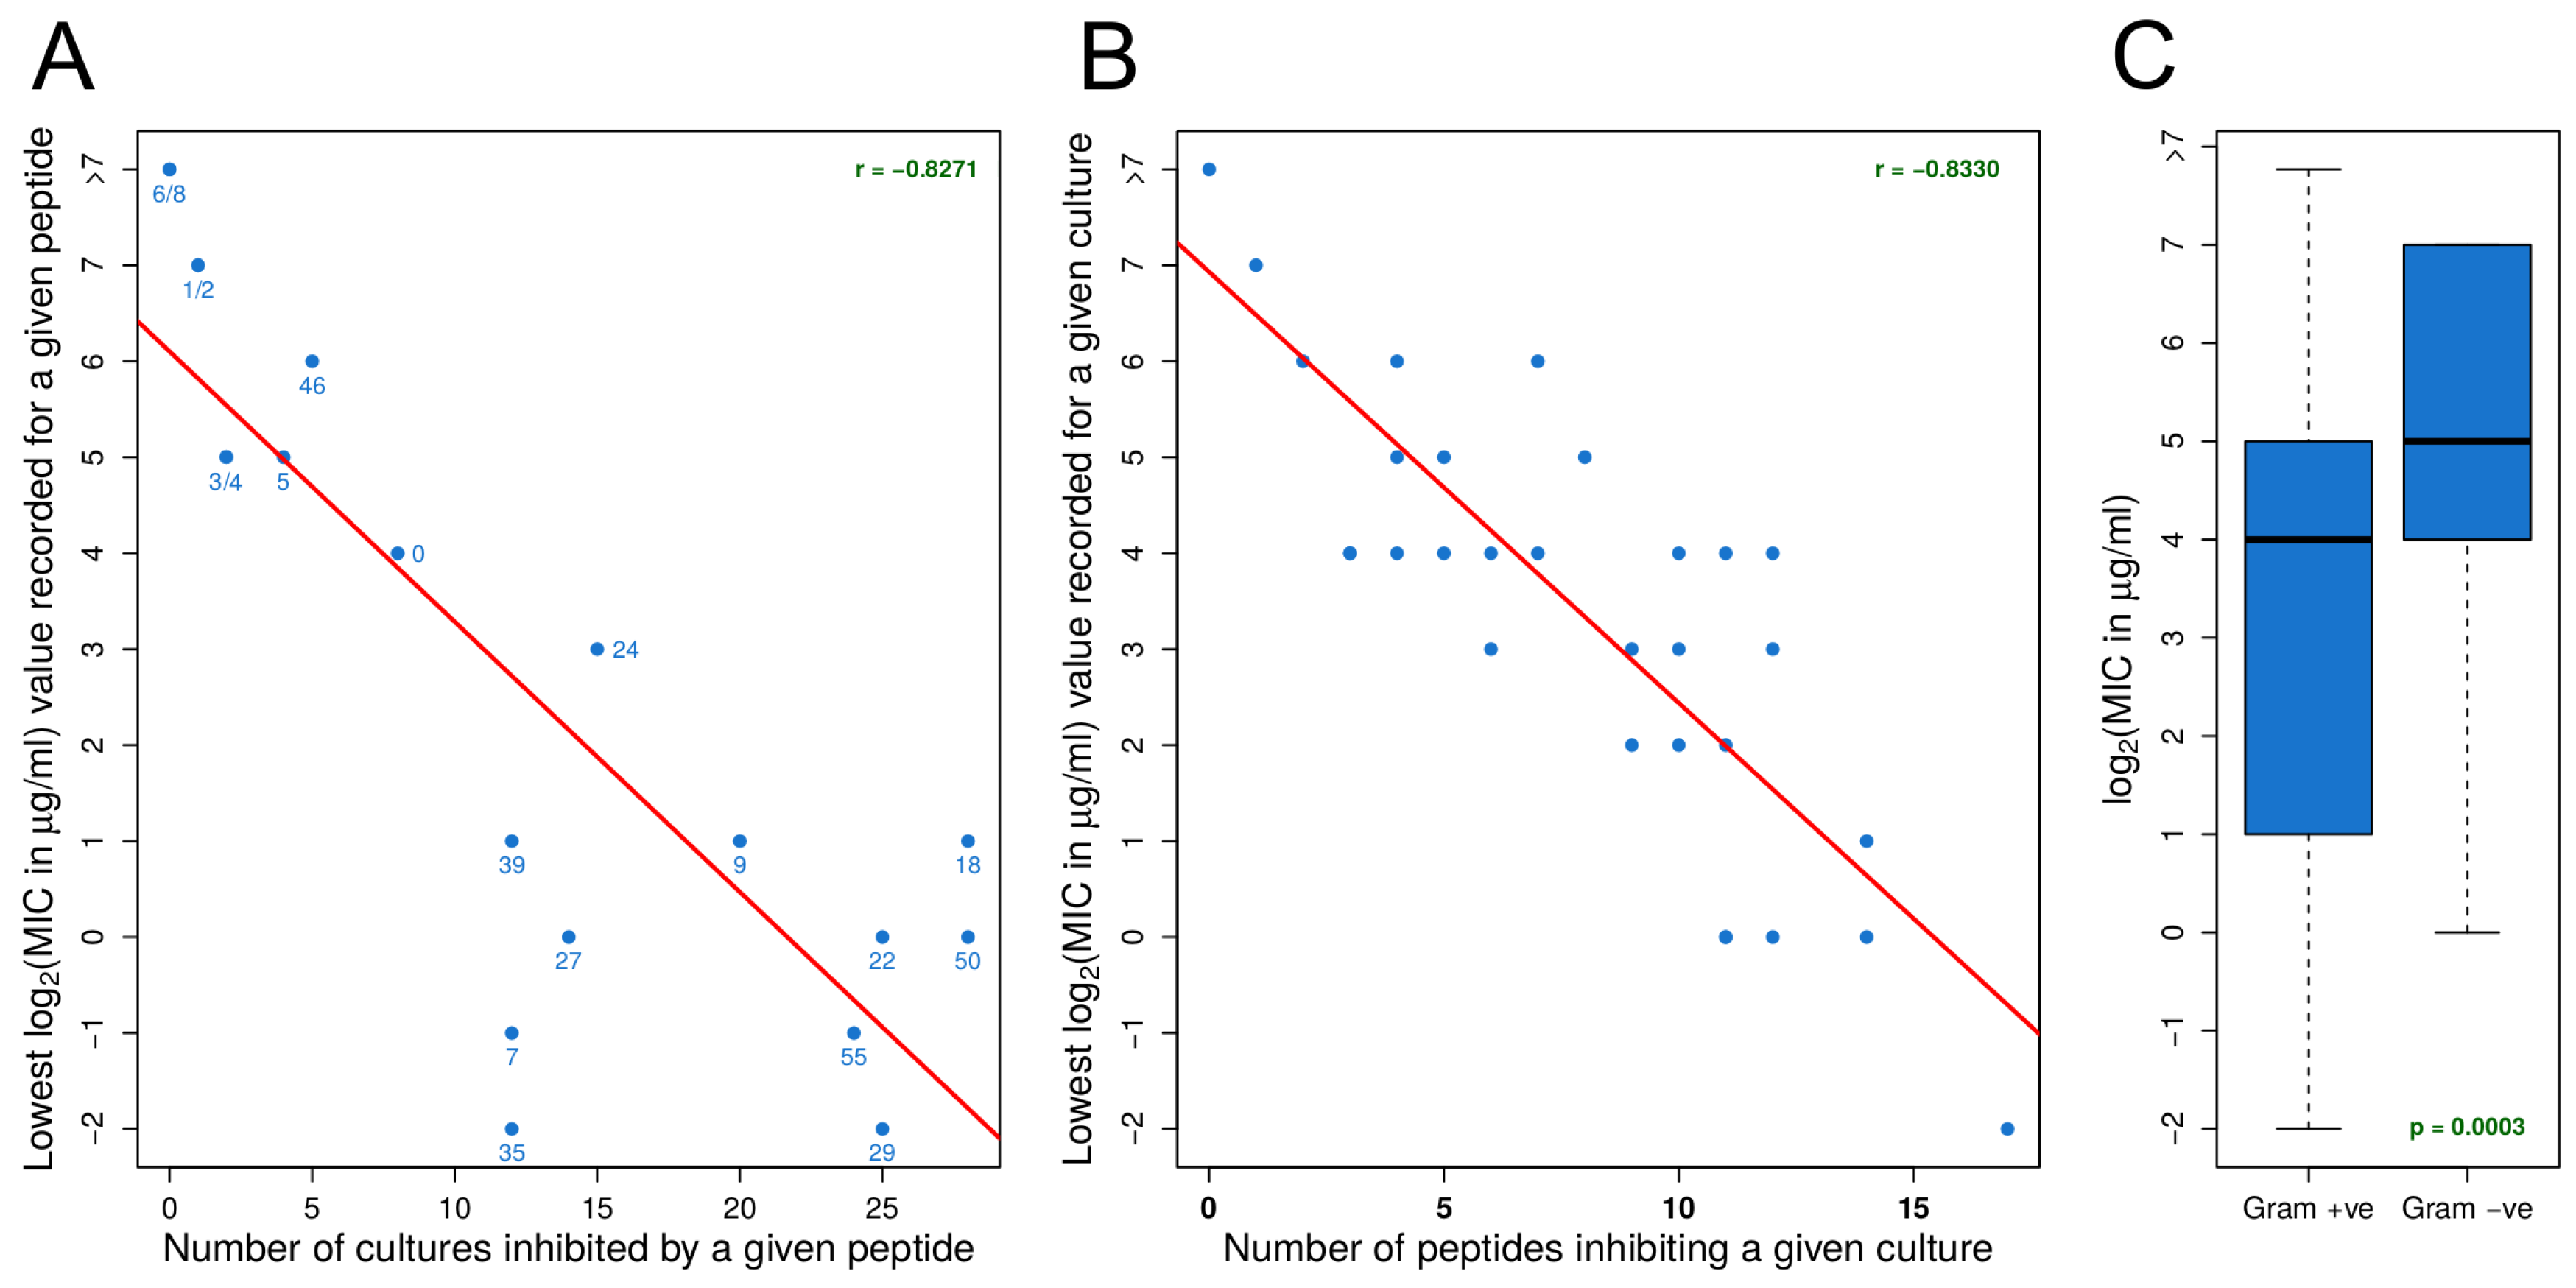
3.1. Identifying Effective Peptides Based on MIC Data

We identifed effective, broad-spectrum peptides, using a relative scoring scheme [10]. Simply described, for a given peptide, its peptide score was calculated by counting the number of cultures it inhibited with the lowest MIC (in comparison to the MICs of all other peptides for a given culture). A mathematical description of the peptide score is provided in Equation (1):
p e p t i d e _ s c o r e j = i = 1 M I X i j = m i n j = 1 N ( X i ) .
For this equation:
  • X: a matrix of MIC values,
  • M: rows containing MIC values for a given organism,
  • N: columns containing MIC values for a given peptide,
  • 0 i M , 0 j N ,
  • Multiple minimum MIC values can occur along a given row.

3.2. MIC Experiments Suggest a Common Mechanism of Action for Both Gram-Positive and Gram-Negative Organisms

From Table 2, it is apparent that peptides displaying a broad spectrum of activity also inhibit cultures at lower concentrations (low MIC values). Conversely, peptides displaying a narrower spectrum of activity inhibit cultures at higher concentrations (high MIC values). These trends are illustrated in Figure 2A and were observed to be strongly correlated (r = −0.83).
These trends were mirrored from the perspective of the cultures tested. Cultures inhibited at lower concentrations (low MIC values) by any peptide were found to be inhibited by a larger number of peptides. Conversely, cultures inhibited at higher concentrations (high MIC values) by any peptide were found to be inhibited by fewer peptides. Once again, as illustrated in Figure 2B, these variables were observed to be strongly correlated (r = −0.83).
From these strongly correlated observations, two inferences can be made:
  • For an organism, susceptibility to one effective peptide indicates greater susceptibility to all effective peptides.
  • For an effective peptide, efficacy for one organism indicates greater efficacy for all organisms.
These inferences indicate that all the peptides found to be effective possess very similar mechanisms of action, despite differences in their size and sequence. Furthermore, this mechanism is conserved across diverse organisms. Therefore, these peptides would only differ quantitatively in their degree of efficacy while following the same qualitative mechanism of action.
All peptides were found to inhibit both Gram-positive and Gram-negative cultures. However, we observed a small but statistically significant difference in the susceptibility of Gram-positive organisms as compared to their Gram-negative counterparts (Figure 2C). Ignoring susceptibilities >128 μ g/mL, the median MIC of Gram-positive organisms for all peptides tested was 16 μ g/mL, 2-fold lower than the corresponding Gram-negative median MIC of 32 μ g/mL (p = 0.0024). These observations remained statistically significant even after including susceptibilities >128 μ g/mL (p = 0.0035). Since no peptides were observed to display selective activity against either Gram-positive or Gram-negative cultures, these observations are once again best explained by a similar mechanism of action. Gram-positive organisms may be inherently more susceptible to antimicrobial peptides. Therefore, peptides would act with a similar mechanism in Gram positive organisms, differing only in the magnitude of inhibition compared to their Gram-negative counterparts.

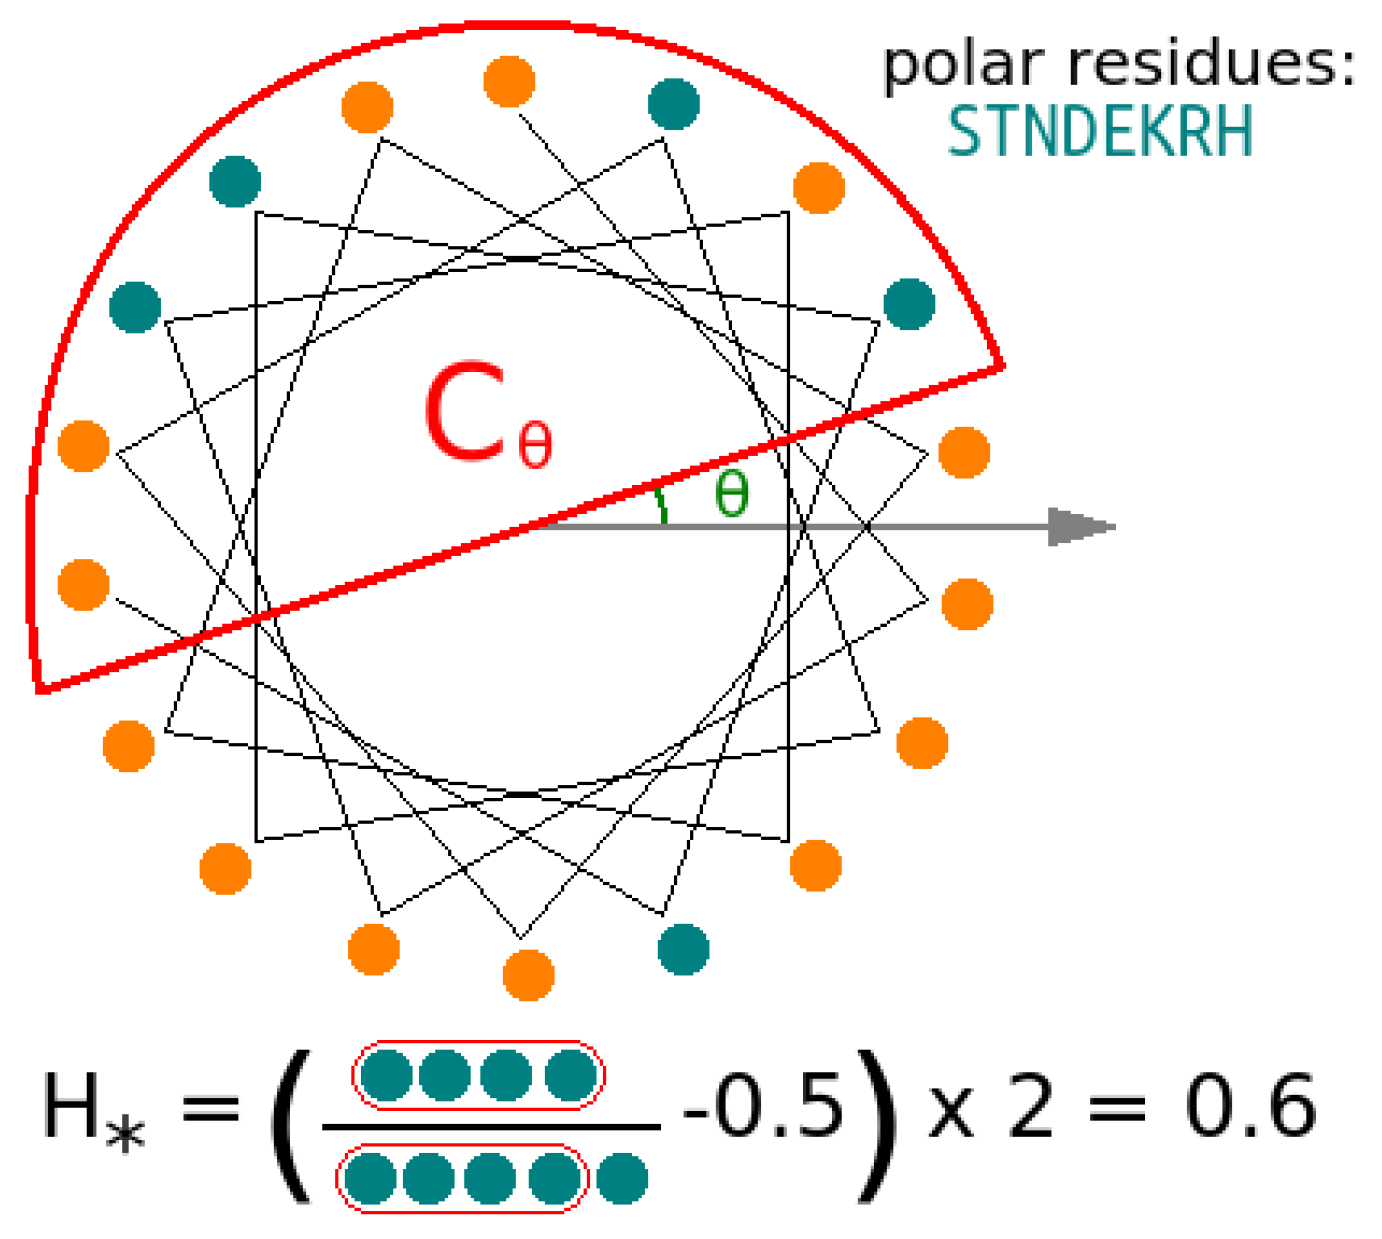
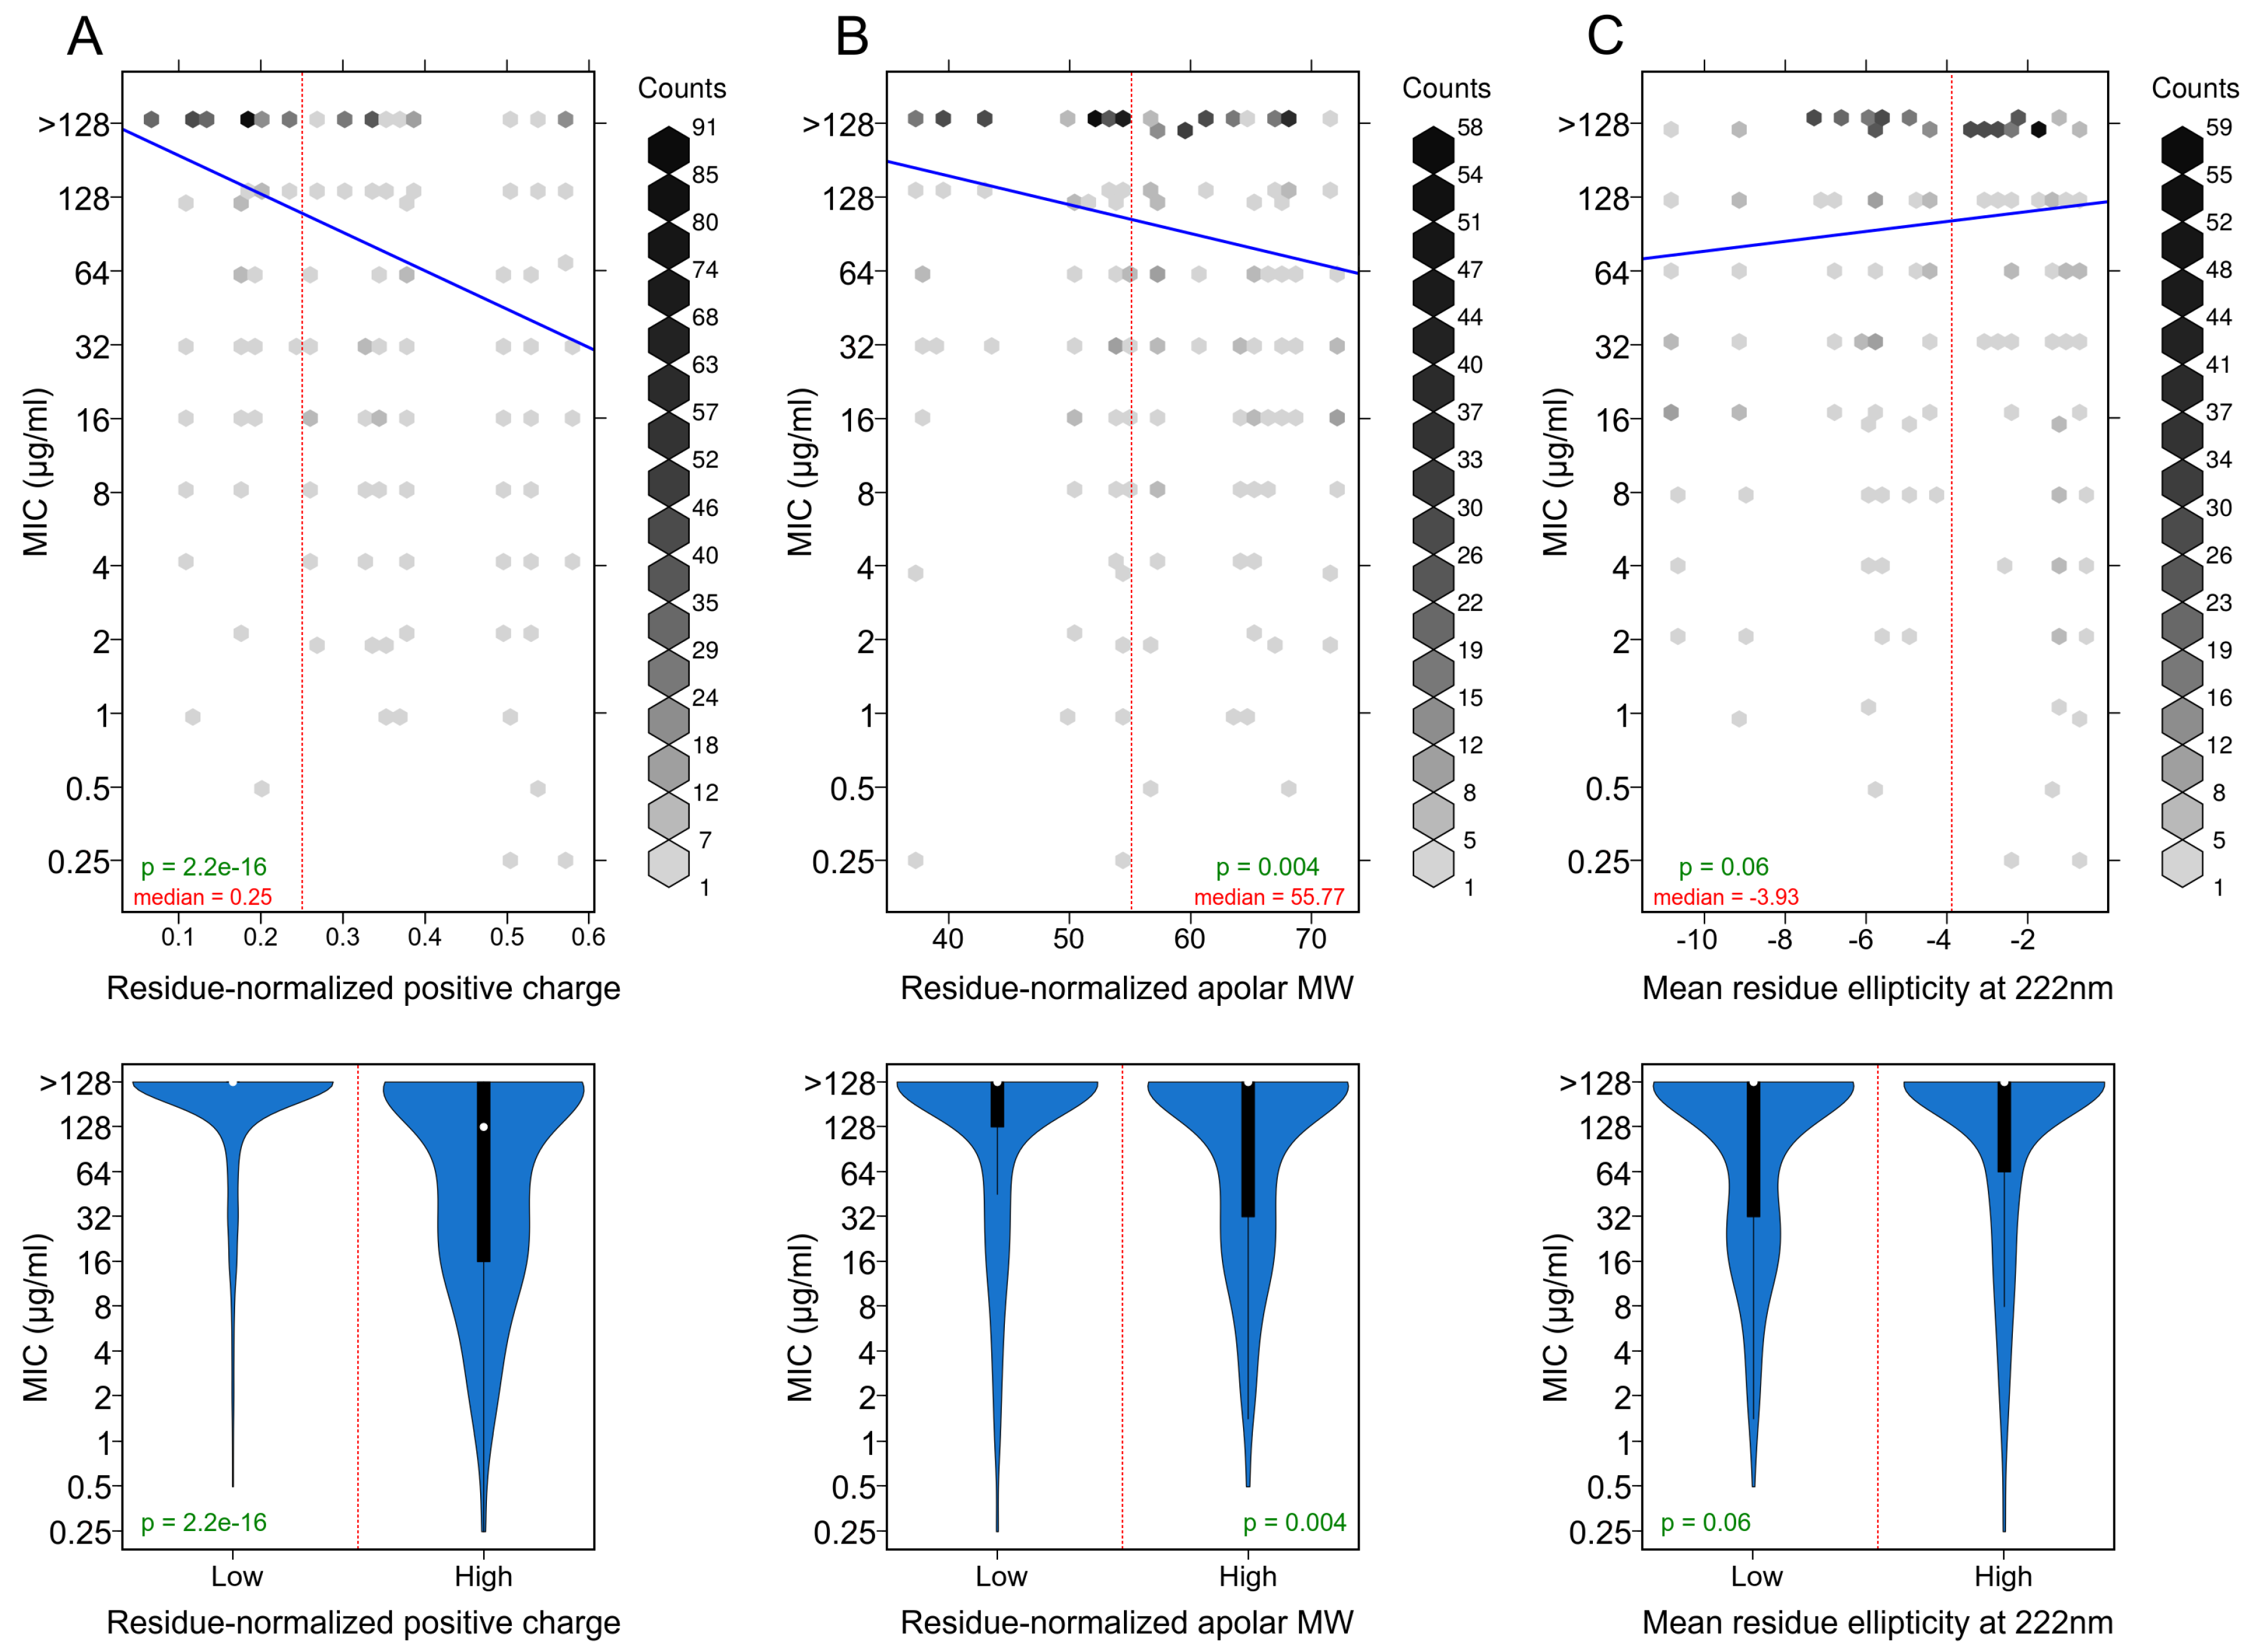
3.3. Positively Charged Residues Are Associated with Increased Peptide Activity

Trends between peptide positive charge, apolar content, and antimicrobial activity are illustrated in Figure 3. From this figure, it is clear that peptides possessing a low residue-normalized positive charge of ≤ +0.1 are ineffective (100% of all MIC values were > 128 μ g/mL) (Figure 3A). However, peptides possessing a high residue-normalized positive charge of +0.5 → +0.6 display submicromolar MIC values. These results are expected, as cationic antimicrobial peptides are a well-established family of AMPs. For these peptides, positively charged residues allow it to interact with, and disrupt, the negatively charged bacterial membrane. Statistical significance was calculated by dividing the data at the median residue-normalized positive charge (0.25). The difference in MIC distributions between the low-positive and high-positively charged peptide datasets was statistically significant (p = 2.2 e−16, Fisher’s test).

3.4. Apolar Residues Are Associated with Increased Peptide Activity

Peptides possessing greater residue-normalized apolar molecular weights displayed slightly lower MIC values, and therefore slightly greater efficacy (Figure 3B). Statistical significance was calculated by dividing the data at the median residue-normalized apolar molecular weight (55.77). The difference in MIC distributions between the relatively polar and apolar peptide datasets was statistically significant (p = 0.004, Fisher’s test). These results indicate that designed peptides would benefit from the inclusion of large apolar residues such as Phe, Tyr, and Trp in their sequence.

3.5. Helicity Is Not Essential for Peptide Activity

Circular dichroism (CD) experiments revealed that, in an aqueous solution, all peptide designs adopted the random coil conformation, displaying a characteristic minima beyond 200 nm (195 nm). However, upon increasing the concentration of trifluoroethanol, some peptides underwent conformational changes, adopting alpha helical structures. In a solution of 40% trifluoroethanol, 11 of the 20 designed peptides displayed some degree of alpha helicity. These peptides displayed a characteristic alpha-helical double minima at 208 nm and 222 nm. The 11 helical peptides are as follows: NN2_0000, NN2_0001, NN2_0004, NN2_0005, NN2_0007, NN2_0009, NN2_0018, NN2_0022, NN2_0024, NN2_0027, and NN2_0039. The other designed peptides adopted random coil conformations, even upon addition of 40% trifluoroethanol.
From the CD spectra observed, it is apparent that alpha helicity was not an essential factor for antimicrobial activity Figure 3C. Statistical significance was calculated by dividing the data at the median mean residue ellipticity (–3.93) measured at 222 nm, and measured in 40% trifluoroethanol. The difference in MIC distributions between the helical and non-helical peptide datasets was not statistically significant (p = 0.06, Fisher’s test).

4. Discussion

In this work, we present a dataset containing 600 MIC values obtained from testing 20 peptides against 30 diverse pathogens. Gram-negative, Gram-positive, mycobacterial, and fungal isolates were tested. As our data were generated using the same protocol [31], our peptides were tested against the same type culture for every organism, and we have included negative data in the form of ineffective peptides (NN2_0000 → NN2_0008). Therefore, our data is qualitatively superior to aggregated, multi-source heterogeneous data found on antimicrobial peptide databases [3,28,29,30], and should therefore be more suitable for training future AMP design algorithms.
We have also performed simple statistical analyses for our data, which could serve as a preliminary guide for training future peptide design algorithms. Our MIC data suggested a common underlying mechanism of action for all AMPs tested (Figure 2), despite differences in their sizes and sequences. We determined that positive charge is essential for AMP efficacy (Figure 3A). Natural antimicrobial peptides may be positively charged [4], neutral [5], or negatively charged [6]. However, our results indicate that positively charged AMPs are the most effective. Furthermore, a large apolar residue content also contributes to AMP efficacy Figure 3B). These results agree with previously understood mechanisms of AMP action [14]. Indeed, de novo peptides possessing trp-arg repeats [22] and trp-leu-lys repeats [23] were designed by utilizing the same principles.
Counter-intuitively, we observed that alpha helicity was not required for peptide efficacy (Figure 1 and Figure 3C). However, this result can be explained by the carpet model [9] of AMP activity. Briefly, positively charged amphiphilic peptides, with either monomeric or random structures, are described to cover the cell membrane in a carpet-like manner. Once a threshold concentration is reached, the peptides disrupt the bilayer curvature, disintegrating the membrane. The competing toroidal pore [7] and barrel stave [8] models describe the insertion of alpha helical peptides perpendicular to the cell membrane, forming nanometer-scale pores that lead to the leakage of cellular contents and ultimately death. The following observations further favor the carpet model:
  • Peptides adopting both alpha helical and random coil structures were found to be effective antimicrobial agents (Figure 1 and Figure 3C). Random coils cannot form the nanometer-scale pores described by the toroidal pore and barrel stave models.
  • Our previous work [10] reported prominent blebbing observed on the S. haemolyticus cell membrane, and large-scale membrane damage observed on E. coli, upon treatment with peptides NN2_0018 and NN2_0050. These disruptions cannot be explained through the formation of nanometer-scale pores alone. Previously, the carpet model had successfully explained similar blebbing on the P. aeruginosa cell membrane [9].
Ultimately, the main contribution of this work is the homogeneous AMPs dataset, which should provide valuable training data for the design of new AMPs. New drugs of all classes are urgently needed to combat the emergence of multidrug resistant pathogens.

5. Materials and Methods

5.1. Computational Design and Selection of Antimicrobial Peptides

Twenty antimicrobial peptides are described in this work, and were all designed using a long short-term memory (LSTM) network described in detail in our previous publication [10]. Initially, we designed 10 sequences (NN2_0000 → NN2_0009) that were observed to possess poor activity, and were previously not reported.
Natural antimicrobial peptides may be positively charged [4], neutral [5], or negatively charged [6]. Similarly, peptides NN2_0000 → NN2_0009 possessed low positive charges and amphiphilicities. Additional filters to increase charge and amphiphilicity were added to our (LSTM) network, and the resulting 10 sequences (NN2_0018 → NN2_0055) possessed excellent antimicrobial activity. These sequences were reported in our previous publication [10]. For the sake of clarity, a description of these charge and amphiphilcity filters is repeated here.
Charge filter: A simple charge filter selecting peptides containing ≥4 positively charged residues was used. Here, lysine, arginine, and histidine were considered to be positively charged.
Amphiphilicity filter: We used a simple amphiphilicity index ( H * ) (Equation (2)) to rapidly scan and predict amphiphilicity for a large number of AMPs. A standard helical wheel projection on a 2D polar coordinate plane (r, θ ) was created for each peptide sequence, with neighboring residues placed at a 100 angle. For a peptide sequence S containing residues { r 1 , r 2 , , r N } , C θ S is a subset of residues occurring in a semicircle ( θ , anticlockwise). A refers to a set of all polar residues:
H * = max 0 θ 2 π r i C θ δ r i r j S δ r j , H * = ( H * 0.5 ) × 2 , δ r i = 1 , if r i A , 0 , otherwise .
Here, the scaling terms 0.5 and 2 are needed to re-scale H * from 0.5 → 1 to a value of 0 → 1 (where 0 indicates no amphiphilicity and 1 indicates perfect amphiphilicity). H * is visually depicted in Figure 4. Only helices with H * values ≥ 0.33 were selected for synthesis and experimental characterization (NN2_0018 → NN2_0055). It should be noted that not all peptides synthesized adopted an alpha-helical structure (Figure 1).

5.2. Peptide Synthesis

GenScript, Inc. (Piscataway, NJ, USA) supplied all the peptides used in this study. In addition, 20 mg of the 20 NN2-family peptides were synthesized by GenScript as part of a peptide library.

5.3. Antimicrobial Susceptibility Assays

The microwell dilution method as described by Wiegand et al. [31] (Protocol E: Broth microdilution for antimicrobial peptides that do not require the presence of acetic acid/BSA). This protocol was especially optimized for the MIC determination of cationic antimicrobial peptides, and involves the use of polypropylene rather than polystyrene 96-well plates.
In order to estimate the MICs of cultures displaying plaque or mucoid morphologies, we used a modified protocol involving resazurin. Resazurin is normally a marginally fluorescent dye. However, microbial aerobic respiration reduces it to the highly fluorescent resorufin form. After incubating microbial cultures at 37 C for 12 h (according to protocol E), 30 μ L of a 0.02% (w/v) aqueous resazurin solution was pipetted into each well of a 96-well polypropylene plate. Further incubation at 37 C for 12 h was followed by fluorescence detection (excitation: 530 nm, emission: 590 nm) to determine cell viability. Since bacterial respiration is a measure of cell viability, this method calculates minimum bactericidal concentrations (MBCs) instead of minimum inhibitory concentrations (MICs).

5.4. Circular Dichroism Experiments

All circular dichroism (CD) experiments were performed using the Jasco J-810 spectrophotometer. A 1 mm path-length quartz cuvette with a sample volume of 300 μ L was used. Far-ultraviolet spectra (200–250 nm) were collected with a 4 s response-time and at a 3 nm bandwidth. Every spectrum was collected in triplicate and averaged. Buffer spectrum correction was also performed. In addition, 0.33 mg/mL peptide was used under all conditions.
CD experiments were performed to understand the changes in antimicrobial peptide secondary structure during peptide–membrane interaction. Trifluoroethanol was chosen as a membrane mimic. Trifluoroethanol acts as both an apolar solvent, and as an agent to encourage helix formation. Trifluoroethanol–water solutions containing 0%, 20%, and 40% trifluoroethanol were prepared and used for all experiments.

Supplementary Materials

Table S1. A csv-formatted table containing MIC values for all combinations of peptides and pathogens assayed. Note that cultures with MIC values >128 μg/mL are reported as blank cells. Dataset S1. Raw CD data were collected for all peptides under difference buffer conditions.

Author Contributions

D.N. performed all MIC/MBC experiments (Table 2), circular dichroism experiments (Figure 1), and statistical analyses (Figure 3). T.N. designed the antimicrobial peptide sequences used in this study (Table 1). N.N. analyzed and interpreted trends in the MIC data (Figure 2). D.N. conceived and designed all experiments. N.C. coordinated the study, planned experiments, and provided resources. All authors reviewed the results and approved the final version of the manuscript.

Funding

This research was funded by Department of Biotechnology (DBT) and the Government of India.

Acknowledgments

The authors thank Satya Tapas for his significant logistical support.

Conflicts of Interest

The authors declare no conflict of interest.

References

  1. Fox, J.L. Antimicrobial peptides stage a comeback. Nat. Biotechnol. 2013, 31, 379–382. [Google Scholar] [CrossRef] [PubMed]
  2. Vincent, J.L.; Marshall, J.C.; Namendys-Silva, S.A.; François, B.; Martin-Loeches, I.; Lipman, J.; Reinhart, K.; Antonelli, M.; Pickkers, P.; Njimi, H.; et al. Assessment of the worldwide burden of critical illness: The intensive care over nations (ICON) audit. Lancet Respir. Med. 2014, 2, 380–386. [Google Scholar] [CrossRef]
  3. Wang, Z.; Wang, G. APD: The antimicrobial peptide database. Nucl. Acids Res. 2004, 32, D590–D592. [Google Scholar] [CrossRef] [PubMed]
  4. Scott, M.G.; Hancock, R.E. Cationic antimicrobial peptides and their multifunctional role in the immune system. Crit. Rev. Immunol. 2000, 20, 407–431. [Google Scholar] [CrossRef] [PubMed]
  5. Hotchkiss, R.D.; Dubos, R.J. Bactericidal fractions from an aerobic sporulating bacillus. J. Biol. Chem. 1940, 136, 803–804. [Google Scholar]
  6. Harris, F.; Dennison, S.R.; Phoenix, D.A. Anionic antimicrobial peptides from eukaryotic organisms. Curr. Protein Pept. Sci. 2009, 10, 585–606. [Google Scholar] [CrossRef] [PubMed]
  7. Matsuzaki, K.; Murase, O.; Fujii, N.; Miyajima, K. An antimicrobial peptide, magainin 2, induced rapid flip-flop of phospholipids coupled with pore formation and peptide translocation. Biochemistry 1996, 35, 11361–11368. [Google Scholar] [CrossRef] [PubMed]
  8. Baumann, G.; Mueller, P. A molecular model of membrane excitability. J. Supramol. Struct. 1974, 2, 538–557. [Google Scholar] [CrossRef] [PubMed]
  9. Shai, Y. Mode of action of membrane active antimicrobial peptides. Pept. Sci. 2002, 66, 236–248. [Google Scholar] [CrossRef] [PubMed]
  10. Nagarajan, D.; Nagarajan, T.; Roy, N.; Kulkarni, O.; Ravichandran, S.; Mishra, M.; Chakravortty, D.; Chandra, N. Computational antimicrobial peptide design and evaluation against multidrug-resistant clinical isolates of bacteria. J. Biol. Chem. 2018, 293, 3492–3509. [Google Scholar] [CrossRef] [PubMed]
  11. Yonezawa, A.; Kuwahara, J.; Fujii, N.; Sugiura, Y. Binding of tachyplesin I to DNA revealed by footprinting analysis: Significant contribution of secondary structure to DNA binding and implication for biological action. Biochemistry 1992, 31, 2998–3004. [Google Scholar] [CrossRef] [PubMed]
  12. Subbalakshmi, C.; Sitaram, N. Mechanism of antimicrobial action of indolicidin. FEMS Microbiol. Lett. 1998, 160, 91–96. [Google Scholar] [CrossRef] [PubMed]
  13. Patrzykat, A.; Friedrich, C.L.; Zhang, L.; Mendoza, V.; Hancock, R.E. Sublethal concentrations of pleurocidin-derived antimicrobial peptides inhibit macromolecular synthesis in Escherichia coli. Antimicrob. Agents Chemother. 2002, 46, 605–614. [Google Scholar] [CrossRef] [PubMed]
  14. Brogden, K.A. Antimicrobial peptides: Pore formers or metabolic inhibitors in bacteria? Nat. Rev. Microbiol. 2005, 3, 238–250. [Google Scholar] [CrossRef] [PubMed]
  15. Wenzel, M.; Chiriac, A.I.; Otto, A.; Zweytick, D.; May, C.; Schumacher, C.; Gust, R.; Albada, H.B.; Penkova, M.; Krämer, U.; et al. Small cationic antimicrobial peptides delocalize peripheral membrane proteins. Proc. Natl. Acad. Sci. USA 2014, 111, E1409–E1418. [Google Scholar] [CrossRef] [PubMed]
  16. Gusman, H.; Travis, J.; Helmerhorst, E.J.; Potempa, J.; Troxler, R.F.; Oppenheim, F.G. Salivary histatin 5 is an inhibitor of both host and bacterial enzymes implicated in periodontal disease. Infect. Immun. 2001, 69, 1402–1408. [Google Scholar] [CrossRef] [PubMed]
  17. Nijnik, A.; Madera, L.; Ma, S.; Waldbrook, M.; Elliott, M.R.; Easton, D.M.; Mayer, M.L.; Mullaly, S.C.; Kindrachuk, J.; Jenssen, H.; et al. Synthetic cationic peptide IDR-1002 provides protection against bacterial infections through chemokine induction and enhanced leukocyte recruitment. J. Immunol. 2010, 184, 2539–2550. [Google Scholar] [CrossRef] [PubMed]
  18. Befus, A.D.; Mowat, C.; Gilchrist, M.; Hu, J.; Solomon, S.; Bateman, A. Neutrophil defensins induce histamine secretion from mast cells: Mechanisms of action. J. Immunol. 1999, 163, 947–953. [Google Scholar] [PubMed]
  19. Koczulla, R.; von Degenfeld, G.; Kupatt, C.; Krötz, F.; Zahler, S.; Gloe, T.; Issbrücker, K.; Unterberger, P.; Zaiou, M.; Lebherz, C.; et al. An angiogenic role for the human peptide antibiotic LL-37/hCAP-18. J. Clin. Investig. 2003, 111, 1665–1672. [Google Scholar] [CrossRef] [PubMed]
  20. Ge, Y.; MacDonald, D.L.; Holroyd, K.J.; Thornsberry, C.; Wexler, H.; Zasloff, M. In vitro antibacterial properties of pexiganan, an analog of magainin. Antimicrob. Agents Chemother. 1999, 43, 782–788. [Google Scholar] [CrossRef] [PubMed]
  21. Blondelle, S.E.; Houghten, R.A. Design of model amphipathic peptides having potent antimicrobial activities. Biochemistry 1992, 31, 12688–12694. [Google Scholar] [CrossRef] [PubMed]
  22. Deslouches, B.; Steckbeck, J.D.; Craigo, J.K.; Doi, Y.; Mietzner, T.A.; Montelaro, R.C. Rational design of engineered cationic antimicrobial peptides consisting exclusively of arginine and tryptophan, and their activity against multidrug-resistant pathogens. Antimicrob. Agents Chemother. 2013, 57, 2511–2521. [Google Scholar] [CrossRef] [PubMed]
  23. Deslouches, B.; Phadke, S.M.; Lazarevic, V.; Cascio, M.; Islam, K.; Montelaro, R.C.; Mietzner, T.A. De novo generation of cationic antimicrobial peptides: Influence of length and tryptophan substitution on antimicrobial activity. Antimicrob. Agents Chemother. 2005, 49, 316–322. [Google Scholar] [CrossRef] [PubMed]
  24. Wiradharma, N.; Khoe, U.; Hauser, C.A.; Seow, S.V.; Zhang, S.; Yang, Y.Y. Synthetic cationic amphiphilic α-helical peptides as antimicrobial agents. Biomaterials 2011, 32, 2204–2212. [Google Scholar] [CrossRef] [PubMed]
  25. Fjell, C.D.; Jenssen, H.; Cheung, W.A.; Hancock, R.E.; Cherkasov, A. Optimization of antibacterial peptides by genetic algorithms and cheminformatics. Chem. Biol. Drug Des. 2011, 77, 48–56. [Google Scholar] [CrossRef] [PubMed]
  26. Maccari, G.; Di Luca, M.; Nifosí, R.; Cardarelli, F.; Signore, G.; Boccardi, C.; Bifone, A. Antimicrobial peptides design by evolutionary multiobjective optimization. PLoS Comput. Biol. 2013, 9, e1003212. [Google Scholar] [CrossRef] [PubMed]
  27. Loose, C.; Jensen, K.; Rigoutsos, I.; Stephanopoulos, G. A linguistic model for the rational design of antimicrobial peptides. Nature 2006, 443, 867–869. [Google Scholar] [CrossRef] [PubMed]
  28. Piotto, S.P.; Sessa, L.; Concilio, S.; Iannelli, P. YADAMP: Yet another database of antimicrobial peptides. Int. J. Antimicrob. Agents 2012, 39, 346–351. [Google Scholar] [CrossRef] [PubMed]
  29. Thomas, S.; Karnik, S.; Barai, R.S.; Jayaraman, V.K.; Idicula-Thomas, S. CAMP: A useful resource for research on antimicrobial peptides. Nucl. Acids Res. 2010, 38, D774–D780. [Google Scholar] [CrossRef] [PubMed]
  30. Fan, L.; Sun, J.; Zhou, M.; Zhou, J.; Lao, X.; Zheng, H.; Xu, H. DRAMP: A comprehensive data repository of antimicrobial peptides. Sci. Rep. 2016, 6, 24482. [Google Scholar] [CrossRef] [PubMed]
  31. Wiegand, I.; Hilpert, K.; Hancock, R.E. Agar and broth dilution methods to determine the minimal inhibitory concentration (MIC) of antimicrobial substances. Nat. Protoc. 2008, 3, 163–175. [Google Scholar] [CrossRef] [PubMed]
  32. Gesell, J.; Zasloff, M.; Opella, S.J. Two-dimensional 1H NMR experiments show that the 23-residue magainin antibiotic peptide is an α-helix in dodecylphosphocholine micelles, sodium dodecylsulfate micelles, and trifluoroethanol/water solution. J. Biomol. NMR 1997, 9, 127–135. [Google Scholar] [CrossRef] [PubMed]
  33. Conlon, J.M.; Kolodziejek, J.; Nowotny, N. Antimicrobial peptides from ranid frogs: Taxonomic and phylogenetic markers and a potential source of new therapeutic agents. Biochim. Biophys. Acta 2004, 1696, 1–14. [Google Scholar] [CrossRef] [PubMed]
Figure 1. Circular dichroism (CD) experiments. (AT) the far-UV circular dichroism spectra of all 20 designed peptides were collected. Each peptide was dissolved in aqueous solvent containing 0% trifluoroethanol (in red), 20% trifluoroethanol (in yellow), and 40% trifluoroethanol (in blue), in order to study the secondary structures adopted during peptide–membrane interaction. The secondary structure and relative efficacy of each peptide are provided below the title of each graph. Note that “effective” and “ineffective” are relative terms based on the peptide score, as described in the text. A peptide labeled as “ineffective” may still display antimicrobial activity against various cultures, but only to a lesser extent as compared to peptides labeled as “effective”.
Data 04 00027 g001
Figure 2. Understanding how susceptibility, spectrum of activity, and Gram nature relate to a common mechanism of action. (A) peptide-oriented scatterplot displaying the strong correlation observed between the lowest MIC value recorded for a given culture, and the number of cultures inhibited. The numbering represents individual peptides (e.g., NN2_0050 → 50); (B) culture-oriented scatterplot displaying the strong correlation observed between the lowest MIC value recorded for a given peptide, and the number of peptides inhibiting the given culture; (C) boxplots depicting the small but statistically significant difference between MIC values obtained for all Gram-positive organisms, as compared to those obtained for all Gram-negative organisms. The Welch 2-sample t-test was used to determine the p-value.
Data 04 00027 g002
Figure 3. Trends between peptide positive charge, apolar content, helicity, and antimicrobial activity are illustrated as 2D histograms with regression lines in blue (above) and violinplots (below). From 20 peptides × 30 cultures, 600 individual MIC experiments were performed. (A) peptides possesing higher residue-normalized positive charges also possess lower MIC values and greater efficacy. Peptide residue-normalized positive charge is merely the sum of (Lys +Arg −Asn −Glu residues)/peptide length; (B) peptides possessing higher residue-normalized apolar content also possess lower MIC values and greater efficacy. Apolar content is merely the total molecular weight of all apolar residues (AVLIMFYWPC)/peptide length; (C) peptide secondary structure content, as determined using circular dichroism, is not linked to MIC values or peptide efficacy. Note that mean residue ellipticity is measured in 10 3 deg cm 2 dmol 1 units.
Data 04 00027 g003
Figure 4. Amphiphilicity filter ( H * ). A helical wheel projection is used to represent potential antimicrobial peptides. Semicircles ( θ ) are depicted in red. A graphical explanation for H * index calculation is also provided.
Data 04 00027 g004
Table 1. Names and sequences are provided for all antimicrobial peptides described in this study. Peptides NN2_0000 → NN2_0009 are reported for the first time in this study. Peptides NN2_0018 → NN2_0050 were reported and characterized in our previous work [10].
PeptideSequence
NN2_0000EVAKKLLASALKLALAI
NN2_0001EDWNHLGAAVHTLKHVYK
NN2_0002AIVEQLRKRC
NN2_0003KLSASLKHVAHRARHLS
NN2_0004ESRAGKLAAKAAFKAAKR
NN2_0005EWAAARQVIIHATRKY
NN2_0006EILSKALSALSPLAN
NN2_0007EKAILSALKLLRLAL
NN2_0008ETAKGVAKHLPPAIA
NN2_0009KVYARLHAVIKRLHRRLH
NN2_0018YLARAIRRTLARLLL
NN2_0022EWRVARRAVQRLRHLARRYH
NN2_0024ALKKMLRLAKRLS
NN2_0027VLSAFHKVIKIIHHISHF
NN2_0029RKFRKILHRARKWI
NN2_0035RRWGRWHRMRRRGR
NN2_0039FWKGLVKAAFKIVHAGS
NN2_0046GWKAIHKAAKGIHTYVN
NN2_0050SWKKFFKKARSLPKLF
NN2_0055YKRWKKWRSKAKKIL
Table 2. Minimum inhibitory concentration (MIC) values are provided in μ g/mL for all 20 peptides tested against 30 cultures. MIC values in bold are the lowest MIC values for a given culture. Cultures with MIC values exceeding 128 μ g/mL are reported as blank cells. Peptide scores are provided for all effective peptides. Culture names marked with an asterisk indicate that the resazurin protocol was used to estimate minimum bactericidal concentration (MBC). Note that MIC values for peptides NN2_0018 → NN2_0050 were reported in our previous work [10]. Cultures with an asterisk appended to their names displayed mucoid/plaque morphologies, and the MBC was determined using the resazurin method.
OrganismCulture IDNN2_NN2_NN2_NN2_NN2_NN2_NN2_NN2_NN2_NN2_NN2_NN2_NN2_NN2_NN2_NN2_NN2_NN2_NN2_NN2_
00000001000200030004000500060007000800090018002200240027002900350039004600500055
E. coliK12 MG1655 16321664328 64 44
A. baumaniiMTCC 9829 128 321616128168 16 416
S. boydiiMTCC 11947128 128 83286416164 28
S. flexneriiMTCC 1457128 128 481328464 48
S. typhimuriumATCC 14028 323216 16 832
S. entericaMTCC 9844 128 321616323216 816
K. pneumoniaeMTCC 7407 32128 64 32128
K. oxytocaMTCC 2275 128 8168128 326464 1632
P. aeruginosaMTCC 3542 128 16 32128
P. vulgarisMTCC 1771 128128 64 1664
P. mirabilisMTCC 3158
C. koseriiMTCC 1657128 128 3216166416641664 816
C. freundiiMTCC 1658 321664 32 32128
N. mucosa *MTCC 1772 128 128 321632128323264128 1664
V. choleraeMTCC 3904 12864128 128 12864128
E. gergoviaeMTCC 3826 128128128 64
H. influenzaeMTCC 62164 128128 16 4886488128 64232
A. fecalisMTCC 1937 32128 128 64
B. bronchisepticaMTCC 683716 64 442841 812818
E. aerogenesMTCC 111 32 16128
S. maltophiliaMTCC 1890128 1664 128 128 16128
M. luteus *MTCC 42532 128323232 0.5 222810.250.2526420.5
S. aureusMTCC 3160 16 128 128
S. hemolyticusMTCC 3383 128 41616128328416 84
E. faecalisMTCC 439 64 128
C. glutamicumMTCC 267932 64 32 2411642426422
C. pseudoTB *MTCC 3158 128
B. alcalophilisMTCC 860 64 321616 32643216 3264
M. smegmatis *MC2155 128 32641664321616128 6432
C. albicans *MTCC 425 3212864128 6464 6464
net charge 32346313264752783368
peptide score 3105 631 142

