Article

Regionalization of a Landscape-Based Hazard Index of Malaria Transmission: An Example of the State of Amapá, Brazil

by
Zhichao Li
1,2,*,
Thibault Catry
2,
Nadine Dessay
2,
Helen Da Costa Gurgel
3,
Cláudio Aparecido de Almeida
4,
Christovam Barcellos
5 and
Emmanuel Roux
2,*
1
Ministry of Education Key Laboratory for Earth System Modeling, Department of Earth System Science, Tsinghua University, Beijing 100084, China
2
ESPACE-DEV, UMR 228 IRD/UM/UR/UG, Institut de Recherche pour le Développement (IRD), 500 rue Jean-François Breton, Montpellier 34000, France
3
Department of Geography, University of Brasilia, 70910-900 Brasilia, Brazil
4
National Institute for Space Research (INPE)—Image Processing Division, Av. dos Astronautas, 1758, 12227-010 São José dos Campos, Brazil
5
Institute of Scientific and Technological Communication and Information in Health (ICICT), Oswaldo Cruz Foundation (FIOCRUZ), Av. Brasil 4365, Manguinhos, Rio de Janeiro RJ 21045-900, Brazil
*
Authors to whom correspondence should be addressed.
Submission received: 19 September 2017 / Revised: 30 October 2017 / Accepted: 1 November 2017 / Published: 2 November 2017

Abstract

:
Identifying and assessing the relative effects of the numerous determinants of malaria transmission, at different spatial scales and resolutions, is of primary importance in defining control strategies and reaching the goal of the elimination of malaria. In this context, based on a knowledge-based model, a normalized landscape-based hazard index (NLHI) was established at a local scale, using a 10 m spatial resolution forest vs. non-forest map, landscape metrics and a spatial moving window. Such an index evaluates the contribution of landscape to the probability of human-malaria vector encounters, and thus to malaria transmission risk. Since the knowledge-based model is tailored to the entire Amazon region, such an index might be generalized at large scales for establishing a regional view of the landscape contribution to malaria transmission. Thus, this study uses an open large-scale land use and land cover dataset (i.e., the 30 m TerraClass maps) and proposes an automatic data-processing chain for implementing NLHI at large-scale. First, the impact of coarser spatial resolution (i.e., 30 m) on NLHI values was studied. Second, the data-processing chain was established using R language for customizing the spatial moving window and computing the landscape metrics and NLHI at large scale. This paper presents the results in the State of Amapá, Brazil. It offers the possibility of monitoring a significant determinant of malaria transmission at regional scale.

1. Introduction

Malaria remains a major vector-borne disease in the world with an estimated 212 million new cases and an estimated 429,000 deaths in 2015, which mostly occur in tropical and sub-tropical regions [1]. In South America, the Amazonian region attracts the majority of malaria cases and exhibits a high transmission risk [1]. Although malaria is treatable and preventable [2], its elimination is difficult in Latin America, which requires vector control strategies to be adapted to local constraints, depending on a knowledge of the interaction between vector, human and environment [3]. The definition of new control strategies at different scales remains a challenge for researchers and policymakers who could benefit from the prior knowledge of malaria transmission risk at suitable scale [4]. Identifying malaria risk factors and modeling malaria transmission processes in endemic and epidemic regions is highly valuable for a better understanding of malaria transmission [5,6].
Deforestation in the Amazon rainforest has been identified as a significant factor of malaria risk [7,8,9]. Stefani et al. [10] carried out a systematic review and formalized the elements of consensus regarding the relationship between malaria transmission by the main malaria vector in this region, Anopheles darlingi, and deforestation in a knowledge-based model: (i) deforested areas can supply favorable conditions for malaria vector breeding and feeding because they are usually accompanied by the presence of human populations and activities; and (ii) forested areas can provide resting sites for adult vectors that return to forest after their blood-meal in deforested areas. Based on this model, a normalized landscape-based hazard index (NLHI) was established for describing the contribution of landscape on malaria transmission. This index was defined as the linear normalization of the product of two landscape metrics: percentage of forest (pF) and density of forest—non-forest edges (ED), computed within a discoidal moving window with a radius of 400 m (see [11] for more details). This index was applied and validated in the cross-border area between French Guiana and Brazil (Figure 1), using a 10 m spatial resolution forest vs. non-forest land cover map derived from SPOT 5 multispectral imagery and obtained in [11].
Because the knowledge-based model is tailored to the entire Amazonian region, NLHI established at a local spatial scale might be generalized at large scale within this region (Figure 1) to give a regional view of the landscape distribution on malaria transmission. The selection of appropriate input data (i.e., the large-scale forest vs. non-forest maps) needs consideration. In fact, accurately mapping land use and land cover (LULC) in large-scale tropical regions is a challenge due to the limitations of remote sensing data and complex biophysical environments [12]. First, low spatial resolution sensors, such as MODIS (250 m, 500 m and 1000 m), often provide repeated observations of the earth’s surface from regional to global scale, but cannot detect certain spatial details of landscape features. However, NLHI computation should be realized in a discoidal moving window of 400 m. Low resolution imageries appear to be inadequate for estimating the edge between forest and non-forest patches. Second, high spatial resolution sensors, such as SPOT 5, can detect small scale landscape features [13], but LULC mapping with such images at regional scale is still particularly costly in respect of computing resources. Third, the frequent cloud cover in tropical regions often results in missing information in optical data [14,15,16].
Landsat data is a good choice for mostly overcoming all these obstacles and mapping large-scale LULC maps in tropical regions because of: (i) systematic data acquisition; (ii) global coverage; and (iii) high temporal repetitivity [17]. It has been extensively used for LULC mapping [18,19] or monitoring forest cover and its changes [20,21]. Particularly, the 30 m TerraClass LULC maps derived from Landsat data by the collaboration of Brazilian National Institute for Space Research (INPE) and Brazilian Agricultural Research Corporation (EMBRAPA) provided a detailed follow-up of deforested areas in the Brazilian Legal Amazonian region from 2004 (see [22] for more details). It was selected as a basis for producing the forest vs. non-forest map and then for implementing the large-scale NLHI.
Being built with landscape metrics, NLHI can be expected to be significantly affected by the changes in spatial resolution of input data and computation window size [23,24,25,26]. A fixed extent, corresponding to a discoidal moving window with a radius of 400 m, was used for the NLHI computation. Therefore, the effect of a coarser spatial resolution (i.e., 30 m) on the NLHI values was the only issue that needed to be investigated before implementing this index.
In this context, the objectives of this article are: (1) to evaluate the impact of the spatial resolution deterioration (i.e., from 10 m to 30 m) on the NLHI values; and (2) to develop and apply an automatic data-processing chain for computing the NLHI at large scale using the 30 m land cover map.

2. Materials and Methods

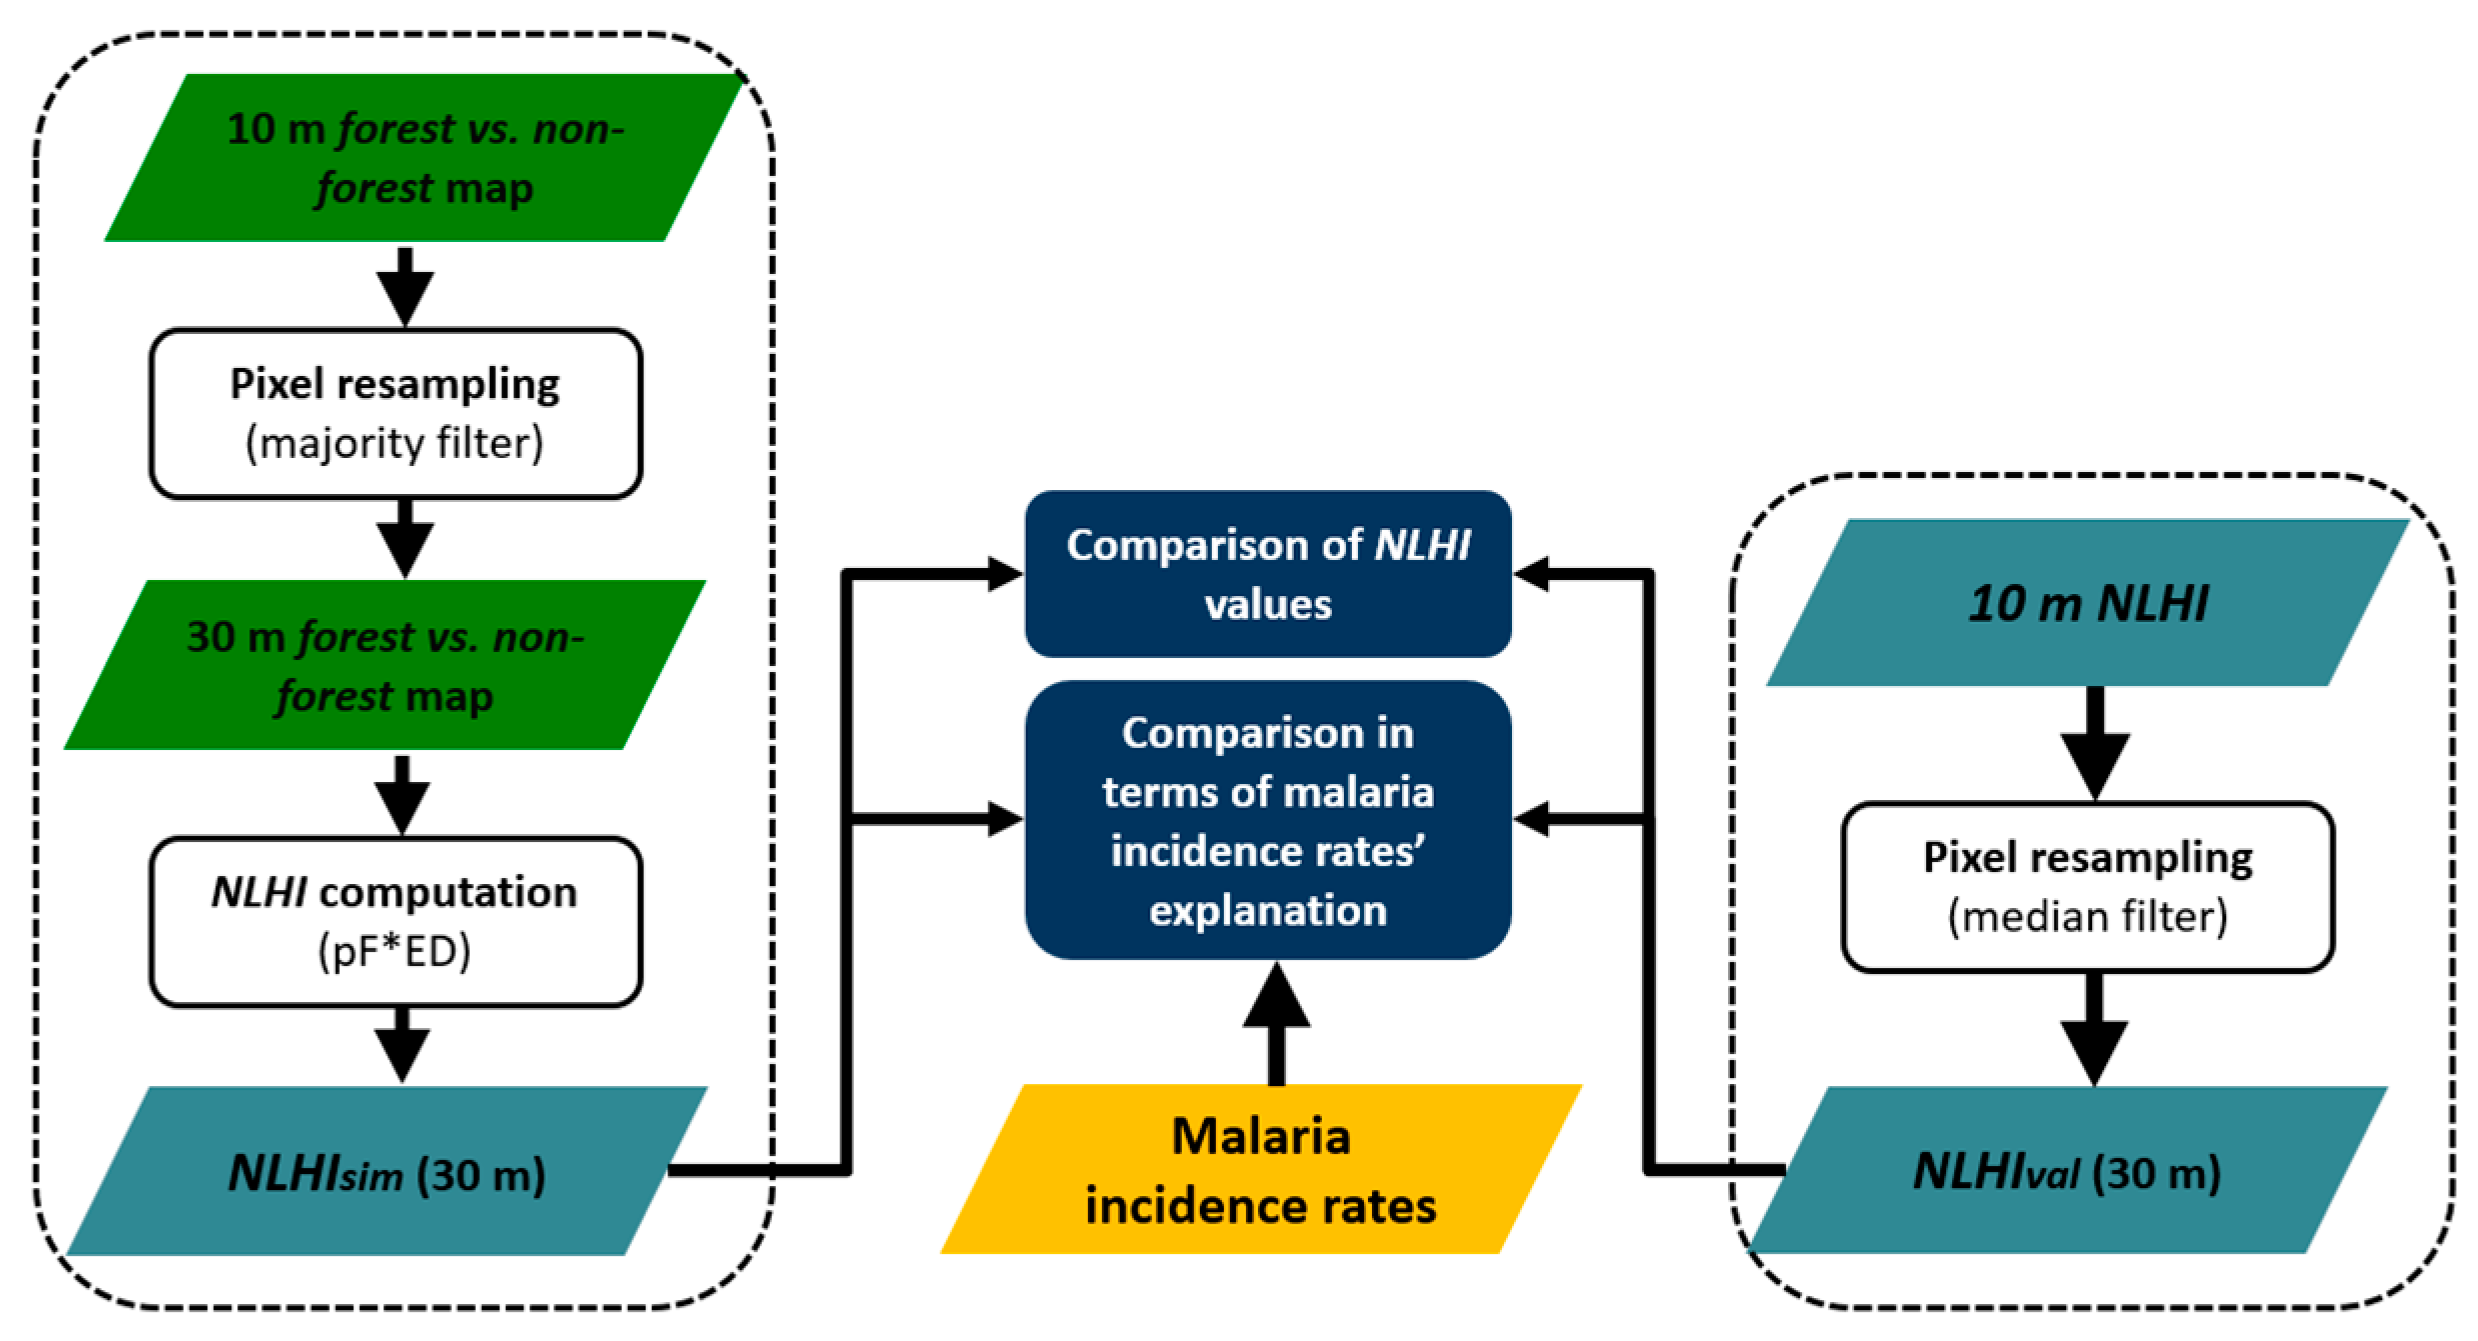
2.1. Assessing the Effect of a Coarser Spatial Resolution on NLHI Values

In order to assess the effects of spatial resolution on NLHI values, a 30 m forest vs. non-forest map was simulated by resampling the native one (i.e., the 10 m forest vs. non-forest map obtained in [11]) with a majority filter. The 30 m NLHI (denoted as NLHIsim hereafter) was then computed using the reduced-resolution map. Secondly, NLHIsim was compared with the native index (i.e., the 10 m NLHI obtained in [11]), which was resampled to a 30 m resolution (denoted as NLHIval hereafter) using a median filter, in order to define the reference values of the index.
A comparative study was performed on the values of NLHIsim and NLHIval and the capacity of the two indices to explain malaria incidence rates. NLHIsim was then compared with NLHIval using the values extracted from 1000 randomly selected points. A pair of reduced-resolution NLHIs (i.e., NLHIsim and NLHIval) were statistically compared by computing a linear regression model.
Moreover, NLHIsim was also compared to P. falciparum incidence rates observed in the 28 hamlets comprising the village of Camopi in French Guiana (see more details of the epidemiological data in [11,27,28,29]. The Pearson (r) and Spearman (rho) correlation coefficients and the linear regression coefficient of determination (R2) were calculated between NLHIsim and incidence rates by considering: (i) all the hamlets of Camopi; (ii) only the hamlets with non-null incidence rate values.
The overall methodology is summarized in Figure 2.

2.2. Large-Scale Implementation of NLHI

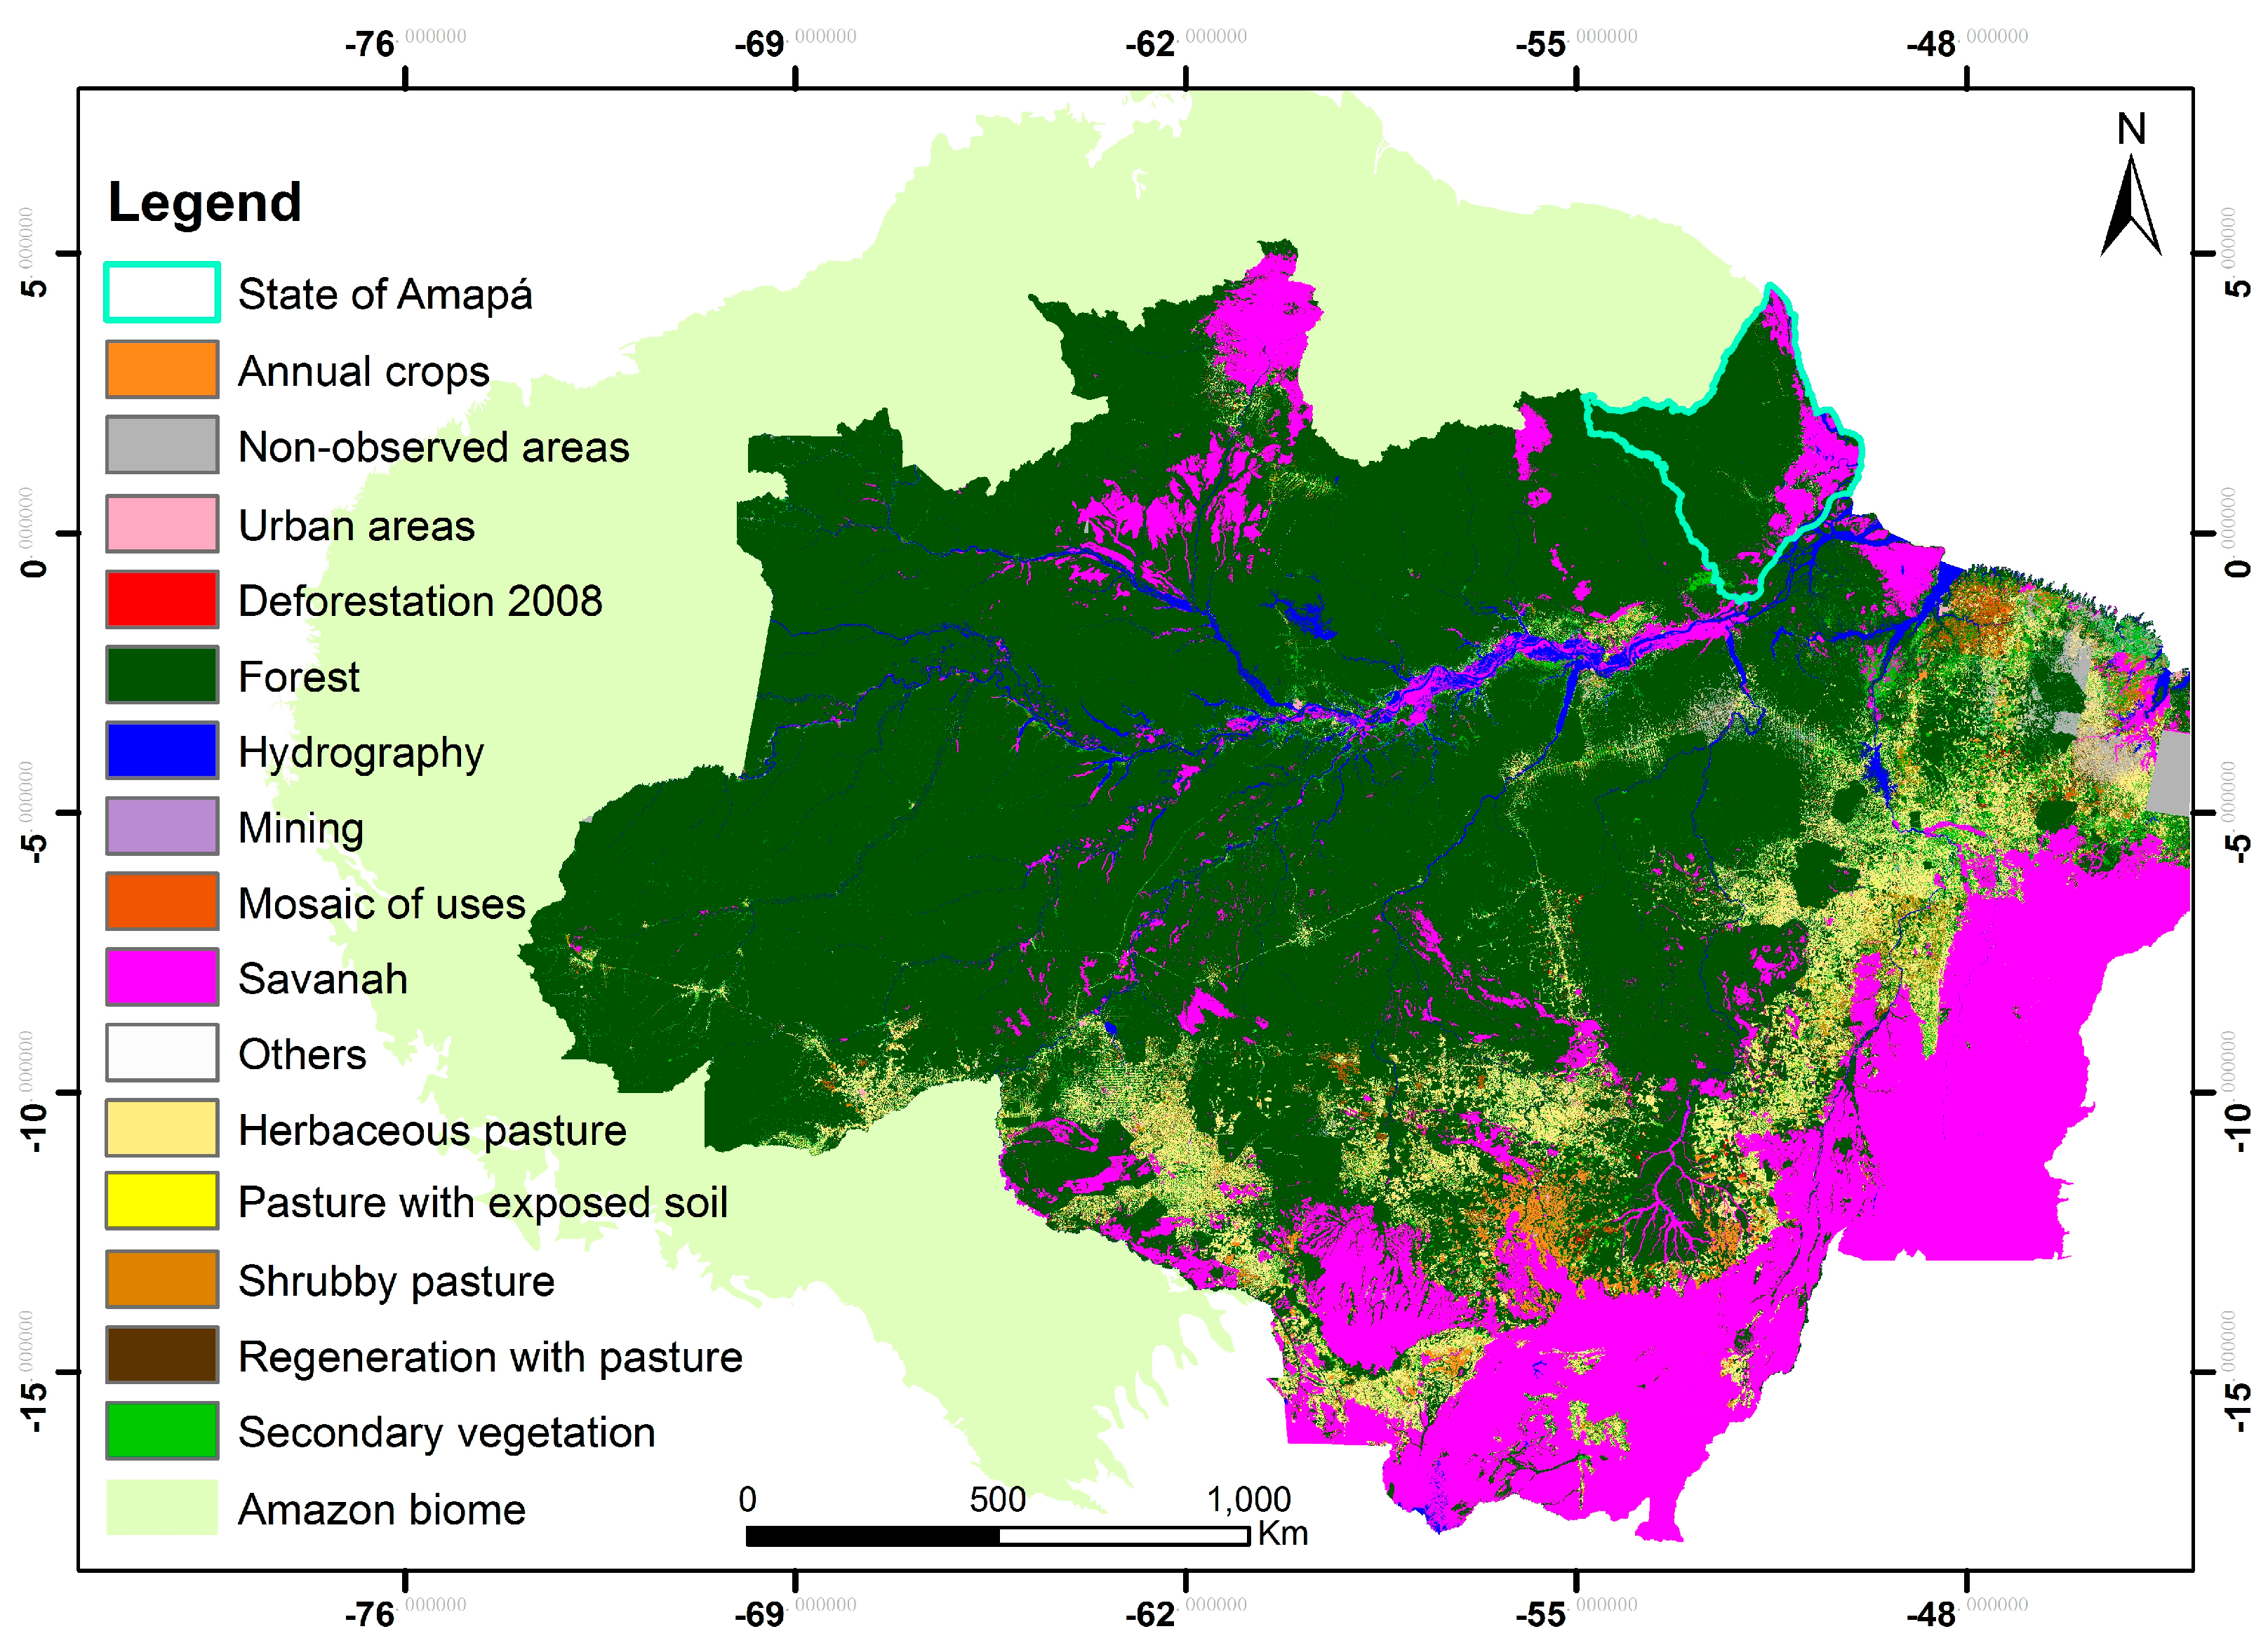
2.2.1. Input Data: TerraClass© product

The TerraClass LULC product covering the Brazilian Legal Amazon region (9 states of Brazil) is suitable for large-scale NLHI implementation. In fact, TerraClass is a project that was set up in 2009 by INPE in partnership with EMBRAPA in order to better understand the origin and consequences of the Brazilian Amazon deforestation. The nomenclature for TerraClass classification is presented in Figure 3. This dataset has been available since 2004 and has been updated every two years since 2008. For each date, the final product corresponds to a LULC map with a 30 m spatial resolution for each state in the Brazilian Legal Amazon. In this study, the TerraClass 2008 of the State of Amapá (Figure 3) was chosen for testing an automatic processing chain for the production of the large-scale NLHI.

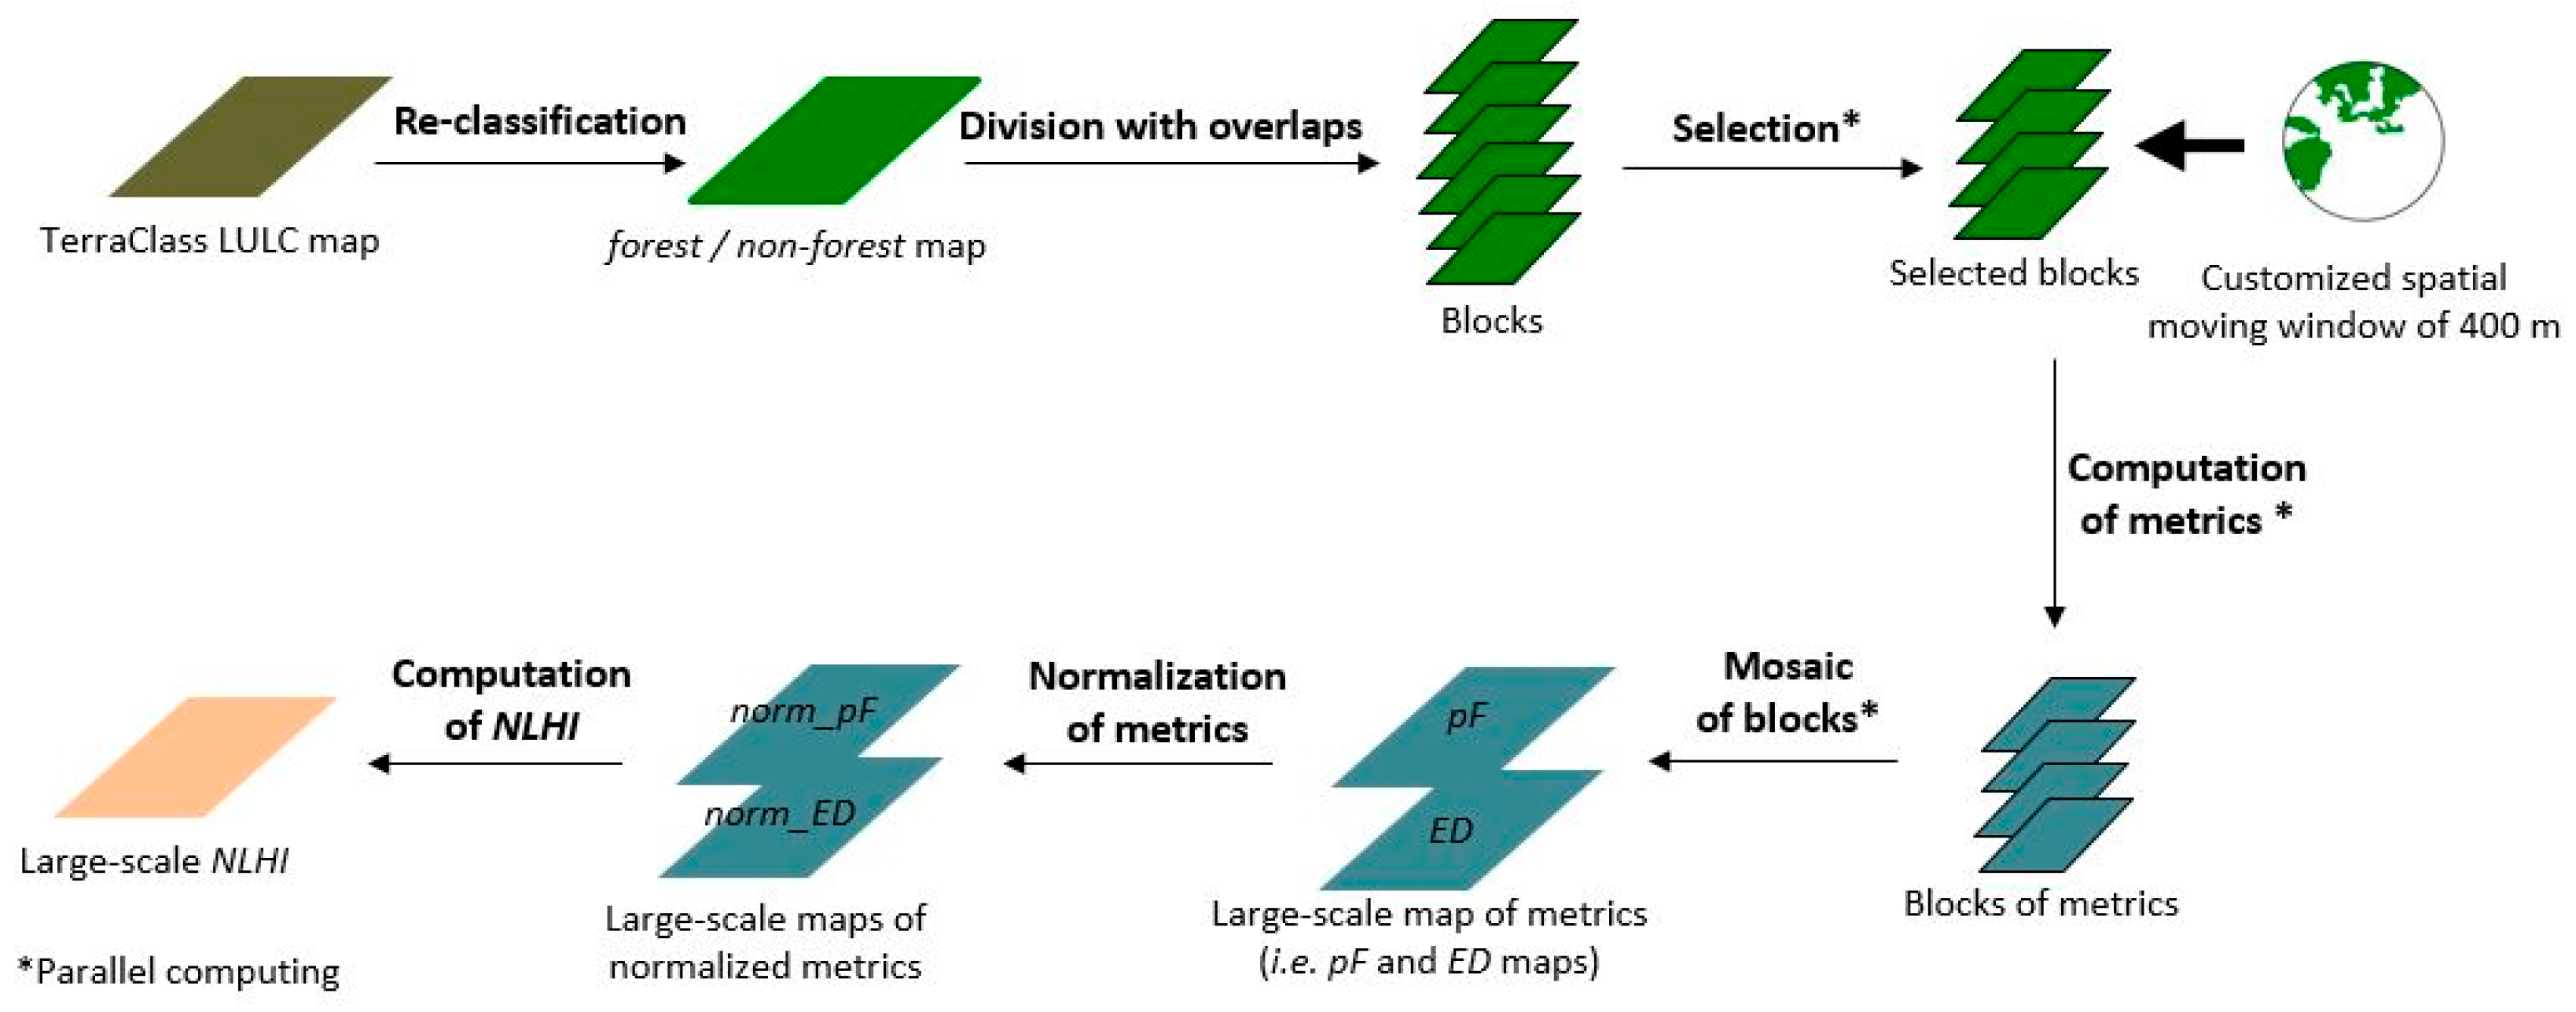
2.2.2. Large-Scale NLHI Implementation

Building the large-scale NLHI required the following steps: (1) the reclassification of input TerraClass map. In this study, the TerraClass of the State of Amapá was post-processed with the following procedures: (i) the class forest was denoted as forest hereafter, and the other classes were merged and denoted as non-forest hereafter; (ii) the non-observed areas, which are not possible to be interpreted by the Landsat data, were set to NoData and excluded from the NLHI computation, as the information of the Earth’s surface is unclear in these areas; (2) the division of input data to allow parallel computation processing. The forest vs. non-forest map of the State of Amapá was divided into numerous overlapping blocks, which are the rectangular areas having the same sizes. Each block overlaps with the neighboring ones to take into account the border effect in the computation of landscape metrics hereafter (in step 4); (3) the selection of requisite blocks. Only the blocks including forest (value = 1) and non-forest (value = 0) were embedded in the following steps. In fact, the NLHI value is null in the blocks where either forest or non-forest class is absent, as no border between the two classes exists in this case; (4) the customization of a spatial moving window and the computation of metrics (i.e., pF and ED) using the selected forest vs. non-forest blocks via moving window analysis. This window refers to a discoidal with a radius of 400 m, which was passed over each pixel of the selected blocks and returned the values of metrics back to the focal pixel. The returning values of metrics were set to NoData, while the window partly lay outside the input block or contained at least one NoData pixel (in our case, the border effect and NoData effect, respectively). Thus, the width of overlap had to be greater than or equal to the diameter of moving window (i.e., 400 × 2 m), so that the resulting blocks could be spliced together with the adjacent ones. A value of 960 m was subjectively chosen in this study; (5) the mosaic of the metric blocks for producing one large-scale map per metric (i.e., large-scale pF and ED); (6) the normalization of large-scale metrics. The normalization was executed for scaling the values of metrics between 0 and 1; (7) the computation of NLHI. The normalized large-scale pF and ED were combined using a product operator for producing the large-scale NLHI.
For reducing the computation time, multi-processors parallel computing was then applied in the third, fourth and fifth steps which took an enormous amount of time. All computations were implemented using R programming language. The overall methodology is summarized in Figure 4.

3. Results

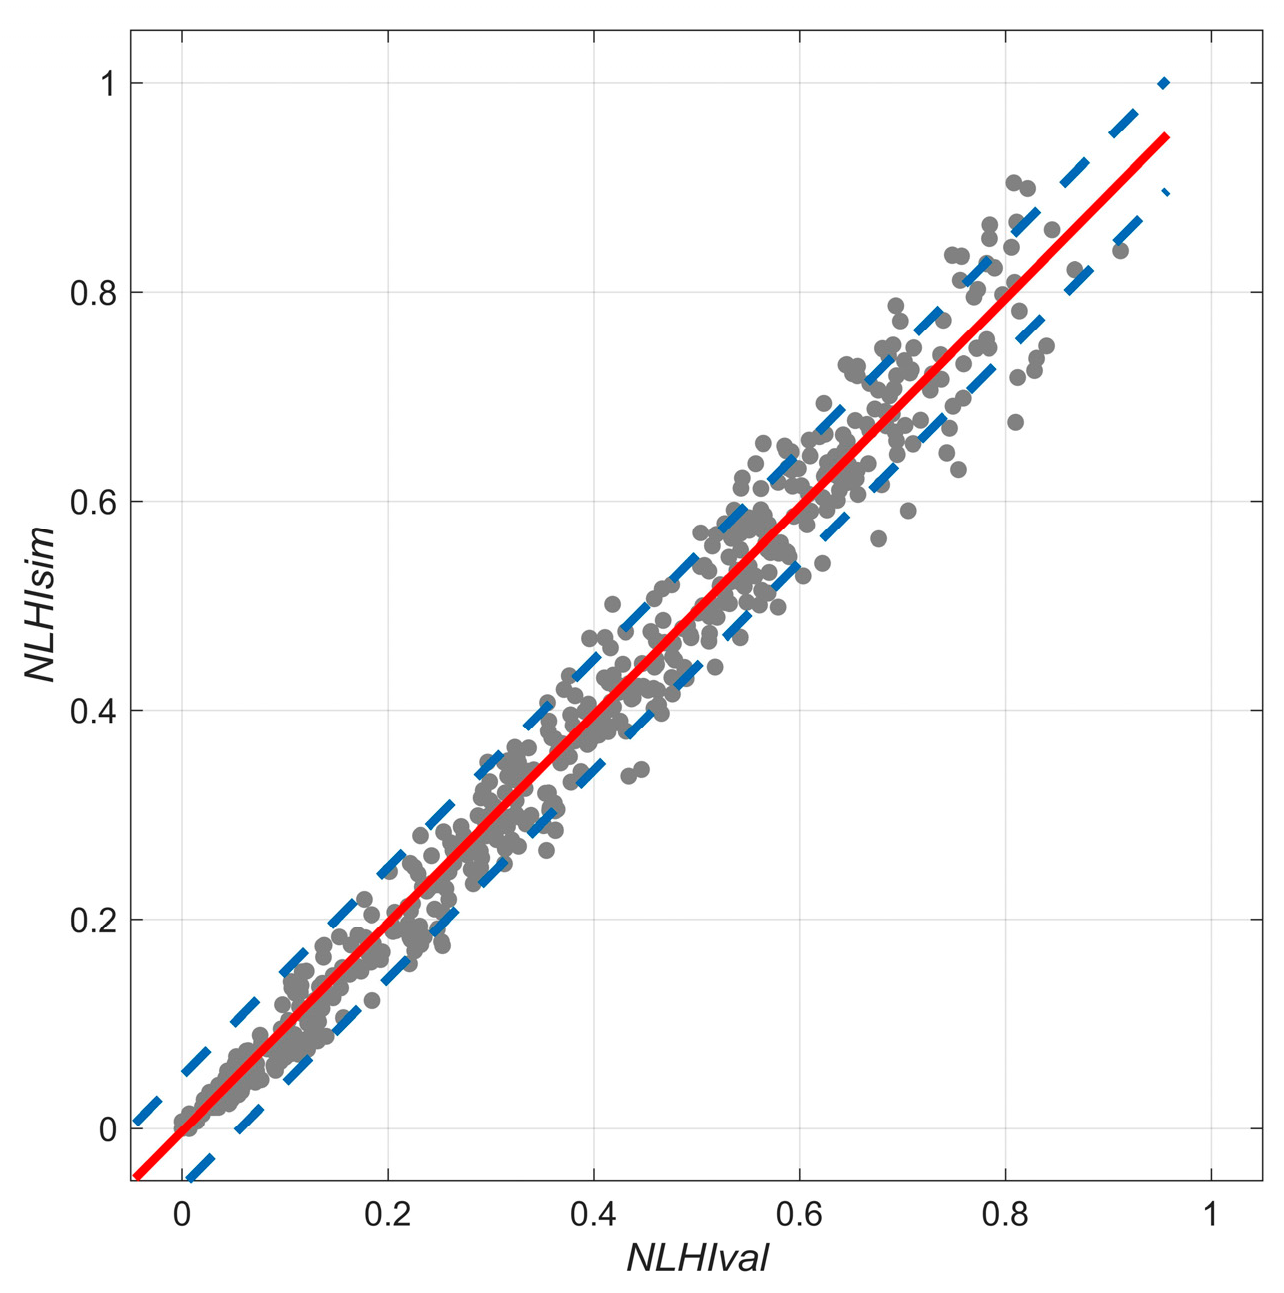
3.1. Within-Sensor Comparison between NLHIsim and NLHIval

Figure 5 represents the linear regression between NLHIsim and NLHIval. The coefficient of determination is 0.9886. This significant value shows that the NLHI was very little affected by the degradation of the spatial resolution of the forest vs. non-forest map from 10 to 30 m. In fact, the NLHI maintains a comparable capacity of discrimination. The prediction interval of NLHIsim as a function of NLHIval is 0.05. These results demonstrate the feasibility of implementing NLHI using 30 m spatial resolution LULC maps.

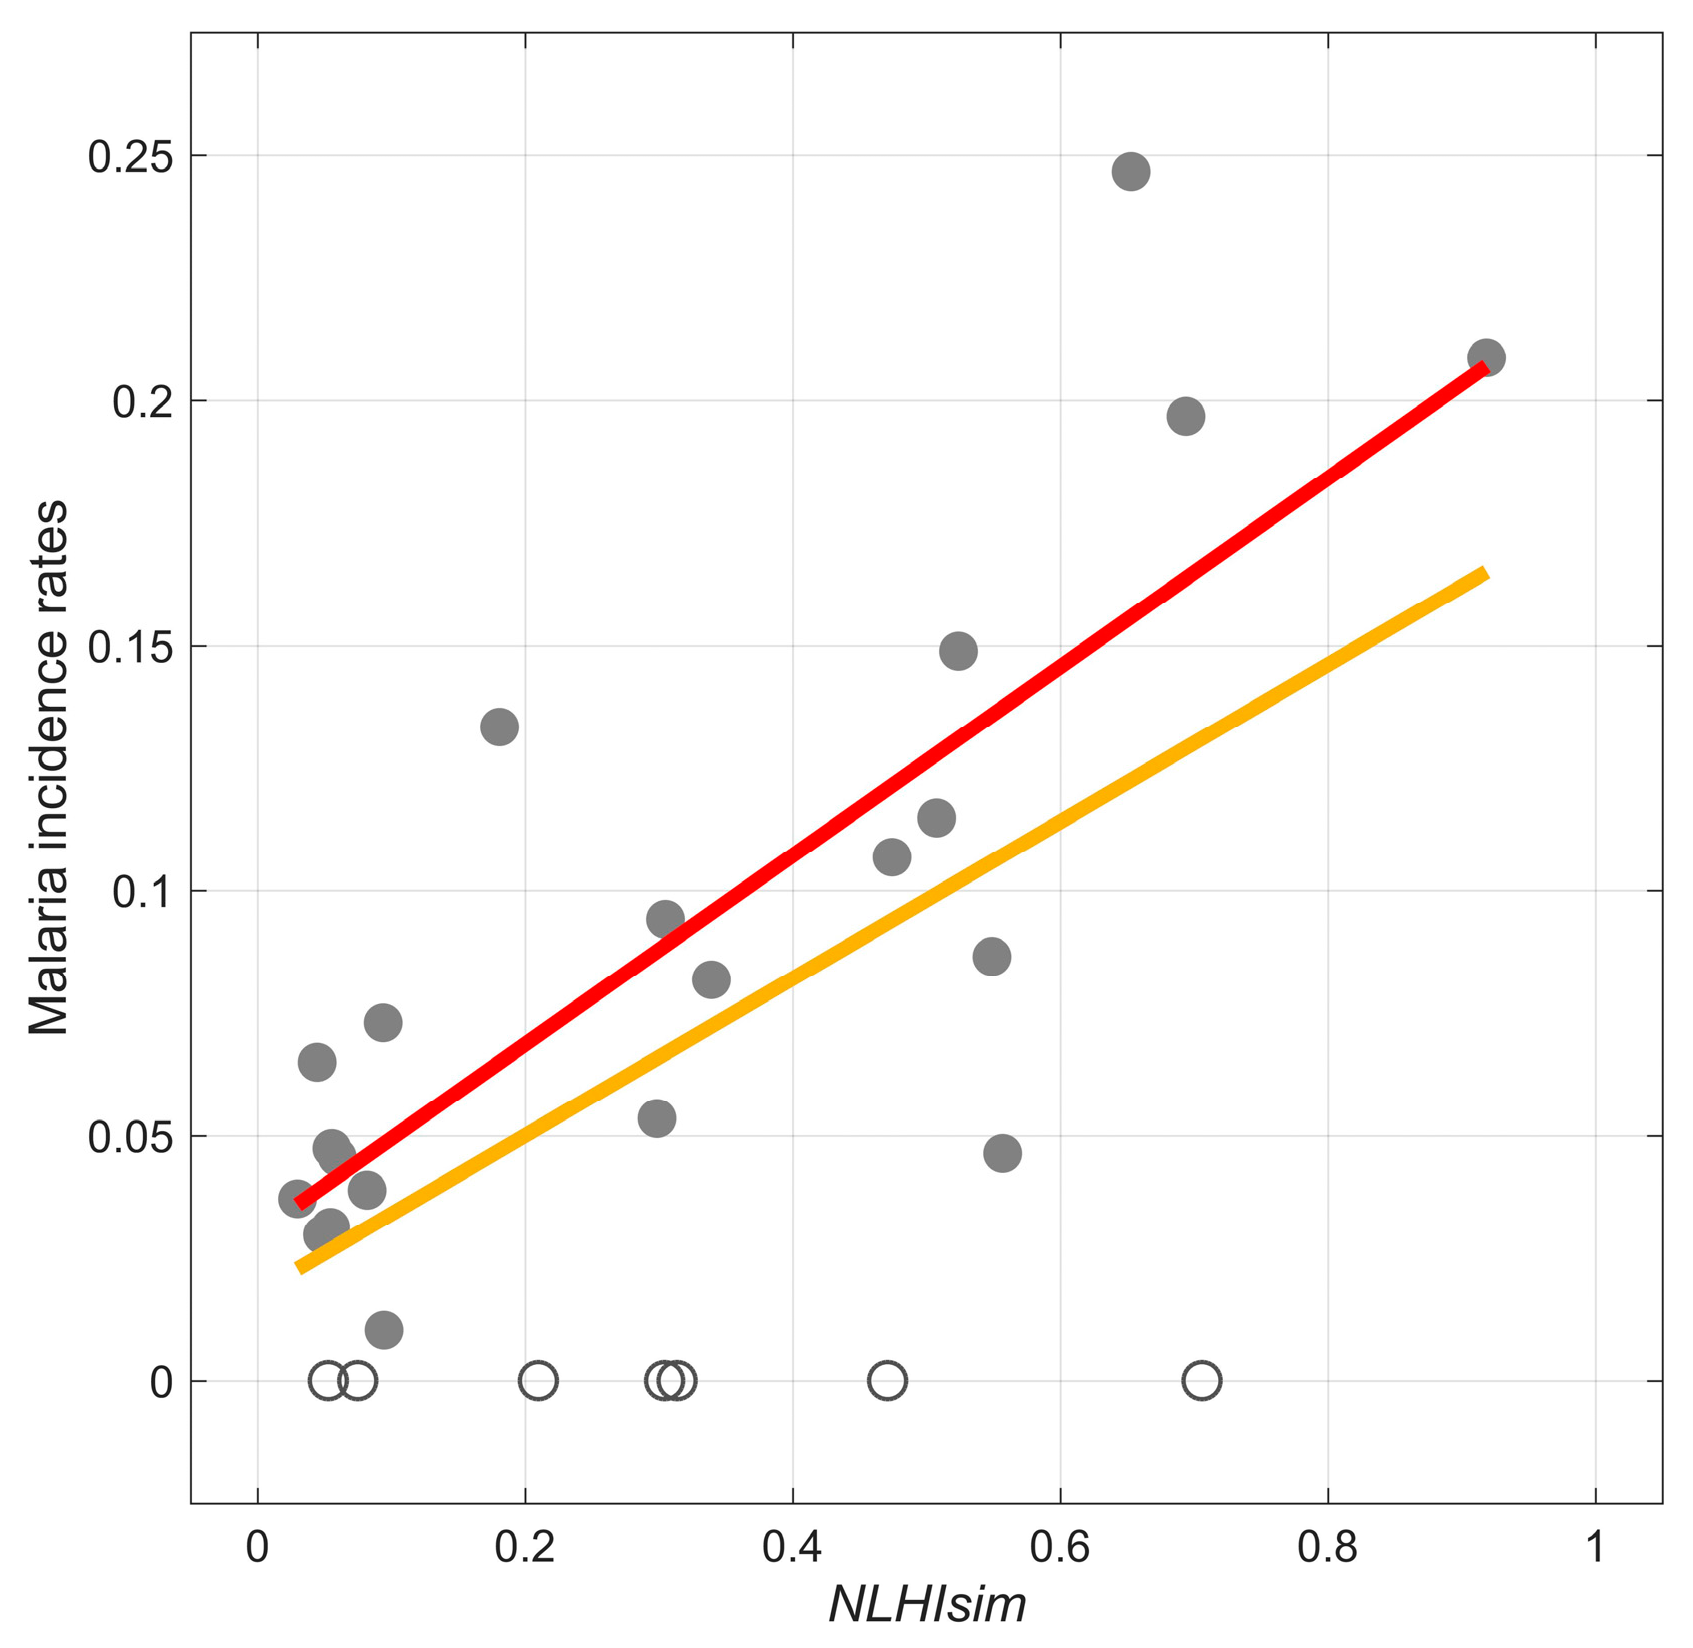
3.2. Relationship between NLHI Values and Malaria Incidence Rates

Figure 6 presents the P. falciparum incidence rates for the 28 hamlets of Camopi, as a function of the NLHIsim values. Table 1 shows the results of the correlation analysis between incidence rates and NLHIsim, as well as the results obtained with 10 m resolution NLHI obtained in [11]. The results exhibit a very significant (p-values < 0.001) relationship between NLHIsim and the non-null incidence rates, with a Pearson correlation coefficient (r), a Spearman correlation coefficient (rho) and a coefficient of determination (R2) equal to 0.80, 0.76 and 0.64, respectively. Results obtained with NLHIsim are very similar to those obtained with the native 10 m NLHI and even slightly superior.

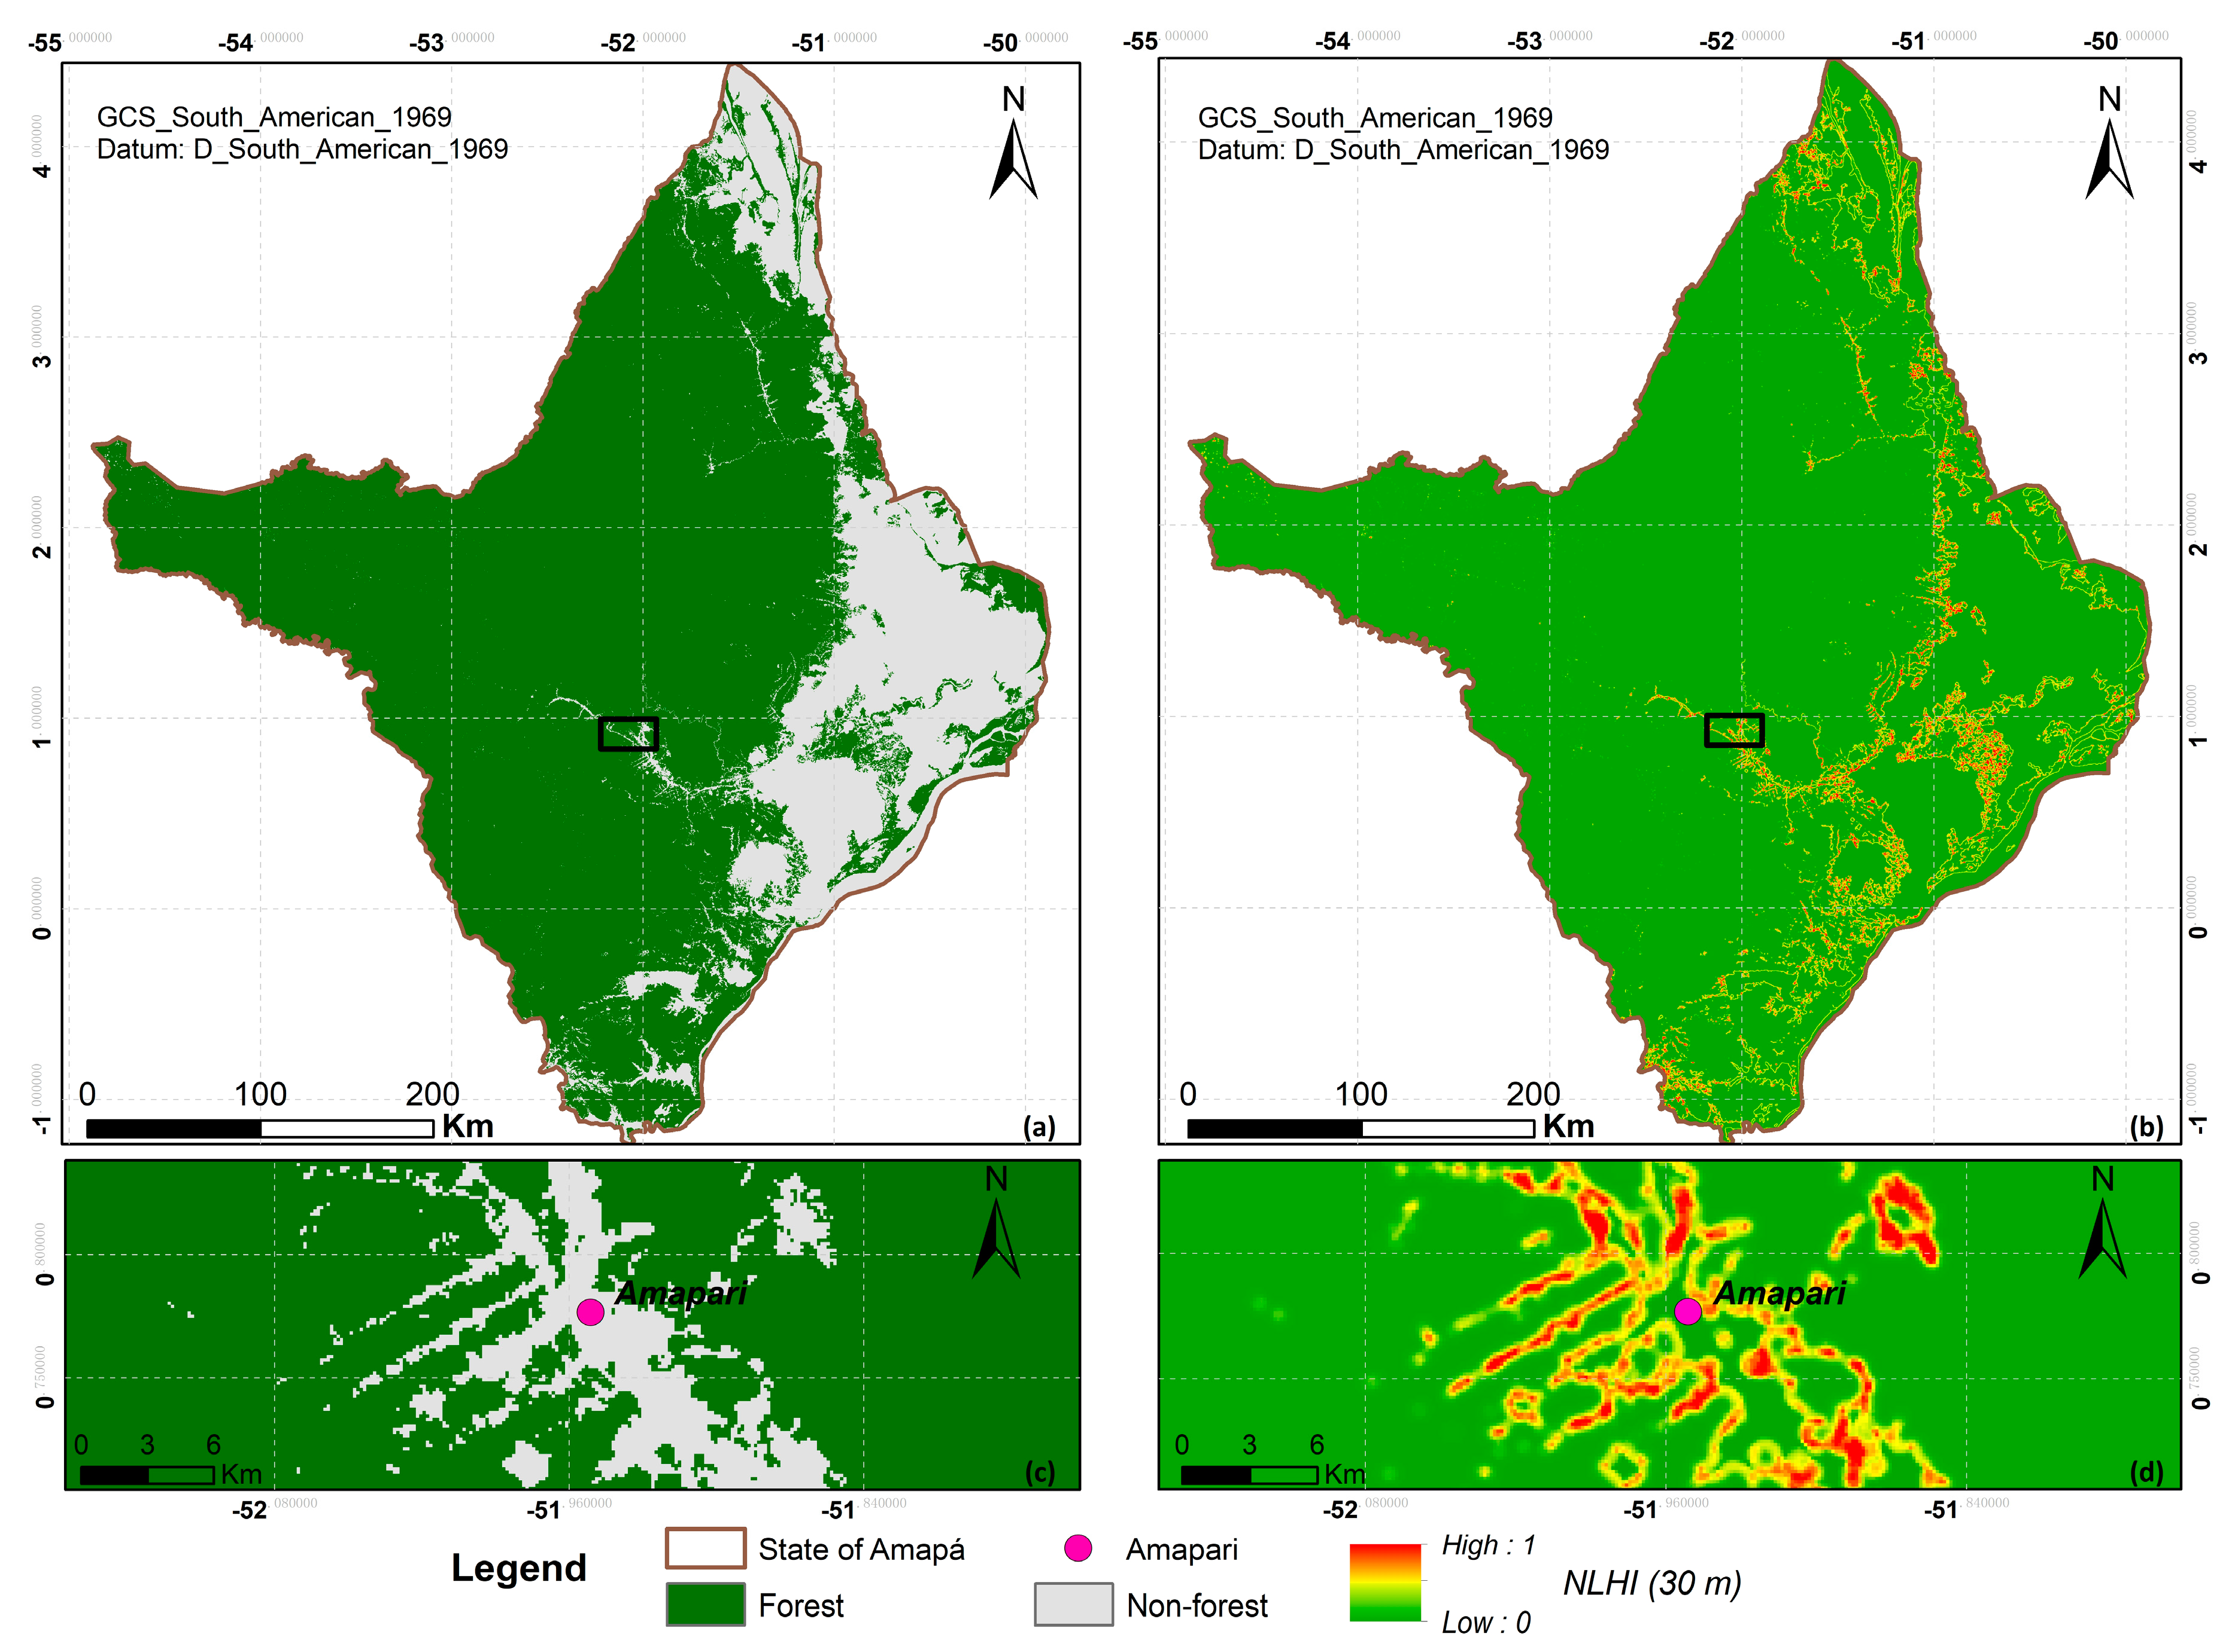
3.3. Large-Scale NLHI

Figure 7 shows the NLHI in the State of Amapá (Figure 7b) resulting from the 30 m forest vs. non-forest map (Figure 7a), which was derived from the TerraClass LULC map of 2008. Figure 7c,d provide a more intuitive and detailed view of NLHI around Amapari city.

4. Discussion

Changing spatial resolution from 10 m to 30 m does not significantly affect the performance and interpretation of NLHI. This simulation process permits us to assess the sensitivity of NLHI to spatial resolution only. In fact, any other changes in the input LULC raster have therefore been avoided, that is: (1) the changes related to sensor-specific characteristics such as systematic, radiometric and spectral features; (2) the scene-specific variations, notably changes in atmospheric conditions; (3) the differences due to the use of different satellite sensors [30]; and (4) the different classification methods. In addition, the result of the comparison between NLHIsim and actual incidence rates stated that the 30 m spatial resolution does not weaken the ability of the NLHI to reflect and quantify the contribution of the forest vs. non-forest landscapes to malaria transmission.
The LULC product derived from the TerraClass project was preferred as the input data for computing the NLHI because its objective is to map the different land use types in deforested areas related to anthropogenic activities. The class forest in TerraClass product can be used to map the resting sites of adult mosquitoes, and the forest and non-forest borders can be associated with the encounter probability of human being and adult vectors. The global accuracy of TerraClass 2008 is 76.6%, with a Kappa index of 0.67 [22]. Using the TerraClass product allows for the production of qualified NLHI maps on a regular basis.
We could also regularly realize the large-scale forest/non-forest map using the Sentinel-2 imagery having a similar temporal observation with Landsat imagery. However, optical imagery presents certain important limits in an equatorial and tropical context due to the cloud cover. In contrast, synthetic aperture radar (SAR) sensors using low-frequency microwaves enable the easy differentiation of the forest and others LULC types with their cloud-penetrating capacity and day and night measurements [31,32,33,34,35,36]. For example, the Japan Aerospace Exploitation Agency (JAXA) realized the 25 m global forest vs. non-forest maps using PALSAR/PALSAR-2 images, which include three land cover types (i.e., forest, non-forest and hydrography) [35,36]. These databases can fill the gaps in time of TerraClass database.
Several factors account for the relatively long computation time, but some of these could be easily overcome in the future: (i) all computations were implemented using a personal computer with a 6-core 3.7 GHz processor and a 32 Go Random Access Memory (RAM) whereas the High-Performance Computing (HPC) could be used; (ii) two calls to the quite costly R function PatchStat were used to implement the computation of the edge density metric and such implementation, as well as other parts of the code, can certainly be optimized; (iii) the range of spatial resolution could be investigated in order to obtain an “optimal” value for implementing NLHI, which would allow for a reduction of the computation time while still capturing detailed landscape features.
In this study, only the State of Amapá was considered for testing the data-processing chain, as it represents a relatively high malaria risk in the Brazilian Legal Amazonian region. But, HPC appears necessary for computing the NLHI in the entire Brazilian Legal Amazon region on a temporal basis.
The resulting large-scale NLHI map (Figure 7b) at a 30 m spatial resolution is able to quantify the interaction degree between forest and non-forest areas (Figure 7a) in the State of Amapá. This interaction modulates the encounter chance between the main malaria vector (i.e., Anopheles darling) and humans frequenting the non-forested areas. It also allows study such interaction at a more local spatial scale (Figure 7c). Consequently, NLHI contributes to the assessment of exposure risk to the main malaria vector in the region. Deforestation is not only provoked by mass forest destruction (e.g., forest cleaning for pasture land) but also by diffuse forest disturbances (e.g., roads and selective logging sites), which represent a higher risk of malaria transmission [37]. In the future, this large-scale NLHI map might be used for investigating the contribution of each deforestation pattern type on malaria transmission.

5. Conclusions

An automatic data-processing chain was established for the practical production of a landscape-based hazard index (NLHI) of malaria transmission at large scales. This algorithm was tested in the State of Amapá in Brazil using the TerraClass LULC map with a spatial resolution of 30 m. Such large-scale NLHI can give a broader view of the human risk of exposure to adult malaria vectors in this region, which might be used for establishing large-scale prevention and control of malaria transmission. More generally, this algorithm can be used in various studies that require large-scale analysis of landscape features, using landscape metrics and a spatial moving window.

Acknowledgments

This study was supported by the China Scholarship Council, the OSE-Guyamapá project (FEDER-Guyane, PO-Amazonie call), the TéléPal project (CNES-TOSCA 2014 call) and the GAPAM-Sentinela project (Guyamazon call). This work was also supported by public funds received in the framework of GEOSUD, a project (ANR-10-EQPX-20) of the program "Investissements d'Avenir" managed by the French National Research Agency. The authors wish to thank the INPE for providing the TerraClass dataset. The authors would also like to thank the members of the Environment, Societies and Health Risks inter-disciplinary work-group (ESoR group) of the ESPACE-DEV Unit for the constructive discussions that enriched the paper.

Author Contributions

Z.L. participated in the research design, data collection, analysis and interpretation, and prepared the manuscript. T.C. reviewed the manuscript. N.D. reviewed the manuscript. H.G. reviewed the manuscript. C.A. reviewed the manuscript. C.B. reviewed the manuscript. E.R. participated in the research design, data collection, analysis and interpretation, and reviewed the manuscript. All authors read and approved the final manuscript.

Conflicts of Interest

The authors declare no conflict of interest.

Abbreviations

The following abbreviations are used in this manuscript:
EDEdge density
EMBRAPABrazilian Agricultural Research Corporation
HPCHigh Performance Computing
INPEBrazilian National Institutes for Space Research
JAXAJapan Aerospace Exploitation Agency
LULCLand use and land cover
NLHINormalization landscape-based hazard index
pFProportion of the forest
RAMRandom Access Memory
SARSynthetic aperture radar

References

  1. WHO. World Malaria Repport 2016; WHO: Geneva, Swizerland, 2016. [Google Scholar]
  2. Vitor-Silva, S.; Siqueira, A.M.; de Souza Sampaio, V.; Guinovart, C.; Reyes-Lecca, R.C.; de Melo, G.C.; Monteiro, W.M.; Del Portillo, H.A.; Alonso, P.; Bassat, Q.; et al. Declining malaria transmission in rural Amazon: Changing epidemiology and challenges to achieve elimination. Malar. J. 2016, 15, 266. [Google Scholar] [CrossRef] [PubMed]
  3. Alimi, T.O.; Fuller, D.O.; Quinones, M.L.; Xue, R.D.; Herrera, S.V.; Arevalo-Herrera, M.; Ulrich, J.N.; Qualls, W.A.; Beier, J.C. Prospects and recommendations for risk mapping to improve strategies for effective malaria vector control interventions in latin America. Malar. J. 2015, 14, 519. [Google Scholar] [CrossRef] [PubMed]
  4. Alegana, V.A.; Atkinson, P.M.; Lourenco, C.; Ruktanonchai, N.W.; Bosco, C.; Erbach-Schoenberg, E.Z.; Didier, B.; Pindolia, D.; Le Menach, A.; Katokele, S.; et al. Advances in mapping malaria for elimination: Fine resolution modelling of plasmodium falciparum incidence. Sci. Rep. 2016, 6, 29628. [Google Scholar] [CrossRef] [PubMed]
  5. Ye, Y.; Hoshen, M.; Kyobutungi, C.; Louis, V.R.; Sauerborn, R. Local scale prediction of plasmodium falciparum malaria transmission in an endemic region using temperature and rainfall. Glob. Health Action 2009, 2. [Google Scholar] [CrossRef]
  6. Musset, L.; Pelleau, S.; Girod, R.; Ardillon, V.; Carvalho, L.; Dusfour, I.; Gomes, M.S.M.; Djossou, F.; Legrand, E. Malaria on the Guiana shield: A review of the situation in French Guiana. Mem. Inst. Oswaldo Cruz 2014, 109, 525–533. [Google Scholar] [CrossRef] [PubMed]
  7. Vittor, A.Y.; Gilman, R.H.; Tielsch, J.; Glass, G.; Shields, T.; Lozano, W.S.; Pinedo-Cancino, V.; Patz, J.A. The effect of deforestation on the human-biting rate of Anopheles darlingi, the primary vector of Falciparum malaria in the Peruvian Amazon. Am. J. Trop. Med. Hyg. 2006, 74, 3–11. [Google Scholar] [PubMed]
  8. Vittor, A.Y.; Pan, W.; Gilman, R.H.; Tielsch, J.; Glass, G.; Shields, T.; Sanchez-Lozano, W.; Pinedo, V.V.; Salas-Cobos, E.; Flores, S.; et al. Linking deforestation to malaria in the Amazon: Characterization of the breeding habitat of the principal malaria vector, Anopheles darlingi. Am. J. Trop. Med. Hyg. 2009, 81, 5–12. [Google Scholar] [PubMed]
  9. Barros, F.S.; Honorio, N.A. Deforestation and malaria on the Amazon frontier: Larval clustering of Anopheles darlingi (Diptera: Culicidae) determines focal distribution of malaria. Am. J. Trop. Med. Hyg. 2015, 93, 939–953. [Google Scholar] [CrossRef] [PubMed]
  10. Stefani, A.; Dusfour, I.; Cruz, M.C.B.; Dessay, N.; Galardo, A.K.R.; Galardo, C.D.; Girod, R.; Gomes, M.S.M.; Gurgel, H.; Lima, A.C.F.; et al. Land cover, land use and malaria in the amazon: A systematic literature review of studies using remotely sensed data. Malar. J. 2013, 12. [Google Scholar] [CrossRef] [PubMed]
  11. Li, Z.; Roux, E.; Dessay, N.; Girod, R.; Stefani, A.; Nacher, M.; Moiret, A.; Seyler, F. Mapping a knowledge-based malaria hazard index related to landscape using remote sensing: Application to the cross-border area between French Guiana and Brazil. Remote Sens. 2016, 8, 319. [Google Scholar] [CrossRef]
  12. Lu, D.; Batistella, M.; Li, G.; Moran, E.; Hetrick, S.; Freitas, C.D.; Dutra, L.V.; Sant’anna, S.J. Land use/cover classification in the Brazilian Amazon using satellite images. Pesq. agropec. bras. 2012, 47. [Google Scholar] [CrossRef] [PubMed]
  13. Wang, G.; Liu, J.; He, G. A method of spatial mapping and reclassification for high-spatial-resolution remote sensing image classification. Sci. World J. 2013, 2013, 192982. [Google Scholar] [CrossRef] [PubMed]
  14. Asner, G.P. Cloud cover in Landsat observations of the Brazilian Amazon. Int. J. Remote Sens. 2001, 22, 3855–3862. [Google Scholar] [CrossRef]
  15. Souza, J.C.; Siqueira, J.; Sales, M.; Fonseca, A.; Ribeiro, J.; Numata, I.; Cochrane, M.; Barber, C.; Roberts, D.; Barlow, J. Ten-year Landsat classification of deforestation and forest degradation in the Brazilian Amazon. Remote Sens. 2013, 5, 5493–5513. [Google Scholar] [CrossRef]
  16. Tiner, R.W.; Lang, M.W.; Klemas, V.V. Remote Sensing of Wetlands: Applications and Advances; CRC Press: Boca Raton, FL, USA, 2015. [Google Scholar]
  17. Powell, S.L.; Pflugmacher, D.; Kirschbaum, A.A.; Kim, Y.; Cohen, W. Moderate resolution remote sensing alternatives: A review of Landsat-like sensors and their applications. J. Appl. Remote Sens. 2007, 1, 012506. [Google Scholar]
  18. Gong, P.; Wang, J.; Yu, L.; Zhao, Y.; Zhao, Y.; Liang, L.; Niu, Z.; Huang, X.; Fu, H.; Liu, S.; et al. Finer resolution observation and monitoring of global land cover: First mapping results with Landsat TM and ETM+ data. Int. J. Remote Sens. 2013, 34, 2607–2654. [Google Scholar] [CrossRef]
  19. Baraldi, A.; Puzzolo, V.; Blonda, P.; Bruzzone, L.; Tarantino, C. Automatic spectral rule-based preliminary mapping of calibrated Landsat tm and etm+ images. IEEE Trans. Geosci. Remote Sens. 2006, 44, 2563–2586. [Google Scholar] [CrossRef]
  20. Kim, D.H.; Sexton, J.O.; Noojipady, P.; Huang, C.Q.; Anand, A.; Channan, S.; Feng, M.; Townshend, J.R. Global, Landsat-based forest-cover change from 1990 to 2000. Remote Sens. Environ. 2014, 155, 178–193. [Google Scholar] [CrossRef]
  21. Song, D.-X.; Huang, C.; Sexton, J.O.; Channan, S.; Feng, M.; Townshend, J.R. Use of Landsat and corona data for mapping forest cover change from the mid-1960s to 2000s: Case studies from the eastern united states and central brazil. ISPRS 2015, 103, 81–92. [Google Scholar] [CrossRef]
  22. Almeida, C.A.D.; Coutinho, A.C.; Esquerdo, J.C.D.M.; Adami, M.; Venturieri, A.; Diniz, C.G.; Dessay, N.; Durieux, L.; Gomes, A.R. High spatial resolution land use and land cover mapping of the brazilian legal amazon in 2008 using Landsat-5/TM and modis data. Acta Amazon. 2016, 46, 291–302. [Google Scholar] [CrossRef]
  23. Hargis, C.D.; Bissonette, J.A.; David, J.L. The behavior of landscape metrics commonly used in the study of habitat fragmentation. Landsc. Ecol. 1998, 13, 167–186. [Google Scholar] [CrossRef]
  24. Saura, S. Effects of minimum mapping unit on land cover data spatial configuration and composition. Int. J. Remote Sens. 2002, 23, 4853–4880. [Google Scholar] [CrossRef]
  25. Frohn, R.; Hao, Y. Landscape metric performance in analyzing two decades of deforestation in the Amazon basin of rondonia, Brazil. Remote Sens. Environ. 2006, 100, 237–251. [Google Scholar] [CrossRef]
  26. McGarigal, K.; Cushman, S.; Ene, E. Fragstats v4: Spatial Pattern Analysis Program for Categorical and Continuous Maps; University of Massachusetts, Amherst: Amherst, MA, USA; Available online: https://www.umass.edu/landeco/research/fragstats/fragstats.html (accessed on 1 April 2017).
  27. Hustache, S.; Nacher, M.; Djossou, F.; Carme, B. Malaria risk factors in amerindian children in French Guiana. Am. J. Trop. Med. Hyg. 2007, 76, 619–625. [Google Scholar] [PubMed]
  28. Stefani, A.; Hanf, M.; Nacher, M.; Girod, R.; Carme, B. Environmental, entomological, socioeconomic and behavioural risk factors for malaria attacks in amerindian children of Camopi, French Guiana. Malar. J. 2011, 10. [Google Scholar] [CrossRef] [PubMed]
  29. Stefani, A.; Roux, E.; Fotsing, J.M.; Carme, B. Studying relationships between environment and malaria incidence in Camopi (French Guiana) through the objective selection of buffer-based landscape characterisations. Int. J. Health Geogr. 2011, 10. [Google Scholar] [CrossRef] [PubMed]
  30. Theau, J.; Sankey, T.T.; Weber, K.T. Multi-sensor analyses of vegetation indices in a semi-arid environment. Gisci. Remote Sens. 2010, 47, 260–275. [Google Scholar] [CrossRef]
  31. Thiel, C.; Drezet, P.; Weise, C.; Quegan, S.; Schmullius, C. Radar remote sensing for the delineation of forest cover maps and the detection of deforestation. Forestry 2006, 79, 589–597. [Google Scholar] [CrossRef]
  32. Rahman, M.M.; Sumantyo, J.T.S. Mapping tropical forest cover and deforestation using synthetic aperture radar (SAR) images. Appl. Geomat. 2010, 2, 113–121. [Google Scholar] [CrossRef]
  33. Kellndorfer, J.; Cartus, O.; Bishop, J.; Walker, W.; Holecz, F. Large scale mapping of forests and land cover with synthetic aperture radar data. In Land Applications of Radar Remote Sensing; Holecz, F., Pasquali, P., Milisavljevic, N., Closson, D., Eds.; InTech: London, UK, 2014. [Google Scholar]
  34. Shimada, M.; Itoh, T.; Motooka, T.; Watanabe, M.; Shiraishi, T.; Thapa, R.; Lucas, R. New global forest/non-forest maps from ALOS PALSAR data (2007–2010). Remote Sens. Environ. 2014, 155, 13–31. [Google Scholar] [CrossRef]
  35. Shimada, M.; Itoh, T.; Motooka, T.; Watanabe, M.; Thapa, R. High-resolution satellite radar for mapping changes in global forest cover. SPIE Sens. Meas. 2015. [Google Scholar] [CrossRef]
  36. Ningthoujam, R.; Tansey, K.; Balzter, H.; Morrison, K.; Johnson, S.; Gerard, F.; George, C.; Burbidge, G.; Doody, S.; Veck, N.; et al. Mapping forest cover and forest cover change with airborne s-band radar. Remote Sens. 2016, 8, 577. [Google Scholar] [CrossRef]
  37. Hahn, M.B.; Gangnon, R.E.; Barcellos, C.; Asner, G.P.; Patz, J.A. Influence of deforestation, logging, and fire on malaria in the Brazilian Amazon. PLoS ONE 2014, 9, e85725. [Google Scholar] [CrossRef] [PubMed]
Figure 1. The entire Amazon region and the cross-border area between French Guiana and Brazil.
Data 02 00037 g001
Figure 2. Flowchart of the evaluation of the impact of coarser spatial resolution on the normalized landscape-based hazard index (NLHI) values.
Data 02 00037 g002
Figure 3. TerraClass 2008 map for the entire Brazilian Legal Amazon (source: Brazilian National Institute for Space Research (INPE)).
Data 02 00037 g003
Figure 4. Summarized method of large-scale NLHI implementation.
Data 02 00037 g004
Figure 5. NLHIsim values as a function of NLHIval. The line represents the regression line obtained using a linear regression model.
Data 02 00037 g005
Figure 6. P. falciparum incidence rate values as a function of NLHIsim. Dots and circle correspond to non-null and null incidence rates, respectively. Red and yellow lines represent the regression lines with non-null incidence rates and all the incidence rates, respectively, using a linear regression model.
Data 02 00037 g006
Figure 7. Results of large-scale NLHI computation. (a) Forest vs. non-forest map in the State of Amapá; (b) map of NLHI of the state; (c) Zoom of forest vs. non-forest map of Amapari; and (d) the corresponding NLHI map of Amapari.
Data 02 00037 g007
Table 1. Results of the correlation analysis between P. falciparum incidence rates, NLHIsim and the native one. The values correspond to the Pearson correlation coefficient, r; the Spearman rank correlation coefficient, rho; and the coefficient of determination of a linear regression, R2. Among these, the non-bold and bold values represent the results obtained with NLHIsim and the native NLHI, respectively. One or two asterisks correspond to a p-value lower than or equal to 0.01 and 0.001, respectively.
Correlation AnalysisrrhoR2
Whole dataset0.60 **0.440.36 **
0.59 **0.430.35 **
Non-null incidence rates only0.80 **0.76 **0.64 **
0.79 **0.75 **0.63 **
Notes: ** p-value ≤ 0.001.

