1. Summary
Post-harvest fungal and mycotoxin contamination remains a critical challenge within African grain supply chains. The challenge is primarily associated with toxigenic fungi, such as Aspergillus and Fusarium species, which colonize maize kernels during production, storage, or handling [
1]. These fungi produce harmful secondary metabolites, including aflatoxins and fumonisins, which are linked to severe health risks, including acute aflatoxicosis and long-term carcinogenic and immunosuppressive effects [
2]. To reduce the risk of contaminated grains entering the human food chain, smallholder farmers and traders traditionally rely on manual visual sorting. In this practice, kernels are inspected for visible surface irregularities such as discoloration, mold growth, shriveling, cracks or breakage, insect damage (e.g., holes or feeding marks), deformation, and surface contamination, as these defects are often correlated with higher mycotoxin concentrations [
3]. Previous studies have demonstrated that visible kernel defects can serve as practical indicators of increased mycotoxin contamination risk. Kang’ethe et al. [
4] noted that kernel damage caused by insects, poor post-harvest handling, and unfavorable storage conditions facilitates fungal invasion and creates conditions conducive to aflatoxin and fumonisin production. Similarly, Dolezal et al. [
5] showed that infection of maize kernels by
Aspergillus flavus disrupts normal kernel development, reduces grain quality, and induces physical changes in kernel tissues, providing a biological basis for the appearance of visible defects associated with fungal colonization and aflatoxin accumulation. Supporting the practical relevance of these observations, Matumba et al. [
6] reported that the removal of visibly moldy, shriveled, broken, immature, and discolored maize kernels substantially reduced aflatoxin and fumonisin concentrations, indicating that visibly defective kernels carried a disproportionate share of the contamination burden. Collectively, these findings support the use of visual indicators such as discoloration, fungal growth, shriveling, breakage, insect damage, and deformation as practical markers of elevated fungal infection and potential mycotoxin contamination risk, while recognizing that visual inspection alone cannot directly quantify mycotoxin concentrations. However, manual sorting is labor-intensive and subjective, and external characteristics do not always reliably indicate internal contamination levels [
7].
Recent advances in machine learning and computer vision offer significant opportunities to modernize and automate grain inspection [
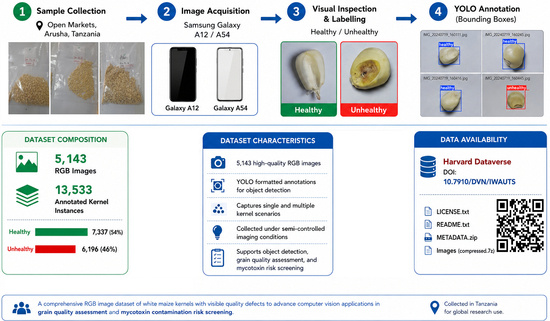
8]. The development of robust, field-deployable systems requires annotated image datasets that represent the actual conditions of agricultural trade. This dataset was compiled to provide high-quality labeled RGB images of white maize kernels categorized into two classes: healthy kernels and unhealthy kernels exhibiting visible surface defects associated with fungal infection and potential contamination risk.
While several existing studies utilize specialized imaging systems such as flatbed scanners or high-end industrial cameras, these laboratory-based approaches often eliminate the stochastic variables present in real-world supply chains [
9].
The primary contribution of this dataset is the provision of high-resolution RGB images of white maize kernels acquired using commodity smartphone cameras under semi-controlled imaging conditions that capture realistic variability in illumination, scale, orientation, sensor noise, and image quality. In addition, the dataset provides instance-level annotations in the YOLO (You Only Look Once) format, enabling the simultaneous detection and classification of multiple kernels within a single image and supporting the development of high-throughput object detection models suitable for Edge-AI deployment [
8].
By incorporating natural variability in lighting, scale, and kernel morphology across multiple white maize varieties, the dataset provides a practical benchmark for evaluating model robustness in resource-constrained agricultural systems.
The objective of this data descriptor is to provide a publicly available RGB image dataset of white maize kernels with instance-level annotations for the development and evaluation of computer vision models capable of detecting visible surface defects associated with fungal infection and indicators of potential mycotoxin contamination risk. The public release of this data aims to facilitate the standardization of automated grain quality assessment and provide a foundation tool for enhancing food safety in regional markets.
This research received no external funding and was conducted as part of the authors’ academic research. Furthermore, at the time of writing, no prior publications have utilized this specific validated subset.
2. Data Description
2.1. Dataset Description
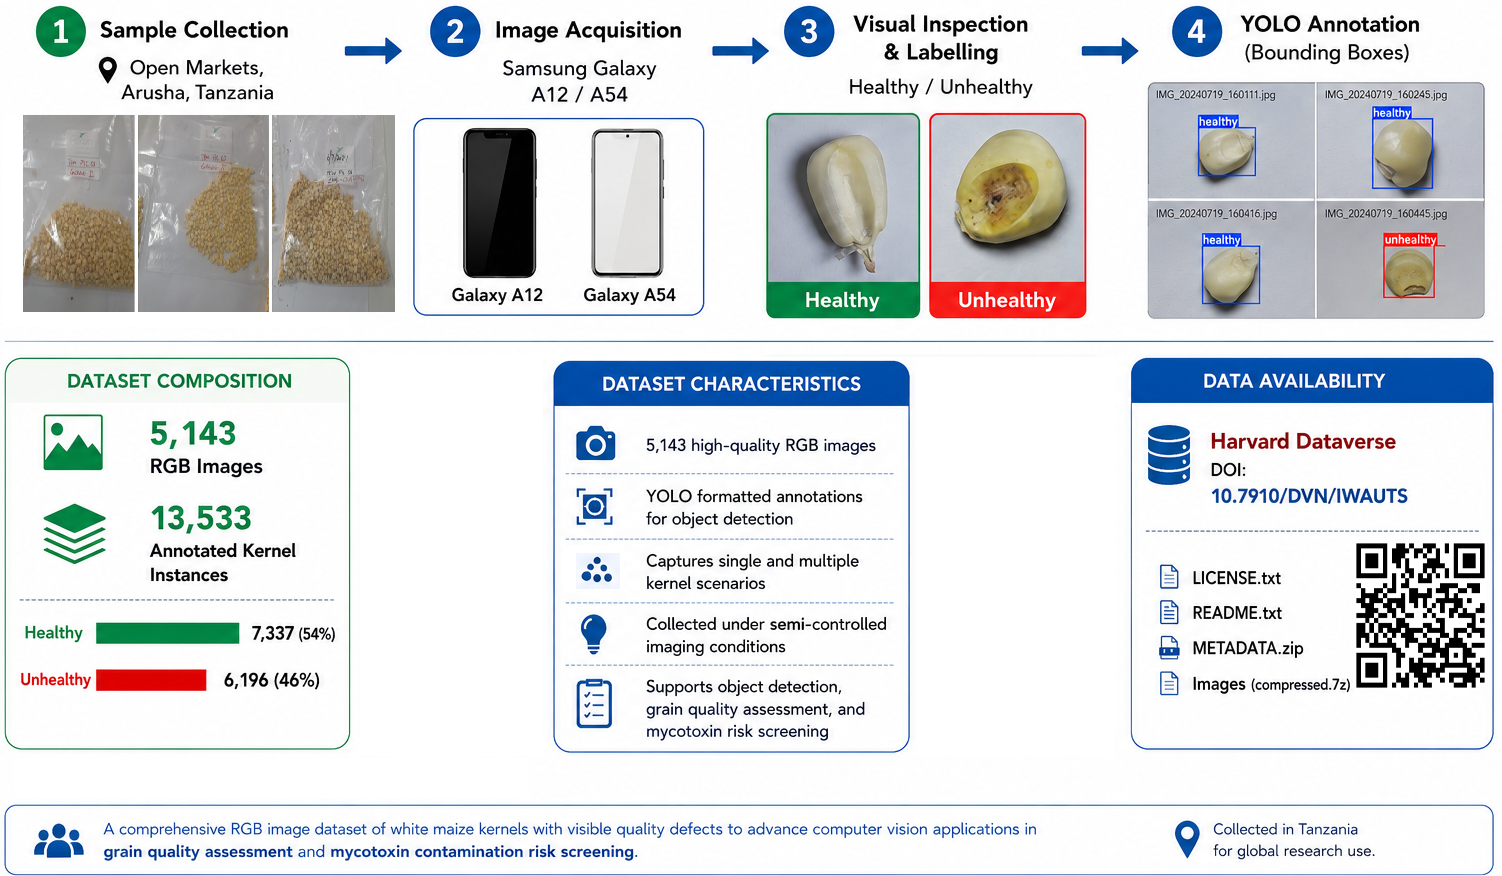
The dataset consists of RGB images containing a variable number of white maize kernels, ranging from one to several kernels per image. Each kernel within an image is annotated at the instance level using a bounding box and assigned a class label (healthy or unhealthy). In total, the dataset comprises 5143 images and 13,533 annotated kernel instances.
Table 1 summarizes the number of kernel instances per class.
Additional dataset composition statistics are provided in
Table 2 to further characterize image-level variability and annotation distribution. The dataset contains both single-kernel and multi-kernel images, reflecting realistic acquisition scenarios encountered during maize quality inspection. The number of kernels per image varies considerably, supporting the development and evaluation of object detection models under different object-density conditions.
The images capture the full kernel structure, including the tip cap, embryo, and endosperm, ensuring comprehensive representation of morphological regions where visual defect indicators may manifest. This broad morphological coverage supports the development of robust and generalizable computer vision-based classification and detection models.
2.2. Dataset Organization and File Structure
The dataset is organized into several files and folders in the Harvard Dataverse repository. The repository includes the following files:
README.txt—provides instructions for downloading, extracting, and using the dataset files.
METADATA.zip—contains metadata describing the dataset structure and annotations.
LICENSE.txt—describes the licensing conditions for dataset use.
The images directory contains compressed image archives split into multiple files (images.7z.001 to images.7z.016). These files must be combined and extracted using archive software that supports multi-part .7z files to reconstruct the complete image dataset.
2.3. Metadata Structure and Annotation Format
The dataset includes structured metadata that support both image-level and instance-level interpretation. Metadata is provided through a combination of directory organization, annotation files, and supporting text files within the repository.
At the image level, each RGB image is uniquely identified by its filename and is associated with a corresponding annotation file in the label directory. The annotation filename matches the image filename, enabling direct mapping between images and their corresponding labels. As stated earlier, an image may contain one or multiple maize kernels, with the number of annotated kernel instances ranging from 1 to 31 per image. Each image represents a unique acquisition event. Individual kernels were not intentionally re-imaged across devices or acquisition sessions, although multiple kernels may appear within the same image.
At the instance level, annotations are provided in YOLO format, where each line in a label file represents a single kernel instance using normalized bounding box coordinates. The annotation format is defined as
where all coordinates are normalized to the range [0, 1] relative to the width and height of the corresponding image.
Class definitions are provided in the classes.txt file, where class identifiers correspond to: (0) healthy kernels and (1) unhealthy kernels.
Image resolution is an important characteristic of computer vision datasets because it influences object scale, image detail, and model training behavior. As the dataset was acquired using two smartphone cameras under semi-controlled imaging conditions, images were captured at multiple native resolutions.
Table 3 summarizes the distribution of image resolutions across the dataset.
The observed variation in image resolution reflects the use of multiple devices and image orientations during dataset acquisition. Device model information was retained for a subset of images through embedded metadata; however, metadata were not consistently preserved across the entire dataset. Consequently, acquisition-device identities cannot be reliably determined for every image, and exact device-specific image counts could not be reconstructed from the available metadata.
Kernel size statistics were estimated from the annotation data. Across the 13,533 annotated kernel instances, the median bounding-box dimensions were approximately 387 pixels in width and 392 pixels in height. These values provide an indication of kernel size within image space and may vary according to image resolution, kernel orientation, and acquisition conditions. It should be noted that a single image with a substantially lower resolution (316 × 356 pixels) is retained within the repository as part of the original dataset record.
The dataset structure and file organization are further described in the accompanying documentation file (dataset_structure.md), which provides guidance on directory layout, file relationships, and usage considerations.
It should be noted that additional metadata (e.g., exact camera-to-object distance, illumination intensity, ISO values, white balance settings, or device-specific acquisition parameters for individual images) were not recorded at the image level. This limitation should be considered when reproducing experimental conditions or performing controlled comparisons.
3. Methods
3.1. Study Area and Sample Collection
Maize kernel samples were collected from three major open maize markets in Arusha region of Tanzania, namely Mbauda Market, Kilombero Market, and Tengeru Market. Sample collection was conducted on 5–6 July 2024, yielding six market samples of approximately 1 kg each. The collected maize was not pre-sorted prior to purchase and therefore reflected the variability typically encountered in local grain trading systems. Following collection, the samples were transported to the NM-AIST mycotoxin Laboratory and stored at −4 °C prior to laboratory preparation, imaging, and annotation.
To maximize the diversity of kernel varieties, storage histories, and contamination conditions represented in the dataset, kernels originating from the collected market samples were subsequently combined prior to the imaging workflow. Consequently, market-specific identities were not retained at the image or annotation level.
3.2. Sample Preparation
Following collection and storage, maize kernel samples were manually cleaned to remove foreign materials such as dust, broken fragments, and debris prior to sample preparation and imaging. A preliminary visual sorting step was performed to group kernels into three categories, visibly clean, mildly defective, and severely defective (out-sorts), based on observable surface and structural characteristics. To improve consistency and reduce subjectivity, the visual criteria were established in consultation with domain experts in grain quality assessment prior to sorting. These criteria included broad indicators such as discoloration, visible contamination, and physical damage.
The preliminary categories were used solely during sample preparation to ensure representation of a broad range of kernel conditions prior to imaging and were not retained as final dataset labels. Classification into visibly clean, mildly defective, and severely defective groups was based on expert visual judgement rather than predefined quantitative thresholds. In general, mildly defective kernels exhibited limited visible defects, whereas severely defective kernels displayed more pronounced indicators such as extensive discoloration, visible fungal growth, substantial structural damage, insect damage, or kernel deformation. Following image acquisition and dataset annotation, the final released dataset retained only two classes, healthy and unhealthy, to support binary classification and object detection tasks.
Following the preliminary sorting stage, a stratified purposive sampling approach was employed, whereby kernels were intentionally selected from each category to ensure representation across the full spectrum of observable kernel conditions. This approach was adopted to capture variability in visual quality attributes while avoiding over-representation of any single condition. No chemical or physical treatment was applied that could alter the natural appearance of the kernels. The sampled maize kernels were then imaged to create our raw image dataset as explained in the next section.
3.3. Varietal Diversity and Dataset Robustness
The maize samples used in this dataset were sourced from local markets where grains from multiple smallholder farmers are traditionally aggregated. Consequently, the dataset is expected to encompass a diverse range of white maize varieties commonly cultivated in the region, including cultivars such as SC 627, SC 719, UH 615, and Situka M1. Because varietal identifiers were not recorded for individual kernels or images, the exact varietal composition of the dataset cannot be determined. A random sampling approach was therefore maintained to reflect real-world grain handling and trading systems where varietal segregation is rarely practiced.
By incorporating the natural variability in kernel morphology, shape, and surface texture, the dataset encourages machine learning models to prioritize variety-invariant features (such as visible defects and surface irregularities) over inherent varietal traits. Rather than providing a highly controlled laboratory collection, this approach supports the development of models that are more robust to variability encountered in practical agricultural environments.
3.4. Imaging Background
A white background was used during image acquisition to provide high visual contrast and reduce background variability, enabling clearer observation of kernel surface characteristics. This standardized setup allows models to focus on kernel features without interference from complex background patterns. While more complex backgrounds may better reflect real-world conditions, the use of a uniform white background provides a consistent baseline for dataset development and benchmarking. It is acknowledged that this may simplify segmentation compared to field environments, and this should be considered when applying the dataset to more variable conditions.
3.5. Image Acquisition
Imaging was performed using two heterogeneous smartphone sensors, Samsung Galaxy A12 and Samsung Galaxy A54 (Samsung Electronics Co., Ltd., Suwon, Republic of Korea), which introduce variability in hardware characteristics that may support the development of more robust computer vision models. Kernels were imaged against a high-contrast white background to capture critical morphological structures, including the tip cap, embryo, and endosperm. The dataset contains RGB images showing either a single maize kernel or multiple kernels in one image to account for varying instance densities within a single frame. Images were captured at native resolutions (4000 × 3000 and 4080 × 3060 pixels) and stored in .JPG format.
Images were acquired using the native smartphone camera application. Focus was adjusted using tap-to-focus on the kernel region of interest, while exposure and white balance were controlled automatically by the device. Flash was disabled during image acquisition. Photographs were captured remotely using a smartwatch trigger rather than direct interaction with the smartphone. Device-specific acquisition parameters such as ISO values were not recorded.
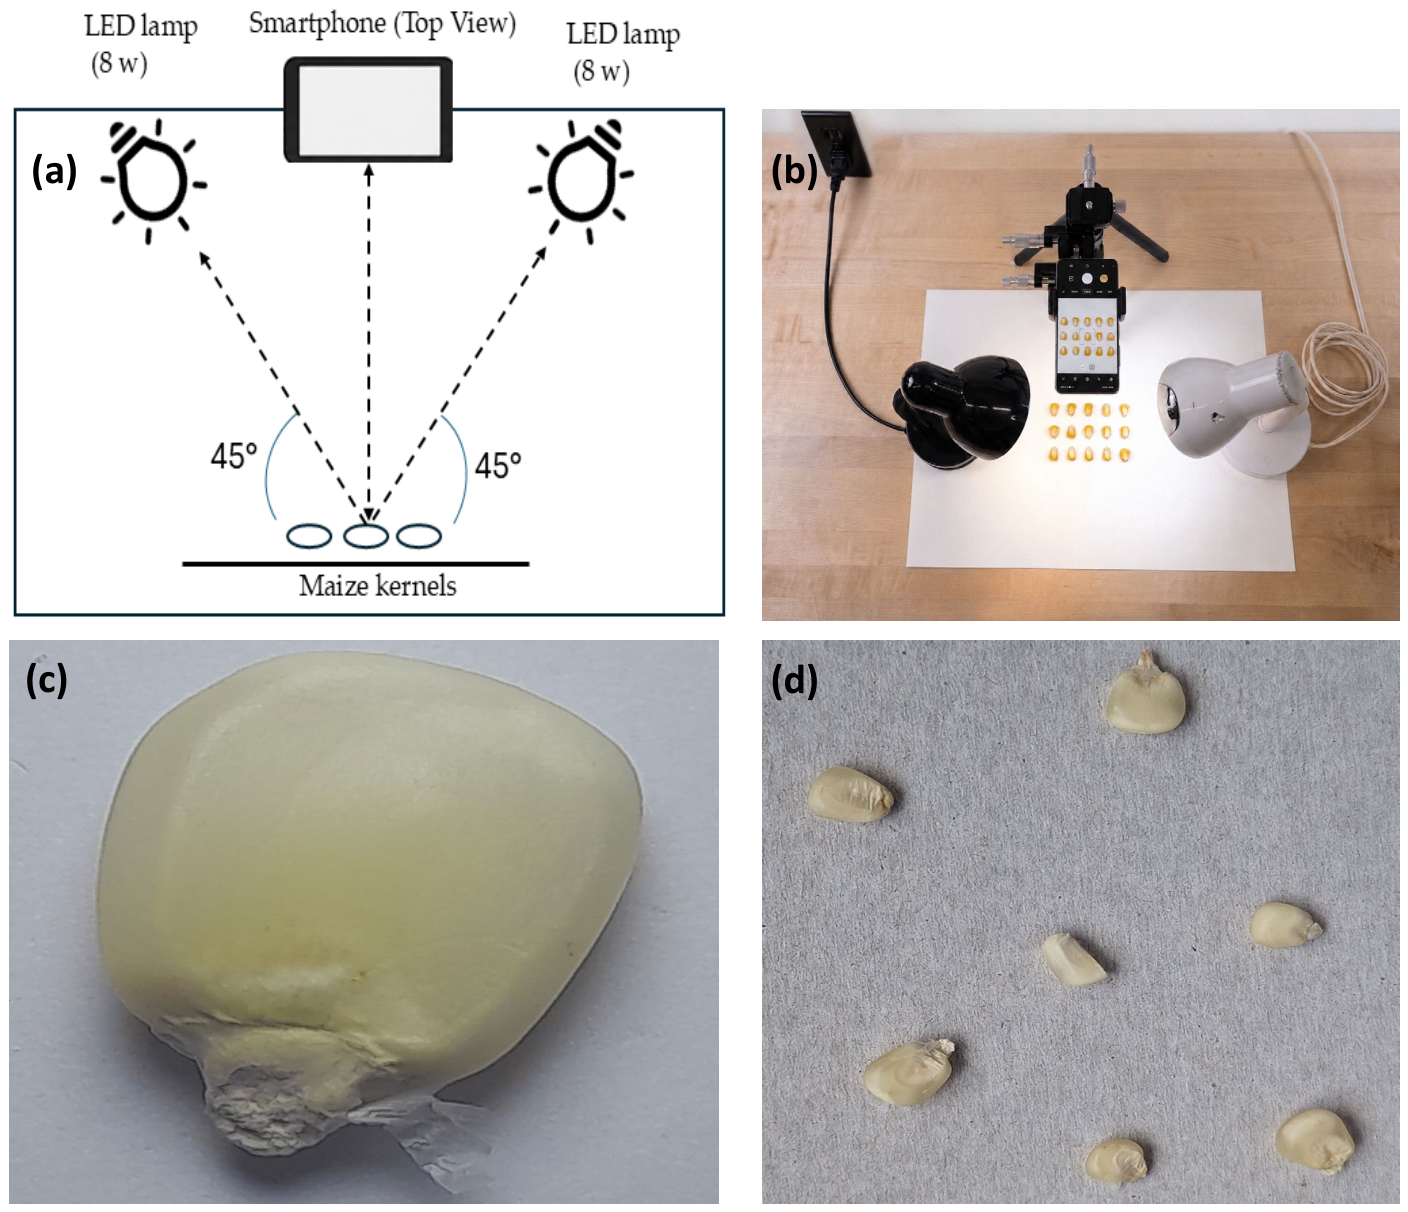
Image acquisition was conducted under semi-controlled conditions designed to reflect practical, field-deployable environments. Illumination was provided by a dual-bulb configuration (8 W, 800 lumens per bulb) positioned approximately 30 cm from the sample surface at an angle of approximately 45°, as illustrated in
Figure 1b, and supplemented by stochastic ambient light, introducing realistic radiometric variation. To simulate real-world acquisition fluctuations, the sensor-to-object distance was varied between 10 and 30 cm. This range intentionally induced variation in Ground Sampling Distance (GSD), ensuring that the dataset captures kernels at multiple scales.
3.6. Image Storage
While lossless image formats such as TIFF and PNG can better preserve fine texture details, images were stored in JPG format to reflect acquisition conditions typical of commodity hardware (e.g., mobile devices) used in field-level grain assessment. This choice supports the development of models that are robust to compression artifacts and image quality variations commonly encountered in real-world deployment scenarios. Although JPG compression may introduce minor loss of fine detail, the image resolution and quality are sufficient to preserve visible surface features relevant for kernel classification.
3.7. Image Dataset Processing
All images were annotated using the Computer Vision Annotation Tool (CVAT, v2.7.6). Bounding boxes were drawn around each visible kernel as an instance and each instance was assigned a binary class label as shown in
Table 1. Annotations were exported in YOLO format, as described in
Section 2.
To ensure reproducibility and minimize subjectivity, kernel labelling was guided by a set of predefined visual criteria established in consultation with domain experts prior to annotation. These criteria were applied at the annotation stage and included (i) surface discoloration (e.g., dark spots or patches visible on the kernel), (ii) visible fungal growth, (iii) structural damage such as cracks or breakage, (iv) insect damage (e.g., holes or feeding marks), and (v) kernel deformation (e.g., shriveling). A kernel was labelled as unhealthy if at least one of these features was present; otherwise, it was labelled as healthy.
Annotation was conducted using a consensus-based expert review approach involving two trained specialists in mycotoxin-related grain quality assessment from NM-AIST. Each image was jointly examined, and labelling decisions were made through agreement based on the predefined criteria. In cases of ambiguity, both experts reviewed the sample together until a consensus was reached. Consequently, both experts participated in the review of all annotated samples rather than only ambiguous cases. Bounding boxes and class assignments were visually verified during the annotation process as part of the consensus-based review. As a result of this consensus-based approach, inter-annotator agreement metrics such as Cohen’s Kappa were not computed, since final labels were assigned through a single agreed-upon decision rather than independent annotations. While the consensus-based approach helped maintain labelling consistency, it may also introduce shared expert bias by favoring a common interpretation of kernel condition, particularly in borderline cases.
No separate independent post-annotation expert audit was performed because quality verification occurred during the consensus-based annotation process. However, following annotation export, post-processing was conducted to identify and correct inconsistencies, remove problematic annotation files, and exclude distorted images where necessary.
Post-processing was performed using Python 3.10.15 with the OpenCV library (v4.12.0) to curate the exported annotations and further improve dataset quality. This process included (i) removal of empty annotation files, (ii) correction or exclusion of incorrectly labelled images, and (iii) removal of distorted images (e.g., blurred images). Given that most dataset curation occurred during the annotation stage, post-processing resulted in the removal of only five images with multiple maize kernels, representing 0.1% of the image dataset. The final dataset consists of 5143 validated images and their corresponding annotation files suitable for computer vision-based analysis.
4. Preliminary Technical Validation
To demonstrate the usability of the dataset for computer vision applications, preliminary object detection experiments were conducted during dataset development using three YOLO-family object detection models: YOLOv8n, YOLOv10n, YOLOv11n. These experiments were performed on a pre-release version of the dataset prior to the final curation process. Consequently, the reported results should be interpreted as indicative validation of dataset usability rather than as benchmark performance for the final released dataset.
Table 4 summarizes the detection performance achieved by the evaluated models. Performance was assessed using standard object detection metrics, including precision, recall, mean Average Precision at an Intersection-over-Union threshold of 0.5 (mAP@0.5), and mean Average Precision at an Intersection-over-Union threshold from 0.5 to 0.95 (mAP@0.5:0.95).
All three models achieved high detection performance, indicating that the dataset is suitable for modern object detection workflows. Among the evaluated architectures, YOLOv11n achieved the highest overall performance, attaining a precision of 0.884, recall of 0.917, mAP@0.5 of 0.954, and mAP@0.5:0.95 of 0.892. These results provide an initial reference point for future benchmarking studies.
5. User Notes
To maximize the utility of this dataset for maize kernel mycotoxin risk assessment and other quality assessments, users should consider how the dataset is organized, formatted, and annotated for machine learning use (technical structure) and the conditions under which it was collected. This dataset is designed primarily for supervised computer vision tasks, particularly object detection and classification using instance-level annotations. It is directly compatible with modern detection frameworks such as YOLO-based architectures and can be readily adapted for use with alternative models (e.g., Faster R-CNN (Regional-based Convolution Neural Network) or SSD (Single Shot Detector)) through conversion of normalized annotation coordinates.
The dataset includes images captured at varying sensor-to-object distances resulting in non-uniform ground sampling distances (GSDs) and scale variation across samples. This variability reflects practical acquisition conditions and should be addressed during model development. Users are encouraged to implement multi-scale training strategies and standardized image resizing (e.g., 640 × 640 or 1024 × 1024), while preserving fine-grained texture information that is essential for detecting subtle defects such as fungal colonization and other kernel defects.
All annotations were finalized through a consensus-based expert review process, providing a high-confidence ground truth [
10]. However, users should note that the ‘unhealthy’ class represents visually observable indicators associated with contamination risk rather than direct biochemical measurements of mycotoxin presence. As such, models trained on this dataset should be interpreted as risk-screening tools, and recall-oriented optimization is recommended in food safety applications to minimize false negatives.
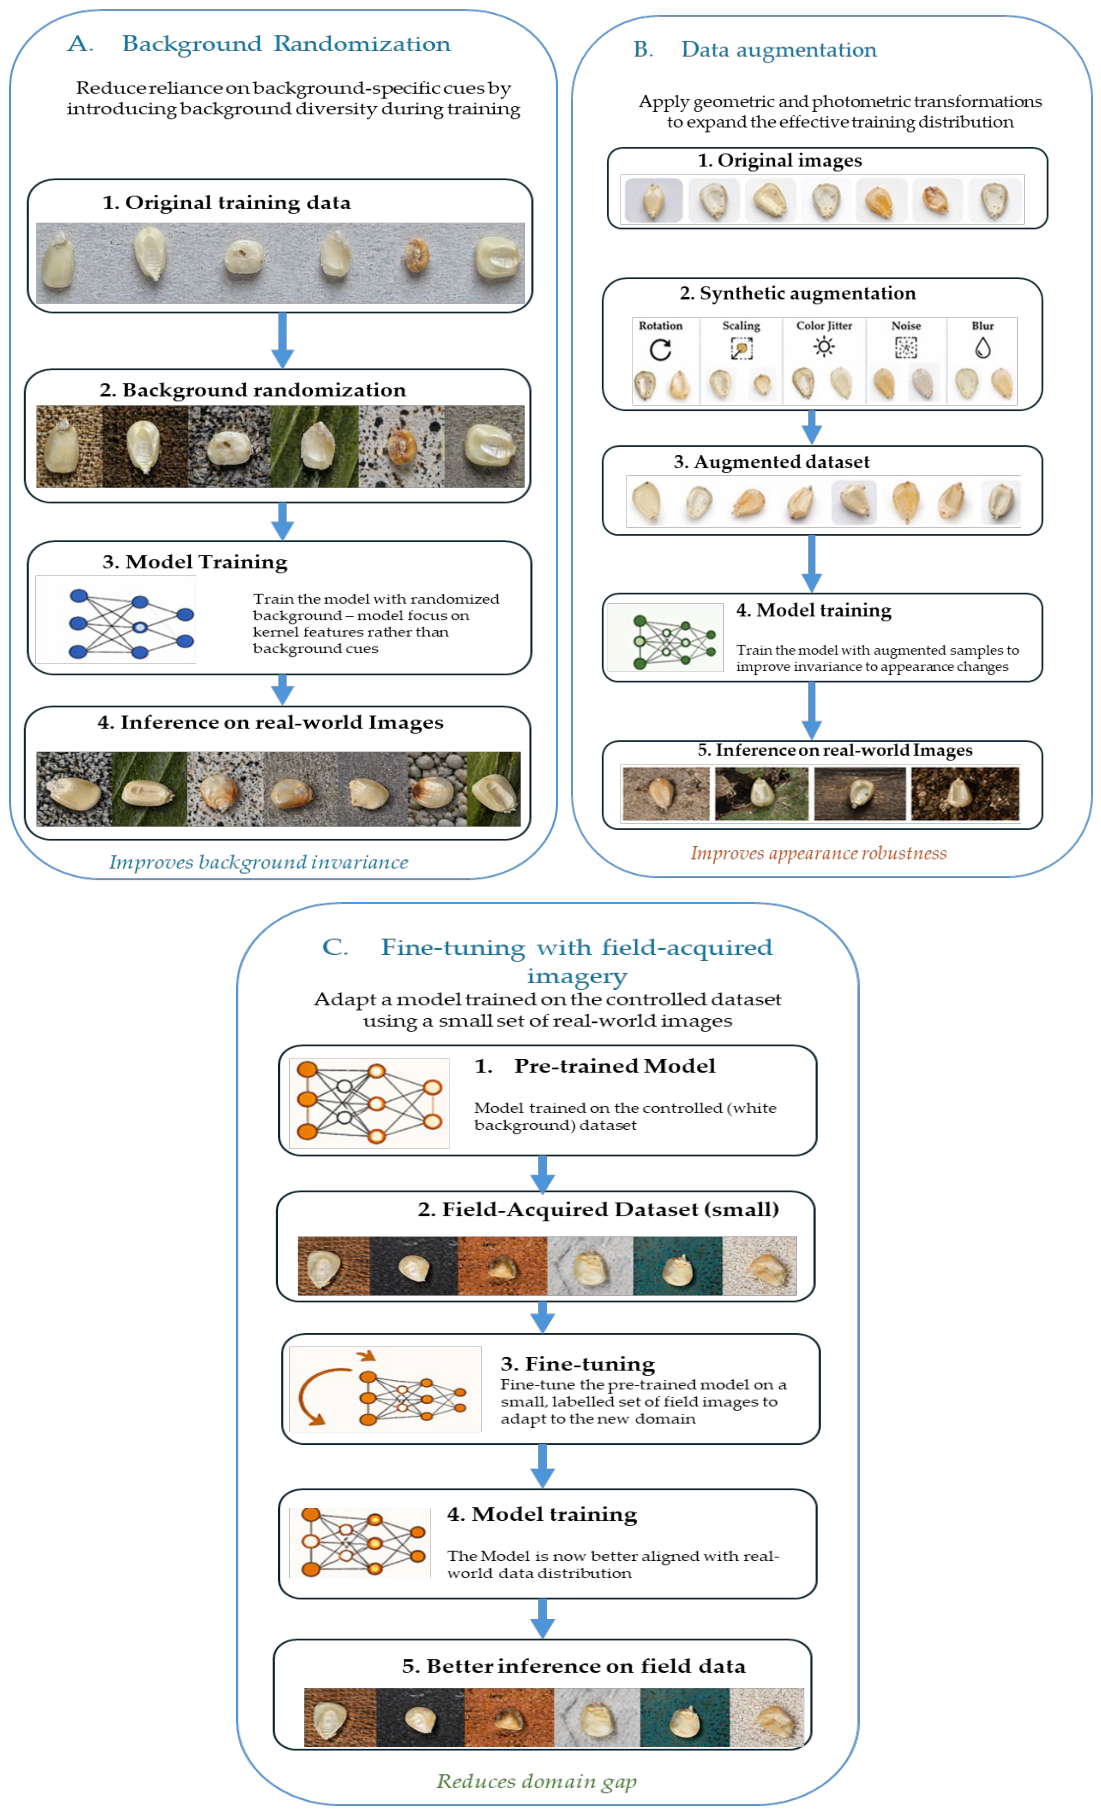
The dataset was acquired under semi-controlled conditions using commodity smartphone devices, introducing moderate variability in illumination, shadowing, and kernel orientation. A uniform white background was used to standardize contrast and simplify segmentation; however, this also introduces a controlled bias that may limit direct generalization to complex real-world environments. For deployment in practical settings (e.g., markets or storage facilities with complex backgrounds), users should consider domain adaptation strategies such as background randomization, data augmentation, or fine-tuning with field-acquired imagery. Further details on these strategies for addressing domain shift and enabling real-world deployment are provided in
Figure 2.
From a sampling perspective, maize kernels were sourced from local open markets where grains from multiple smallholder producers are aggregated and may have undergone informal manual sorting prior to sale. Consequently, the dataset may under-represent severely defective kernels while capturing a higher proportion of borderline or visually ambiguous cases. This characteristic enhances its value for developing high-sensitivity detection systems targeting subtle defects that are often missed during manual inspection. However, users should exercise caution when applying models trained on this dataset to unsorted, field-level grain samples or early post-harvest conditions, where defect prevalence and characteristics may differ.
Users should also consider the geographical and environmental specificity of the dataset. All samples were collected from the Arusha region of Tanzania and therefore may not fully represent the range of environmental stressors, storage conditions, or fungal expression patterns observed in other agro-ecological zones. Additionally, because the grains were sourced from open markets rather than controlled storage systems, the precise age of the kernels and their exposure history to moisture, pests, or storage conditions were not recorded. This may limit the applicability of the dataset for studies requiring controlled temporal or storage-based analysis.
The dataset includes a mixture of maize varieties typical of the region. While diversity supports the development of models that are robust to varietal differences, it may limit suitability for applications requiring precise varietal classification or genetic-level discrimination.
Finally, while kernel annotations are provided at the instance level, the dataset reflects aggregated sampling and shared acquisition conditions, which may introduce latent correlations across samples. This should be considered when performing statistical analyses or evaluating model generalizability across independent datasets.
Together, these approaches support deployment-ready computer vision models for grain quality assessment. Overall, the dataset provides a practical and deployment-oriented benchmark for developing robust computer vision models in grain quality assessment, particularly in resource-constrained and heterogeneous agricultural environments.