5.1. Construction of the Contingency Matrix
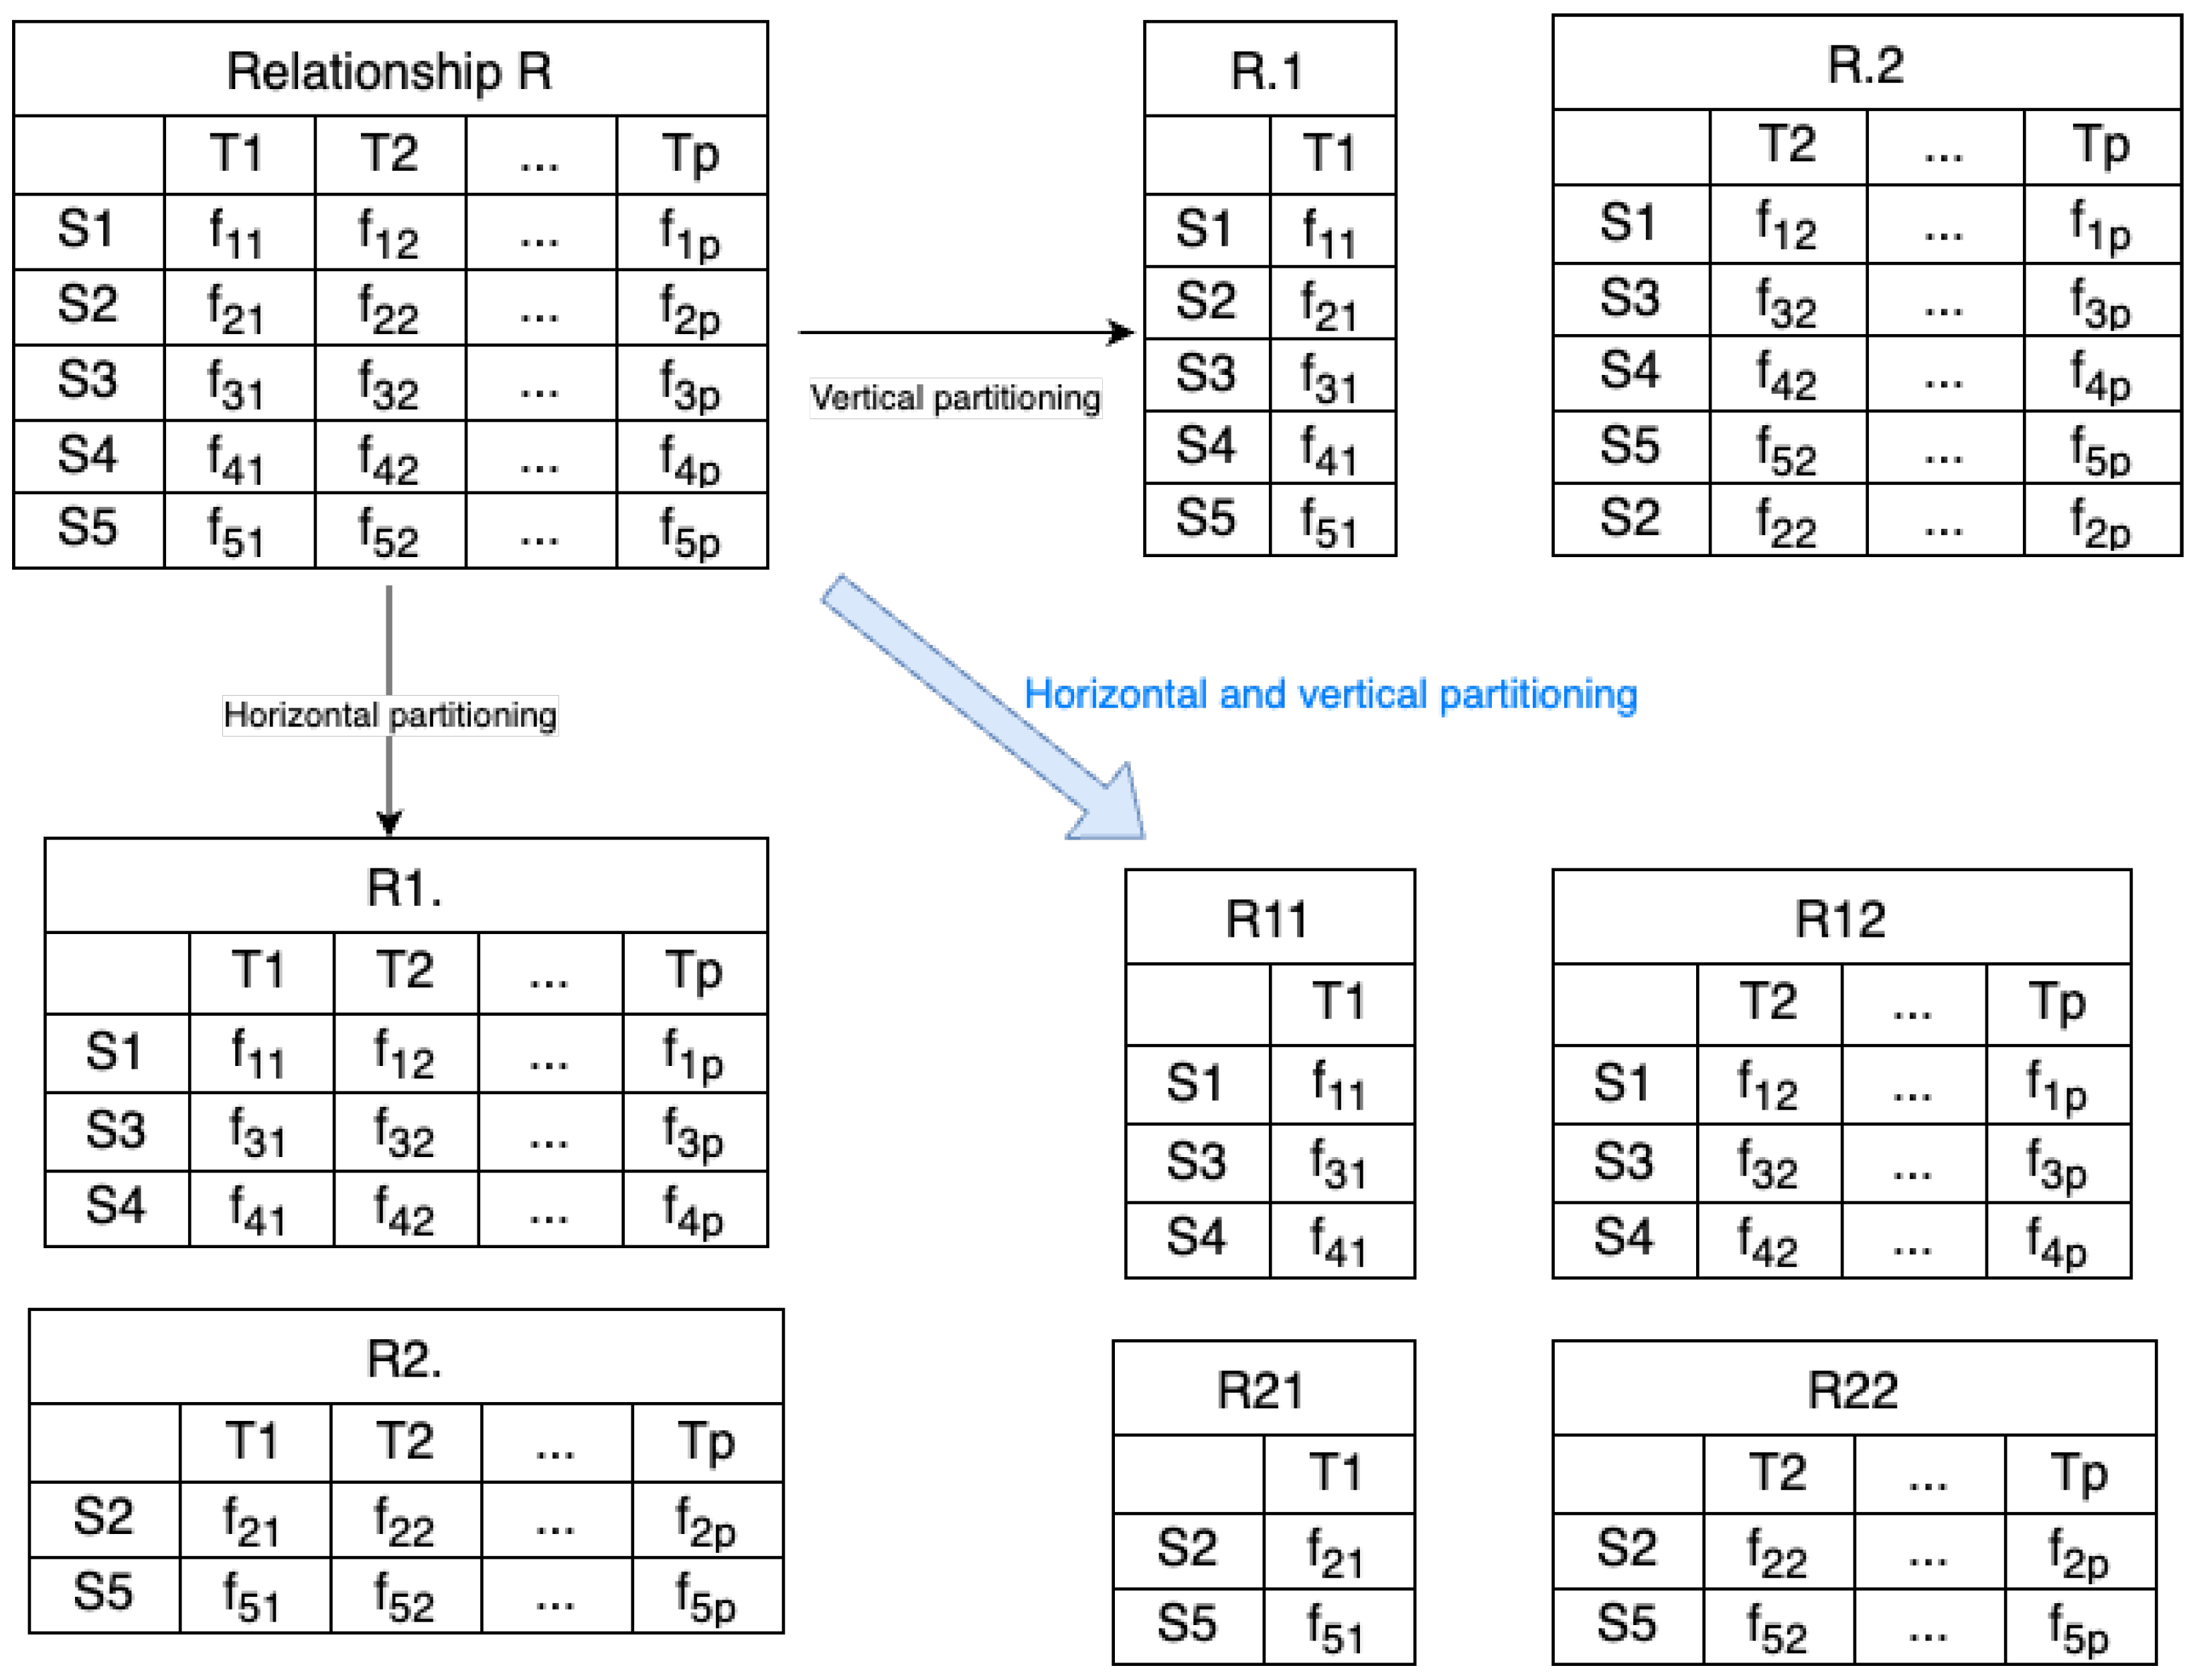
Each semantic class acts as a container for metadata relating to data sources that have semantic affinities with that class. In practical terms, each semantic class manages a contingency matrix that ensures correspondence between I, the set of data sources, and J, the set of relevant terms related to the semantic domain. The contingency matrix represents occurrence frequency of extracted term in data source with and .
Managing the contingency matrix presents enormous challenges given its size and the dispersion of its data. To overcome this obstacle, we propose using multidimensional data analysis to subdivide each semantic class into smaller, specialized subclasses. This results in increased scalability and a significant reduction in complexity. In this article, we opted for the use of factor analysis. This is a statistical method used to reduce the dimensionality of data and identify underlying factors that explain the correlations between variables. This method is applied in several fields, including marketing, psychology, social sciences, scientific research, and complex data analysis, etc. We propose the following inputs for the factor analysis method:
A scatter plot . Each data source is associated with the vector defined by with represents the frequency of the term in the data source and represents the frequency of in the entire population.
A weight assigned to point . We associate the weight with the point
A metric that calculates the similarity between points
. We use the distance
defined by:
For Output:
The axis of maximum elongation of the scatter plot corresponds to the first eigenvector corresponding to the largest eigenvalue of the matrix of inertia where X is the matrix of initial data centered by the centroid G, and M is the diagonal matrix of weight.
Factorial analysis consists of finding axes of inertia and projecting points onto the first factorial plane formed by the first two eigenvectors.
A set of decision-making indicators are being considered in order to assess the quality of the analysis performed.
5.2. Illustrative Example of the Meta Skills Semantic Class
This study adopts a qualitative-analytical research design grounded in documentary analysis and thematic synthesis. To illustrate and explain our proposals, we chose
Meta Skills as a semantic class. We selected 18 relevant, representative, reliable, accessible and heterogeneous data sources (see
Table A1) covering the chosen semantic class and considered the following relevant candidate keywords: Knowledge K, Memory M, Problem-solving PS, Metacognition MC, Self-control SC, Empathy E, Cooperation CO, Emotional intelligence EI, Communication Com, Teamwork TW, Adaptability A, Leadership L, Digital literacy DL, Creativity CR, Critical thinking CT, Collaboration CL, Cultural awareness CA, Innovation I. This targeted selection allows us to demonstrate the feasibility and consistency of the proposed methodological workflow within a controlled framework. The construction of the contingency matrix is based on a semi-structured annotation process that combines an initial phase of automatic keyword extraction and automatic calculation of keyword occurrence frequencies within the selected data sources, followed by validation by three experts who narrow the analysis down to the relevant keywords identified and carry out annotation in accordance with specific guidelines. Likert-scale scores from 0 to 5 (0-Not relevant at all, 1-Almost relevant, 2-Not very relevant, 3-Moderately relevant, 4-Fairly relevant, 5-Highly relevant) reflect both frequency and contextual relevance of terms within each source (see
Table 2). To ensure consistency and limit subjectivity, a unified annotation guideline was applied throughout the process. Scoring rules were defined prior to analysis, and ambiguous cases were resolved through cross-validation against predefined criteria. The guideline clearly defines the verbal anchors and keyword’s thematic relevance within a data source for each Likert scale value from 0 to 5:
5—Highly relevant: a central, recurring keyword that is essential for summarising the main theme of the data source.
4—Fairly relevant: an important keyword, closely related to the topic, but not entirely central.
3—Moderately relevant: a keyword related to the topic, but not essential; could be removed without losing the main point.
2—Not very relevant: a peripheral keyword, mentioned once or twice, with no strong link to the core of the data source.
1—Almost relevant: a marginal keyword; the annotator is unsure, but perceives a very weak link.
0—Not relevant at all: keyword not related to the topic, off-topic, or clearly irrelevant here.
The annotation process involved three domain experts. Although a formal inter-annotator agreement coefficient (e.g., Cohen’s or Fleiss’ kappa) was not computed, consistency was ensured through an iterative consensus-based validation process. Discrepancies were discussed and resolved collectively. This represents a limitation and will be addressed in future work through formal agreement metrics. The annotation procedure was designed to ensure coherence across expert judgments while preserving the exploratory nature of the analysis.
IBM SPSS Statistics 23 is the software chosen to perform the simulation with the following parameters (Method: Correlation matrix; Extraction Method: Principal Component Analysis; Rotation Method: Varimax with Kaiser Normalization; number of extracted factors: 2; maximum number of iterations: 25). Principal Component Analysis (PCA) is used in this study as an exploratory descriptive technique, without any claim of construct validation or latent structure confirmation.
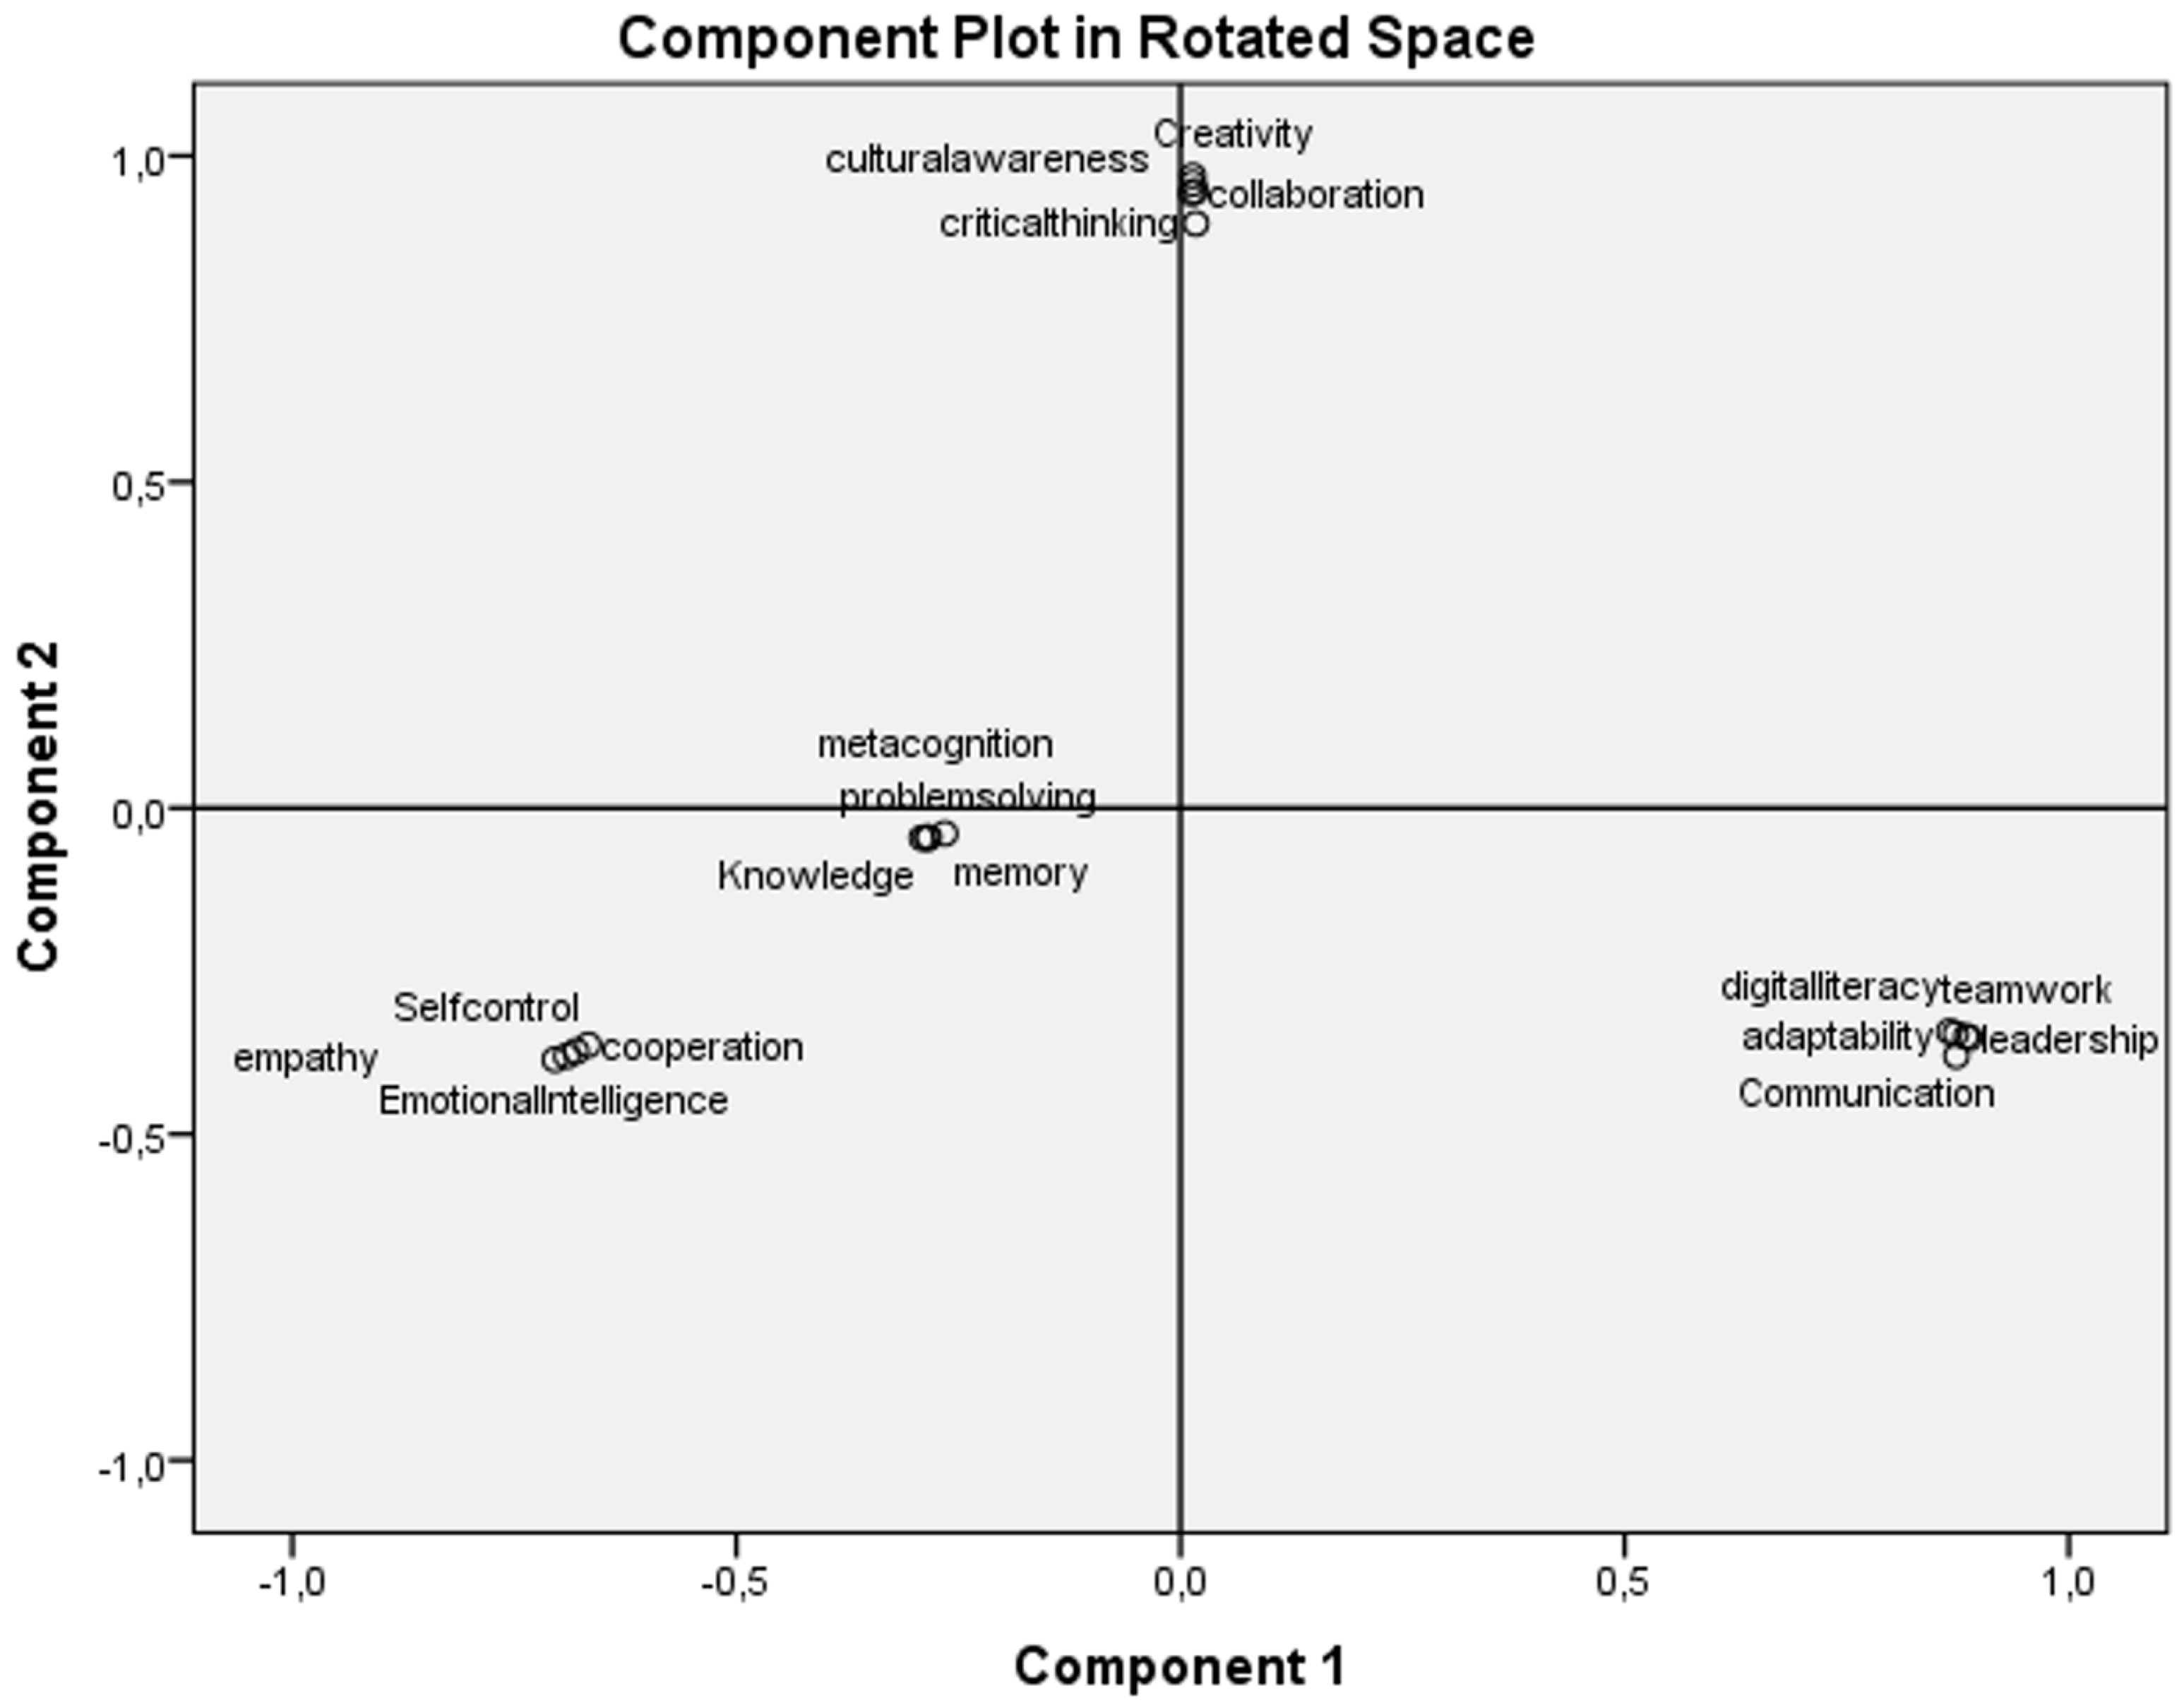
The projection of points-columns onto the first factorial plane formed by the first two eigenvectors (see
Figure 9) corresponding to the first two retained components of the dual analysis of the correspondence matrix between data sources and relevant keywords makes it possible to detect four sub-classes of the main semantic class
Meta Skills:
Cognitive Skills (Knowledge K, Memory M, Problem-solving PS and Metacognition MC),
Social Skills (Self-control SC, Empathy E, Cooperation CO and Emotional intelligence EI),
Professional Skills (Communication Com, Teamwork TW, Adaptability A, Leadership L and Digital literacy DL) and
Cultural Skills (Creativity CR, Critical thinking CT, Collaboration CL, Cultural awareness CA and Innovation I) (see
Table 3).
The projection of points-rows onto the first factorial plane formed by the first two eigenvectors corresponding to the first two retained components of the direct analysis of the correspondence matrix between data sources and relevant keywords makes it possible to detect the presence of semantic clusters. Each cluster, characterized by strong internal cohesion and weak external coupling, contains data sources that exhibit a high degree of similarity and are close in terms of chi-squared distance ()
The main advantage of factor analysis is that it offers the possibility of superimposing the two projections relating to scatter plot of points-rows and scatter plot of points-columns in a lower dimension space, in our case the first factorial plane of dimension 2. The dual scatter plot corresponding to points-columns is constituted by with and has vector as its barycenter.
In direct analysis operating on the scatter plot , the first eigenvector (axis of maximum elongation of the scatter plot) explains most of the total inertia. The axes of inertia in are indexed by . It is important to note that the inertia explained by the -axis is identical in direct analysis operating on data sources and dual analysis operating on keywords. In addition, the eigenvectors are orthogonal in space, whether in direct or dual analysis; this means that the cumulative percentage of total inertia explained by the first two eigenvectors in both analyses is equal to .
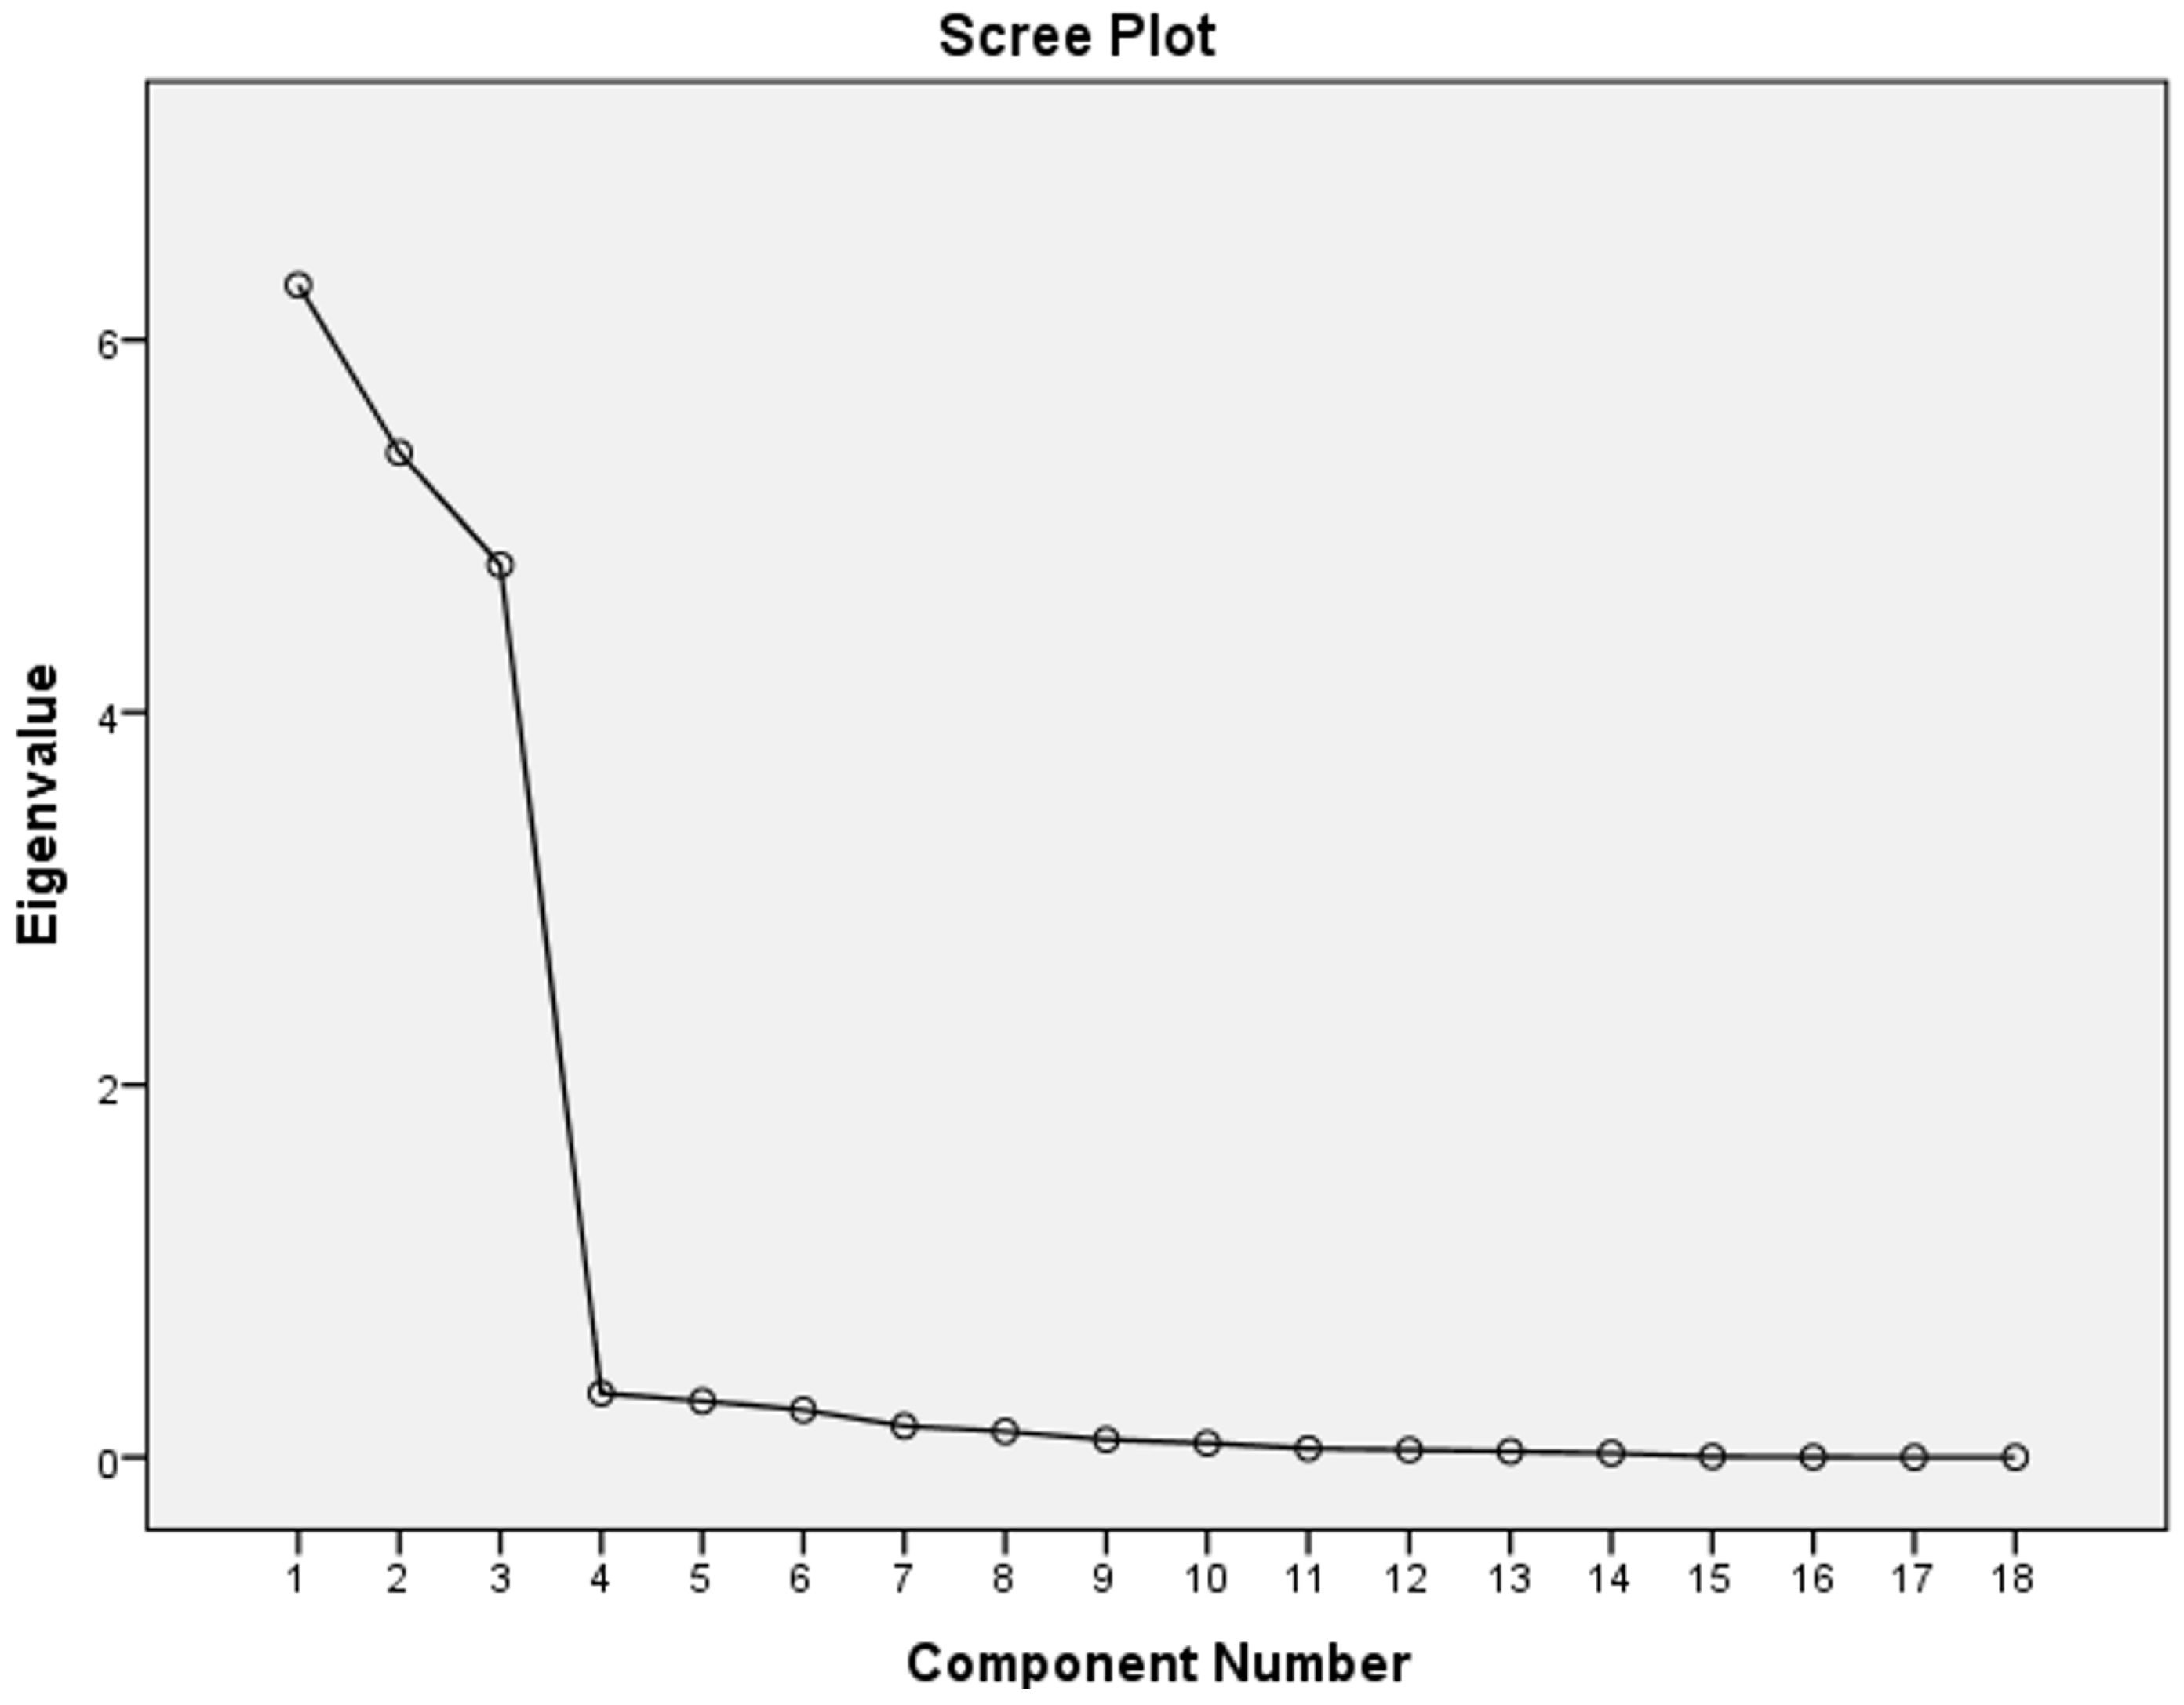
The quality of the analysis can be assessed using the eigenvalue histogram. This quality depends on the percentage of inertia explained by the first two eigenvectors
. A factor analysis is generally considered acceptable when the selected factors explain the majority of the total variance. The first two retained components explain 64,939 per cent of the total variance. This level is interpreted as moderate in the context of exploratory PCA and should not be considered a benchmark of model adequacy (see
Figure 10).
Cronbach’s alpha measures the internal consistency of a cluster comprising a group of items intended to reflect the same latent construct. An alpha value close to 1 indicates that the items within the cluster are consistent with one another. A high alpha value suggests that the cluster in question is relatively well-defined and can be treated as a reliable scale (see
Table 4).
The obtained Cronbach’s alpha values (>0.96) provide preliminary evidence of internal consistency and cluster coherence, although they should not be interpreted as definitive psychometric validation given the limited number of items per group and the diagonal block structure of the contingency matrix.
We denote
coordinate of
on the axis
of
and
coordinate of
on the axis
of
. There are Relationship transitions between
and
:
The objective of simultaneous projections of scatter plot of data sources
and dual scatter plot of keywords
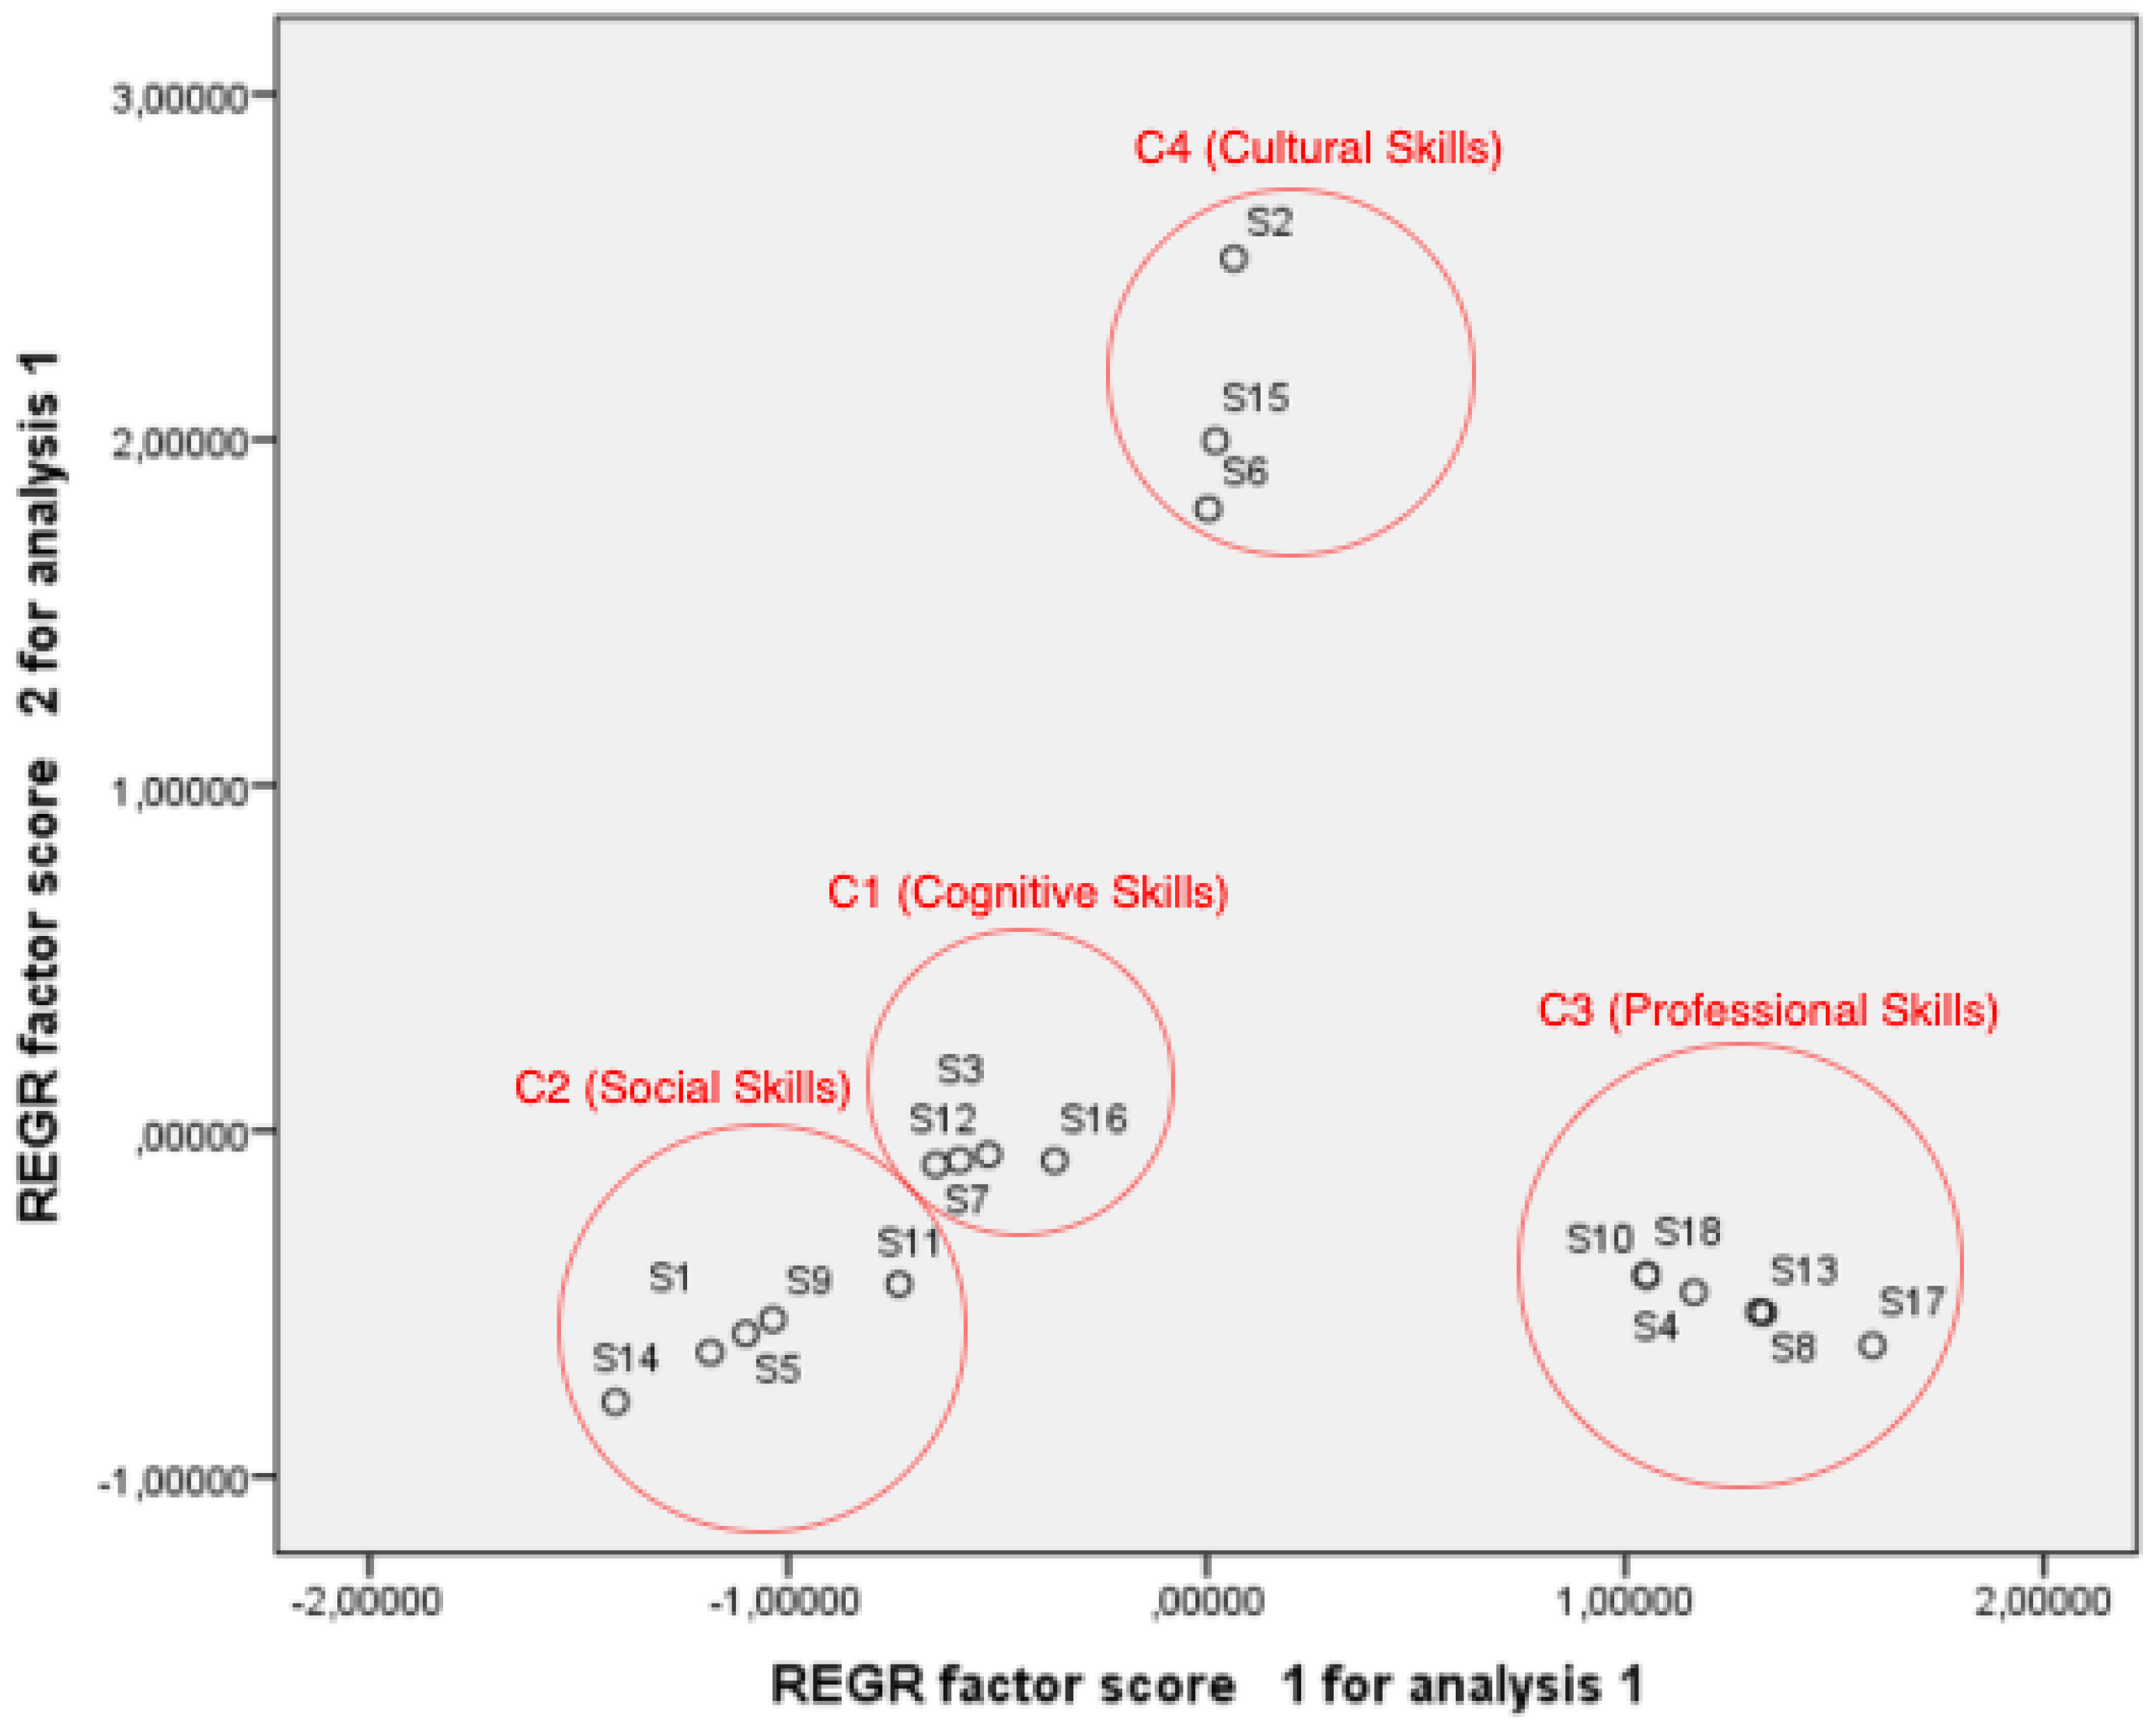
on the first factorial plane is to highlight latent correspondences, detect affinities between vectors and identify the hidden variables responsible for some affinities. The proximity between two points-rows (such as data sources S3, S7, S12 and S16) reflects a similar keywords profile. On the other hand, the proximity between two points-columns (such as keywords: Knowledge K, Memory M, Problem-solving PS and Metacognition MC) reflects a similar profile of data sources. This can be exploited to perform an efficient search for relevant data sources close to the keywords used in this search. We can note that the data sources S3, S7, S12 and S16 rather cover the area of
Cognitive Skills (see
Figure 11) while the data sources S1, S5, S9, S11 and S14 tend to cover the area of
Social Skills. In addition, the data sources S4, S8, S10, S13, S17 and S18 cover the area of
Professional Skills while the data sources S2, S6 and S15 focus on the field of
Cultural Skills (see
Table 5).
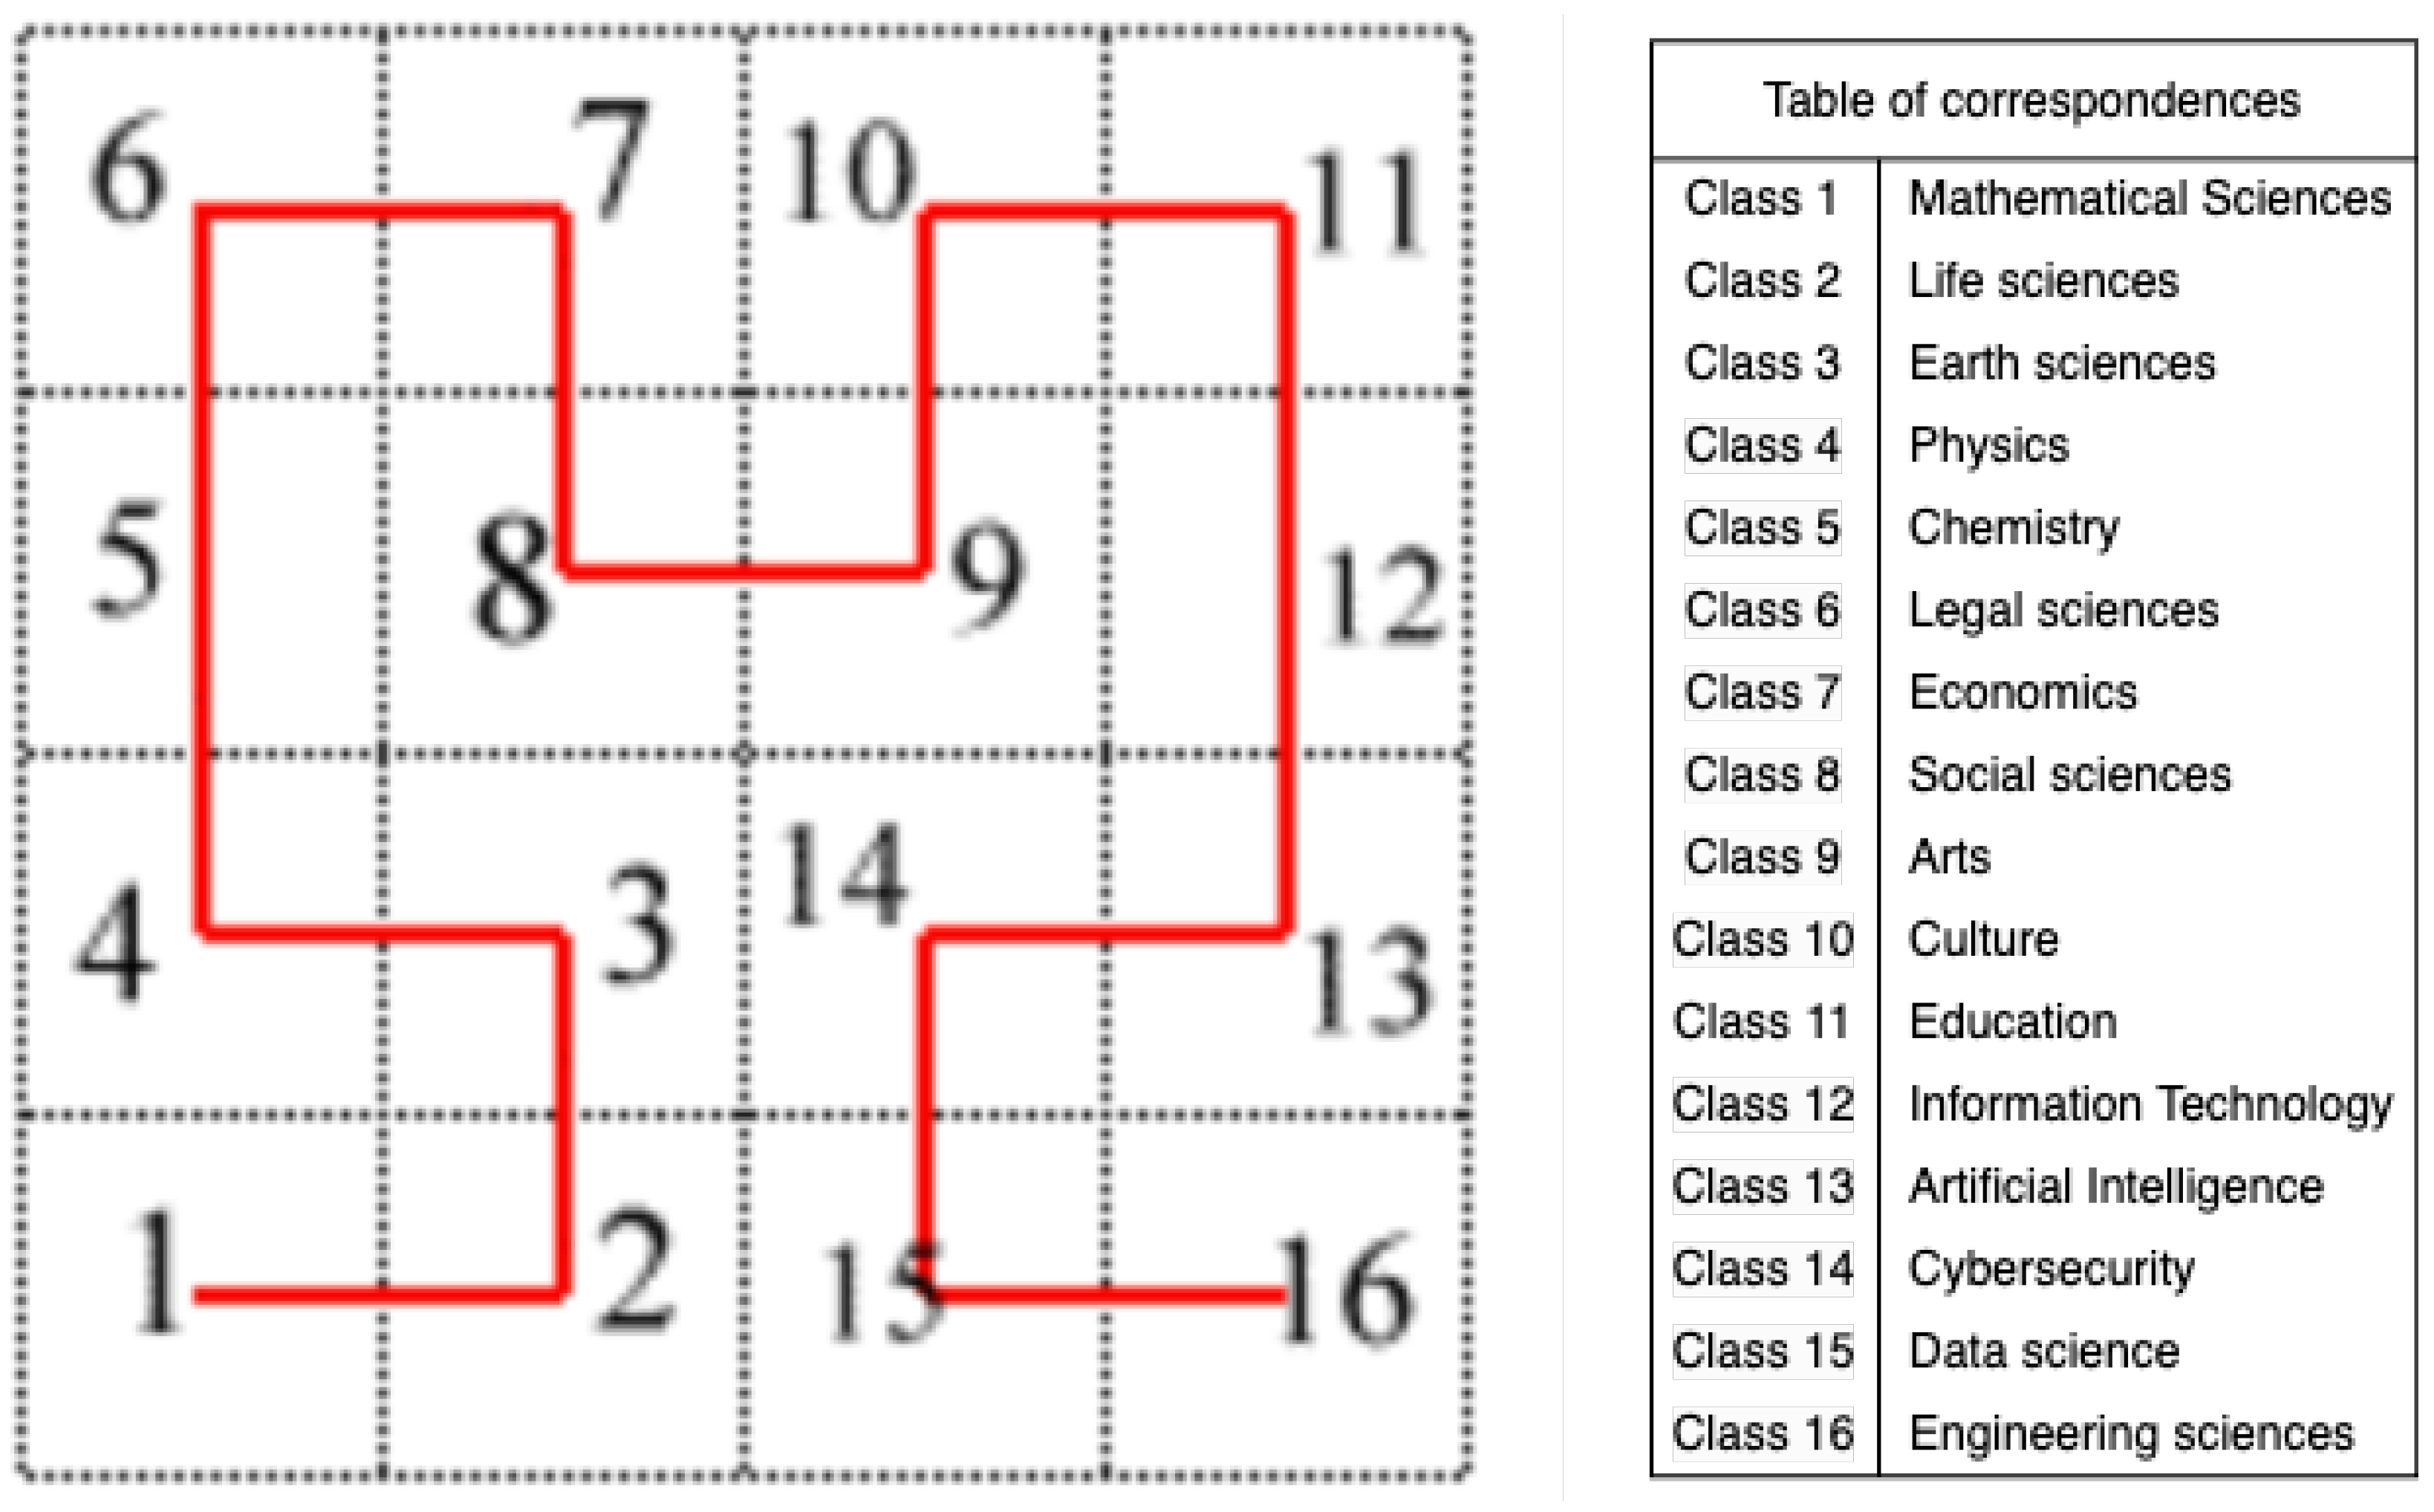
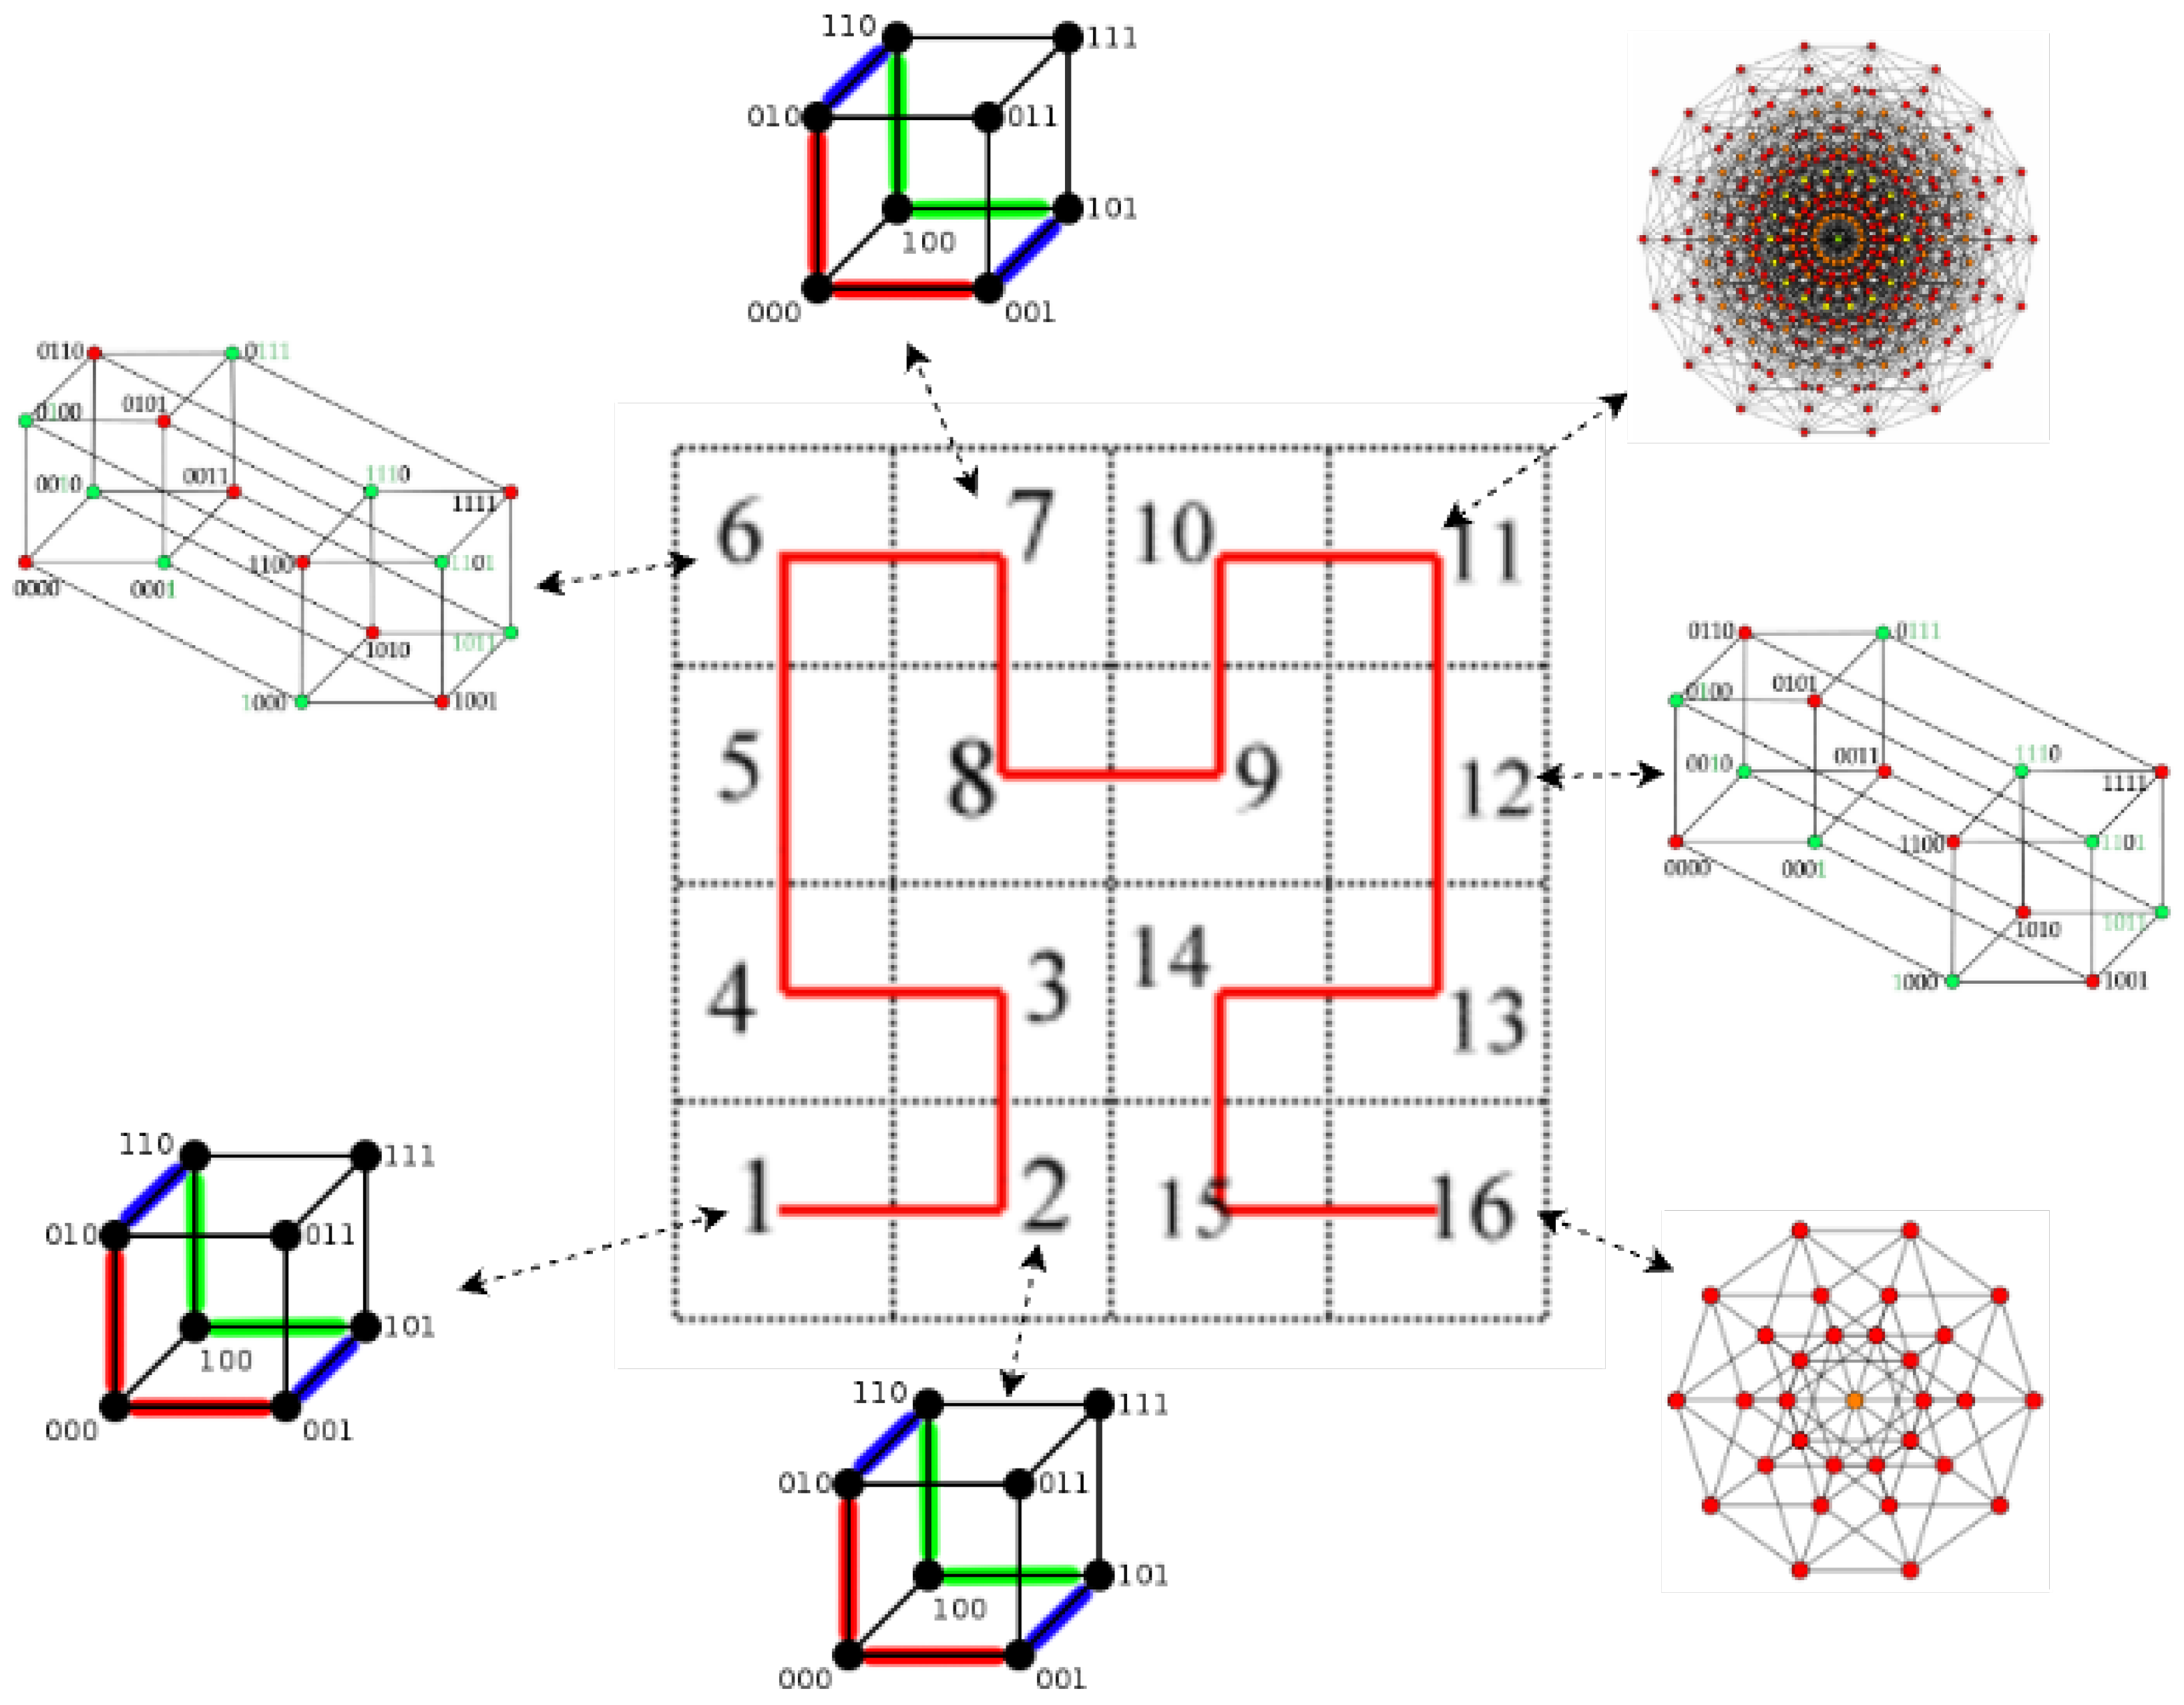
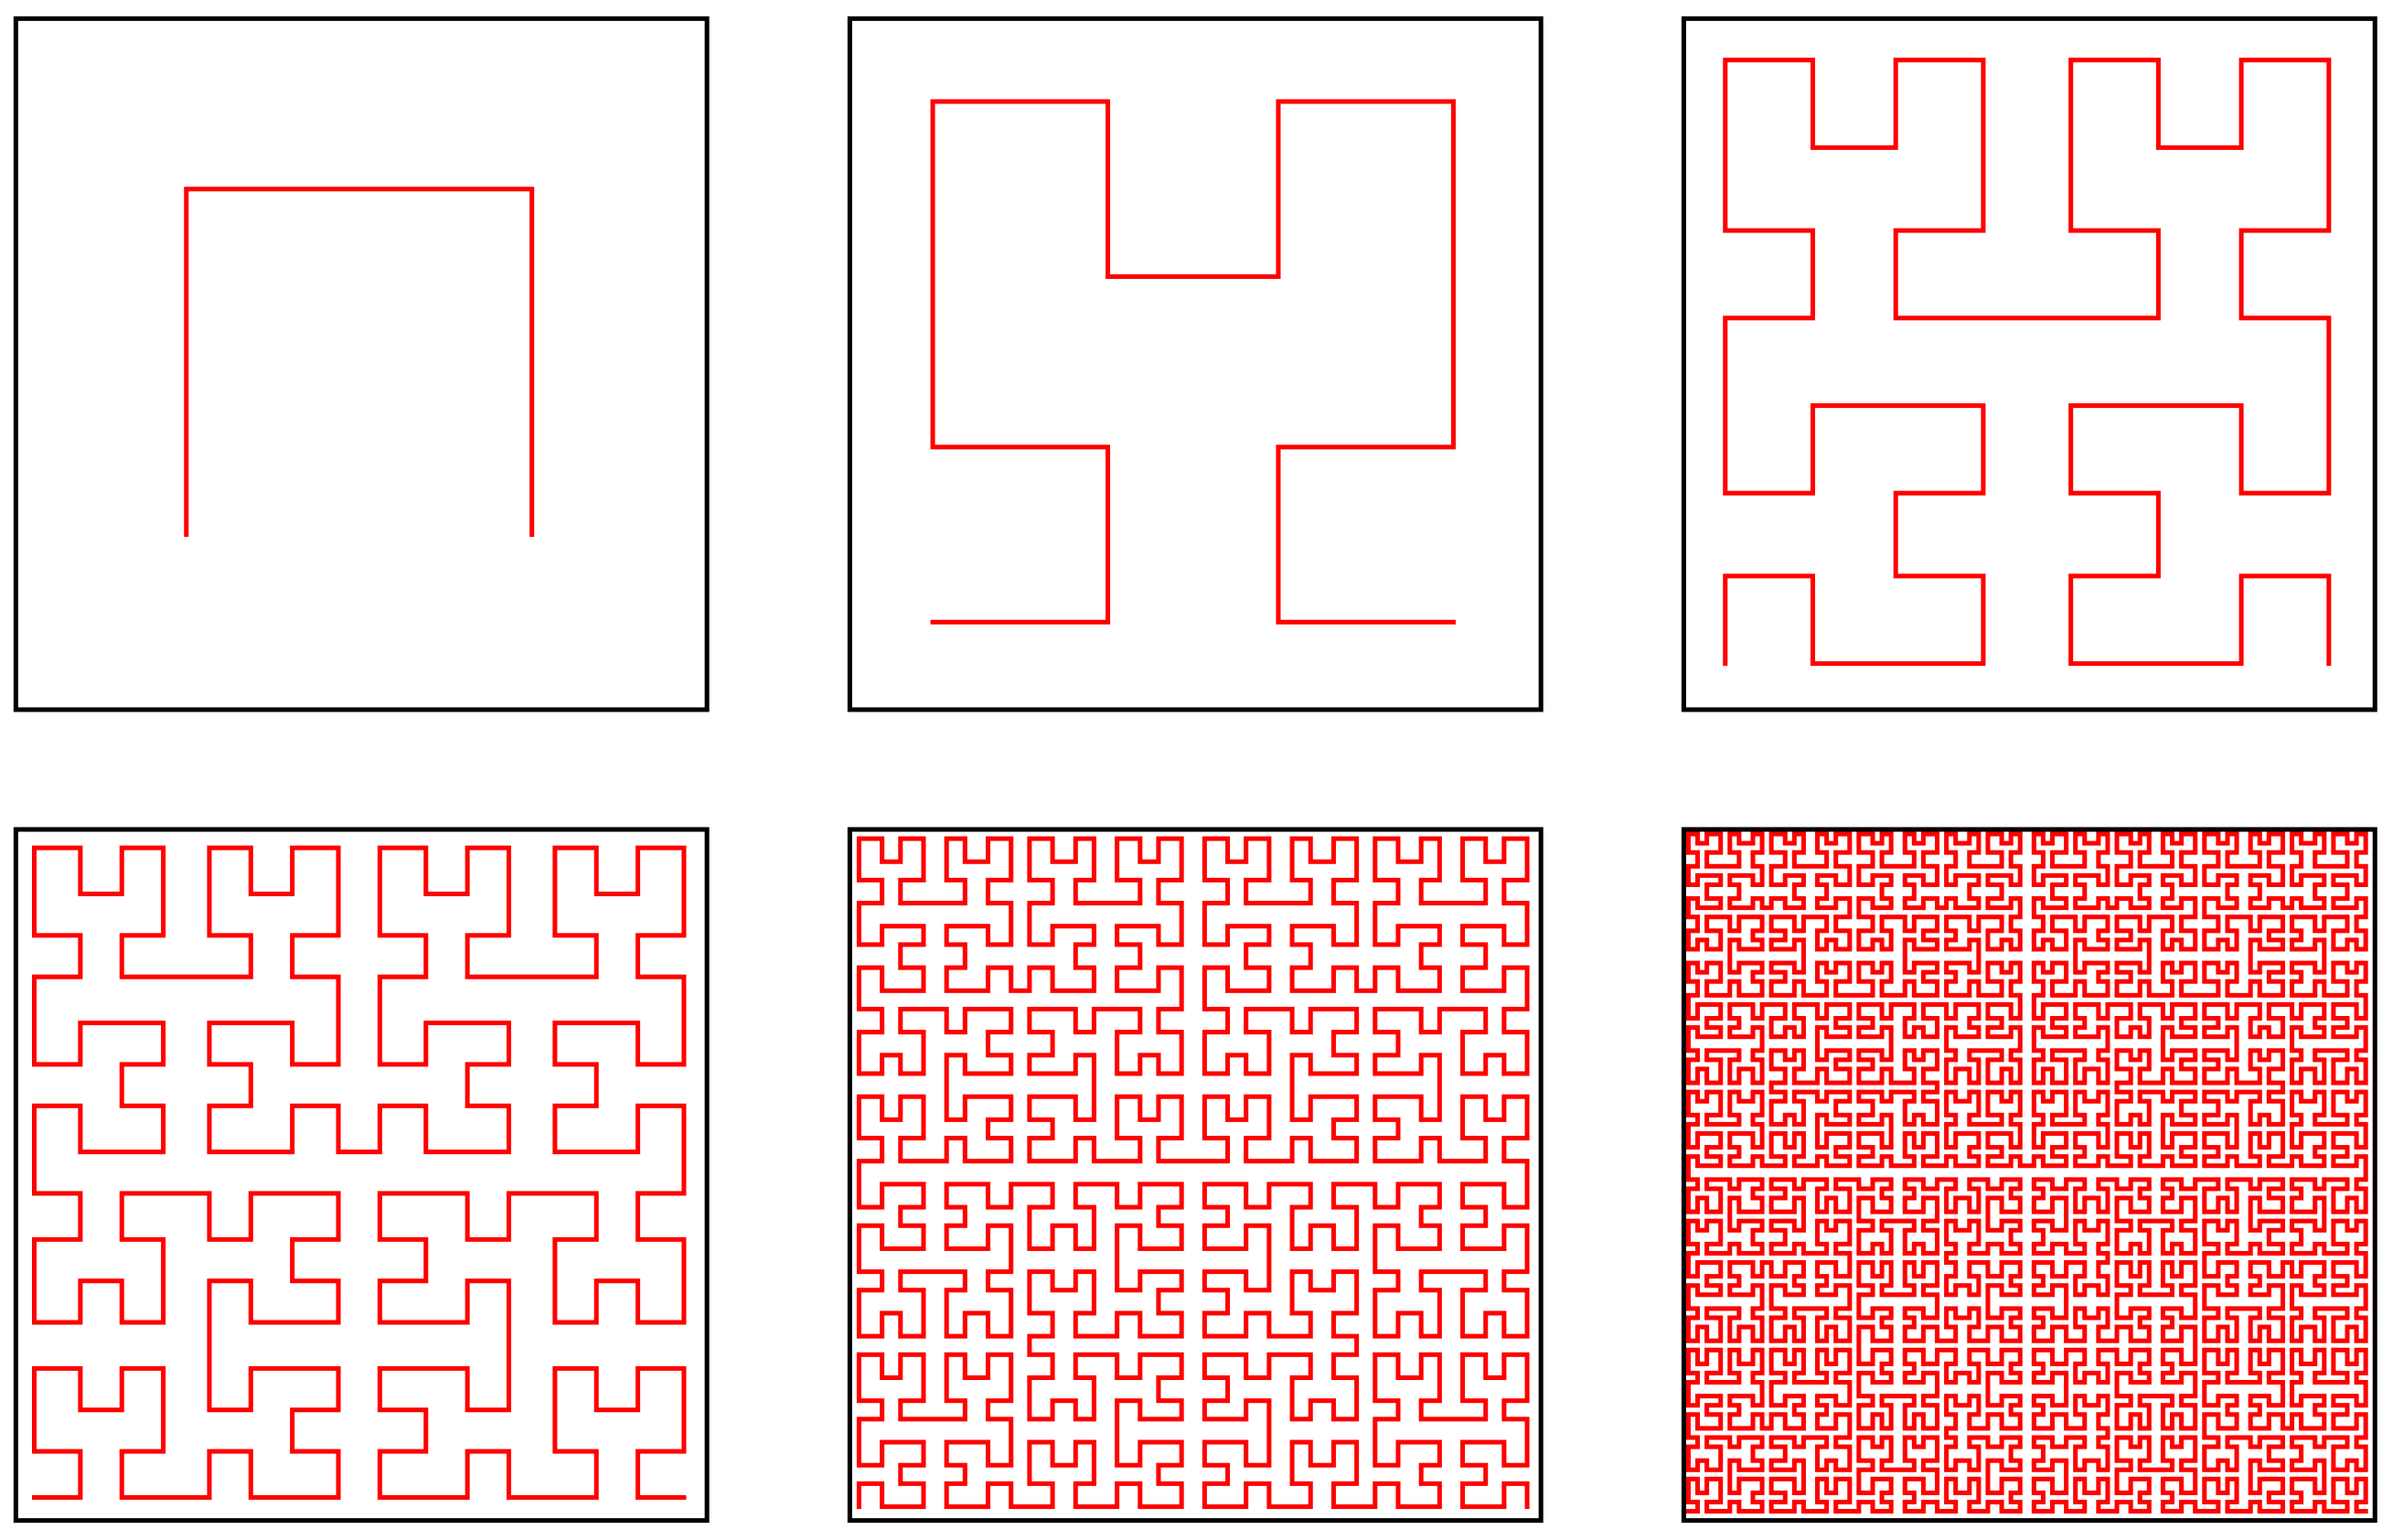
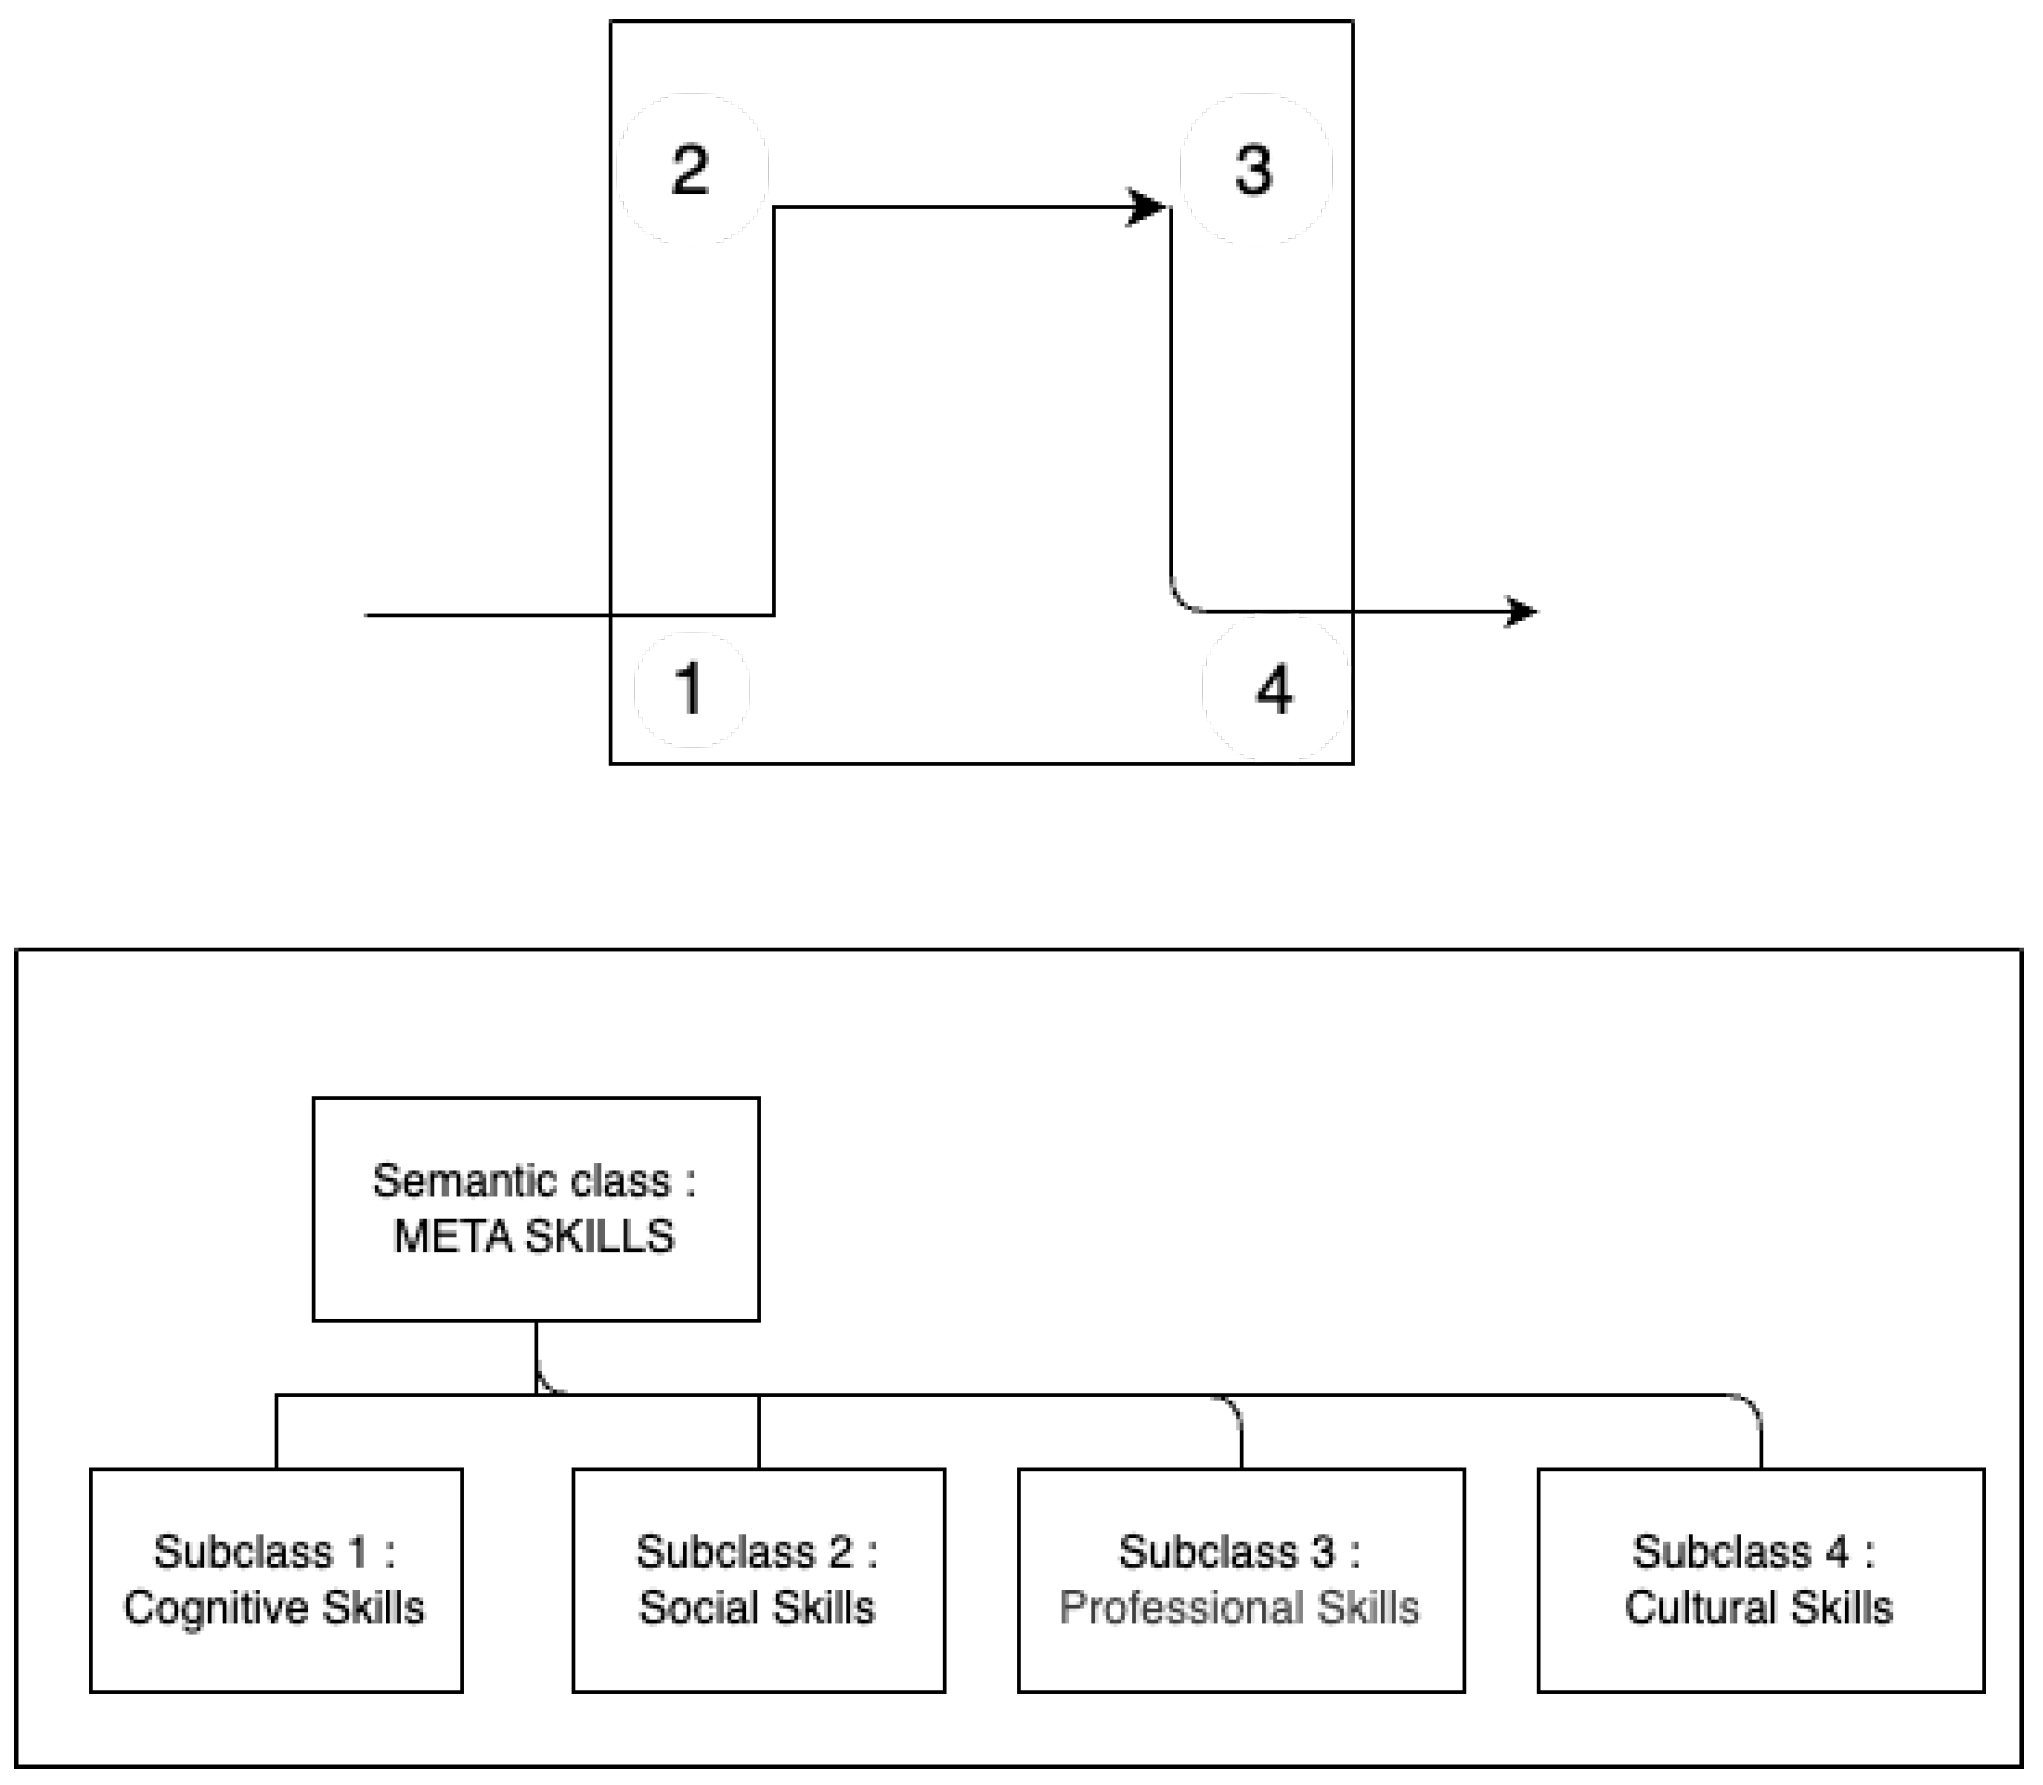
We chose to subdivide each semantic class into smaller, more specialized subclasses to reduce the complexity of semantic indexing and ensure better scalability while avoiding bottlenecks. This process is accompanied by an increase in the degree of the Hilbert curve as the ontology evolves (see
Figure 12). This operation is not performed dynamically within the peer-to-peer network. It is carried out offline during a scheduled semantic boot phase during a period of minimal load. It should be noted that the Hilbert curve tends to fill the unit square when n, the number of iterations, becomes very large. This means that each peer in our system will be responsible for one or more concepts, and will therefore have a part of the overall ontology to manage, and must consequently respond to the various requests involving the concepts within its competence. This requirement is consistent with the principles of peer-to-peer architectures, which stipulate that each node can act as both a client and a server.
5.3. Semantic Indexing of a New Data Source
The insertion of new data sources will be carried out as follows: The data source to be inserted propagates from one semantic class to another via an epidemic protocol [
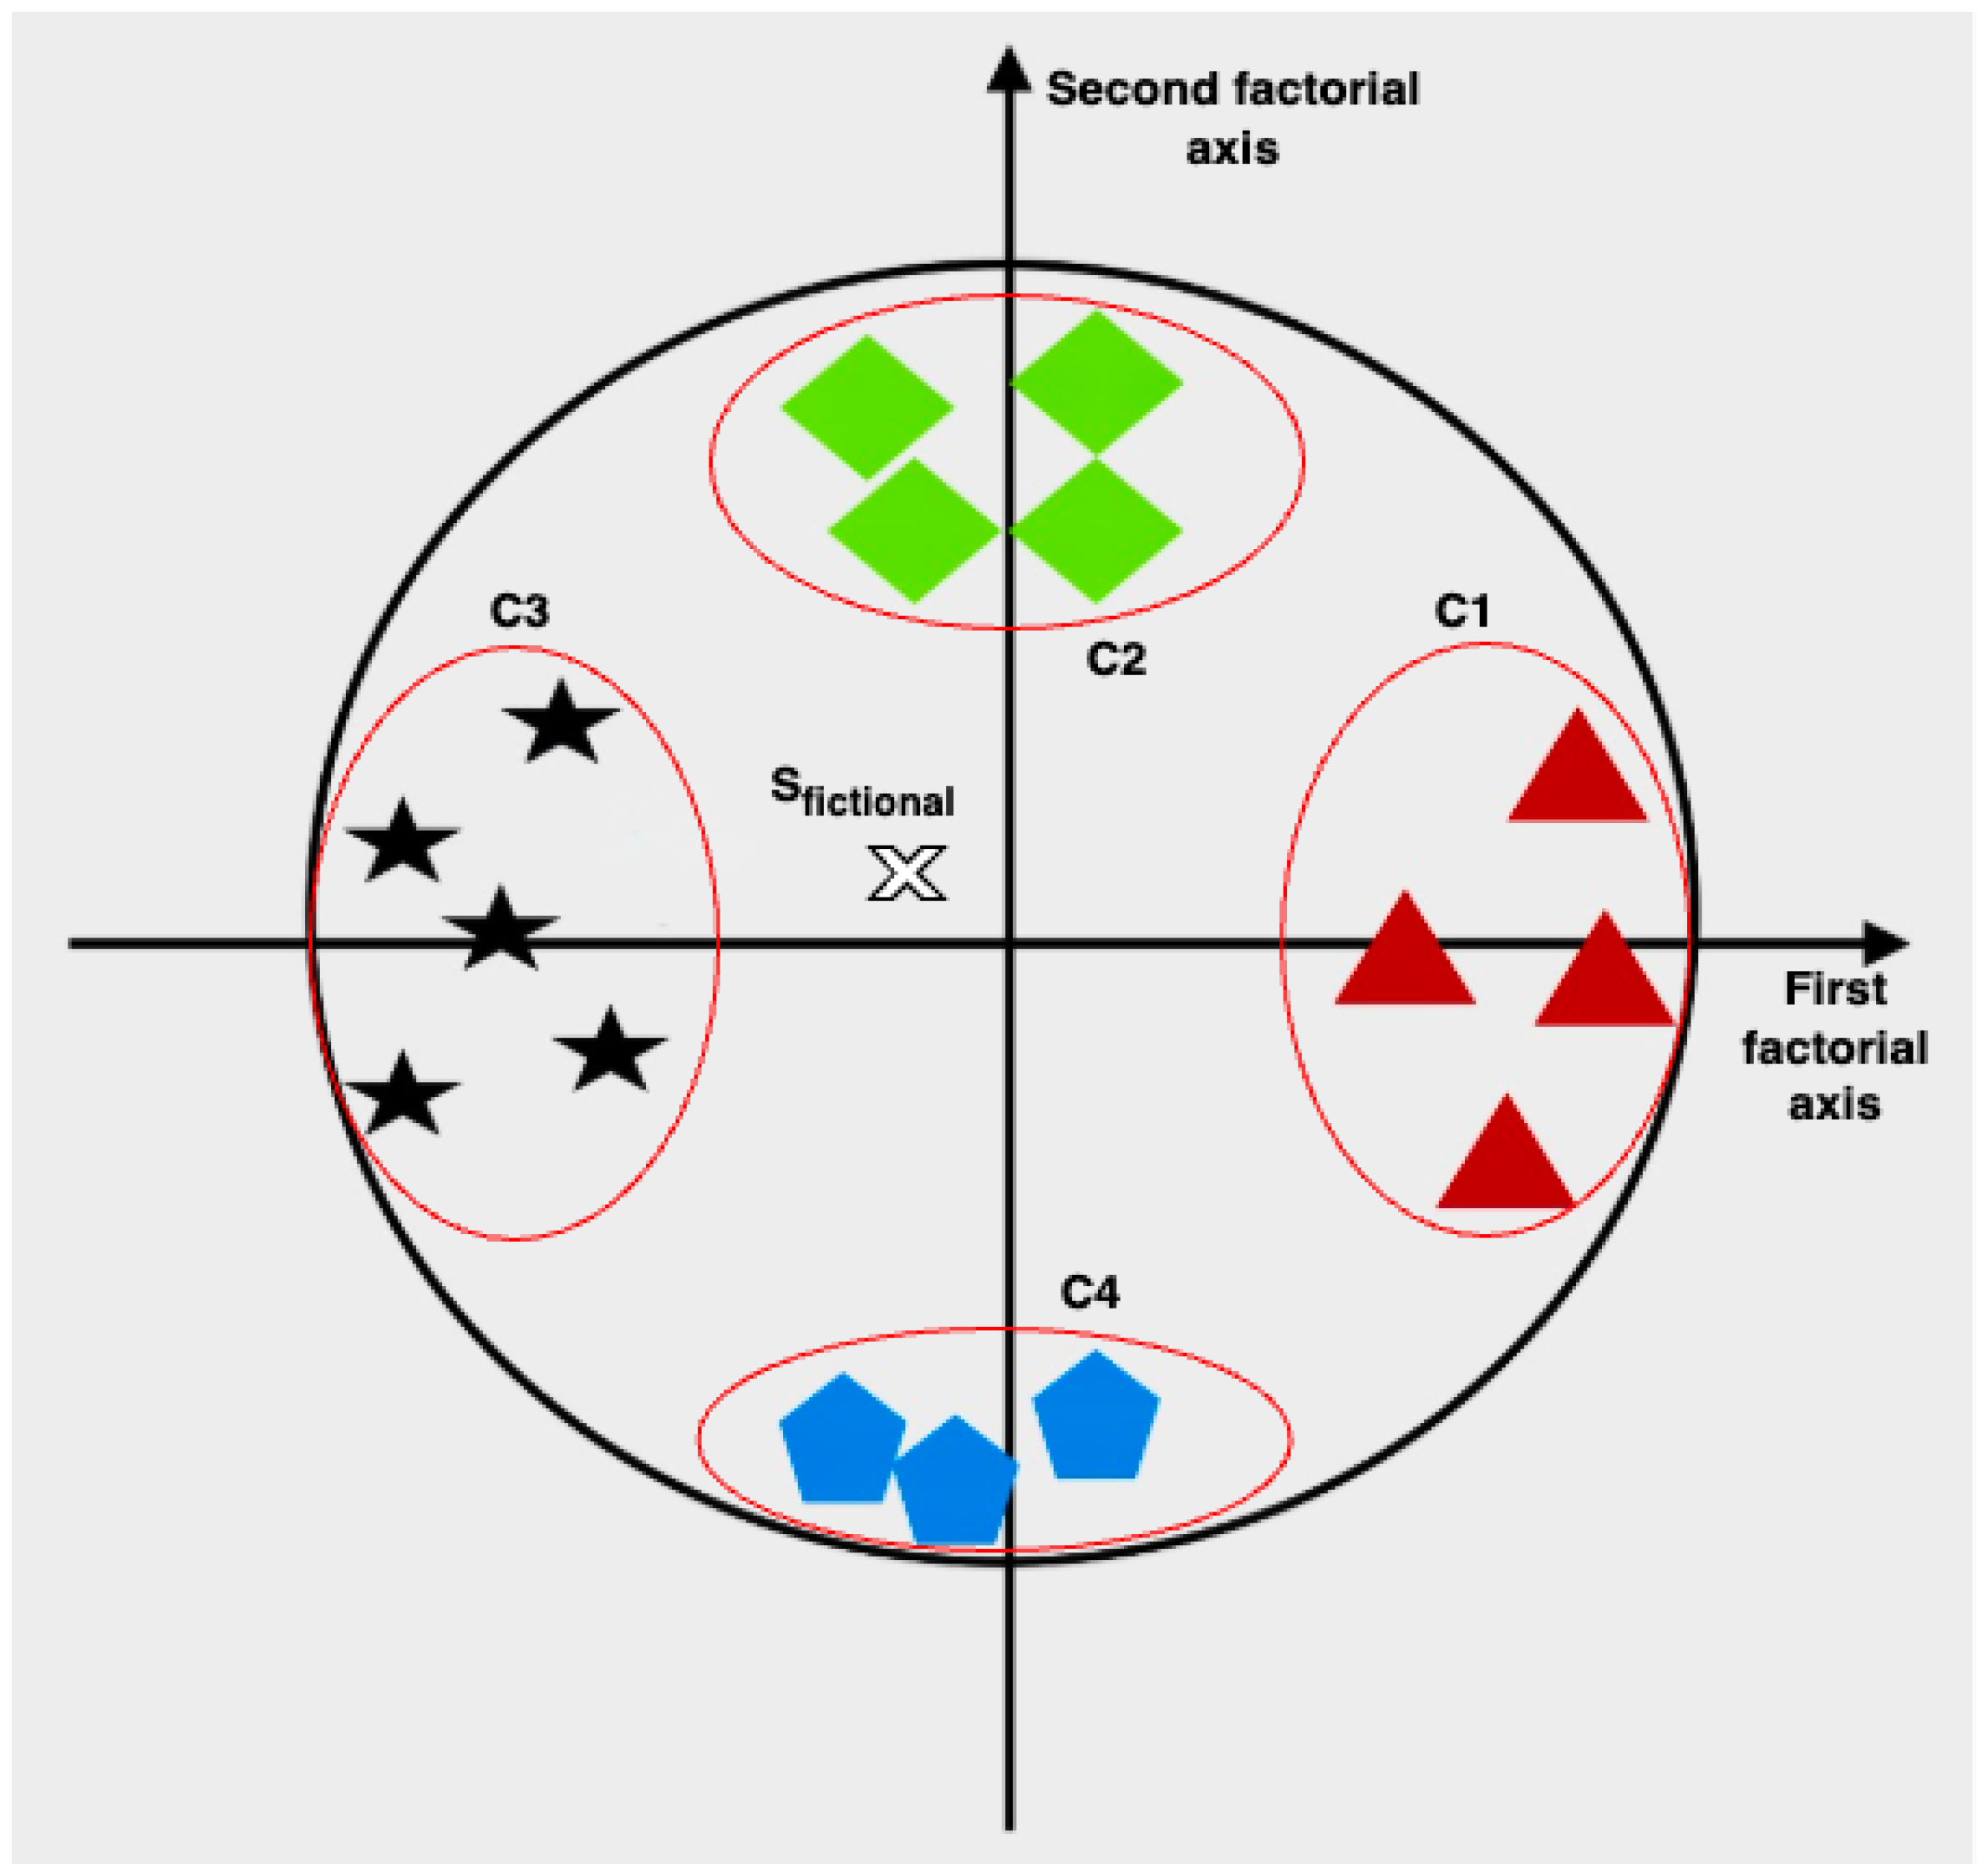
16]. Any new data source to be inserted will be considered a fictional information source within each semantic class (see
Table 6).
We know that the variables that are best represented on the factorial plane are those with the strongest coordinates. This means that, for example, the weak contribution of the fictitious data source to forming the factors (representing the underlying dimensions which, once interpreted, describe the data in a synthetic way) leads us to refute the hypothesis that it belongs to this semantic class (see
Figure 13).
The data source to be inserted can belong to one or more semantic classes. For example, a data source from the field of biochemistry can belong to the semantic classes of chemistry and biology. This will allow our proposal to manage the overlaps between the different domains. The cos projection, or cosine squared , measures the quality of representation of a point (individual, variable, or category) on a factorial axis or plane in factor analysis. It indicates the proportion of variance or inertia explained by this projection. The is the square of the cosine of the angle formed between the vector of the point in the initial space and its projection onto the factorial axis. Its value ranges from 0 to 1: a close to 1 indicates an excellent representation, while a low (close to 0) indicates a poor projection. To this end, it can be stated that a semantic class is considered to index if its squared cosine is strictly greater than a relevance threshold that can be configured within the system. Thus, several semantic classes may index provided that the corresponding squared cosine is greater than the relevance threshold.
A threshold of 0.5 for cosine squared values was adopted as a heuristic criterion to indicate moderate-to-strong association between items and components. This threshold is not theoretically fixed and is used here for exploratory interpretation purposes. Preliminary analyses using different thresholds (0.4 and 0.6) indicated that lower thresholds increased class overlap, while higher thresholds improved class separation at the expense of reduced coverage. The chosen threshold represents a compromise between stability and inclusivity.
5.5. Search for Relevant Data Sources
In structured P2P systems (Chord, CAN, Tapestry, Pastry, etc.), peers and resources belong to the same namespace and are characterized by identifiers considered unique within that same space. Each identifier is calculated by applying a hash function. The keys corresponding to resources are often placed under responsibility of peer with the closest numerical identifier. Each peer has a routing table that directs messages to a peer closer to their destination. Certainly, structured P2P mode offers the possibility of simple, efficient and reliable resource searching (e.g., any data can be accessed in ) with an underlying Chord network with n participants), and presents good performance in terms of scalability and fault tolerance. In contrast, structured P2P systems based on a DHT (Distributed Hash Table) are suitable for unidimensional searches involving a single search attribute. In addition, the exact matching of keys for access to resources is a major obstacle to the structured DHT P2P system: we need to know the exact key identifying a resource to locate the peer responsible for its storage. This problem is exacerbated in the case of DHT since most hash functions produce radically different outputs if the input is slightly modified. However, in reality users often only have partial information to identify these resources, and tend to submit broadly intentional requests. In addition, the P2P DHT mode suffers from an intrinsic semantic problem. Indeed, applying the hash function to two semantically related pieces of information will, in principle, produce two independent keys, which will then be stored in two independent pairs.
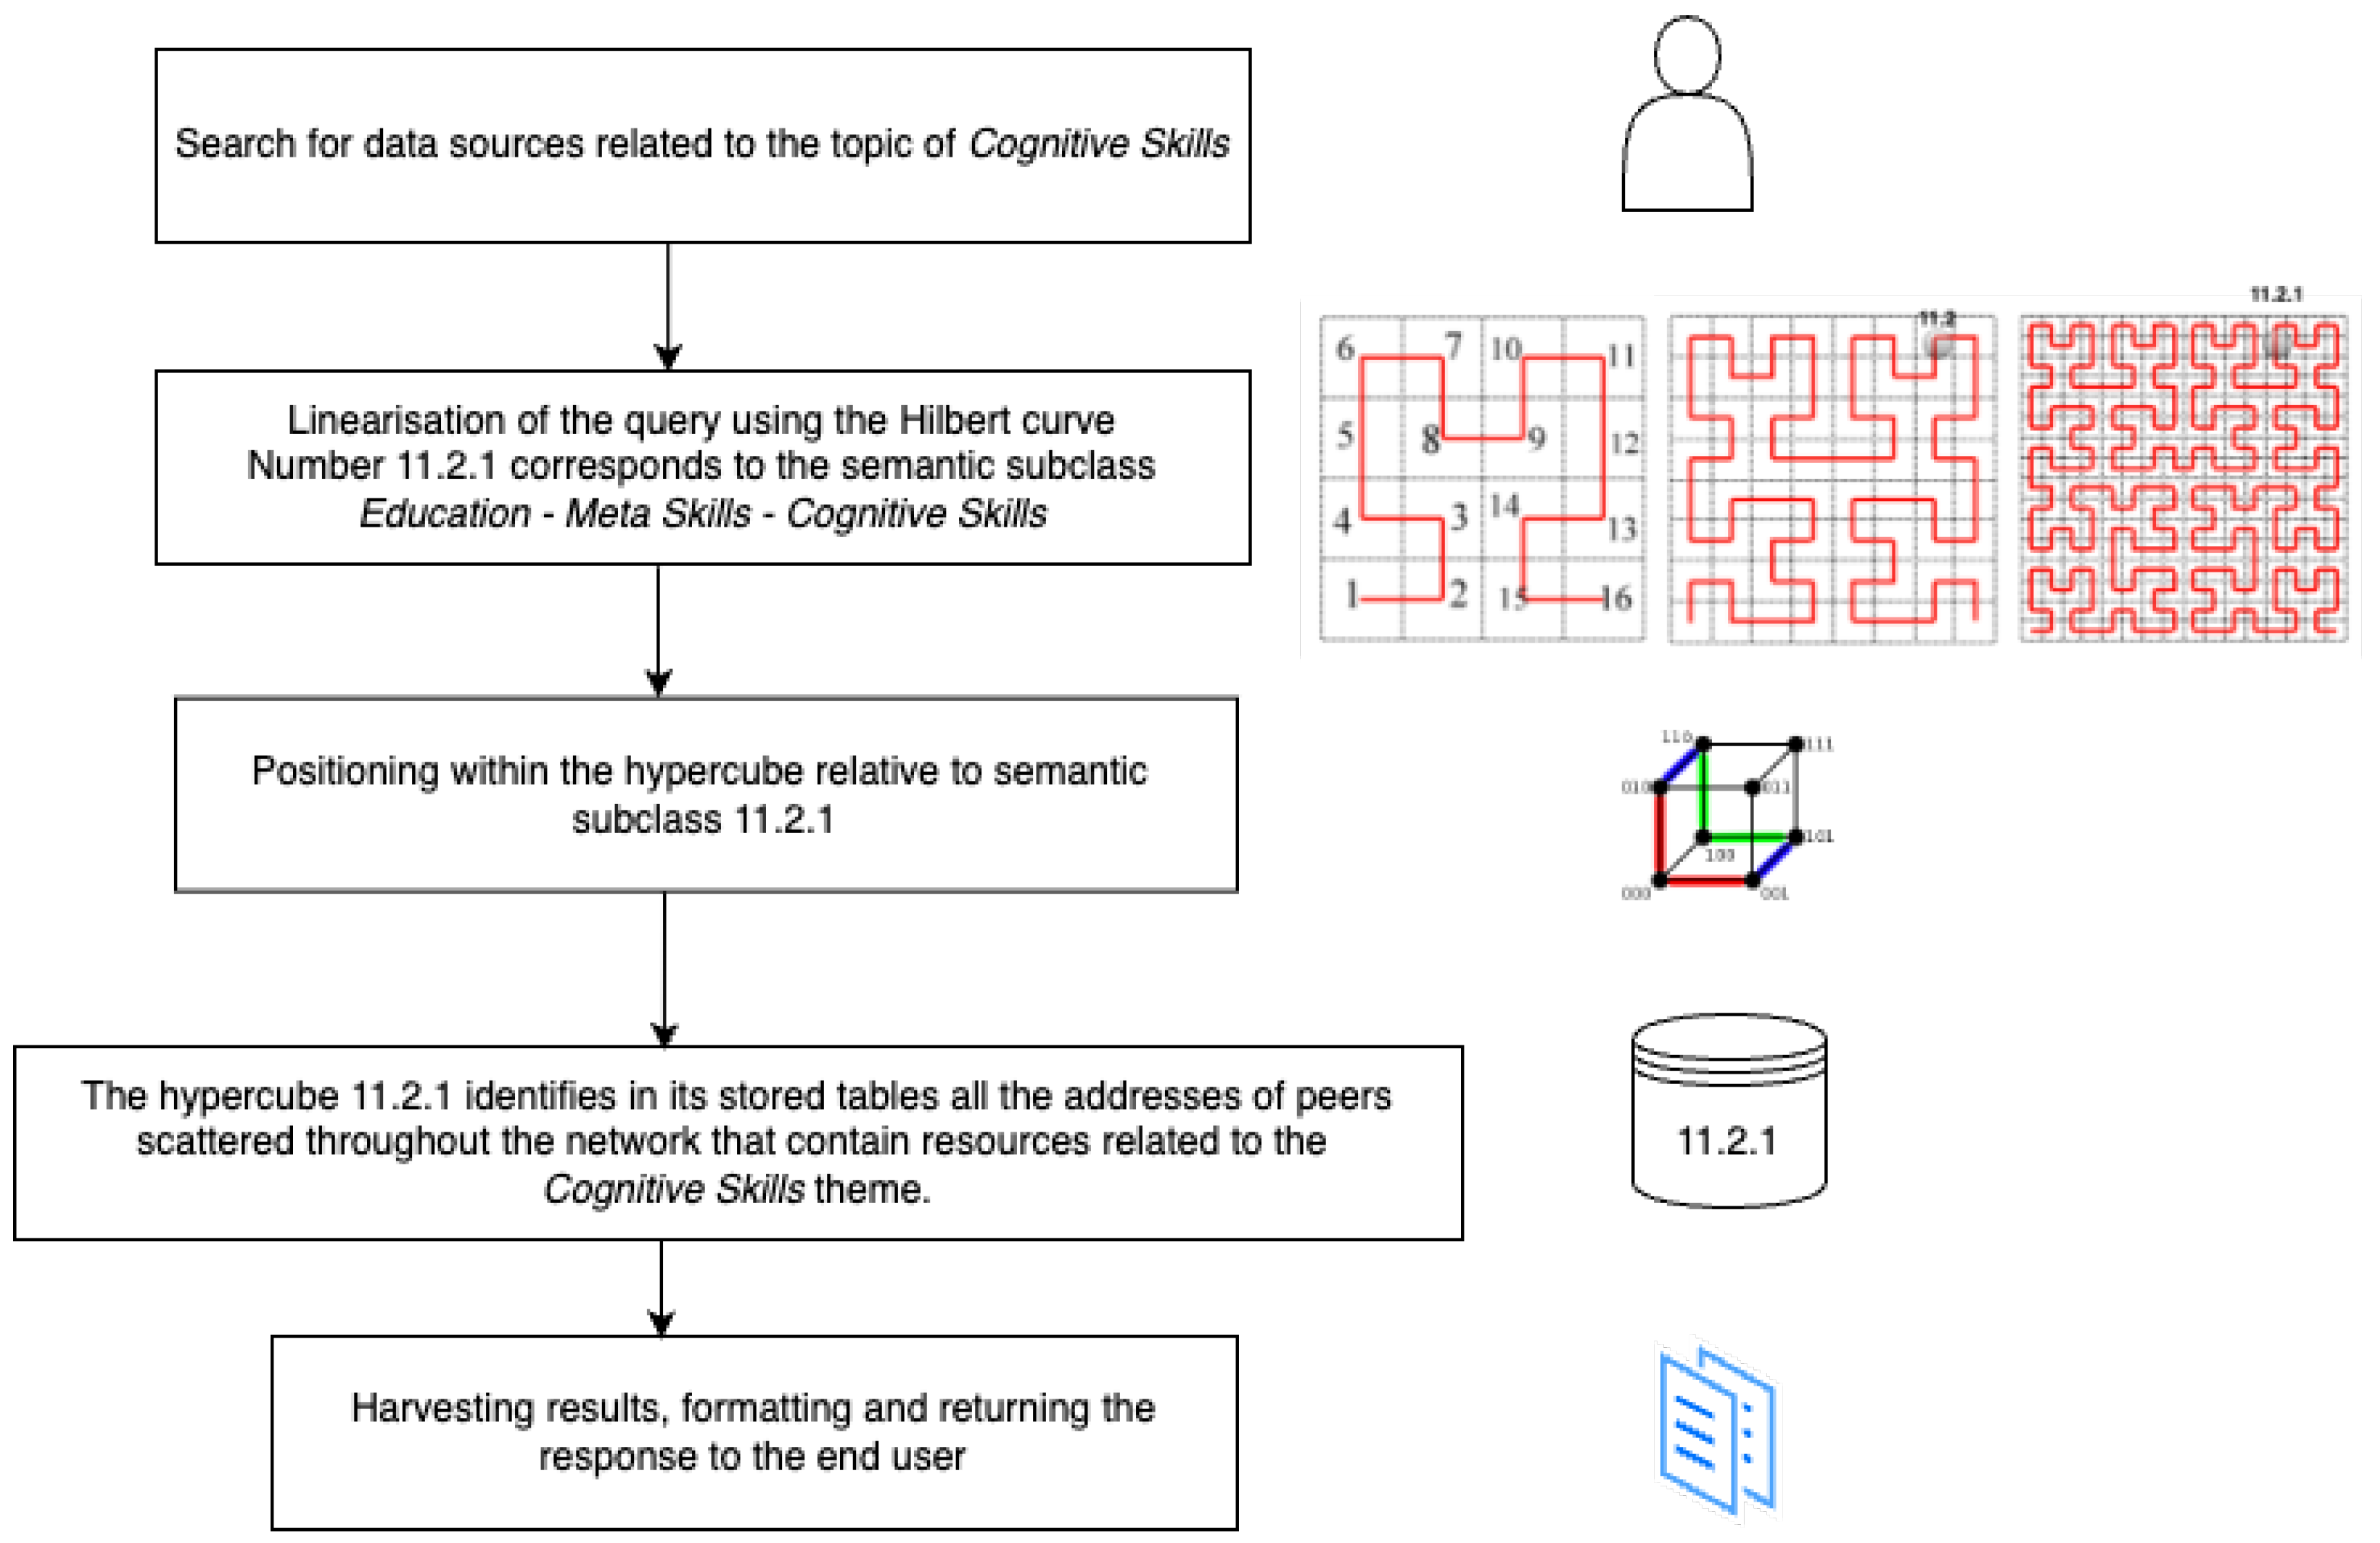
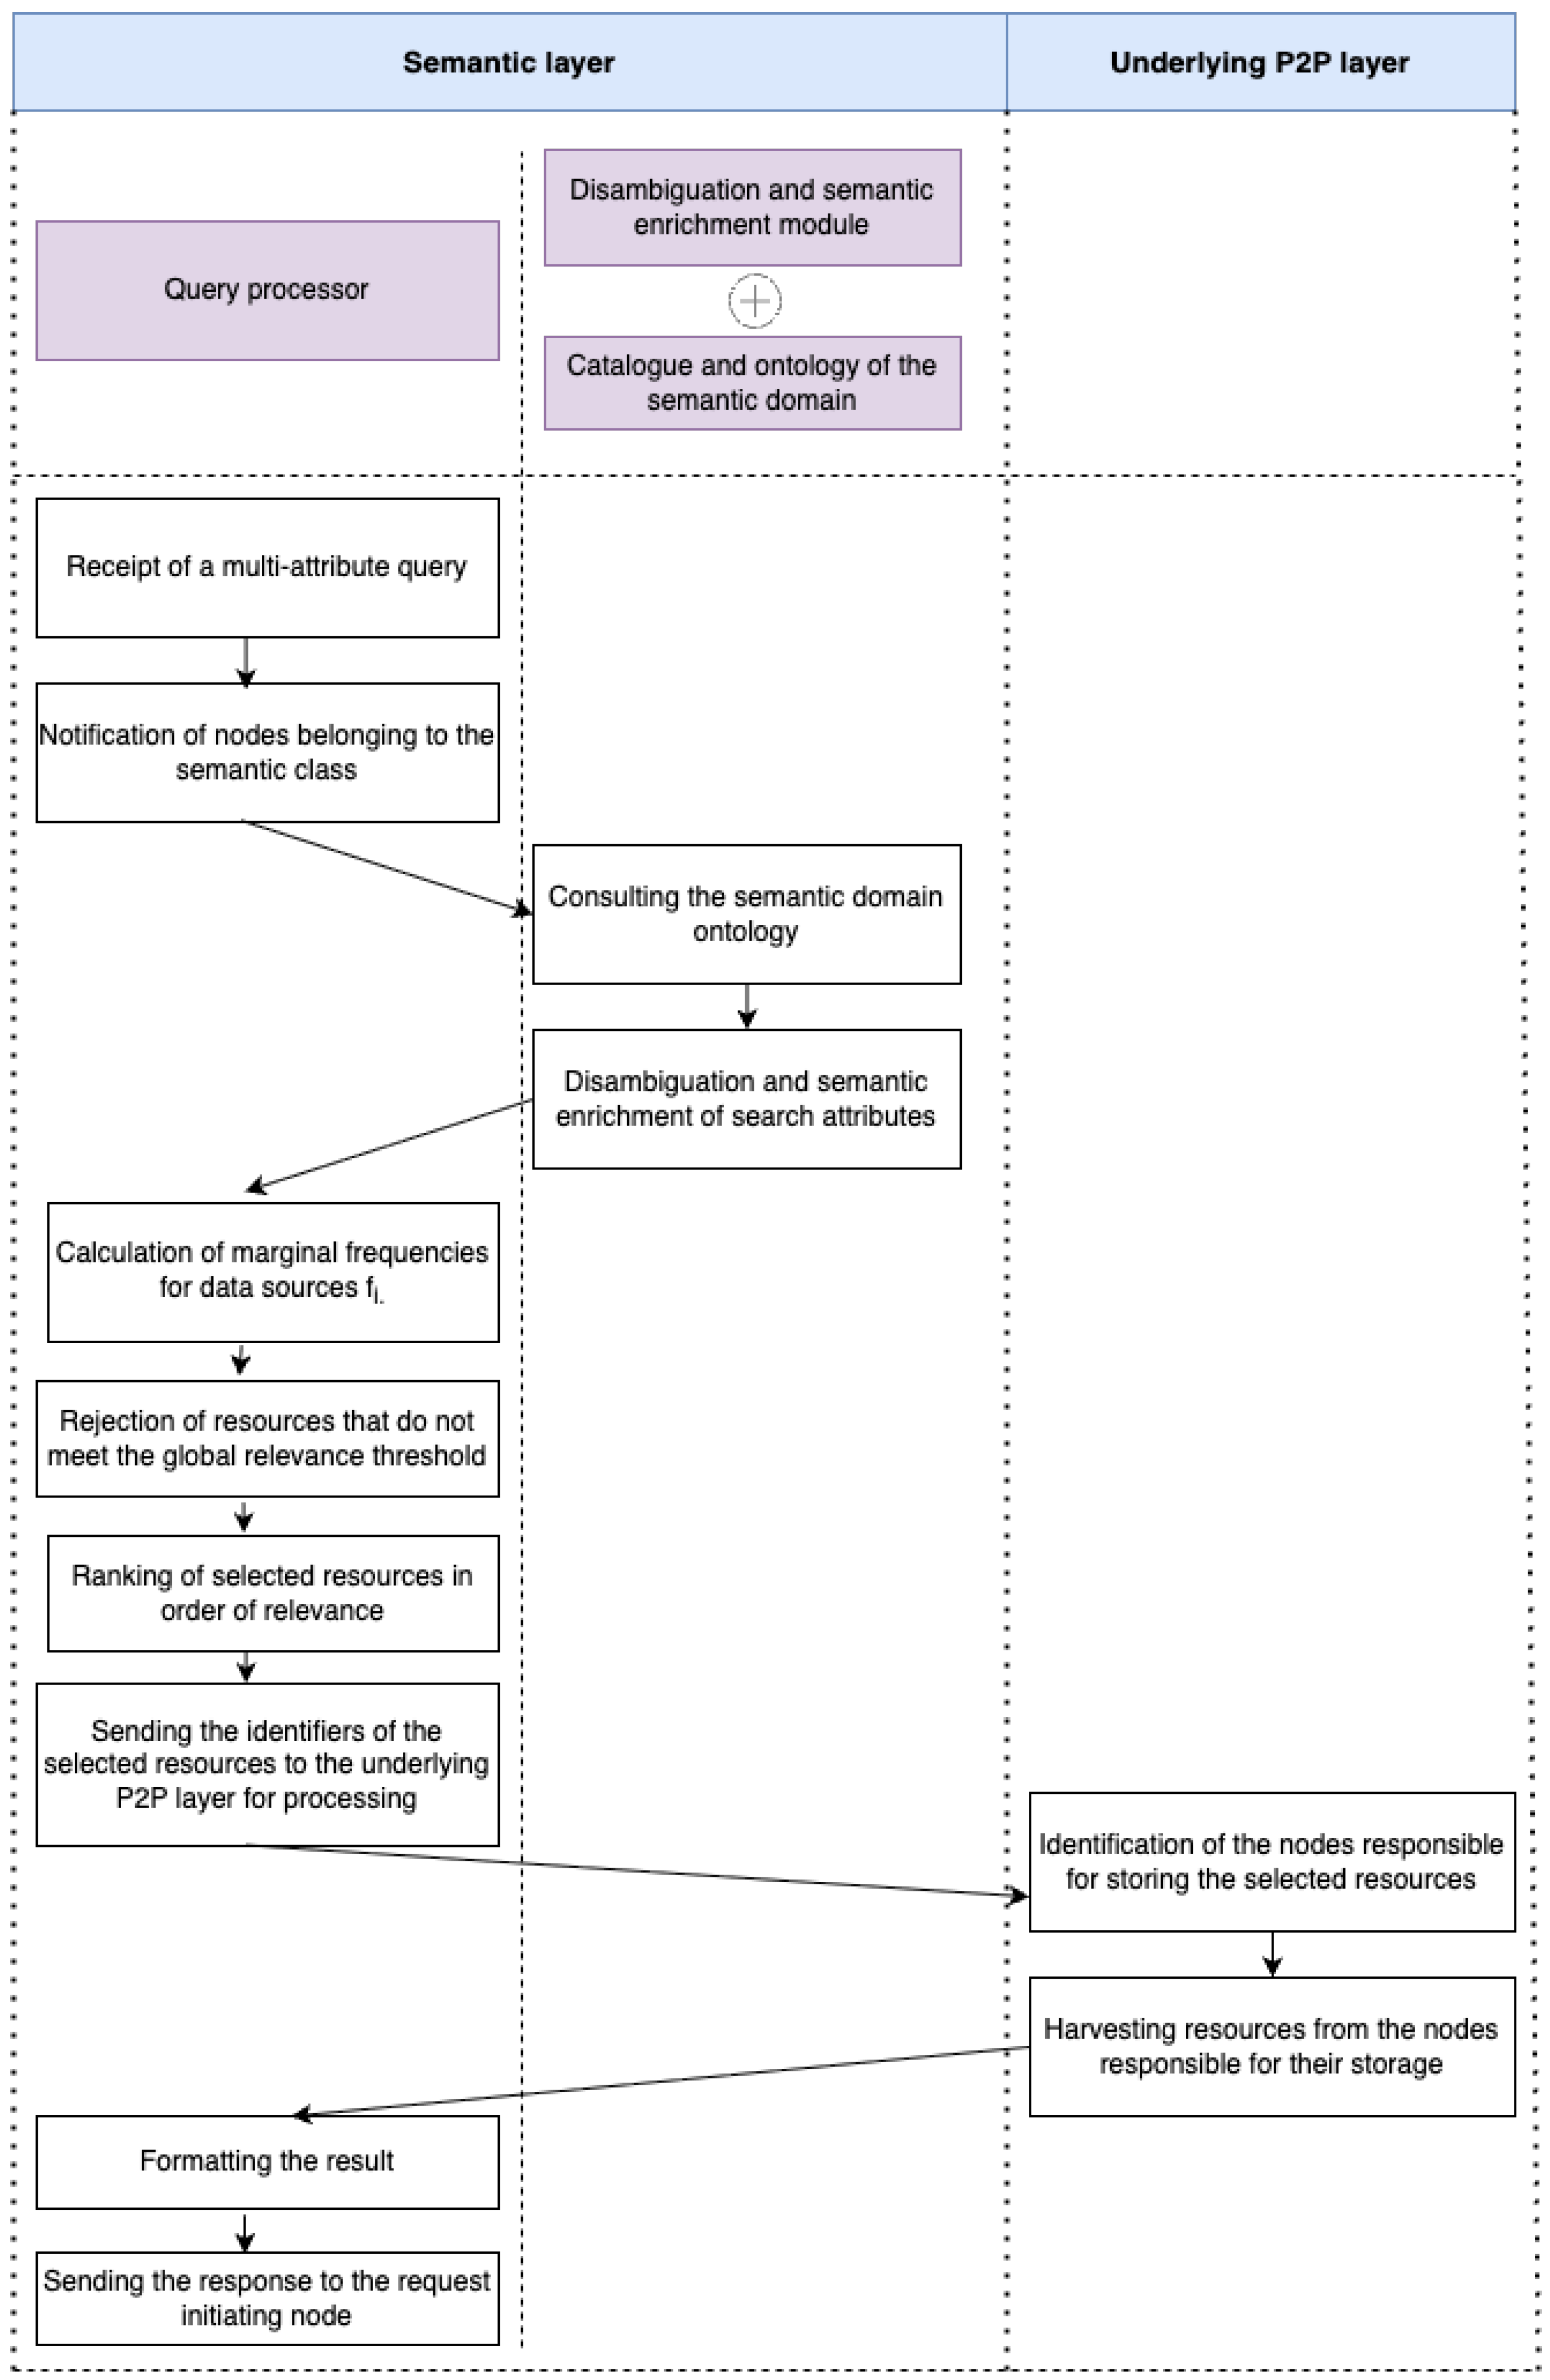
In this article, the proposed approach designs algorithms to overcome the problem of exact matching search and the limitations of one-dimensional search based on a single search attribute. The example shown in
Figure 15 illustrates the processing flow for a broad query. Meanwhile, the example in
Figure 16 presents the processing flow for multidimensional queries involving multiple attributes