1. Introduction
Attention-deficit/hyperactivity disorder (ADHD) is characterized by persistent difficulties related to inattention, hyperactivity, and impulsivity, which significantly impair daily functioning at all stages of development [
1]. ADHD affects approximately 5% of children and adolescents worldwide [
2] and persists into adulthood in about 65% of cases [
3], with 2.5–3.7% of adults worldwide suffering from the disorder [
4]. In addition to the core symptoms, difficulties with self-regulation are also considered a central feature of ADHD [
5,
6,
7]. There is significant inter- and intra-individual heterogeneity in ADHD, with wide variability in performance among individuals [
8]. In laboratory tasks, it has been observed that individuals with ADHD exhibited greater intra-individual variability in reaction times (RT) compared to healthy controls [
8,
9,
10]. These dynamic fluctuations are highly sensitive to contextual factors such as the type of task (difficulty and/or whether it is rewarding) and the individual’s arousal level (which can affect cognitive and physiological state during the task) [
11]. In fact, due to its significance, this increase in intra-individual variability has been proposed as a possible endophenotype of ADHD [
12,
13,
14].
In recent years, digital interventions—particularly serious video games—have emerged as promising tools to train cognitive processes associated with ADHD, offering engaging, adaptive, and scalable approaches to treatment [
15,
16]. Despite these advances, a critical limitation remains: most digital interventions rely on outcome-based metrics, typically derived from pre–post comparisons, rather than continuous monitoring of cognitive and behavioral processes during the intervention itself. This limits their ability to capture the dynamic and fluctuating nature of attentional performance, especially in populations with ADHD, where intra-individual variability is a core feature [
8,
9,
11,
12,
13]. As a result, important information about how patients engage with, adapt to, and regulate their behavior within the task is often lost.
Digital phenotyping has highlighted the potential of continuous, technology-based data collection to capture fine-grained behavioral patterns in naturalistic settings [
17,
18]. The use of digital technologies such as virtual reality, smartphones, and artificial intelligence has been increasingly applied to support inclusive and personalized learning in special education [
19,
20], as well as to advance computational psychiatry and precision medicine through data-driven and individualized approaches [
17,
21,
22]. In parallel, serious games have emerged as promising tools for both assessment and intervention in ADHD, offering ecologically and engaging environments that can capture dynamic cognitive processes [
15,
20,
23]. Moreover, intra-individual variability has been increasingly conceptualized as a transdiagnostic marker of cognitive and behavioral dysregulation across neurodevelopmental conditions [
9,
13]. Therefore, game-based metrics may provide a unique opportunity to operationalize process-level indicators aligned with emerging frameworks in digital mental health.
This study proposes a set of intra-individual process metrics derived from a serious game intervention designed to train multiple cognitive domains in children and adolescents with ADHD. The Secret Trail of Moon is a cross-platform serious game for cognitive training developed by a multidisciplinary team, whose effectiveness has been investigated through a usability study [
24] and two clinical trials [
25,
26,
27,
28]. The game collects performance parameters such as correct answers, errors, and reaction times, among others that we will discuss below. Instead of comparing individuals to normative samples, these metrics are based on changes within each subject across repeated exposures to the task, allowing for continuous monitoring of performance trajectories. Given the novelty of deriving process-based metrics from adaptive game environments, the present study adopts an exploratory approach aimed at characterizing intra-individual performance dynamics. The primary objective of this study is to develop and empirically examine the utility of these intra-individual metrics as indicators of dynamic cognitive regulation during the intervention. Although The Secret Trail of Moon features five gameplay mechanics, we will focus on addressing metrics related to attention performance during a gameplay mechanic inspired by a CPT-3 task [
29]. Based on this framework, the study addresses the following research questions: (1) Do intraindividual performance metrics derived from gaming remain stable or show systematic changes after repeated exposures? (2) To what extent do variability-based metrics (intraindividual variability, reaction time variability) provide complementary information to average performance measures? (3) Are game-derived metrics associated with external clinical outcomes (SDQ scores as the primary outcome of the clinical trial)?
2. Materials and Methods
2.1. Materials
The Secret Trail of Moon is a multiplatform video game (virtual reality and PC) intended as a healthcare product for cognitive training and emotional regulation in patients with ADHD through various game mechanics. It was designed by a multidisciplinary team. The theoretical foundations of the game are derived from both the Brown [
30] and Barkley [
31] models. The intervention consisted of a serious game platform designed to train multiple cognitive domains relevant to ADHD, including sustained attention, planning, working memory, reasoning, and visuospatial abilities [
24,
25,
26,
27,
28]. The platform is composed of five distinct game mechanics, each targeting specific cognitive processes while maintaining a secondary contribution to executive control functions. Each game dynamically adapts task difficulty by manipulating parameters such as the number of stimuli, distractors, time constraints, and penalties for errors, allowing for individualized progression across sessions. The intervention integrates multiple cognitive domains within a unified gamified framework, allowing for the simultaneous assessment and training of executive functions.
SMASHER is a sustained attention game based on the
focus variable of Brown’s Theory [
30]. SMASHER is based on a sequential continuous performance paradigm. To destroy an obstacle blocking the path, the player must press the controller in response to a specific sequence of two stimuli (pawn-knight sequence), inspired by continuous performance paradigms such as the Conners Continuous Performance Test (CPT) [
29]. The difficulty increases with longer task times, a greater number of stimuli, distractions, and penalties for errors. Primary outcomes include correct detections (hits), omissions, commissions, and reaction time measures. SMASHER primarily works on sustained attention and, secondarily, inhibitory control.
The TEKA TEKI game consists of a planning task, reflecting the importance of this variable in working with ADHD according to Barkley’s model [
31]. It is inspired by classical problem-solving paradigms such as the Tower of Hanoi. In this game, the objective is to unlock a key by removing the blocks that obstruct it in the fewest possible moves. The primary variable it addresses is planning, and secondarily, inhibitory control.
ENIGMA is a game in which the player must remember an association of stimuli and retain it in their memory in order to move wheels to their corresponding positions, creating as many sequences as possible. Following Brown’s model [
30], ENIGMA addresses the variable of memory, specifically working memory, defined as the limited capacity to retain and manipulate information simultaneously. This mechanism is limited in time and in the amount of information used. ENIGMA primarily works on working memory and secondarily on cognitive flexibility.
In KUBURI, the player uses cubes with different faces to test their visuospatial ability to represent objects by selecting and rotating the corresponding face. KUBURI develops visual analysis and synthesis skills, as well as the ability to reproduce abstract geometric drawings. Based on the importance of developing visuospatial reasoning, as outlined in Barkley’s model [
31], and on relevant perceptual reasoning tests such as the WAIS Cubes, KUBURI primarily focuses on visuospatial ability and, secondarily, selective attention.
The CHESS game mechanics follow the line of research on the therapeutic benefits of chess. In this game, you can perform different tasks related to this ancient game. It primarily develops reasoning skills and, secondarily, selective attention.
2.2. Participants
Performance data for The Secret Trail of Moon were collected from clinical trial participants. This was a prospective, single-center, randomized, pre- and post-intervention study with block randomization (NCT06006871) [
28]. Participants included 76 children and adolescents diagnosed with ADHD (mean age = 12.68, SD = 2.75; 80% male), recruited from a clinical setting. Additional demographic and clinical characteristics are reported in the main clinical trial publication [
28]. All participants had a clinical diagnosis of ADHD in any of its presentations and were receiving stable pharmacological treatment for ADHD. Patients were clinically stable, with a Clinical Global Impression (CGI) score between 3 and 6 before entering the clinical trial [
32]. Comorbidity was not an exclusion criterion in the study, except for patients at risk of suicide, unable to follow verbal instructions, or with motor difficulties that would prevent them from playing a video game. Detailed clinical and demographic characteristics are reported in the main clinical trial publication [
27,
28]. However, the most relevant comorbidities were learning disorders (dyslexia), sluggish cognitive tempo, and autism spectrum disorder. Exclusion criteria also included participation in similar video game studies or the intention to initiate psychotherapeutic treatment during the 3-month study period. Medication was not modified during the study. Participants were randomized using an electronic case report form (eCRF) into two groups: Group 1 (The Secret Trail of Moon, MOON;
n = 38, 50%), which received standard pharmacological treatment combined with personalized cognitive training through a serious video game designed for patients with ADHD, along with psychoeducational support for parents; and Group 2 (control;
n = 38, 50%), which received standard pharmacological treatment and psychoeducational support for parents, without the video game intervention. The study followed a parallel allocation model (MOON vs. control) with a 1:1 allocation ratio. For further information about the study, please refer to the protocol or results [
27,
28].
All participants were recruited from the child and adolescent psychiatry outpatient clinics of Hospital Universitario Puerta de Hierro Majadahonda. The total duration of the research was 3 months for each participant. Regarding the procedure, the intervention training (D1–D90) varied depending on the assigned group. For the MOON group, 20 sessions with the video game were scheduled: 10 sessions were conducted in the hospital with the researchers, and 10 sessions were conducted online at home, with participants using their computers under the researchers’ supervision (twice a week, adjusted according to participant availability). The researchers explained the task, adapting the instructions to each participant’s age and ensuring that the participant understood the task and completed a baseline level. The difficulty level was then increased individually based on the player’s progress. Player progress was indicated by level advancement. Performance feedback was also provided through several parameters (e.g., correct answers, incorrect answers, time taken;
Table 1) and stars awarded (0 stars = poor performance, level must be repeated; 1 star = acceptable performance; 2 stars = good performance; 3 stars = excellent). All participants followed the same sequence of MOON games for 20 min of gameplay following the order of the games reflected in protocol (game mechanic 1: 10 min, game mechanic 2: 10 min) [
27]. Following PlayStation’s recommendations against the use of virtual reality in children under 12, patients over 12 years of age played MOON in virtual reality, while those under 12 played the video game sessions on a computer. For the online intervention, in week 5 (D45), both parents and children received a USB drive and training on how to use the video game at home. Follow-up was conducted by telephone, where the researchers verified proper gameplay at home. The online sessions were monitored via the PlayFab data server (Microsoft Corporation, Redmond, WA, USA). All participants used their personal username and password to log in to the PlayFab data server.
This study was approved by the Research Ethics Committee of the Puerta de Hierro University Hospital on 14 December 2022 (PI 106/22). Subsequently, the Spanish Agency for Medicines and Health Products granted authorization on 14 February 2023 (1061/22/EC-R). The study was monitored by an independent monitor. All participants signed the informed consent form. Additional consent was required to use this video game performance data. Data were anonymized by assigning a specific code for the clinical trial. Data were treated confidentially in accordance with Organic Law 3/2018 of 5 December, on the Protection of Personal Data and Guarantee of Digital Rights. This study complied with Good Clinical Practice guidelines and the Declaration of Helsinki. Participants received no financial compensation.
2.3. Methods
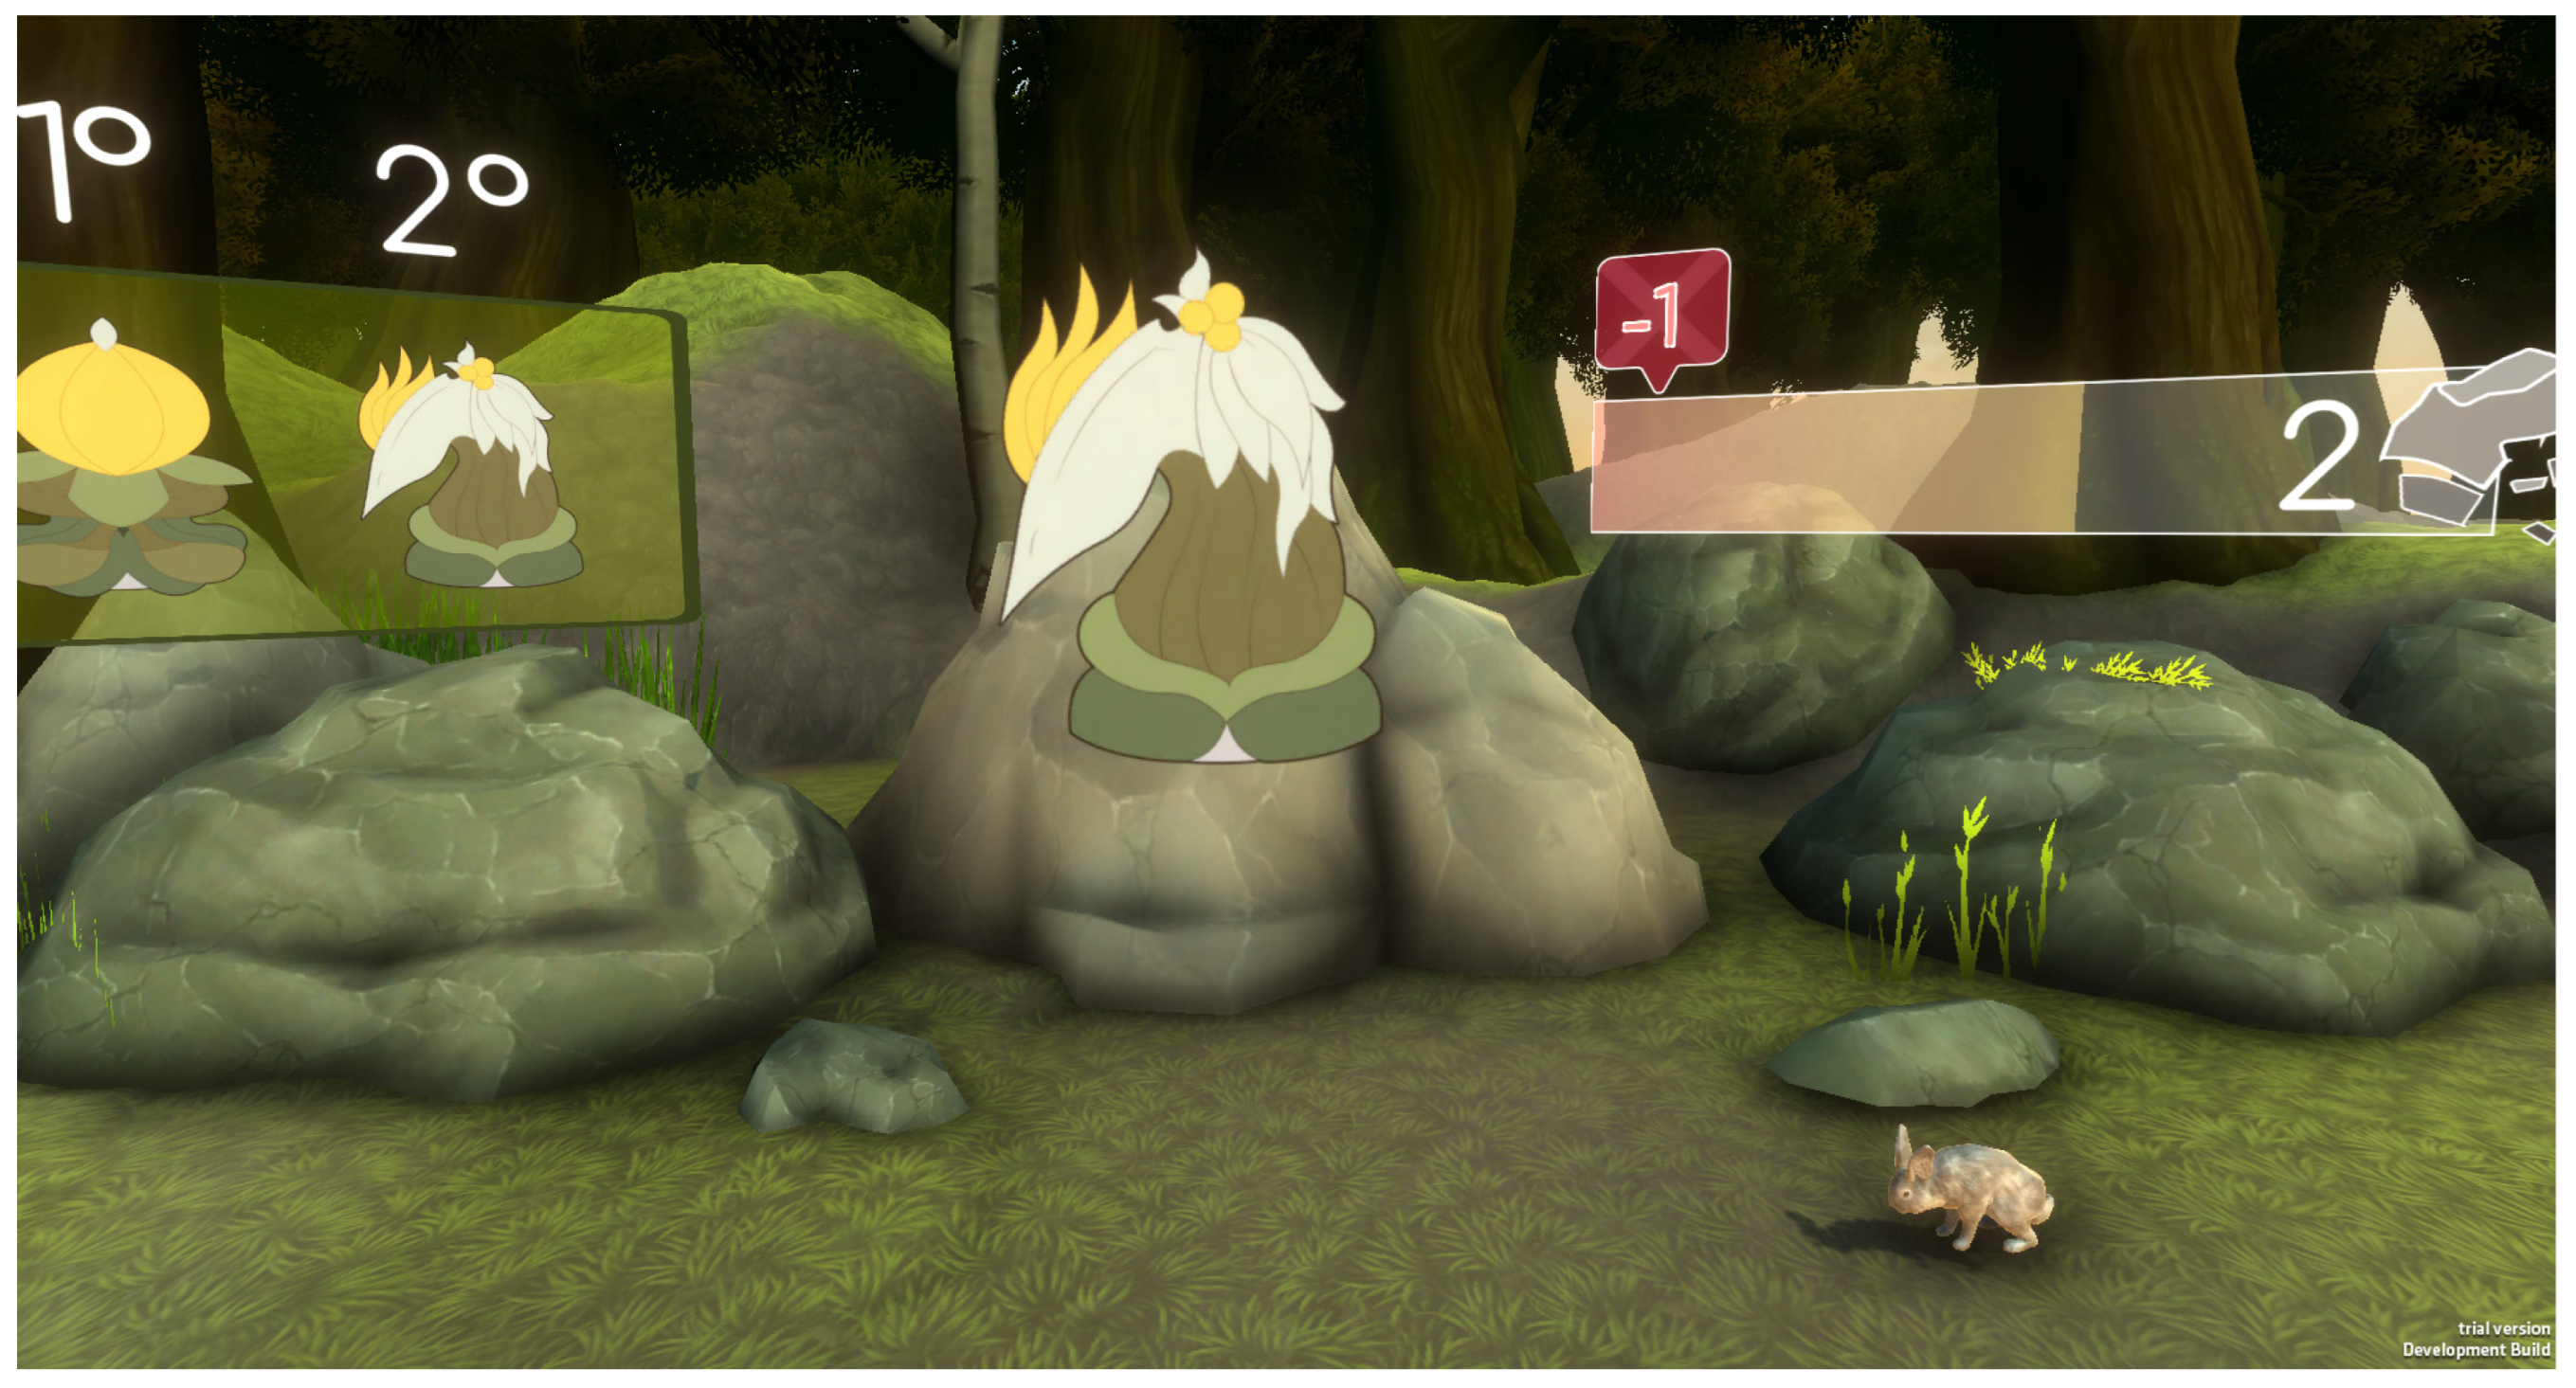
The SMASHER task is an adaptive continuous performance paradigm in which stimulus presentation, duration, and difficulty vary across levels and participants. It consists of a panel that indicates the target (first a pawn appears, then a knight), the stimuli that appear in front of the rock to destroy it (target and distractors), and a rock health bar. As the levels progress, the rock becomes more difficult to destroy, with the possibility of a penalty at higher levels (−1 in
Figure 1). At higher levels, distractor animals appear during the sustained task (for example, a rabbit is shown in
Figure 1).
The performance data collected in SMASHER are presented in
Table 1.
Some of the indices collected through these parameters are “Success Rate”, “Error Rate”, “Stability” and “Attentional Performance Index” following the formulas indicated below. These metrics were selected to capture dimensions of attentional performance described in the ADHD literature, including omission and commission error rates [
33], inconsistency, lapses and variability in reaction times [
9,
10], eye movements [
34,
35], motor impulsivity [
36], accuracy [
37], stability [
38], or efficiency [
39], measures particularly sensitive to attentional dysregulation in ADHD. Given the adaptive and non-standardized structure of the task due to the difficulty curve of the game mechanics, traditional parametric assumptions and signal detection approaches were not appropriate. Instead, we prioritized within-subject metrics that capture relative changes and variability over time. Due the absence of established normative thresholds for these indices in continuous performance tasks based on games, these indices should be considered exploratory and descriptive. They are not intended as validated clinical measures or diagnostic markers. Their interpretation is therefore relative to the sample and should be understood as rough guidelines rather than firm categories.
Success rate reflects the proportion of stimuli that elicited correct responses. It is an indicator of performance under the demands of the task and can be affected by the target-distractor ratio or the duration of the level. It is related to sustained attention and vigilance. Lower values may reflect reduced target detection or increased omissions, whereas higher values indicate a greater proportion of correct responses relative to total stimuli. However, interpretation should consider the low and variable target frequency inherent to continuous performance paradigms. Importantly, this index should be interpreted in conjunction with the Accuracy of Response and the SMASHER Attentional Performance Index, as all three include hits but capture different aspects of performance.
The error rate measures the total error load, including omission errors (indicators of inattention) and commission errors (indicators of impulsivity). Higher values could point to worse performance (more lapses, more impulsivity, or both), while lower values could indicate adequate inhibitory control.
Response accuracy represents the proportion of correct responses among all emitted responses (i.e., hits relative to total responses). This index reflects response precision conditional on responding and does not account for omissions or response frequency. Higher values indicate that responses are more frequently correct, suggesting better response discrimination and/or lower impulsivity. Lower values indicate a higher proportion of incorrect responses, reflecting increased impulsive or less precise responding.
Motor impulsivity is an indicator of impulsivity in response execution. It indicates how many responses are impulsive or incorrect out of all the times the subject responds, including incorrect commands and button presses. Higher values indicate greater tendency toward impulsive or poorly controlled motor responses, whereas lower values reflect more controlled and accurate responding.
Stability is a composite index that combines performance outcomes and reaction time variability to provide a global approximation of response consistency across the task. Given that this index integrates measures expressed in different units (counts and milliseconds), its interpretation should be treated with caution, and it is primarily intended as an exploratory indicator of overall performance fluctuation. Higher values reflect more stable performance characterized by fewer errors and lower variability, whereas low or negative values indicate high variability, greater inconsistency, and higher error rates.
The SMASHER index measures overall response accuracy. Due to the adaptive and non-uniform nature of the task, the number of stimuli varied across levels and participants. Therefore, performance was operationalized as the proportion of correct responses to the total number of attempts, ensuring comparability across different task conditions. Stimuli were omitted to avoid introducing noise into the formula, as not all levels have the same duration, difficulty, or number of targets. Higher values could indicate better overall attentional and inhibitory control, whereas lower values reflect a higher proportion of errors. Compared to success rate, this index is less influenced by task structure and provides a more direct estimate of response accuracy.
To further characterize reaction time dynamics, additional indices were derived, including the coefficient of variation (RT SD/RT mean) as a measure of intra-individual variability, and a skewness proxy (RT mean–RT median) to approximate the presence of slow responses associated with attentional lapses.
Reaction time variability measures attentional variability and lapses in attention. Higher values indicate greater intra-individual variability and increased attentional fluctuations and lapses or inconsistency, while low values indicate more stable and consistent performance.
Although differences between participants with ADHD and typical participants are more consistently captured by asymmetrical distributions such as the ex-Gaussian distribution, characterized by three parameters (µ, σ, and τ) [
10], approximations were made using the mean, median, and standard deviation of reaction time. One of these approximations involved using Skewness as a substitute for τ (ex-Gaussian), an indicator of atypically very slow responses (lapses). Values close to 0 indicate symmetrical distributions, while high values suggest the presence of slow responses.
The lapse index combines variability with extreme slowness. Very high values indicate frequent lapses, while lower values are interpreted as more stable control.
The speed-accuracy efficiency index measures performance and speed. Low values indicate slow and inefficient performance, while high values indicate fast and accurate performance.
Each index is calculated at the level of game exposure and tracked longitudinally across sessions.
The present analyses are based exclusively on gameplay-derived process data, which were only available for participants in the intervention group. As the control group did not interact with the game, no equivalent process-level measures could be obtained, precluding direct between-group comparisons. Therefore, the study focuses on intra-individual dynamics within the intervention group rather than between-group effects. Accordingly, analyses were exploratory and focused on describing within-subject patterns. Given the exploratory nature of the study, analyses were primarily descriptive, and no strict assumptions of normality were imposed, so the results should be interpreted with caution.
Due to the dynamic and adaptive nature of the task, target frequency and trial structure varied across sessions and participants preventing the computation of traditional signal detection indices (e.g., hit rate, d’). Therefore, performance was operationalized using normalized indices based on total stimuli and error rates, allowing for consistent intra-individual comparisons across exposures. Performance was operationalized as the proportion of correct responses relative to total responses (correct + omission + commission errors) providing a stable measure across varying task conditions, minimizing the influence of fluctuating trial counts and adaptive difficulty levels.
For each participant, simple linear regression models were used to estimate the slope of performance across repeated exposures to the task. Slopes were interpreted as indicators of intra-individual change over time. Linear slopes were used as a simple and interpretable indicator of change over time, allowing the characterization of individual performance trajectories across repeated exposures. The within-subject standard deviation was also calculated to observe how much a person’s performance fluctuates between sessions. Higher SD values reflect greater intra-individual variability and less stable performance over time, whereas lower values indicate more consistent responding. Given the absence of established normative thresholds for these metrics in adaptive game-based paradigms, SD values were interpreted descriptively and relative to the sample distribution. In general terms, lower values tended to reflect more stable performance, while higher values suggested greater variability and potential attentional fluctuations.
Bivariate correlation analyses were performed using Pearson’s correlation coefficient to examine the relationship between the variables SDQ, mean performance index, slope, and intraindividual variability. All analyses were performed using IBM SPSS Statistics software, 27.0.1.0 version (IBM Corp., Armonk, NY, USA), with two-tailed tests and a significance level of α = 0.05.
3. Results
The recruitment period lasted 7 months (9 May 2023 to 31 October 2023). The proposed recruitment target (
n = 152) was not met [
27]. A total of 76 patients with ADHD participated in the clinical trial and signed the informed consent form. They were randomized in a 1:1 ratio (MOON:
n = 38, 50% and control:
n = 38, 50%). The overall dropout rate was 9% (7/76) of participants (
n = 5, 71% in the MOON group and
n = 2, 29% in the control group), which did not exceed expectations (12/76, 15%). The ITT population was analyzed for the primary and secondary outcomes, including 87% (33/38) of the patients assigned to the MOON group and 95% (36/38) of the patients assigned to the control group.
All participants completed the 10 in-person sessions. The number of sessions completed decreased after the initial 10 sessions, with an average of 16 sessions (the minimum was 3 patients completing 10 sessions; the maximum was 12 patients completing all 20 sessions). Clinical trends of improvement were found in emotional regulation difficulties and executive functions in the subgroup most committed to the treatment (those who had completed at least 16 of the 20 sessions) (see [
28] for details)
Regarding SMASHER, participants assigned to the MOON group were required to play this game mechanic in sessions 2, 3, 7, 9, 12, 15, 17, and 19, meaning they were exposed to the game mechanic eight times in the order presented in protocol [
27]. Some participants did not like the task because the game mechanics were boring, as it was a CPT-3-type sustained attention task. The protocol was followed, adhering as closely as possible to the order in which the game mechanics were presented. However, some participants played other, more engaging game mechanics that suited their preferences (TEKATEKI, KUBURI, CHESS, ENIGMA), especially during the online sessions, which were more difficult to control since they took place in the participants’ homes. For this reason, as shown in
Table 2, there was a minimum of 2 exposures to SMASHER and a maximum of 11 exposures (perhaps because a participant preferred the game mechanics or felt comfortable with them and played again). Because the number of exposures varied among participants due to differences in adherence and involvement with the intervention, the analyses were based on intraindividual trajectories.
The success rate (M = 0.14, SD = 0.06) indicates the proportion of correct detections relative to the total stimuli. Given the low frequency of target events inherent to continuous performance paradigms, these values should be interpreted primarily in relation to task structure rather than as absolute indicators of performance. In contrast, the error rate was low overall (M = 0.02, SD = 0.08), suggesting that incorrect responses (both omissions and commissions) were relatively infrequent across sessions. The stability index showed moderate values (M = 0.12, SD = 0.11), with a wide range including negative values. Negative stability values reflect sessions in which error rates and/or reaction time variability exceeded correct responses, which could indicate moments of reduced attentional control. Given that this composite metric combines performance outcomes with reaction time variability expressed in different units, its interpretation should be treated with caution. The observed dispersion may reflect both genuine intra-individual fluctuations in performance and properties of the index itself.
Accuracy of response was high (M = 0.91, SD = 0.17), indicating that a large proportion of emitted responses were correct. As this measure is conditional on responding and does not account for omissions, it should be interpreted as reflecting response precision rather than overall attentional performance. Motor impulsivity values were low on average (M = 0.08, SD = 0.17), suggesting that incorrect or inappropriate responses were relatively infrequent. However, the wide range observed indicates substantial heterogeneity across participants.
Reaction time–based indices further supported the presence of variability in attentional control. Reaction time variability (RTV) showed moderate values (M = 0.20, SD = 0.13), consistent with a pattern of fluctuating attentional engagement. The skewness proxy was close to zero on average (M = −0.01, SD = 0.17), indicating relatively symmetrical response time distributions at the group level, although individual differences suggest that some participants exhibited occasional slow responses. The lapse index (M = 0.11, SD = 0.19) pointing to the presence of intermittent attentional lapses in a subset of participants. However, as this index combines variability and distributional asymmetry, it should be interpreted as an approximate indicator of response irregularity rather than a direct measure of attentional lapses.
Finally, the speed–accuracy efficiency index showed moderate-to-high values (M = 1.70, SD = 0.59), indicating the combined contribution of response speed and accuracy. As with other composite indices, this measure provides a general approximation of performance efficiency and should be interpreted descriptively.
Overall, these findings suggest that participants were generally able to maintain a high level of response accuracy across sessions, while also exhibiting variability in performance metrics. However, given the composite and exploratory nature of the indices, these patterns should be interpreted cautiously, as they may reflect both underlying cognitive processes and characteristics of the metrics themselves.
On average, 88% of the responses were correct, indicating high overall performance, good attention accuracy, and a low average error rate (see
Table 3). The mean performance index (M = 0.88, SD = 0.09) indicates a generally high proportion of responses were correct across sessions. However, given potential ceiling effects, this measure may have limited sensitivity to detect improvements over time. The mean slope was approximately zero (M ≈ 0.00, SD = 0.09), indicating no systematic linear change in performance across sessions. This pattern may reflect early task familiarization, limited variability in mean performance, or constraints in the sensitivity of the index.
Intra-individual variability (SD = 0.09, SD = 0.07), indicated that performance fluctuated across sessions within individuals. However, it should be noted that variability estimates may be influenced by the number of task exposures per participant, with fewer observations potentially leading to less stable estimates.
Correlations between intraindividual performance metrics can be found in
Table 4. Statistically significant results are shown in bold.
Correlation analyses did not reveal significant associations between changes in the clinical measure of the primary hypothesis of the clinical trial (SDQ) and intraindividual performance metrics (p > 0.05 in all cases). However, significant relationships were observed between game-derived indices. The mean performance index was negatively correlated with intraindividual variability (r = −0.45, p = 0.008), indicating that higher performance values was associated with lower variability across sessions. Similarly, the slope was negatively correlated with variability (r = −0.48, p = 0.004), indicating that participants showing more positive trajectories tended to exhibit less fluctuation. No significant association was found between mean performance and slope (r = 0.06, p = 0.73), indicating that baseline performance and trajectories of change were independent. However, these associations should be interpreted cautiously, as both variability and slope estimates may be influenced by the number of observations per participant and by the properties of the indices themselves.
Together, these findings indicate that performance in the SMASHER task is better characterized by stability and variability metrics rather than by linear improvement. While participants rapidly achieved and maintained a high level of accuracy, intra-individual variability and occasional lapses provide a more sensitive index of attentional control dynamics in this population.
4. Discussion
Regarding the first research question, contrary to expectations of linear improvement, performance remained consistently high across sessions, suggesting that participants rapidly reached a stable level of task proficiency. This pattern may reflect a rapid familiarization with task demands, after which performance plateaus due to ceiling effects and a limited margin for further observable gains. Overall, participants demonstrated high levels of performance accuracy (M = 0.88, SD = 0.09), indicating that the task was successfully performed across most sessions. Importantly, the absence of a significant linear trend (slope M ≈ 0.00, SD = 0.09) suggests that performance remained stable over time rather than showing progressive improvement. This stabilization should not be interpreted as a lack of cognitive engagement or intervention impact, but rather as an indication that participants were able to sustain adequate performance under repeated task exposure. Notably, tasks such as SMASHER may be particularly relevant in clinical contexts, as they place sustained demands on attention and were perceived by some participants as monotonous or less engaging, highlighting their ecological validity for assessing sustained attention in ADHD.
Regarding the second research question, intra-individual variability emerges as a potentially informative dimension of performance, capturing fluctuations in attentional control that are not reflected in mean performance levels. This finding is consistent with a substantial body of literature on ADHD, which highlight the importance of engagement and ecological validity in capturing cognitive processes [
15,
23]. However, most prior work has primarily focused on pre–post outcomes, whereas the present study emphasizes continuous, process-based metrics that allow the characterization of performance dynamics over time. Intra-individual variability in performance—rather than mean accuracy—is a more sensitive and ecologically valid indicator of attentional functioning. In particular, increased reaction time variability and performance fluctuations have been identified as core features of ADHD, reflecting lapses in sustained attention and inefficient cognitive regulation [
9,
12]. In this context, improvements in task engagement appear to be better characterized by reductions in intraindividual variability than by increases in mean performance. Thus, the better the performance, the greater the stability (mean performance variability: r = −0.45,
p = 0.008); and the more they improve, the smaller the fluctuations (r = −0.48,
p = 0.004). This is consistent with contemporary models of ADHD that emphasize variability as a core feature of attentional dysfunction [
9,
12,
13,
14]. The improvements in performance were not reflected in changes in the mean level, but rather in reductions in intraindividual variability. The improvement could stem not from an increase in the mean, but from a reduction in variability. However, given the composite and exploratory nature of the indices used in this study, these findings should be interpreted as suggestive rather than definitive evidence.
Regarding the third research question, there is no evidence that the gameplay metrics of the SMASHER mechanics are directly associated with clinical changes. The lack of significant associations with clinical outcomes could reflect limited statistical power, the indirect nature of questionnaire-based measures, or the fact that process-level changes do not directly translate into an overall reduction in symptoms.
Within this framework, stable performance across time may indicate improved regulatory capacity, even in the absence of marked increases in mean accuracy. Taken together, these findings suggest that variability-based metrics may provide complementary information to mean-level performance in the context of adaptive, game-based tasks. In particular, they may offer a more nuanced characterization of performance dynamics, especially in populations such as ADHD, where fluctuations in attentional engagement are common. However, further research using more established and comparable metrics is needed to determine the extent to which these measures capture underlying cognitive processes. In this context, game-based environments introduce dynamic and adaptive task demands that differ from traditional neuropsychological assessments. As a result, process-oriented metrics derived from these environments may capture aspects of performance that are less accessible through static measures. However, the interpretation of these metrics remains dependent on task design and measurement properties, highlighting the need for further methodological development in this area.
One of the most significant limitations was the indices used in this study are composite and exploratory in nature, and in some cases combine measures expressed in different units (e.g., counts and milliseconds), which may affect their interpretability. As such, some observed patterns may reflect properties of the indices themselves rather than purely underlying cognitive processes. Additional limitation of this study is that the lack of data on the number of times the target appeared prevented the calculation of classic attentional indices (e.g., hit rate, false alarm rate, d’). Future versions of the system will incorporate trial-level logging of target presentation to enable the integration of signal detection measures alongside process-based metrics. Collecting other variables in the video game would allow us to capture indices such as Attentional Sensitivity (a composite measure that integrates the accuracy and variability of reaction time), Perseveration (tendency to repeat errors in consecutive trials) or Self-regulation (behavioral adjustment after errors). Furthermore, the differences between participants with ADHD and typical participants are more consistently reflected in non-normal distributions, such as the non-Gaussian distribution [
10,
14], which is characterized by three parameters (µ, σ, and τ); therefore, it would be interesting to estimate reaction times using this model to achieve greater precision in future research. The fact that SMASHER was designed with random stimuli meant that some participants in the clinical trial had to sustain their attention longer than others at the same level when faced with a particular challenge; that is, the target sometimes took longer to appear, making the task more difficult, especially for individuals with ADHD. The difficulty curve of the game mechanics also introduced variability in difficulty between sessions, which can influence performance independently of cognitive change. In addition, participants completed different numbers of SMASHER sessions, which may influence the stability of longitudinal estimates such as slopes and intra-individual variability. Additionally, variability in participant engagement and differences between in-clinic and home-based sessions may have influenced performance. Participants with fewer observations may yield less reliable estimates, potentially affecting between-subject comparisons and correlation analyses. Another limitation of SMASHER is that the high initial performance levels suggest the presence of ceiling effects, which limits the sensitivity for detecting improvements over time. The use of aggregated performance indices may mask more subtle temporal dynamics of attentional fluctuations. Finally, we did not reach the desired sample size due to COVID pandemia restrictions, and may have affected our power to reach more meaningful results. The absence of comparable process-level data in the control group precluded between-group analyses.
These findings should be considered preliminary and require replication in larger samples and with complementary statistical approaches.
In future lines of research, it would be important to improve data collection by incorporating variables such as the number of times the target appears to allow signal detection analysis (e.g., d’, response bias), develop indices based on variability and error dynamics (e.g., post-error deceleration, lapse frequency), apply mixed-effects models to separate within-subject change from task difficulty, examine associations between performance stability and clinical outcomes (e.g., improvements in emotion regulation), and explore adaptive difficulty calibration to optimize sensitivity to change.
ADHD is characterized by marked heterogeneity in cognitive and behavioral profiles [
8,
12]. In this context, analyzing intra-individual differences—such as strengths, difficulties, performance dynamics, and patterns of change over time—may contribute to more precise assessment and individualized treatment approaches. These metrics can provide clinically relevant information that goes beyond average performance by capturing fluctuations in attentional control over time. In practice, they could help clinicians identify periods of greater instability or variability, which might not be reflected in standard pre-post assessments, and monitor how consistently a patient maintains their performance after repeated exposures. From a functional perspective, variability-based indices may be particularly relevant for ADHD, as they reflect moment-to-moment regulation rather than a static capacity. Because these measures are derived from ecologically valid game-based tasks involving sustained engagement, adaptive demands, and distraction, they may better approximate real-world attentional challenges than traditional laboratory assessments. Finally, these findings highlight the importance of optimizing adaptive difficulty in digital interventions. Specifically, dynamically adjusting task demands to maintain an optimal level of challenge could reduce ceiling effects and increase the sensitivity of performance metrics to detect significant cognitive changes over time. It would be interesting to conduct exploratory analyses of the other games in The Secret Trail of Moon, since other gameplay mechanics (TEKA TEKI, ENIGMA, KUBURI, CHESS) may have greater engagement than SMASHER, as well as a better adjustment to the difficulty curve (no random stimuli).




 ,
,