


Abstract
This study compiles and harmonizes a dataset on the reference service life (RSL) of non-structural building envelope materials in North America. Data was collected from survey-based published reports and Environmental Product Declarations (EPDs) sourced from either manufacturers’ websites or recognized EPD databases. Relevant North American EPDs were reviewed for RSL or equivalent terms, and the extracted RSL values were recorded and classified by material type. The resulting dataset consolidates survey-based service life values, EPD-derived RSLs, together with their reported frequencies, and the extent of missing data. Analysis of the dataset revealed significant data gaps and strong inconsistencies in currently available RSLs. Many published values are based on client surveys or fixed categorical assumptions, overlooking product-specific durability and often relying on data more than 20 years old. These values do not reflect current manufacturing technologies or construction practices. Furthermore, over half of the reviewed EPDs do not report any RSL, while most of the remaining EPDs simply use default values of 60 or 75 years without clear justification. Although the dataset supports sensitivity and uncertainty analyses in building environmental assessments, the findings underscore the lack of reliability and transparency in existing RSL data and highlight the necessity for a consistent and transparent RSL dataset.
Dataset: https://doi.org/10.4224/40003877
Dataset License: Open Government License—Canada https://open.canada.ca/en/open-government-licence-canada (accessed on 28 November 2025)
1. Summary
LCA provides a comprehensive framework for evaluating the environmental impacts of buildings throughout their entire life cycle, from material extraction to construction, operation, and end of life. One of the key sources of uncertainty in such assessments is the RSL of building materials as defined by CSA S478 “The actual period of time during which the building or any of its components performs without unforeseen costs or disruption for maintenance and repair” [1]. This uncertainty is especially important for non-structural materials such as finishes, cladding, flooring, insulation, and glazing [2], which are typically the most frequently replaced elements due to wear, changing aesthetics, or evolving performance requirements. As a result, non-structural components undergo multiple replacement cycles over a building’s lifespan, leading to repeated resource consumption and waste generation. This high replacement rate (RR) results in a cumulative environmental impact that can be substantial and, in some cases, even comparable to that of core structural elements over a building’s lifespan.
This study is intended to emphasize the need for a reliable RSL dataset of non-structural building envelope materials. The approach involved includes the following: (1) compiling survey-based and experimentally derived service life data as obtained from the literature; (2) extracting all available RSL values from Environmental Product Declarations (EPDs) for non-structural building envelope materials available in North America, and; (3) organizing the findings into a detailed dataset and analyzing the data to identify existing inconsistencies and knowledge gaps.
Value of the Data
- Highlights data gaps and inconsistencies:
Reveals significant inconsistencies, variations, and gaps in existing EPDs and technical reports, underscoring the need for more reliable, transparent, and standardized data.
- Informs manufacturers and EPD developers:
Offers insights into current reporting practices across product categories, helping manufacturers and EPD program operators identify gaps and prioritize experimental validation to establish credible, product-specific RSLs.
- Addresses underrepresented Materials:
Brings attention to non-structural building materials, often overlooked in existing datasets, despite their significant cumulative environmental impact due to high replacement rates.
- Provides a reference point for estimating service life (ESL):
Offers readily available reported RSL values for researchers using methods like the factor method to estimate service life (ESL). This enables verification of assumptions, comparison of alternatives, and identification of cases where experimental data might be needed.
- Improves robustness of life cycle assessment (LCA) and life cycle cost (LCC):
Provides researchers with clearer insight into commonly assumed values and enables evaluation of their influence on LCA and LCC outcomes.
- Supports development of region-specific databases:
Serves as a foundational input for regionally representative LCA databases by reflecting North American practices and highlighting where localized or updated service life data are required.
- Guides policymakers’ standardization efforts:
Highlights deficiencies in current RSL reporting and supports the need for improved methodological guidance, verification protocols, and harmonized standards for non-structural building components.
2. Research Background
A review of previous research with similar backgrounds is provided to permit identifying pertinent studies, highlighting existing knowledge gaps, and defining the research objectives.
Silva and De Brito [3] systematically conducted a systematic review of the service life of building envelope components across climates and found that sampling-based studies yielded more consistent estimates. They compiled a practical database to guide climate-responsive maintenance strategies and improve the accuracy of life cycle assessment assumptions. Emídio, de Brito [4] conducted a comprehensive study on service life estimation of natural stone cladding using the factor method, which was based on empirical data collected from 269 stone claddings in Portugal. The study identified various key factors that influenced the durability of stone cladding, including material characteristics, design, execution quality, environmental conditions, usage conditions, and maintenance practices. It was established that the average RSL for stone claddings was approximately 70 years, as derived from multiple methods that produced consistent results. Specifically, the use of degradation curves suggested a service life of 69 years, whereas other methods yielded values of 67.2 years and 73.7 years. Execution quality emerged as a significant factor, with poorly executed claddings experiencing a 70.4% reduction in service life. Additionally, claddings exposed to mild environmental conditions had an estimated service life of 78 years, compared to 71 years for those in harsher climates.
The study by Galbusera, De Brito [5] evaluated the factor method for predicting the service life of ceramic external cladding using data from 195 building façades in Lisbon, Portugal. Their findings confirmed the reliability of this method for providing ESL values by explicitly modeling causes of degradation, such as installation quality and maintenance. An RSL of 51 years was established for ceramic tile façades, with ESL values adjusted to reflect local conditions. This framework supports more effective maintenance planning and can reduce both costs and environmental impacts.
Hoxha, Bazzana [6] examined how variability and uncertainty in RSL values of building components affect LCA results for single-family houses. They analyzed 16 residential buildings located in France with diverse structures and materials and determined that materials such as windows, glass wool, and polyvinyl chloride (PVC) significantly contribute to GHG emissions and uncertainty. In contrast, materials such as gravel and polyethylene have minimal impact on GWP uncertainty, whereas PVC and polyurethane (PUR) demand more precise service life data to improve the accuracy of the assessment.
Francart and Malmqvist [7] explored the impact of service life assumptions on design choices through a roofing case study. Their Monte Carlo simulations showed that clay tile roofs were more environmentally favorable than asphalt roofs in approximately two-thirds of the scenarios examined when maintenance was considered.
Jorba, Palumbo [8] analyzed the environmental impacts of wooden windows in Italy using existing EPDs and LCA data. They reported a range of service life values for wooden windows, from 25 to 75 years. Their sensitivity analysis on the effect of different service life values in LCA results showed that extending the service life from 34 to 60 years increased environmental impacts by approximately 176%, with total environmental impacts ranging between 200% and 267%.
Morales, Reguly [9] focused on showing the impact of different service lives for external and internal paint and cement plaster. Their study used various RSL values cited in different standards to demonstrate how these differences affect the wbLCA of a case study building with masonry clay hollow brick walls. They found that the variation in RSLs can lead to differences in wbLCA results ranging from 9.4% to 162.4%.
A review of relevant articles and standards highlighted the critical role of RSL when using the factor method for calculating the ESL, maintenance planning, and especially LCA and LCC calculations. Most existing studies focus on a limited range of materials (usually between one and five types) and report RSL values specific to those materials. Others rely on a narrow set of sources, such as surveys, reports, or previously published articles, to discuss the influence of RSL on LCA, LCC, or other related objectives.
Also, it is apparent from the work completed in this review that studies focusing on the RSL of non-structural materials are fewer than those addressing structural materials. Moreover, there is no comprehensive dataset available for non-structural materials. However, non-structural elements, such as interior finishes, cladding, flooring, insulation, and partition systems, play a significant role in both the functionality and environmental performance of buildings. Since these products are frequently replaced due to wear, aesthetic changes, or updated performance standards, this, in turn, leads to repeated cycles of material use and waste generation throughout a building’s lifespan.
To conclude, a detailed review of the literature informed the objective of this study by identifying two critical gaps that require focused attention: (i) the absence of a dedicated North American focus aligned with the Canadian market context, and (ii) the lack of harmonization between two fundamentally different RSL information streams, namely survey-based data and EPD-based declarations. Addressing these gaps supports a more regionally relevant and methodologically integrated approach to RSL data.
3. Data Description
The information provided in Table 1 and Table 2 was developed by compiling RSL values for selected non-structural building materials using two primary sources: published service life reports and EPD databases. To ensure consistent comparison, both tables were organized according to a unified set of component categories, namely the following: Insulation, Façade (cladding), Gypsum and Plaster, Plastic, Membranes and Roofing, Wood, Windows, Glass, and Coatings and Pastes.
Table 1.
The RSL values for non-structural materials were extracted from survey-based sources, including reports from InterNACHI, NAHB, and CMHC.
Table 2.
Summary of extracted data from EPDs and associated replacement rate.
Service life estimates from published reports were classified into material categories based on their closest similarities, particularly following the categorization methods used by the InterNACHI (US) and the NAHB (US), as both provide closely aligned frameworks. The detailed subcategories derived from these published sources are presented in Table 1, whereas the corresponding subcategories compiled from EPD data are shown in Table 2 for clarity and direct comparison between the two datasets.
3.1. RSL from Reports
In Table 1, service life estimates taken from InterNACHI (US), NAHB (US), and CMHC (CA) are compared, highlighting both areas of alignment and notable discrepancies. For insulation materials, InterNACHI and NAHB consistently rate the service life of materials such as Fiberglass, Cellulose, and Rockwool at over 100 years or “lifetime,” whereas CMHC does not report any values for insulation. The same applies to wood products, where U.S. sources provide estimates of 60 years for OSB and particle board and 30 years for softwood, whereas CMHC provides no data. In the Cladding category, the contrast is particularly pronounced: InterNACHI and NAHB estimate brick cladding to last about 80 years to lifetime, whereas CMHC reports a median service life of around 35 years. For Stucco/EIFS, InterNACHI lists a lifespan of around 25 years, CMHC reports a median of 21 years, and NAHB provides a much broader range of 50–100 years. Roofing materials also show variation: Modified Bitumen is listed at 10 years by InterNACHI, 20 years by NAHB, and approximately 22 years by CMHC. Conversely, for metal roofing, InterNACHI and CMHC report similar values of 17–25 years, whereas NAHB does not provide any data. Categories such as Gypsum, Plaster, and Adhesives reveal significant inconsistencies between the U.S. sources and CMHC, making it difficult to identify materials with uniformly reported values across all three sources. Wood-framed windows demonstrate a variability of about 15 years between U.S. sources, whereas window glass shows much greater consistency, with differences reduced to only around 2 years.
Overall, such variations demonstrate the impact of inconsistent reported service life values on the calculation of replacement rates (RR). Such discrepancies can lead to significant errors in professional assessments, including building LCC and LCA. Furthermore, when determining the ESL of materials, relying on inconsistent RSL values within impact factor formulas can result in misleading outcomes, emphasizing the need for harmonized and transparent reporting standards.
3.2. RSL Values from EPDs
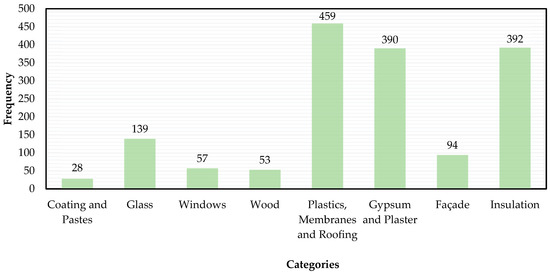
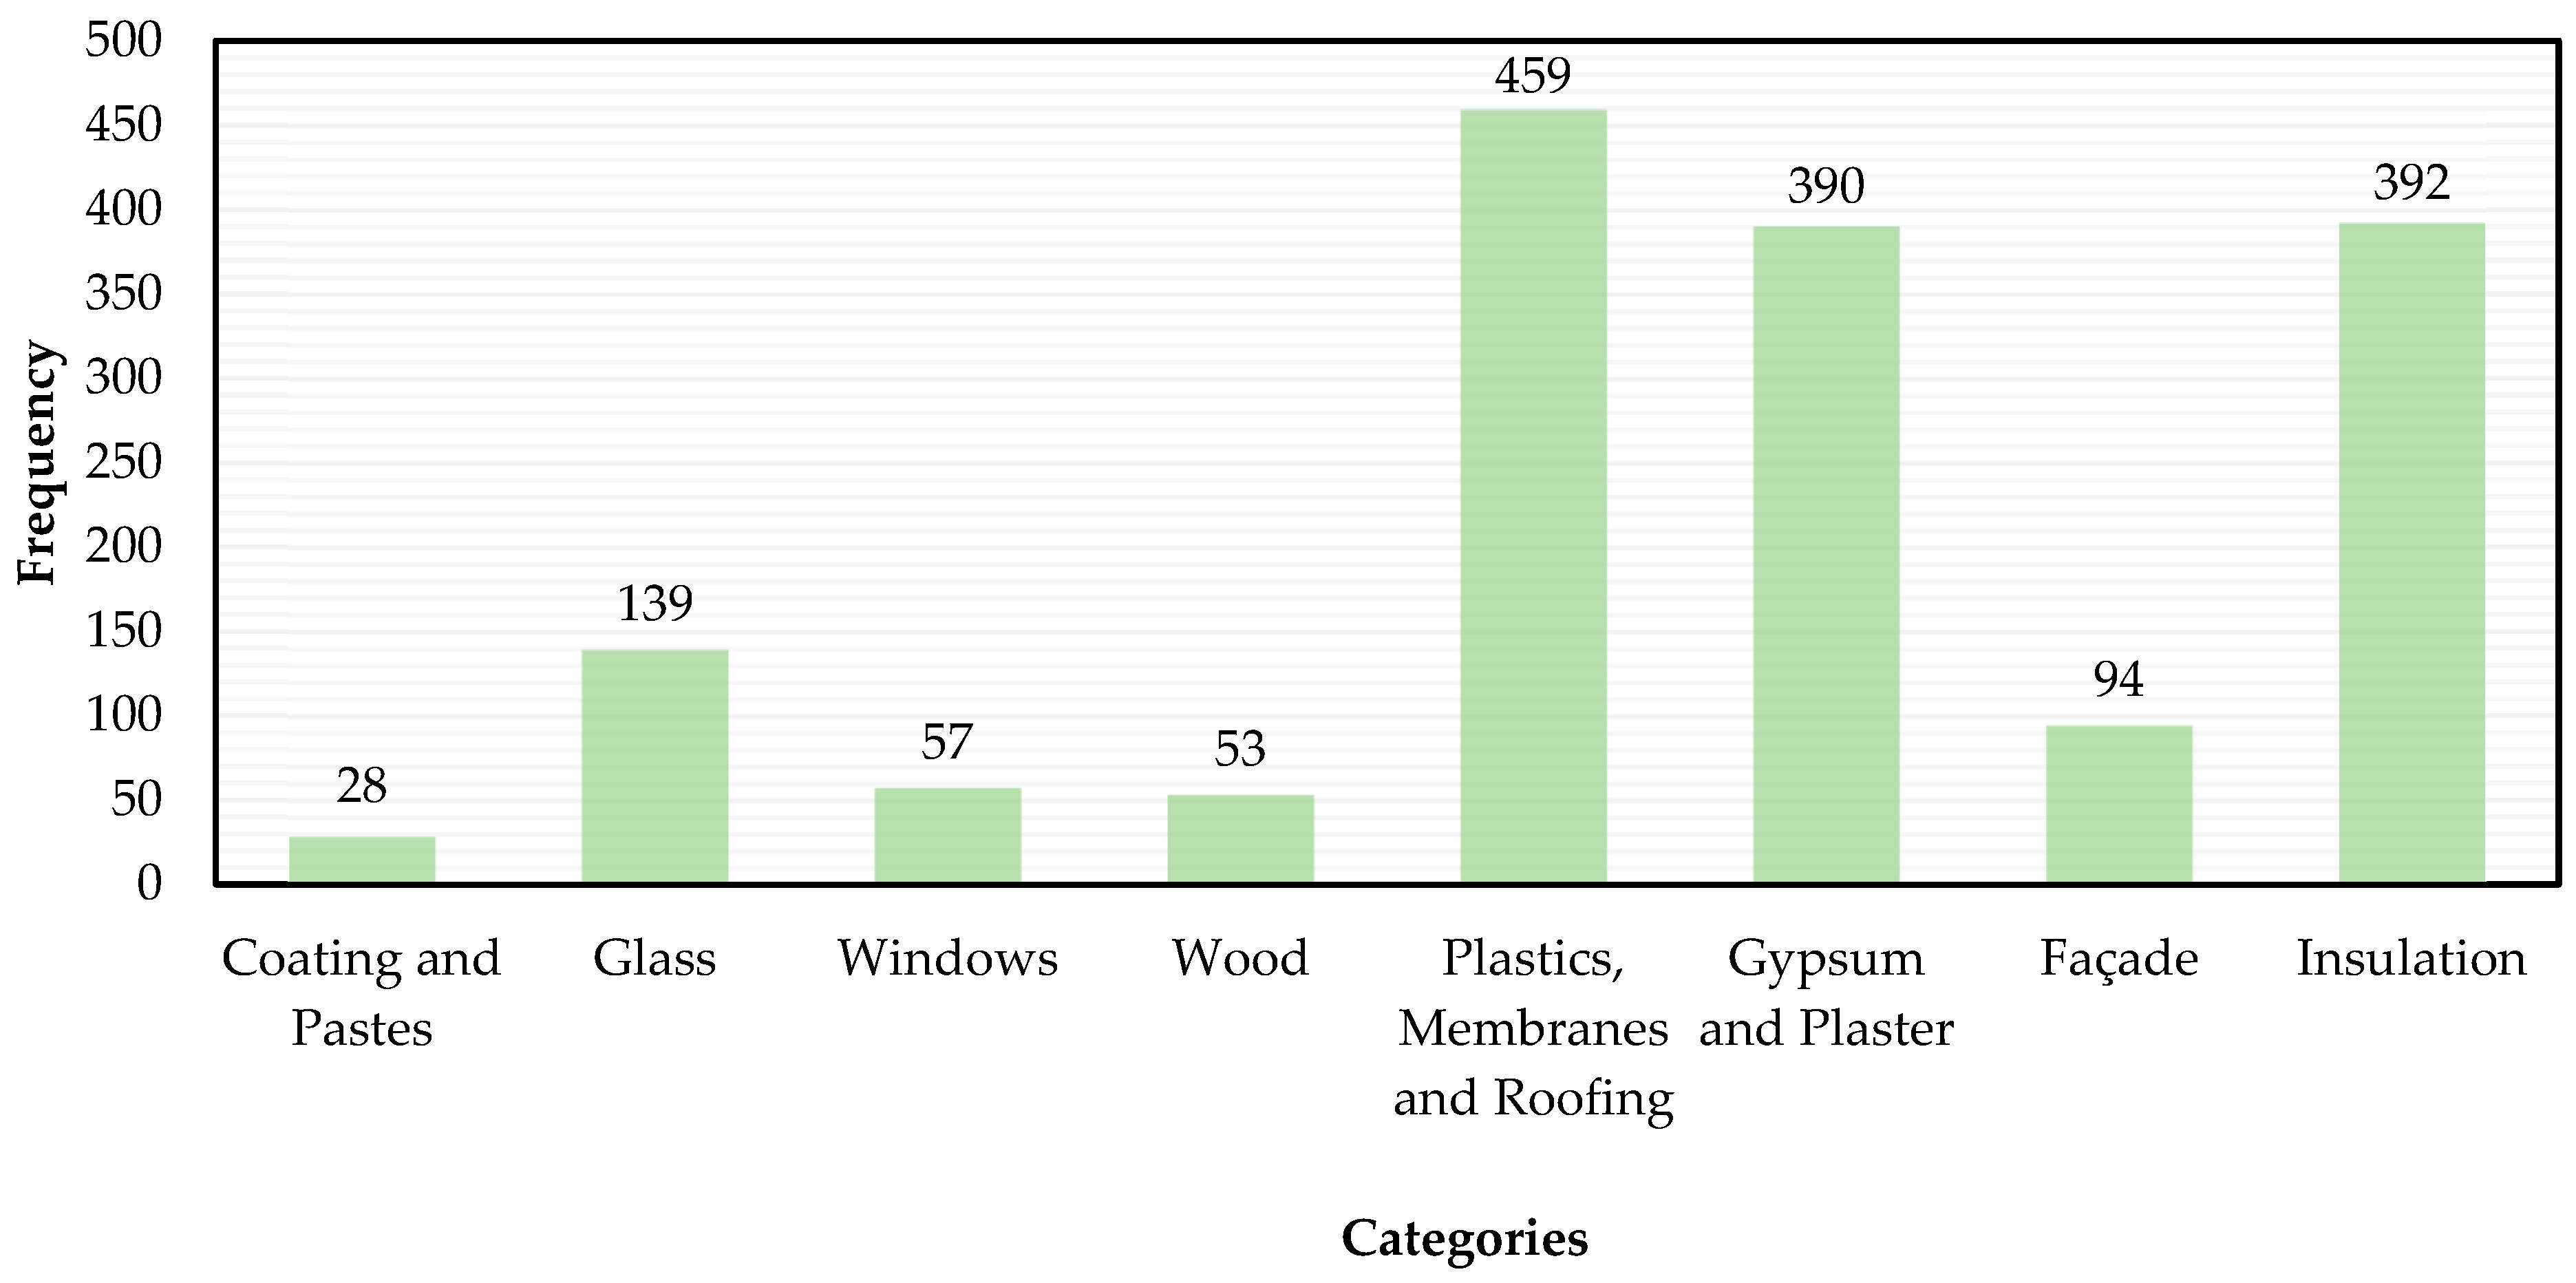
After filtering all identified EPDs according to the previously defined classification and excluding non-conforming products, a total of 1612 relevant EPDs were identified. Figure 1 shows the distribution of EPDs across each category. Among these categories, “Plastics, Membranes and Roofing” has the highest number of EPDs at 459, indicating a substantial focus on these materials within the industry. Following closely are “Insulation” and “Gypsum and Plaster,” with 392 and 390 EPDs, respectively. “Glass” represents a moderate portion with 139 entries, whereas “Façade,” “Wood,” and “Windows” fall within a lower range of 53 to 94 EPDs. The category of “Coating and Pastes” has the least number of EPDs at 28.
Figure 1.
Number of collected EPDs in each building component category.
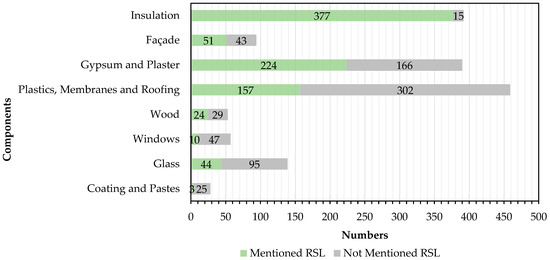
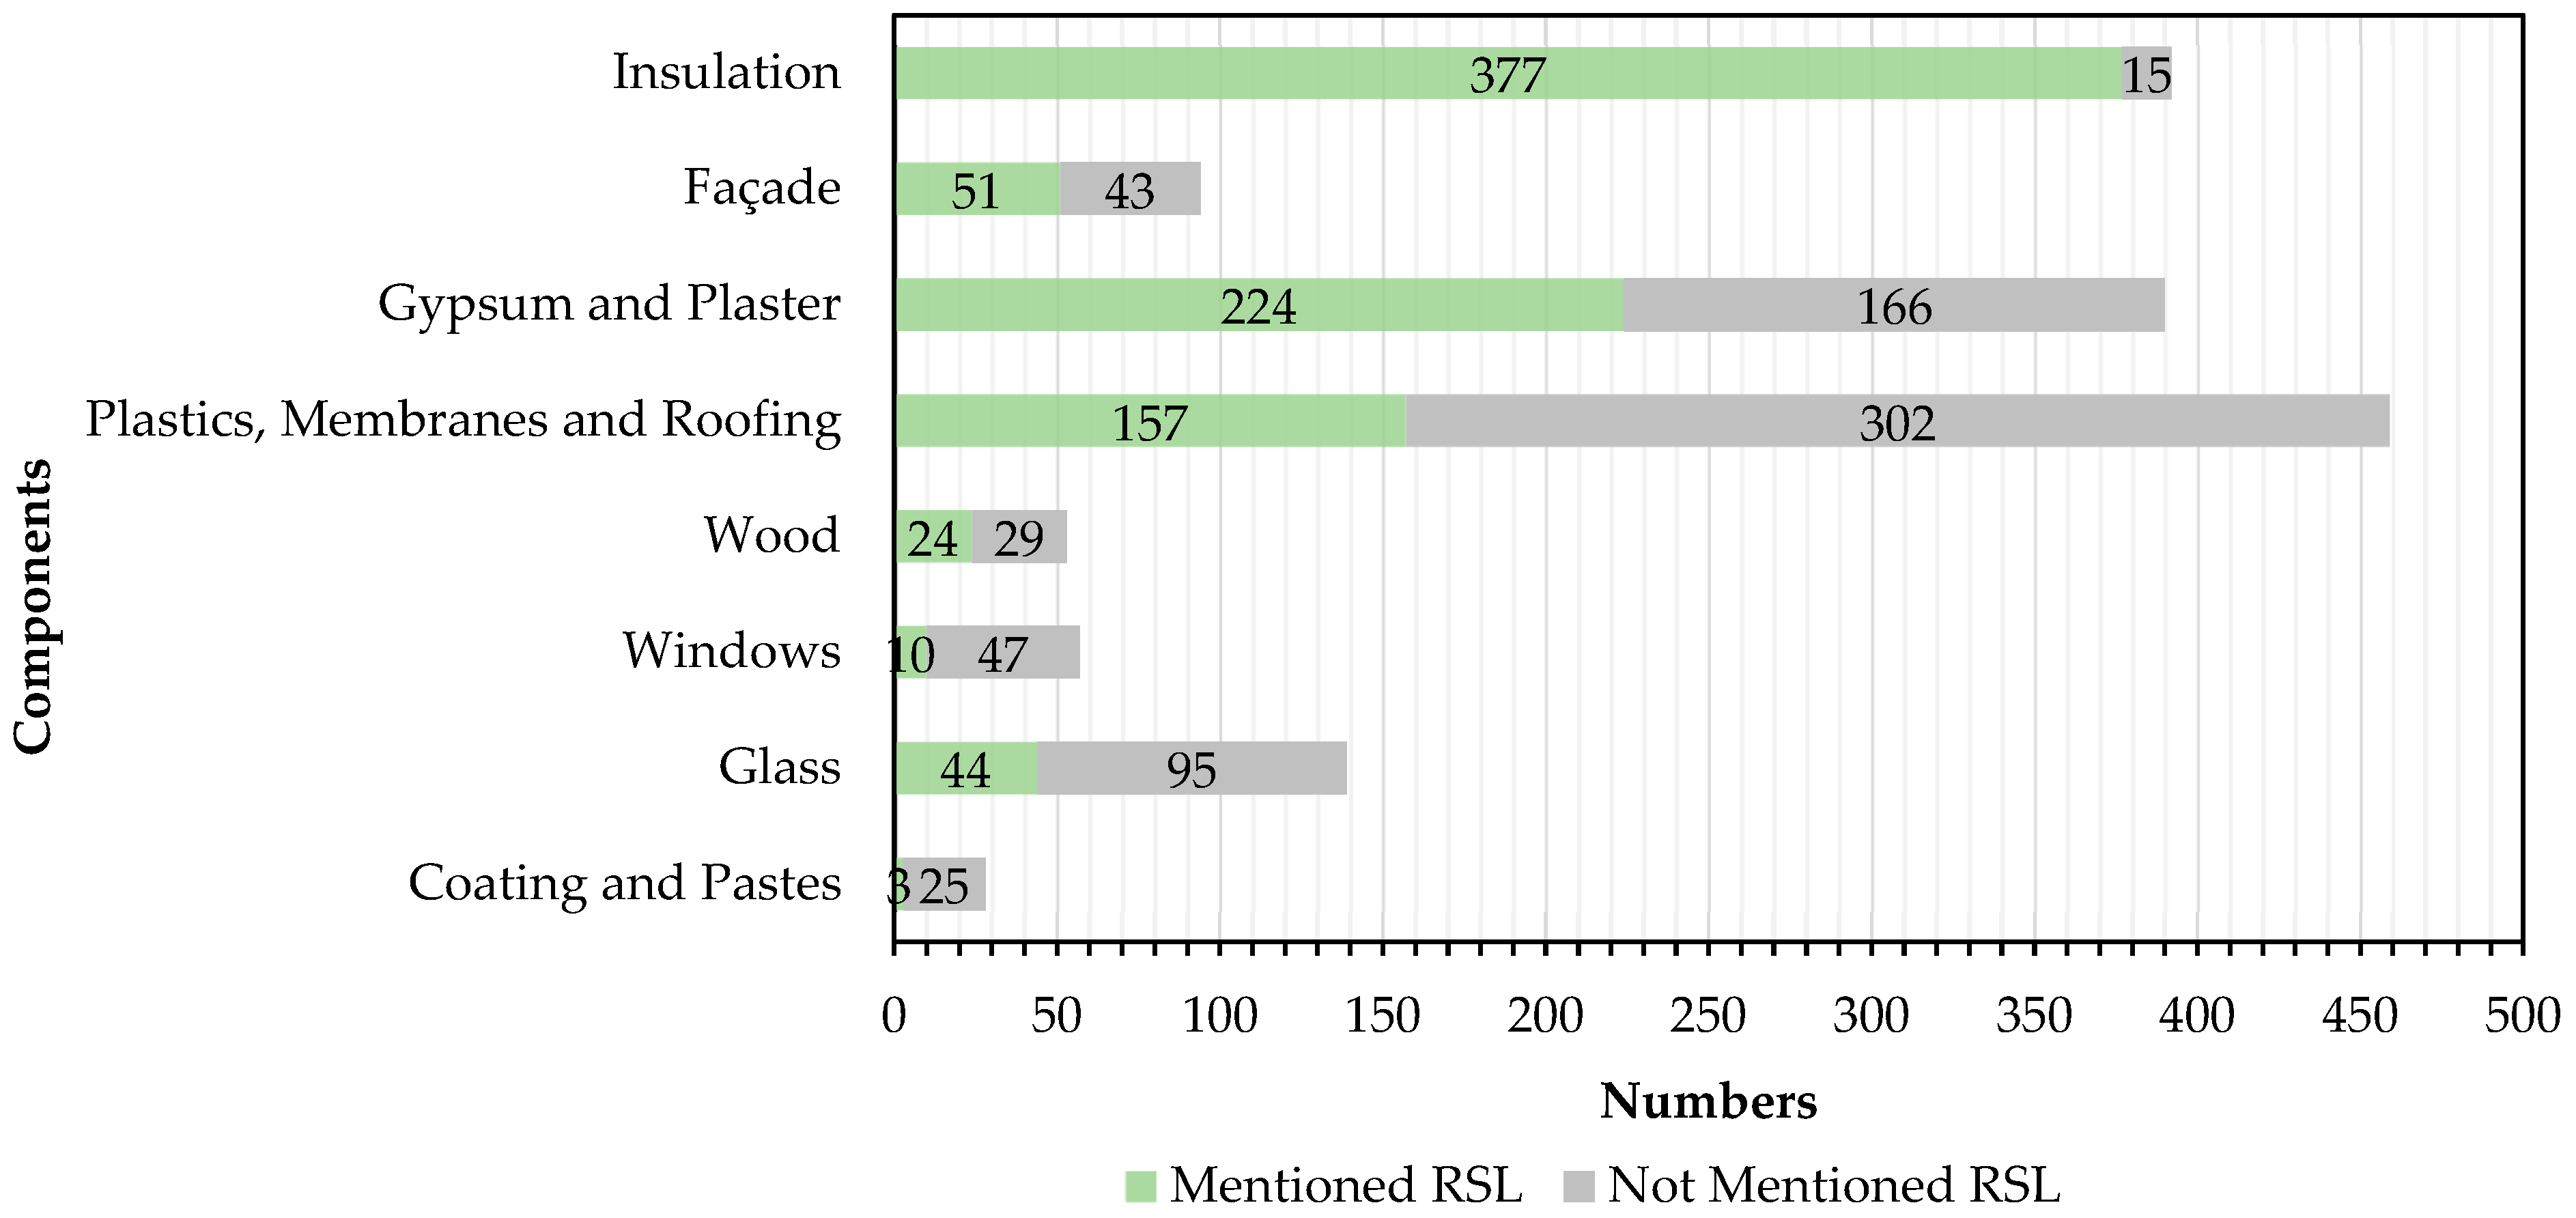
Following the collection of all the EPD documents, the RSL identification process was conducted. Figure 2 shows, by components, the number of EPDs that explicitly mention the RSL value versus those that do not. The “Insulation” category shows the highest frequency of RSL inclusion, with 377 EPDs referencing RSL and only 15 omitting it, reflecting a strong emphasis on service life considerations. In contrast, “Plastics, Membranes and Roofing” shows a significant number of EPDs lacking RSL information (302), compared to 157 that include it, indicating a lower prioritization in respect to service life. Similarly, “Gypsum and Plaster” have a greater number of EPDs without RSL being mentioned (166) than mentioned (224). Categories such as “Glass” and “Coating and Pastes” also show a notable absence of RSL data, with 95 and 25 instances, respectively, exceeding the number of mentions.
Figure 2.
Distribution of reported and unreported RSLs across building component categories.
Overall, the findings reveal that while over 890 EPDs report RSL for their materials, 722 do not mention any RSL value (almost half of the total). This suggests that many companies may underestimate the importance of disclosing this factor. It also highlights a critical gap in current standards, which do not adequately emphasize the significance of reporting RSL in EPDs.
All reported RSLs for each product were systematically extracted and compiled into a dataset. Table 2 presents a summary of the collected values (V)and their frequencies (F), which enables a clear overview of the distribution and diversity of RSL values across different building materials and components. Those subcategories, such as wooden and steel/aluminum frames, or OSB and plywood, which did not have any reported values, were excluded. There is a column in this table that shows the source of each reported value and the frequency of each source for that specific value. The sources were classified into three types (T). Type A includes values declared based on recognized standards such as UL Environment Standard 10010 [10], the National Institute for Standards and Technology (NIST) [11], published survey reports such as NAHB [12] and InterNACHI [13], or values assumed to be equal to the building life span. Type B includes cases where no source is mentioned for the RSL declaration. Type C includes warranty values provided by the manufacturer, based on company experience or laboratory testing. For example, in the first row of the table for glass wool, two RSL values were reported across all collected EPDs, which are 60 and 75 years. All reported cases of the 60-year value were classified as Type A, meaning they were declared based on standards or assumed to be equal to the building life span. For the 75-year value, which has a frequency of 59, 30 were classified as Type A and 29 were reported without any source mentioned in their EPDs and therefore classified as Type B. This structure helps users of the dataset understand the basis behind each reported value and supports more transparent and informed RSL selection.
In addition, the last column in Table 2 introduces the replacement rate (RR) for each product over a 75-year building lifespan. According to CSA S478, the service life of a multi-unit residential building typically ranges from 50 to 99 years. For the purpose of this study, a representative average value of 75 years was selected to define the total service life (TSL) of the building [1].
As shown in Equation (1), in this study, the calculation of the number of replacements (NR) follows the EN 15978 [14] approach, where the NR is derived from the ratio of the building TSL to the RSL of the product, with the initial installation not counted as a replacement. So, all calculated replacement numbers are applied within the relevant life cycle modules where replacement or refurbishment occurs.
In accordance with EN 15978 [14], the NR for envelope components was rounded up. This decision reflects the critical functional role of building envelope materials in protecting the building from environmental exposure and ensuring performance over the full building life. While the standard allows rounding down in specific cases, such as windows when a replacement would occur very close to the end of the building life, this condition did not apply in the present dataset. For example, for windows with reported reference service lives of 30 or 40 years and a building service life of 75 years, replacements occur at 30 and 60 years, which are not close to the end of the building life.
To highlights the critical importance of accurate RSL data in estimating both carbon footprint and life cycle cost estimations, for example, a Plastic Membrane product may require replacement anywhere from seven times to “not at all” during a 75-year building life. Omitting RSL values can lead to significant inaccuracies in environmental and economic assessments.
The subsequent sections provide a detailed interpretation and discussion of findings for each component group.
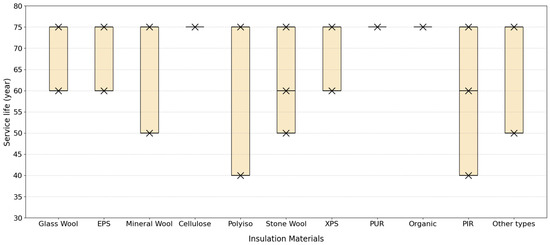
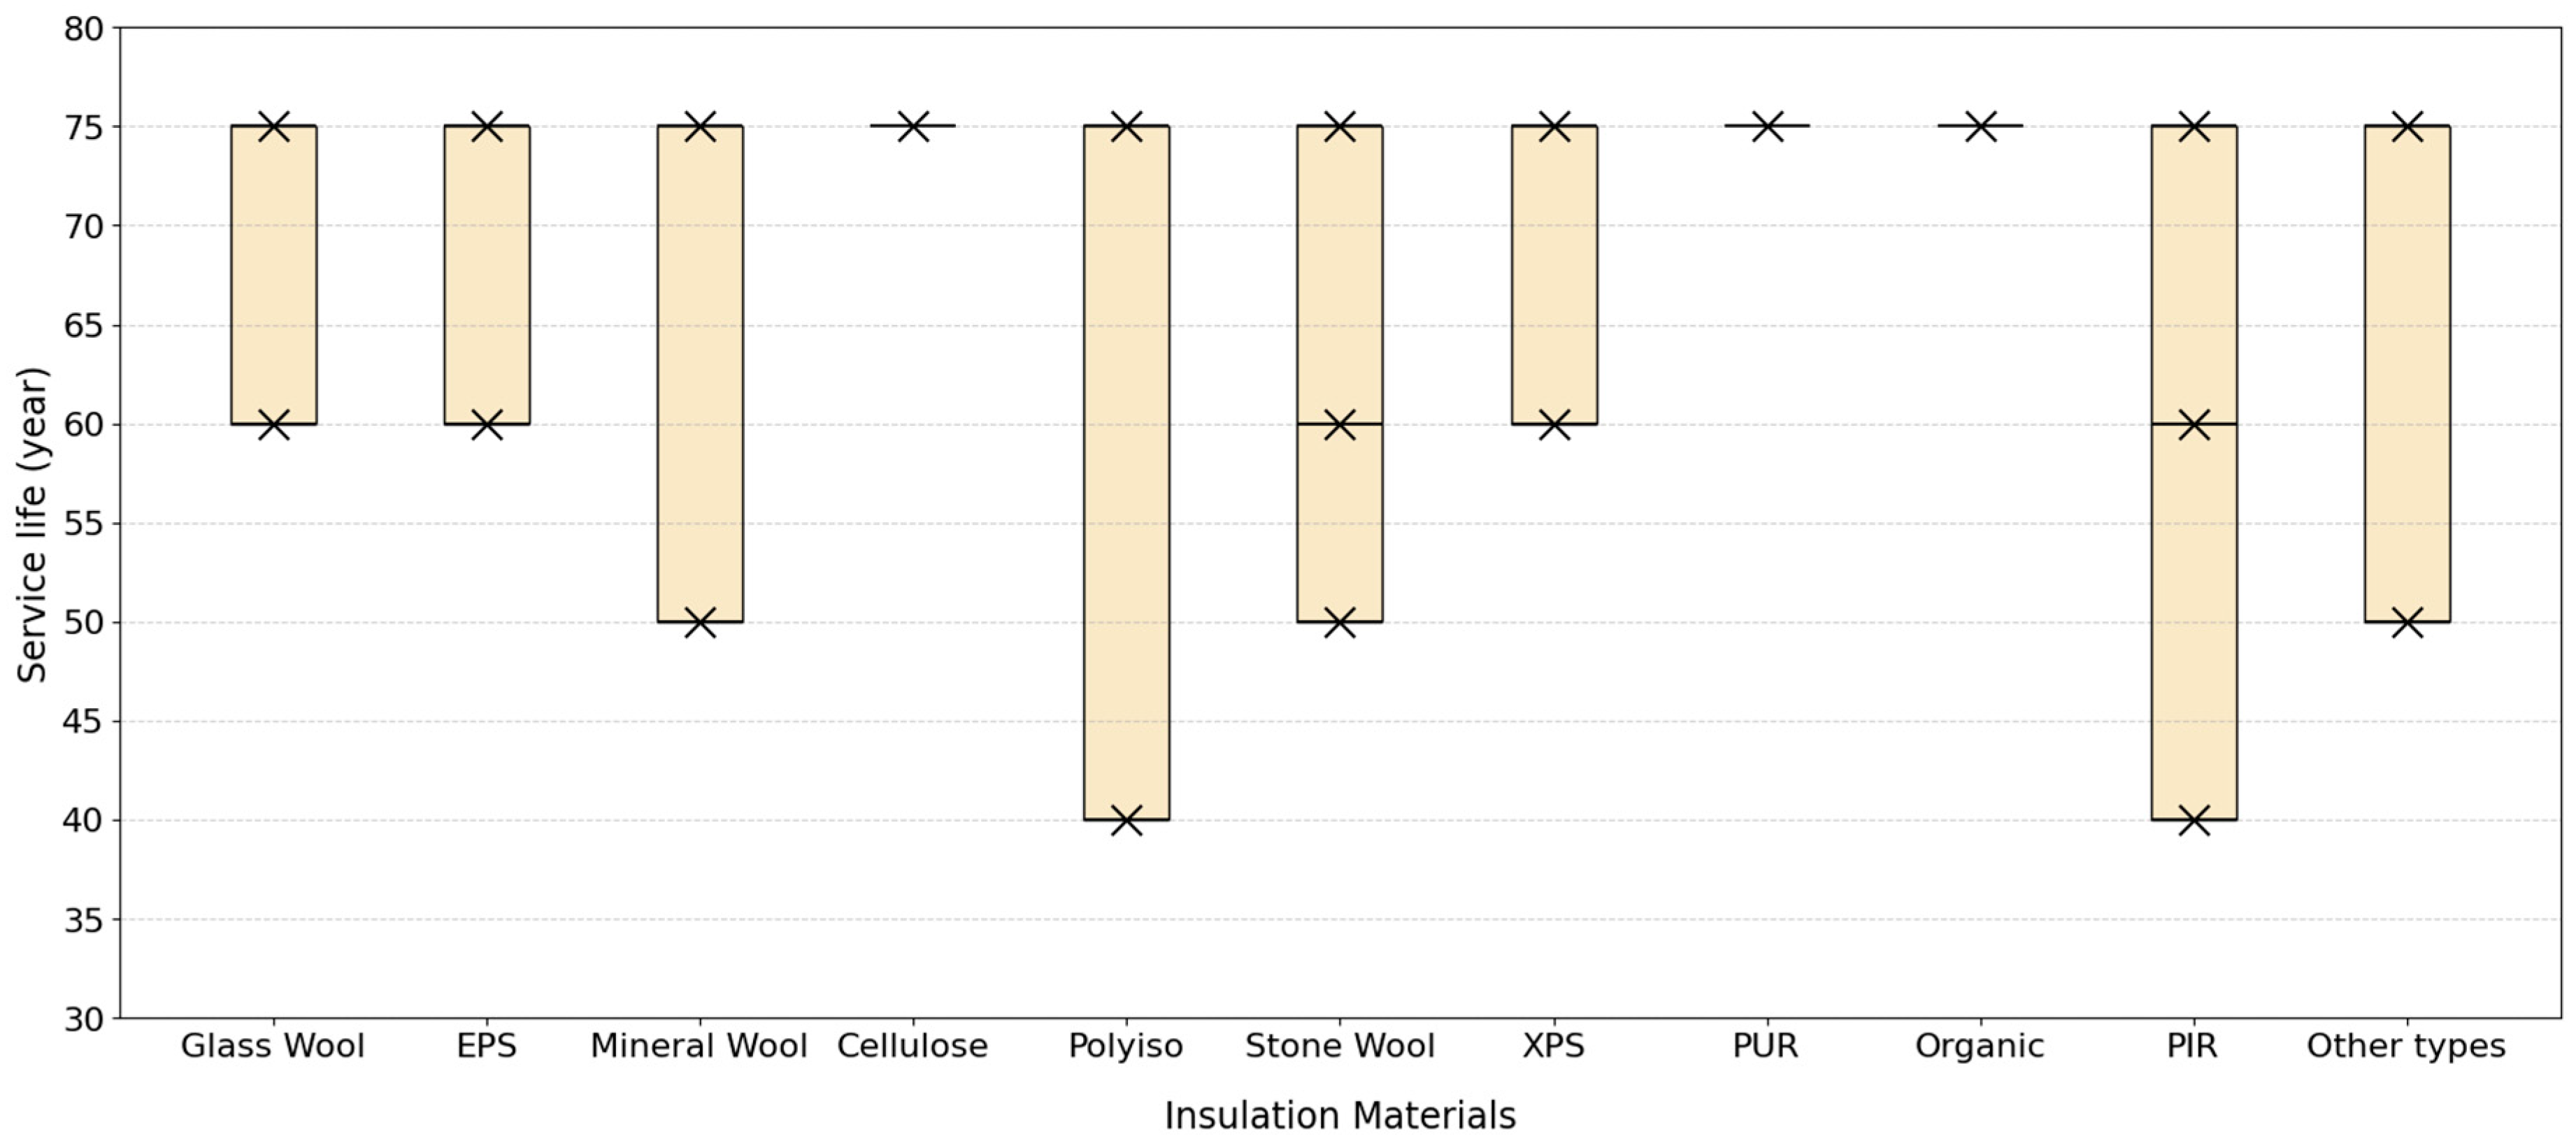
Figure 3 illustrates the service lifespan range of various insulation materials. Black markers indicate individual RSL values. The yellow shaded band represents the gap between reported RSL values for each material. All products show a maximum service life of 75 years, but the minimum values vary notably across categories. Glass Wool, EPS, XPS, and PUR have a minimum service life of 60 years, while Mineral Wool, Stone Wool, and Other types show a lower threshold of 50 years. Also, Polyiso and PIR have the lowest minimum values, at 40 years. This figure highlights the range and variability in values of service life among insulation materials, emphasizing the importance of material selection in long-term building performance and life cycle planning.
Figure 3.
Service life range of all insulation materials.
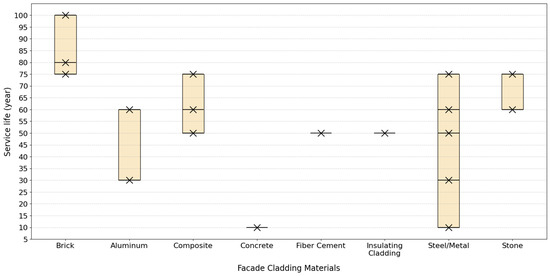
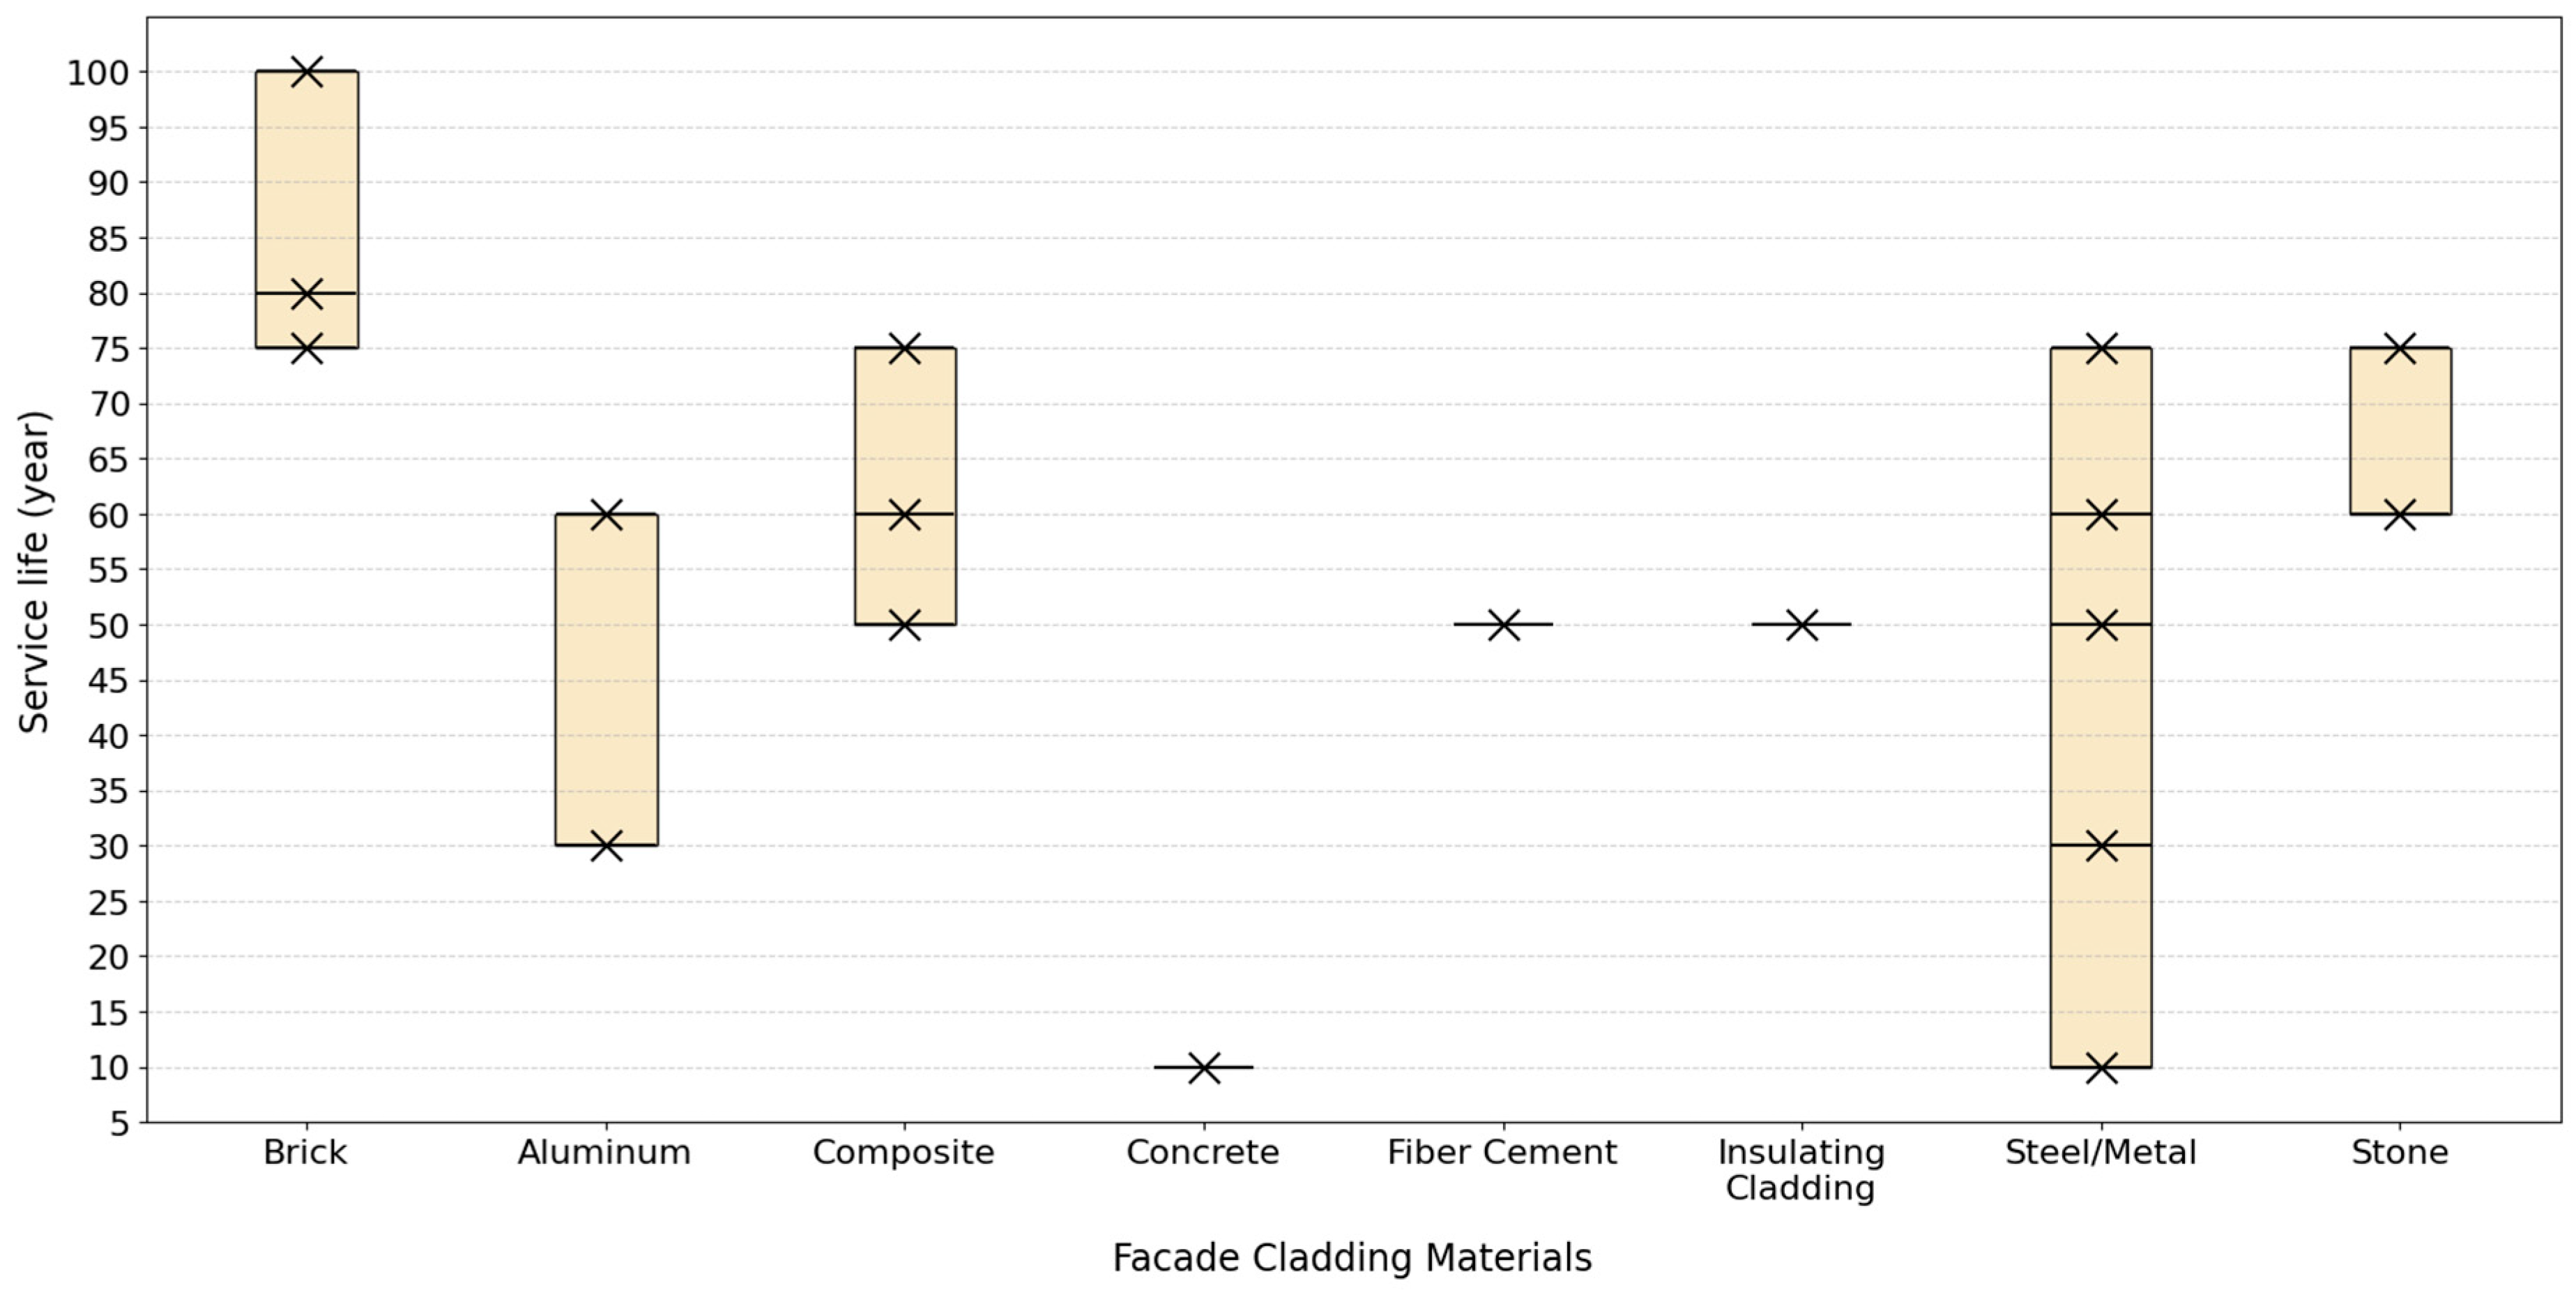
Figure 4 presents the varying service life spans of different façade materials. Brick exhibits the longest service life, ranging from 75 to 100 years. Composite materials fall within a moderate service life of 50 to 75 years, whereas non-structural Concrete façade coverings show the shortest service life, at just 10 years. Fiber Cement and Insulating Cladding both have similar values, with a 50-year RSL. Steel and Metal façade cladding display a broad range, from 10 to 75 years, with a median service life of around 50 years. Stone cladding lies between 60 and 75 years. Overall, the façade category demonstrates one of the most diverse service life profiles among all building components, reflecting the wide spectrum of materials used, from highly durable materials, such as Brick, to less durable ones such as Steel and Metal panels.
Figure 4.
Service life range of all façade materials.
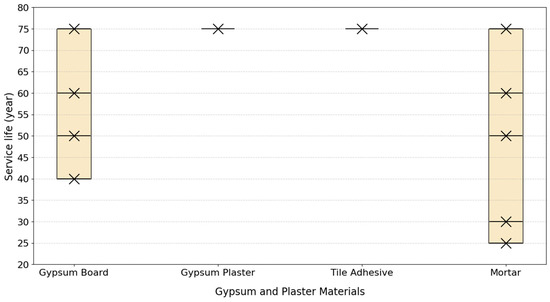
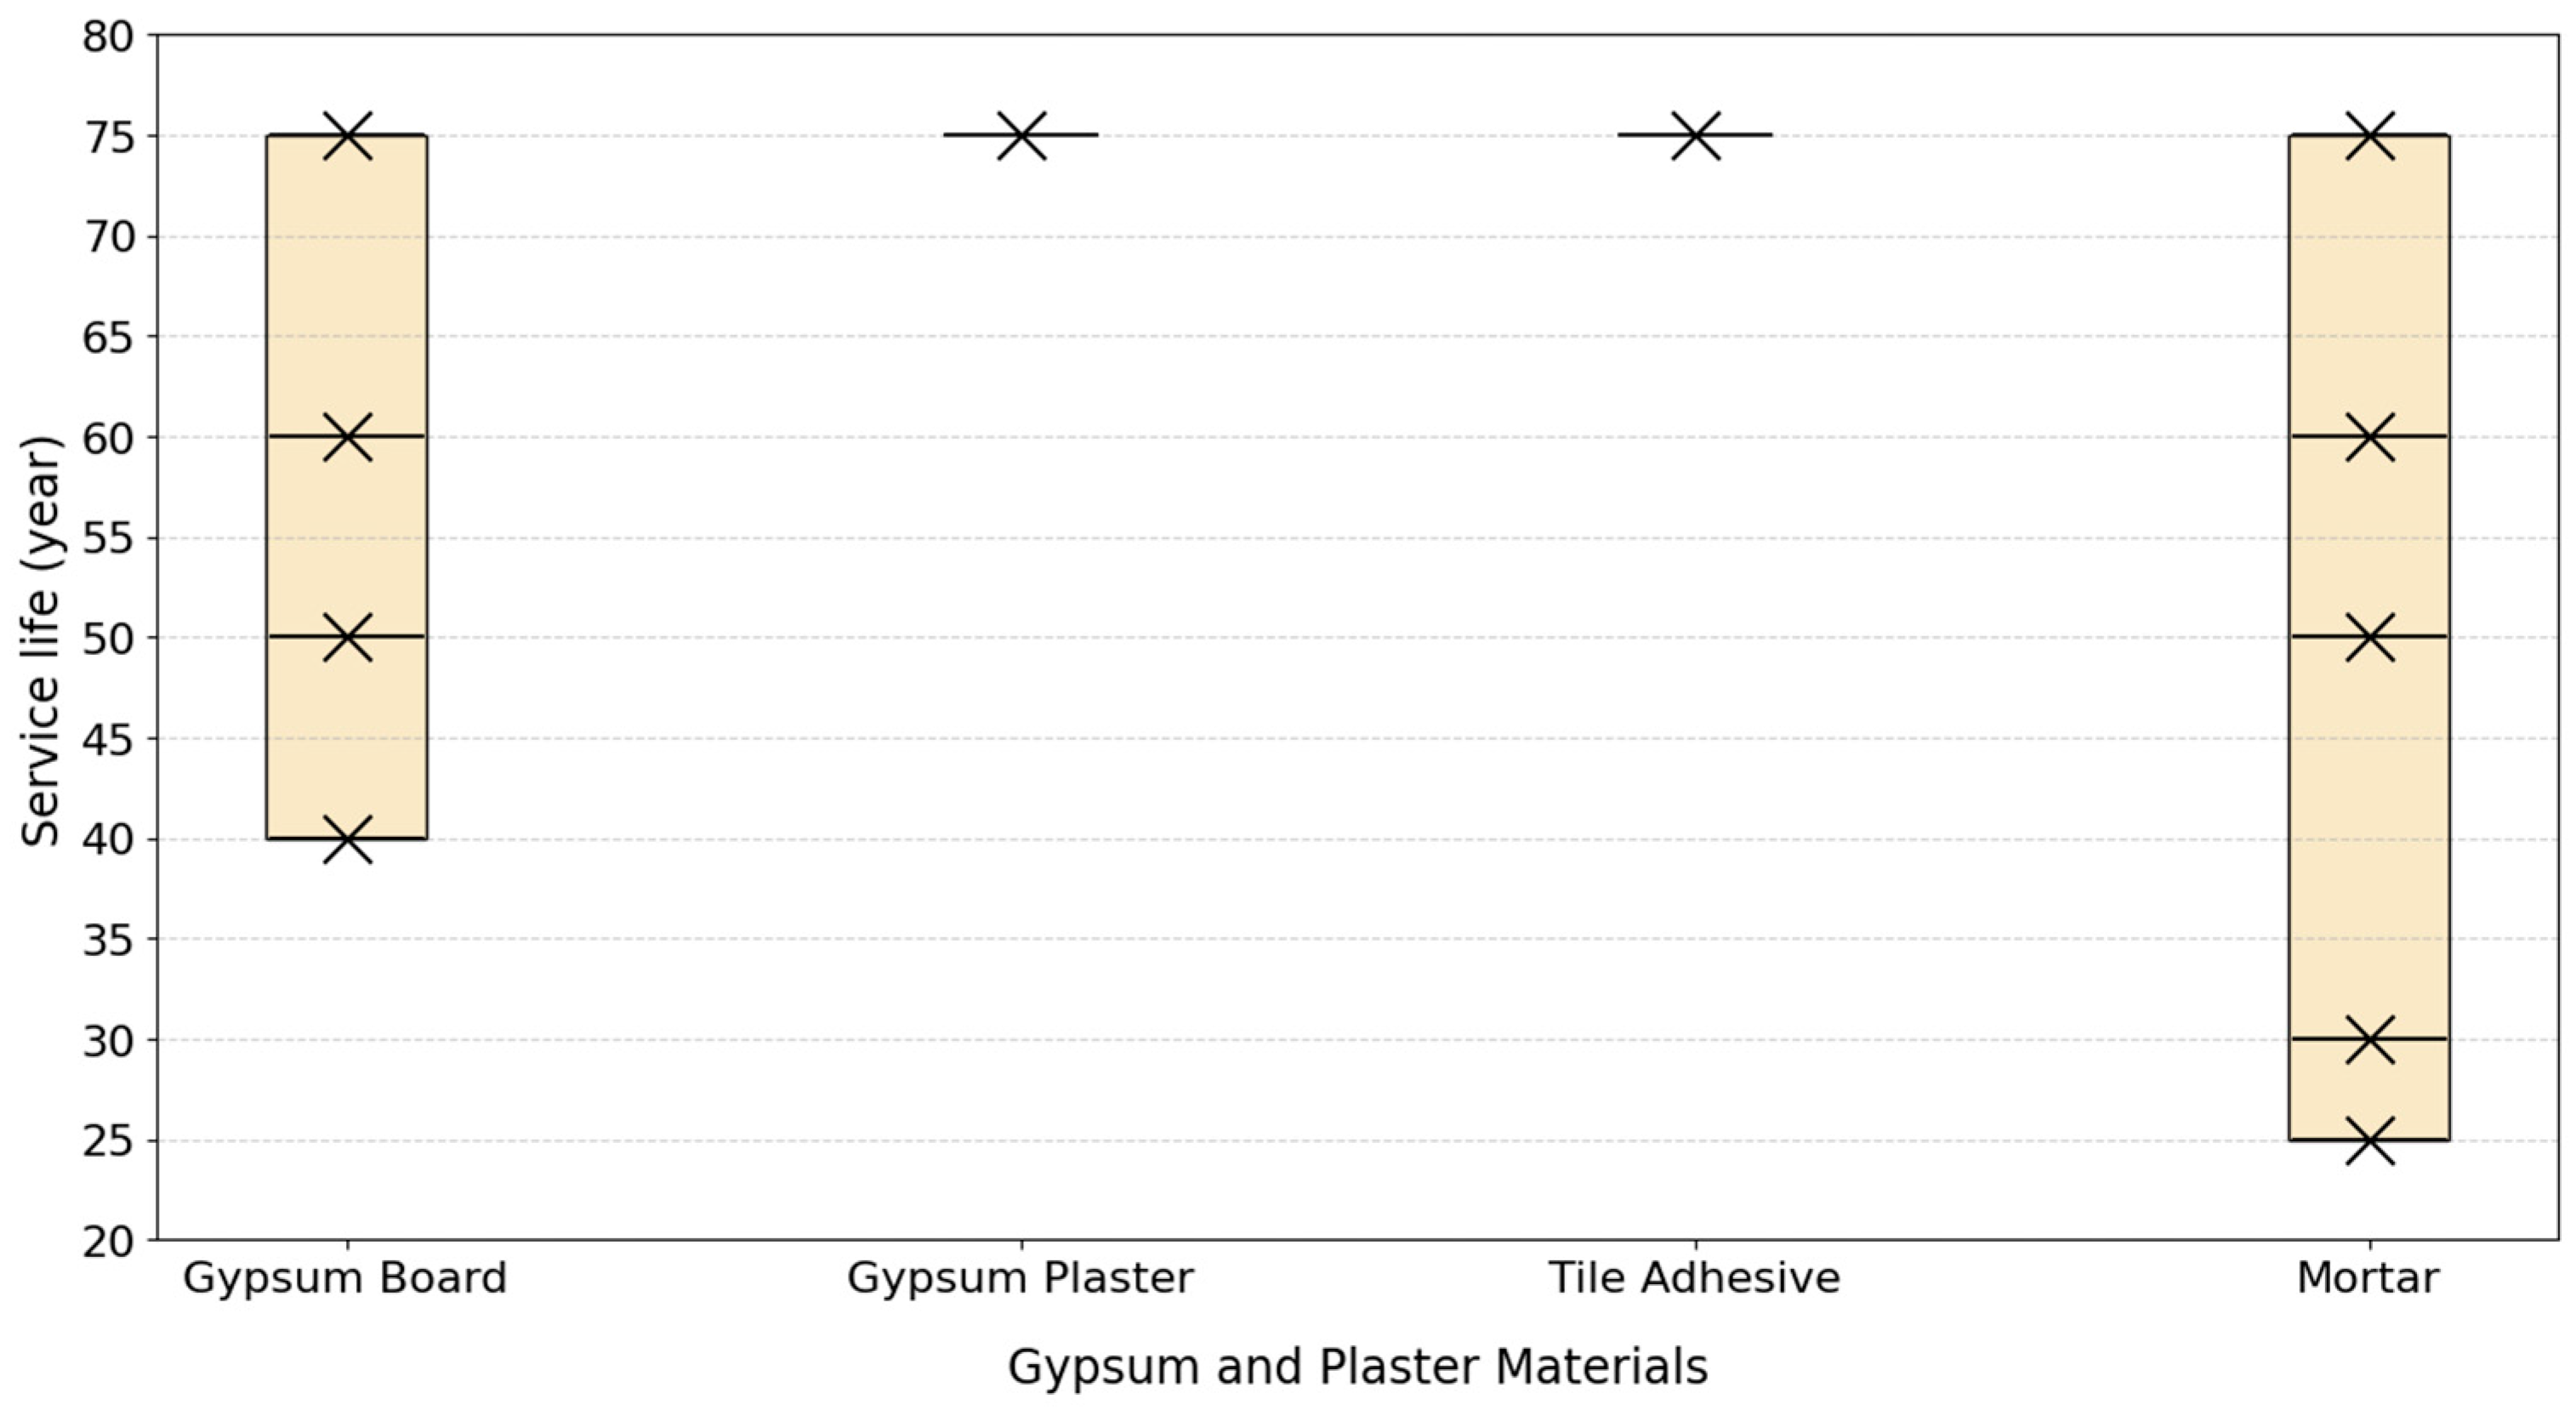
Figure 5 illustrates the service life ranges of various wall gypsum and plaster finishing material. Gypsum Plaster and Tile Adhesive have similar service life ranges, both 75 years. Gypsum Board also has a maximum service life of 75 years, but displays a broader range, with a minimum service life of 40 years. Mortar, while also peaking at 75 years, has a notably wider spread, with its service life beginning as low as 25 years. This variation highlights the differing service life profiles within interior finishing products.
Figure 5.
Service life range of all gypsum and plaster materials.
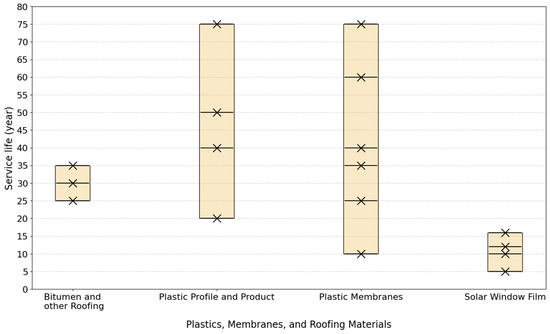
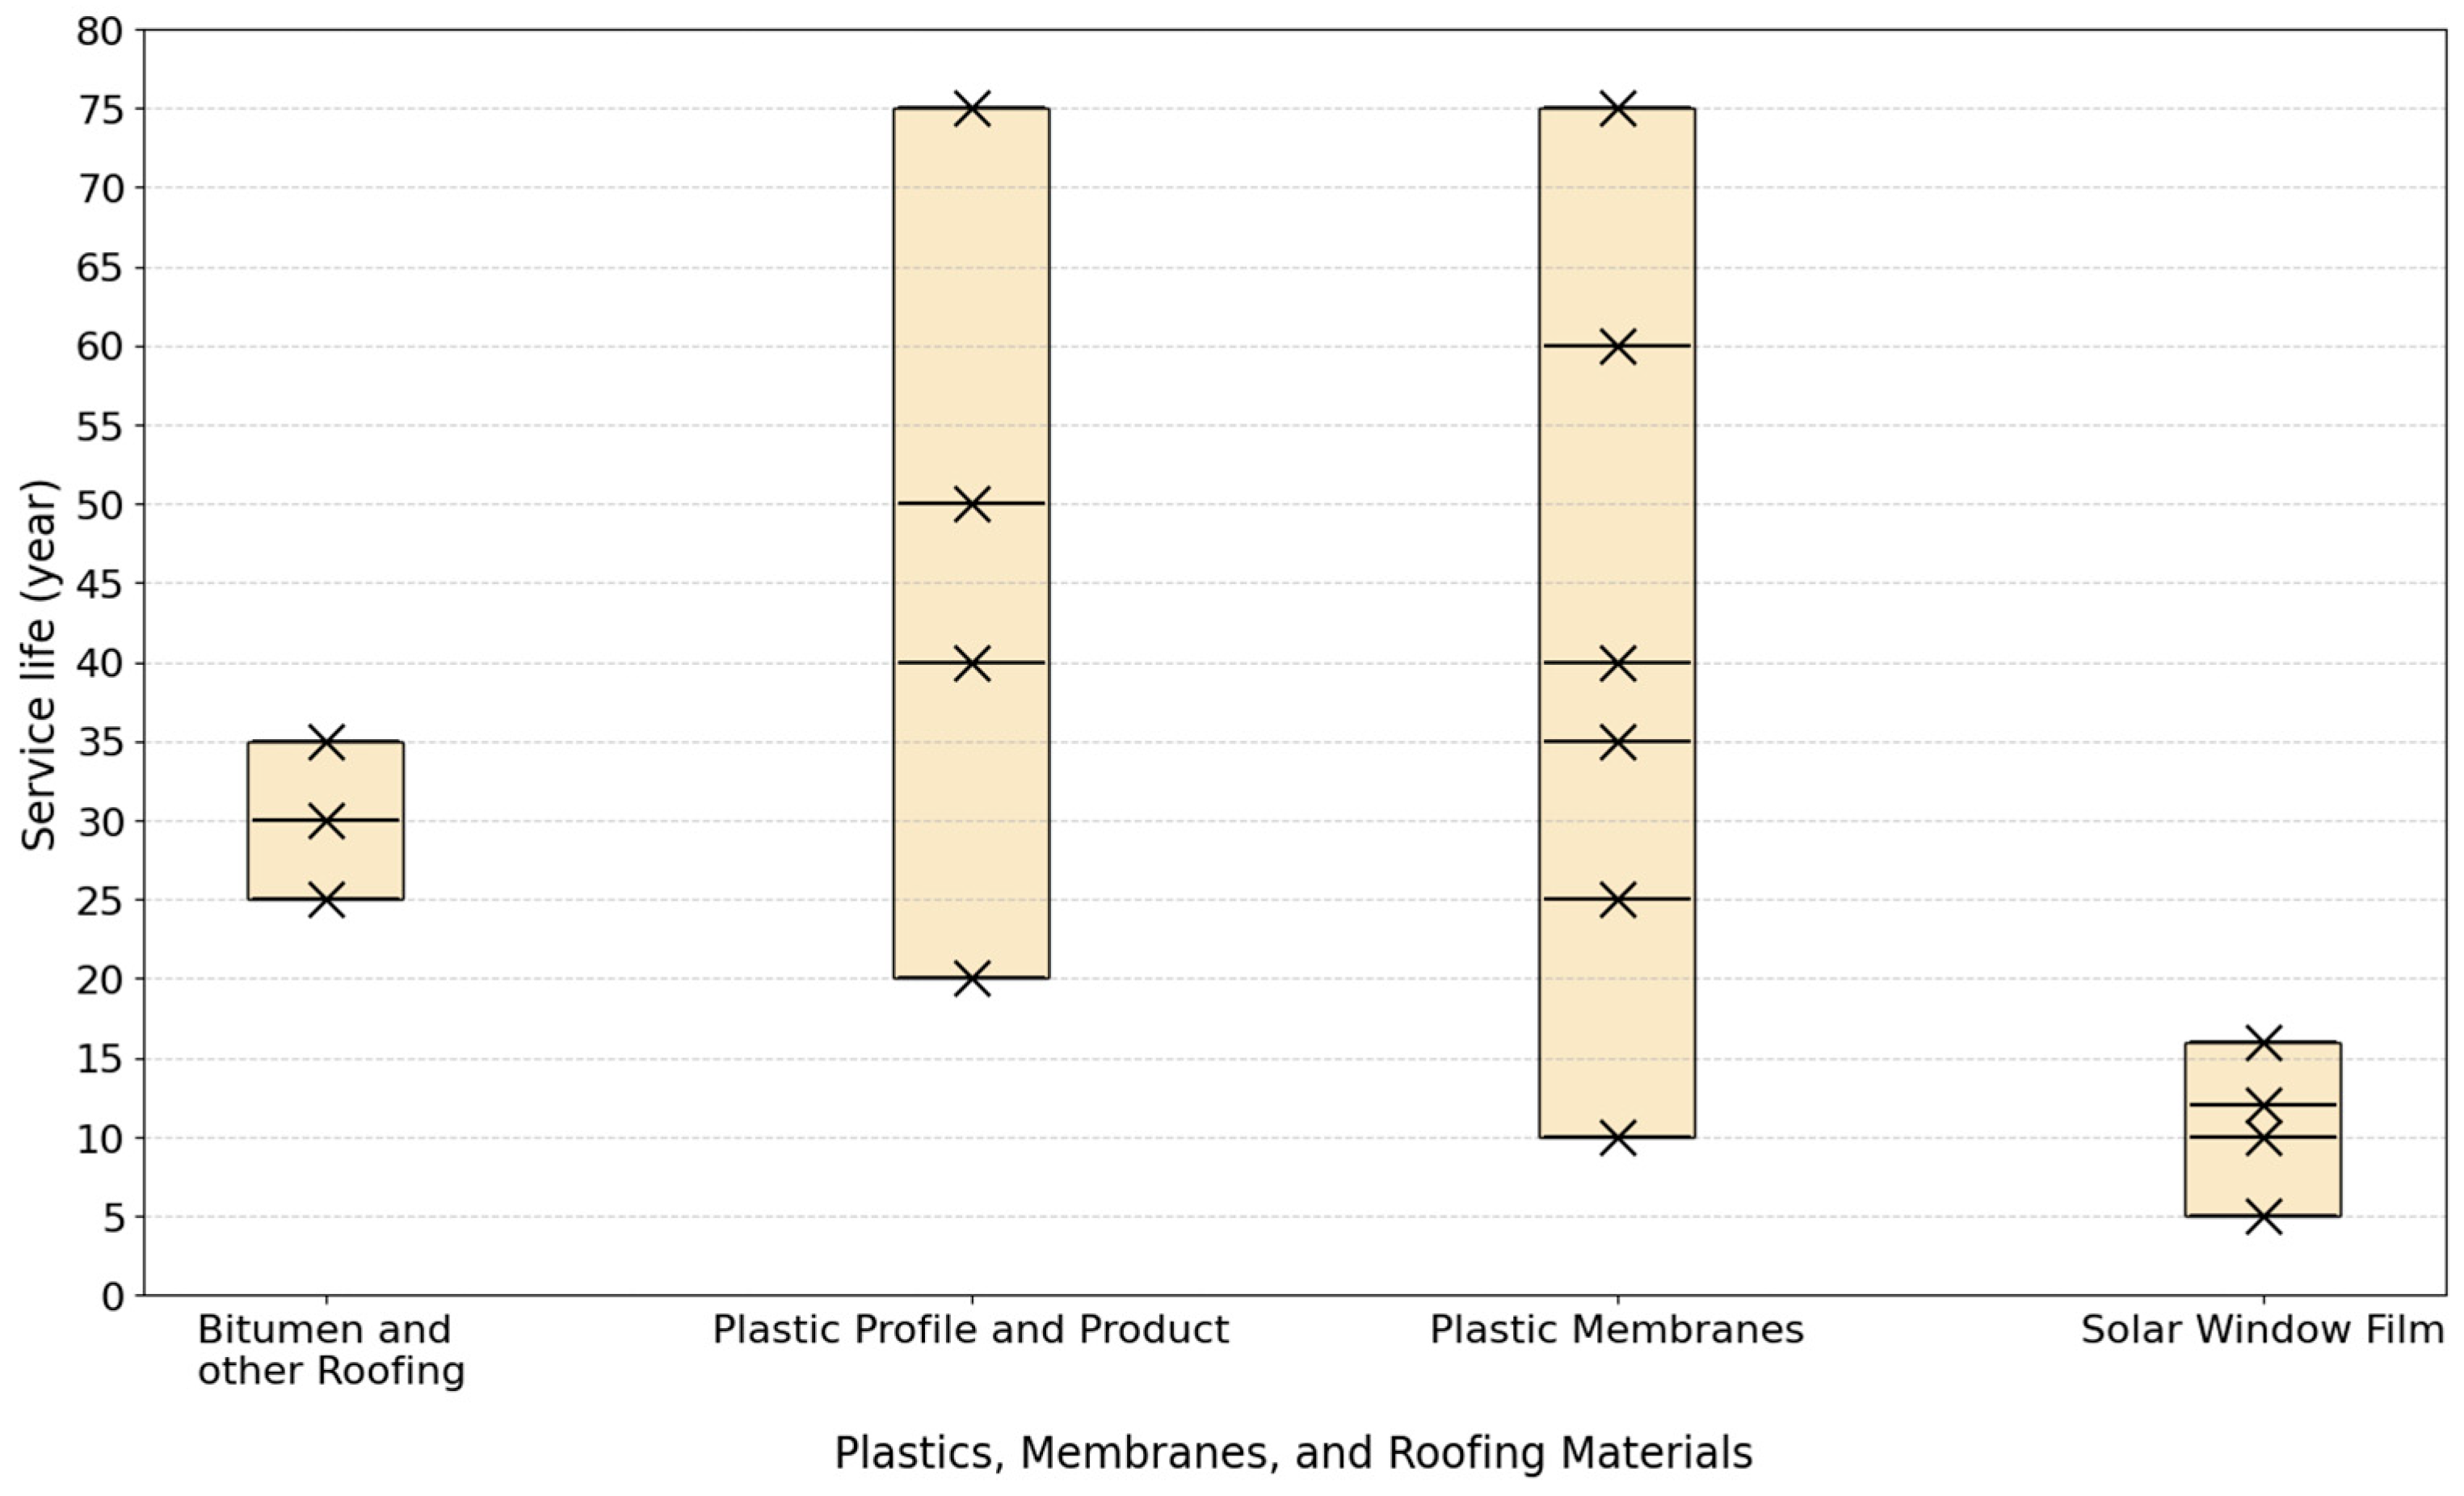
Figure 6 shows the service life ranges of various plastics, membranes and roofing materials. The Bitumen and Other Roofing category shows a relatively narrow service life ranging from 25 to 35 years. In contrast, Plastic Profiles and Products display a much broader range, from 20 to 75 years, indicating greater variability. Plastic Membranes span an even wider range, with service lives between 10 and 75 years. Solar Window Flm has the shortest lifespan, ranging from 5 to 16 years.
Figure 6.
Service life range of all plastics, membranes, and roofing materials.
Similar to the façade category, this group exhibits significant variation in service life values. Such disparities can greatly influence expert calculations, potentially leading to divergent outcomes in carbon footprint calculations, cost estimations, and life cycle analyses.
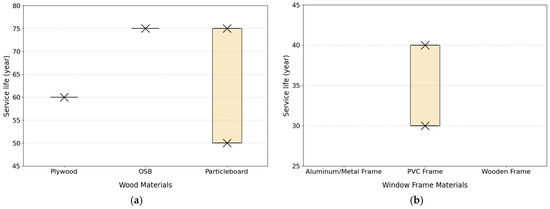
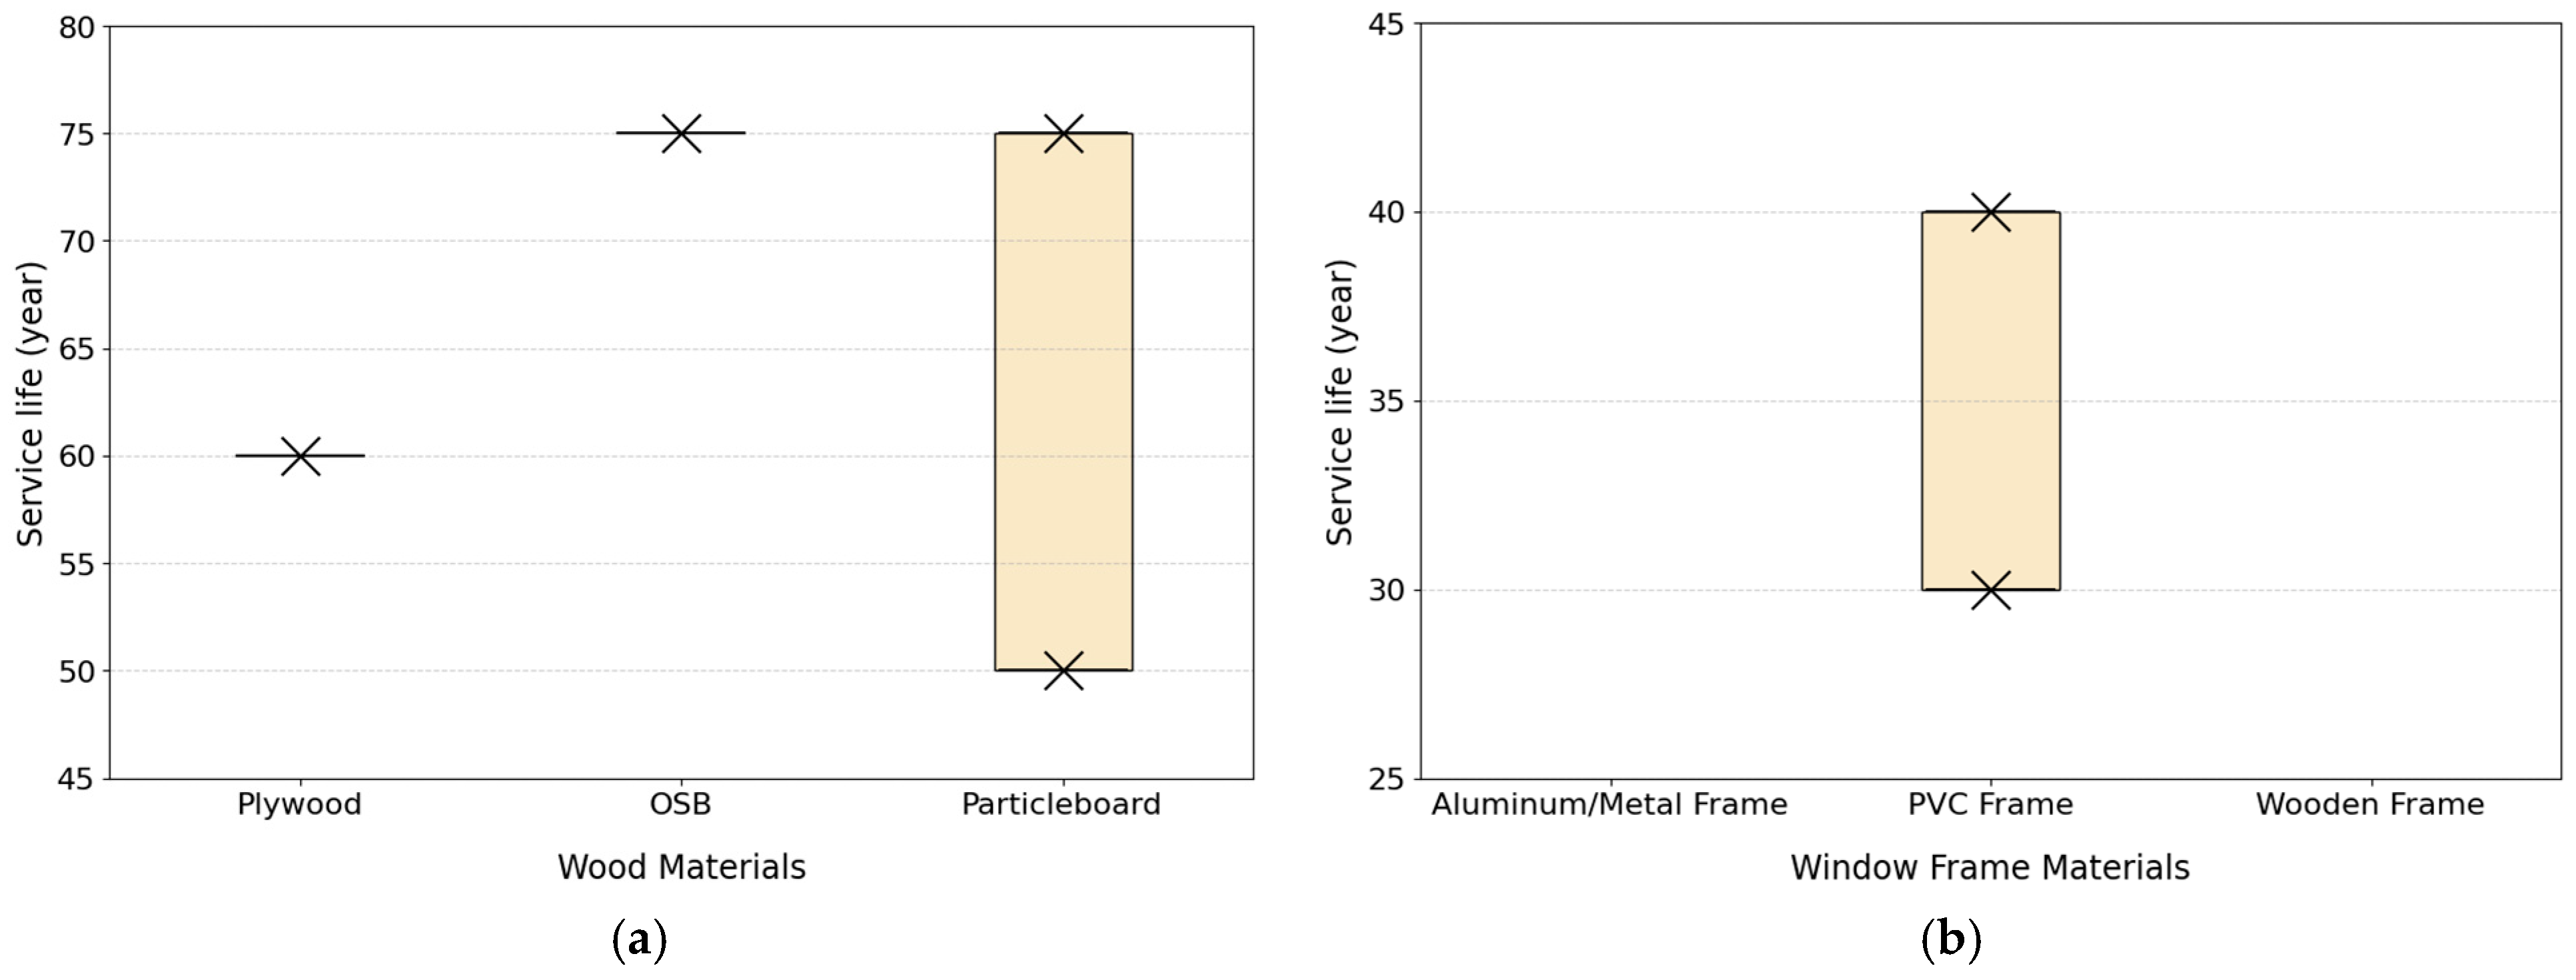
Figure 7a presents the service life ranges of various wood-based products. Most of the extracted RSL values for Wood products cluster around 50–75 years. This indicates that there is relatively little variation among the reported service lives of Wood materials, with most manufacturers providing values within a similar range. Specifically, the RSL for OSB is consistently reported as 75 years, whereas Plywood is reported at 60 years. Only Particle Board shows some variation, with two reported values, 50 and 75 years, highlighting a slight difference within this category.
Figure 7.
(a) Service life range of all wood products; (b) service life range of all window materials.
After reviewing numerous window EPDs across North America, it becomes clear that many do not specify any RSL values for their products, particularly those with wooden or Aluminum/Metal frames. Only a few values are reported for PVC-framed windows, which are listed as 30 and 40 years, as depicted in Figure 7b. This lack of consistent reporting highlights a gap in data transparency and underscores the need for standardized RSL disclosure across window product categories.
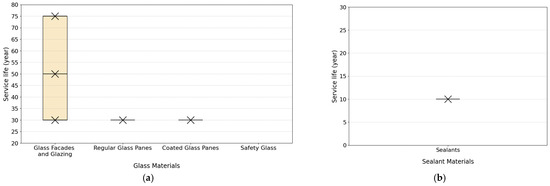
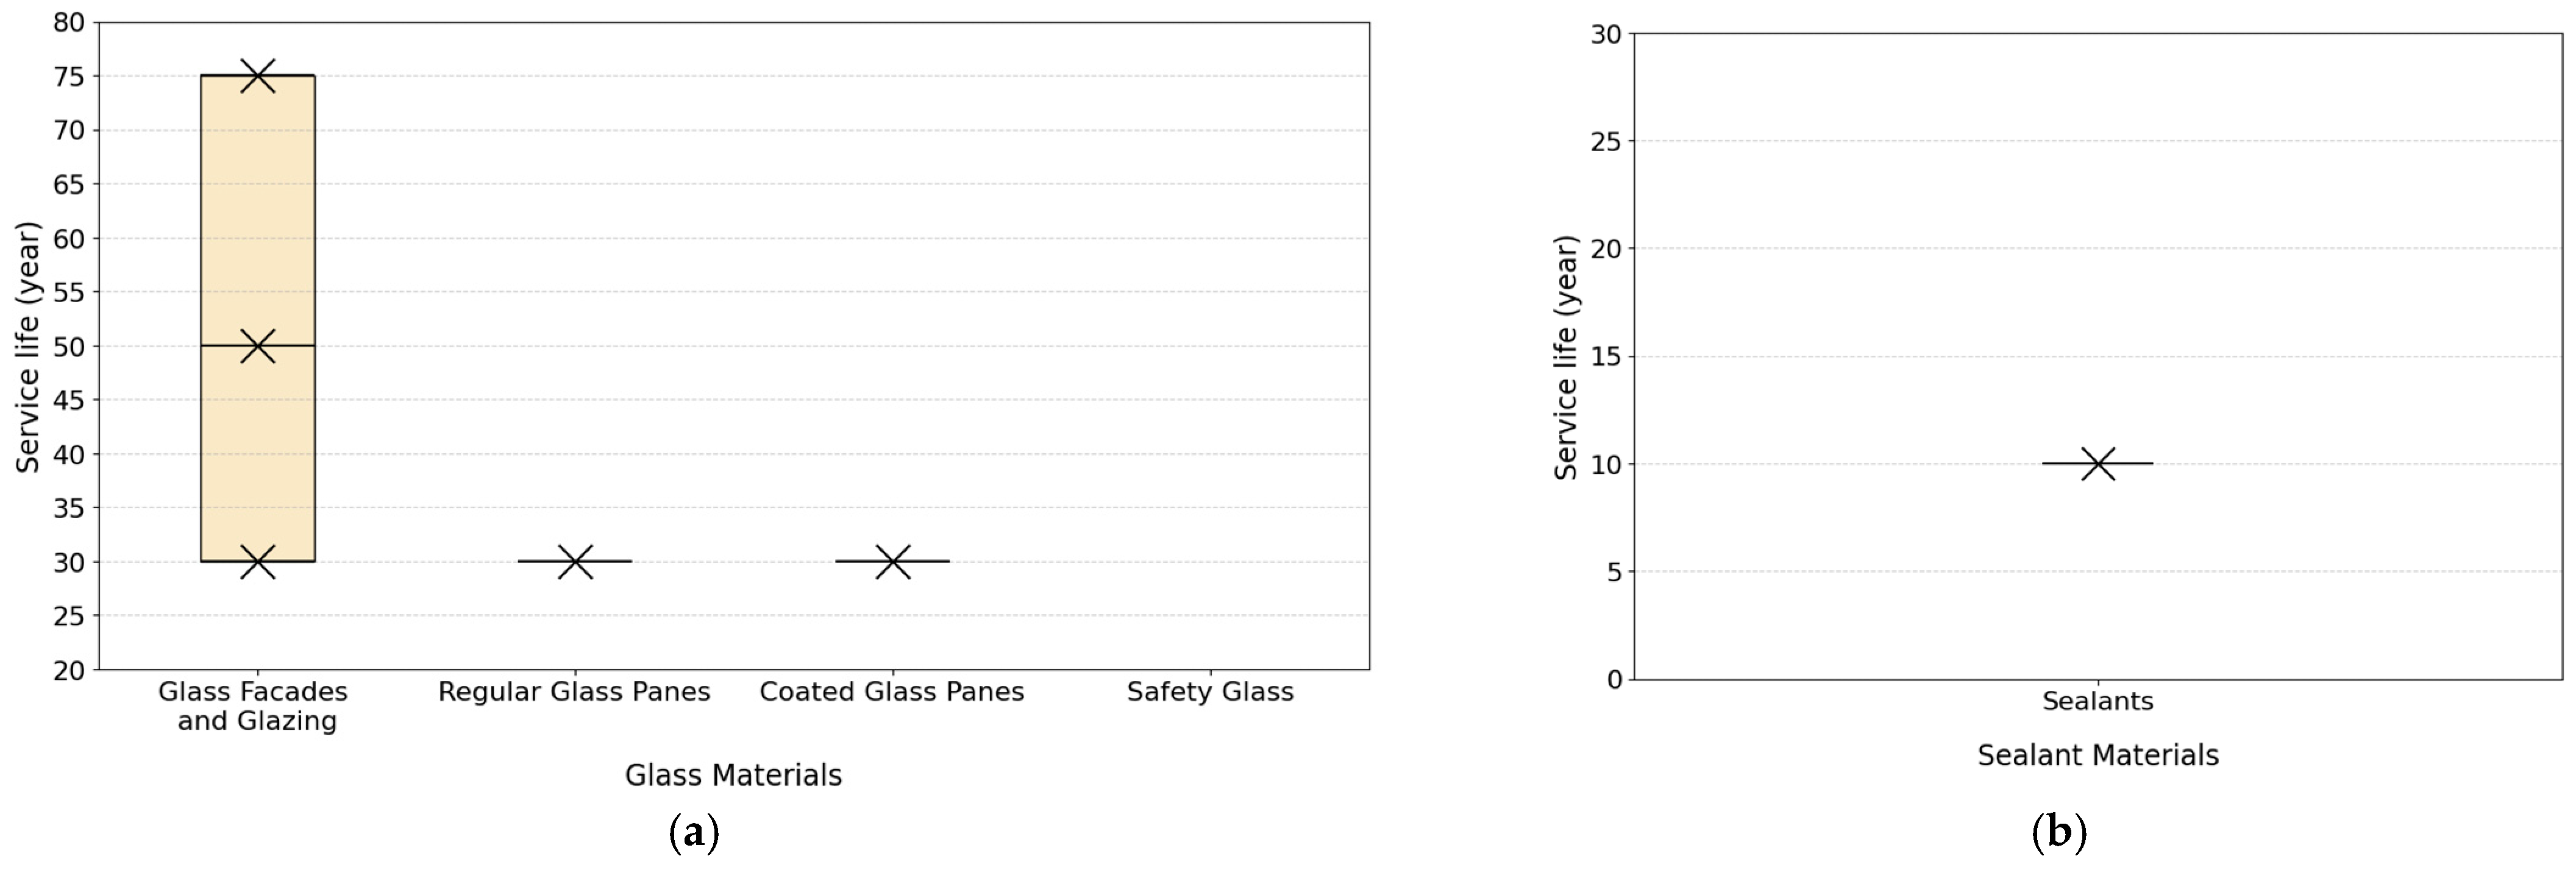
The challenge encountered with window products is similarly reflected in the glass categories. More than half of the EPD documents reviewed on glass do not report any RSL values, particularly for safety glass types. However, as illustrated in Figure 8a, some documents do provide a value of 30 years for Regular Glass Panes and Coated Glass Panes. Glass Façades and Glazing systems, which are commonly used in curtain wall applications, typically have RSL values ranging from 30 to 75 years. This variation highlights the need for more consistent and comprehensive reporting across glass product types. In the Coating and Pastes category, the only relevant non-structural product is sealant. As shown in Figure 8b, only one value is reported for this material (10 years), while other documents do not mention any RSL value.
Figure 8.
(a) Service life range of all glass products; (b) service life range of all sealant materials.
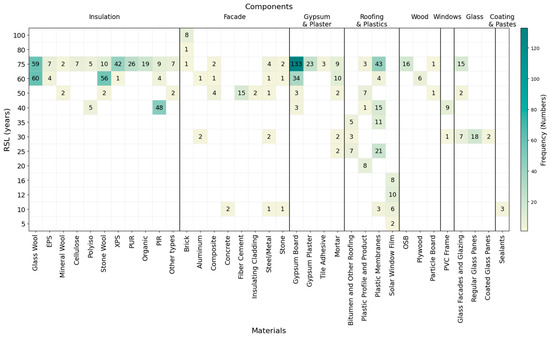
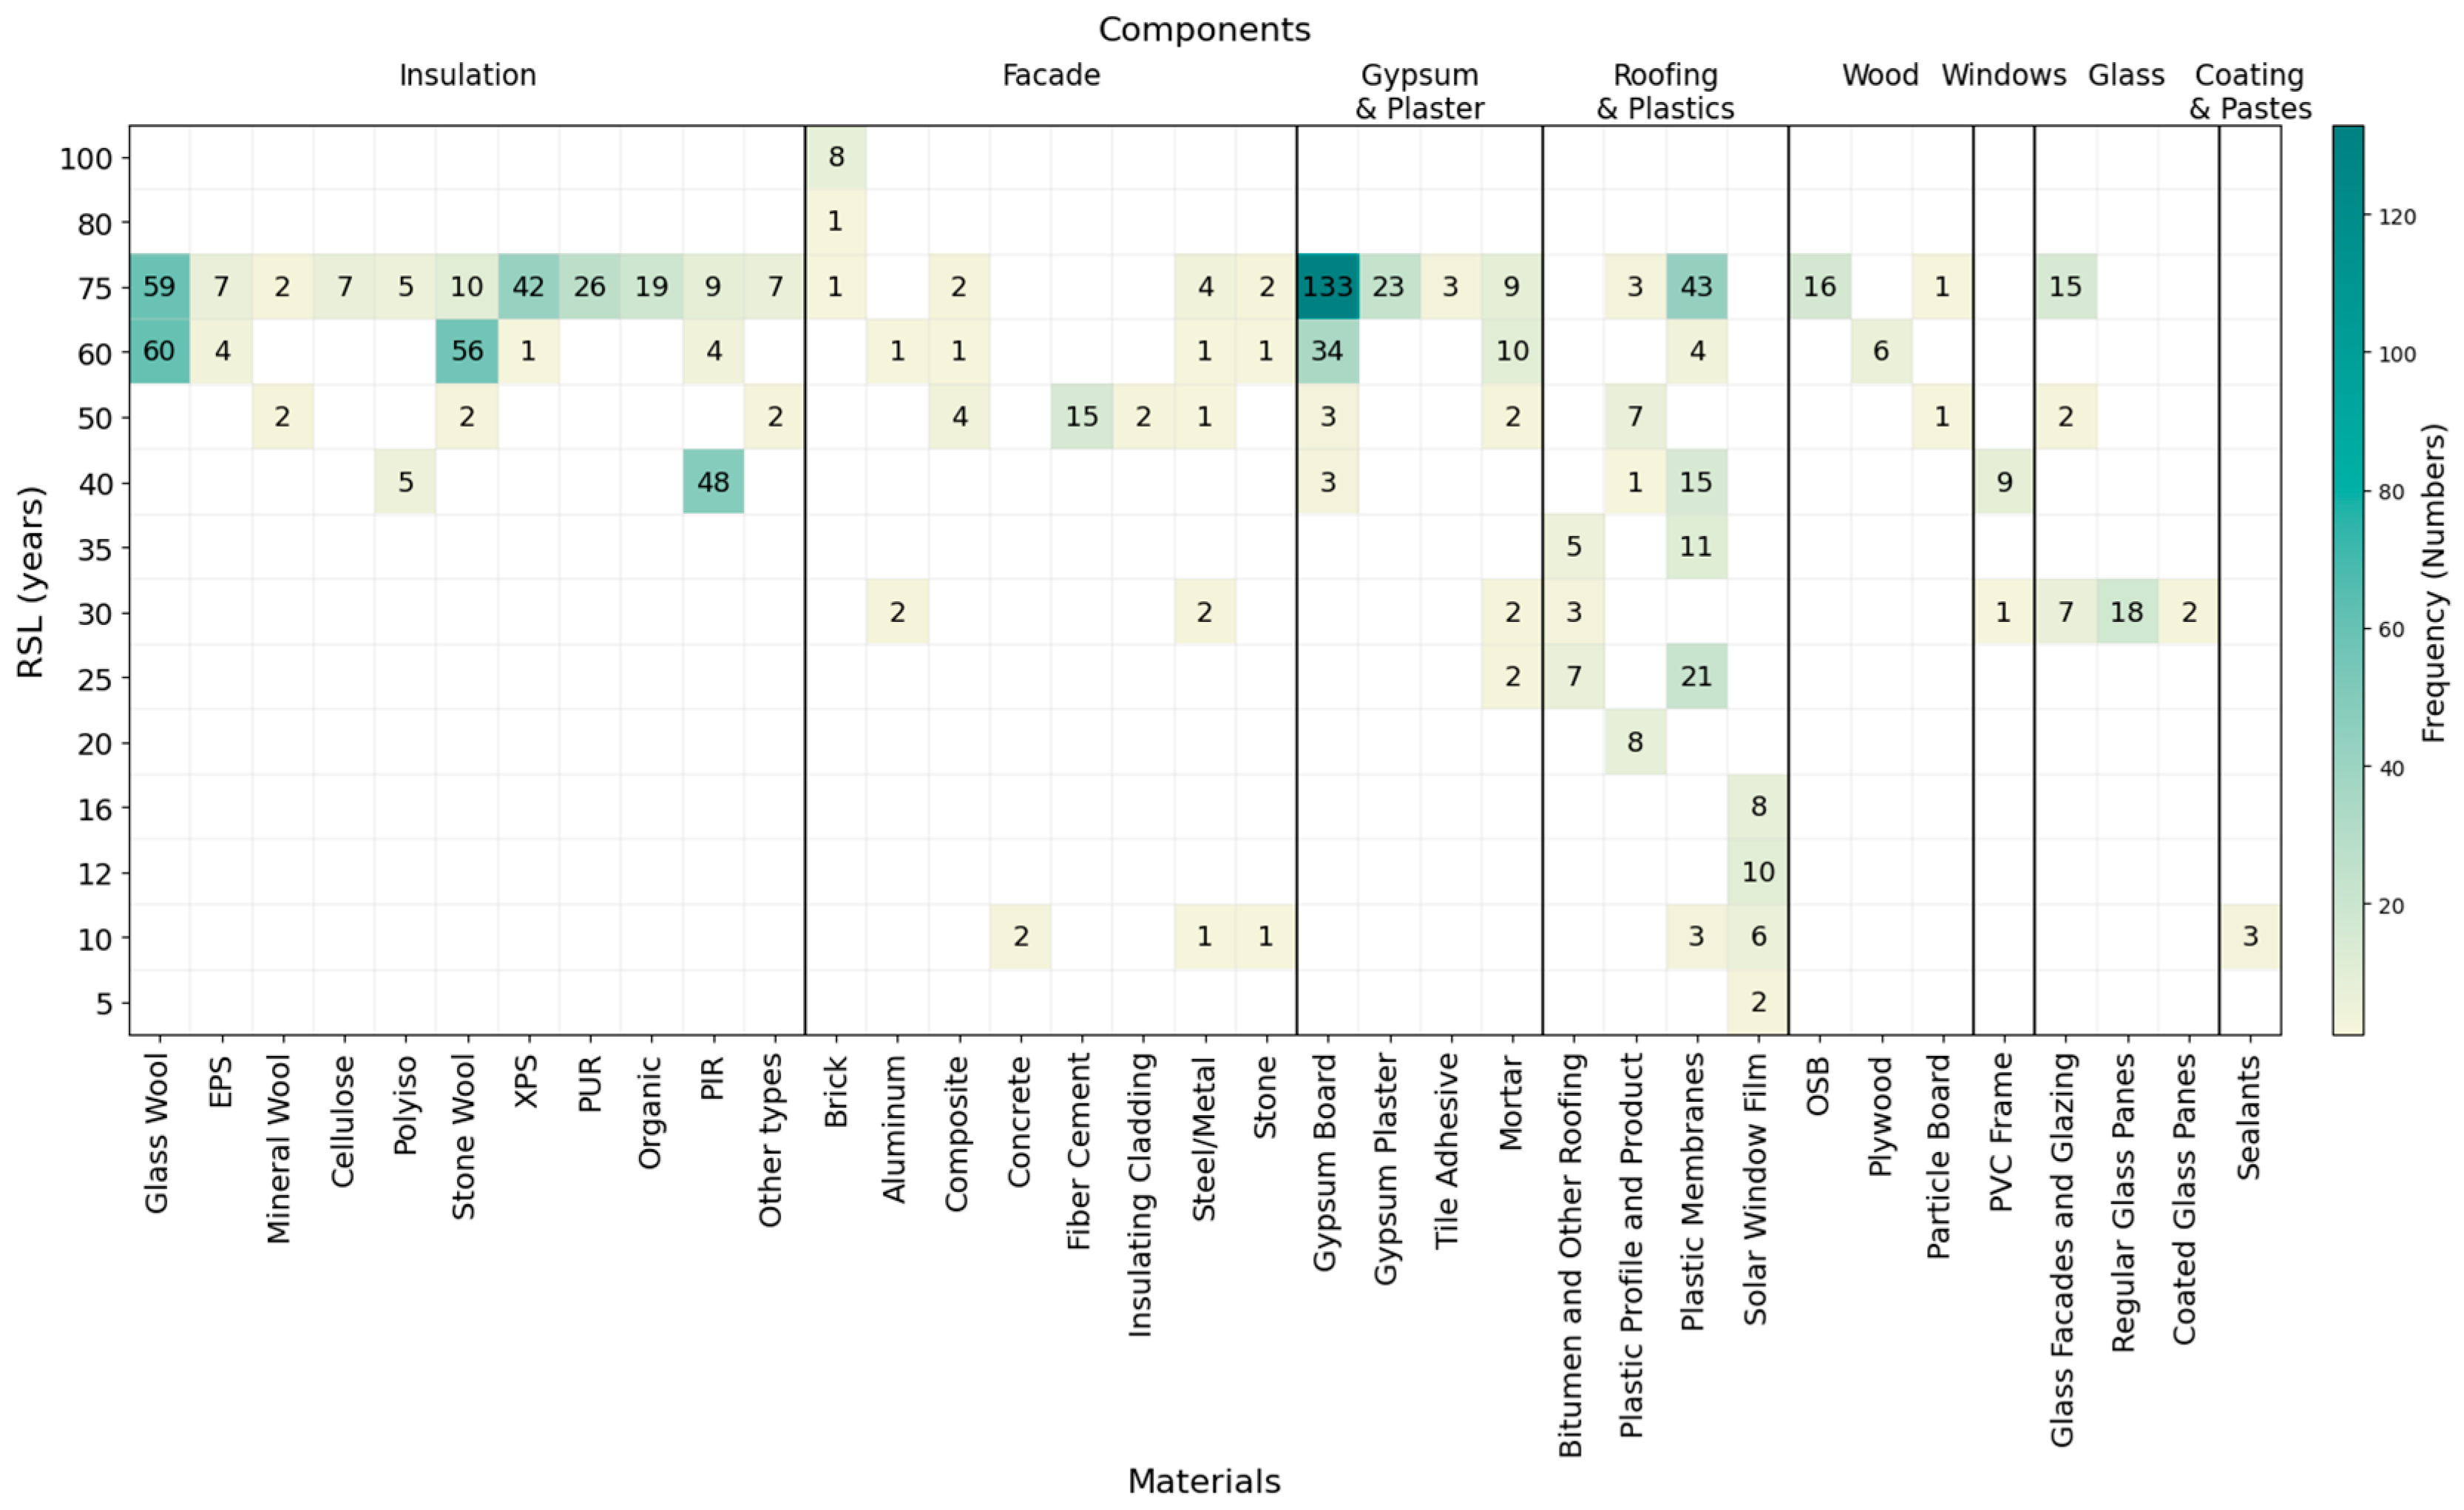
Figure 9 presents a map of collected information in which the RSL data is summarized for various building products and their reported frequencies. Product names appear along the horizontal axis, whereas component categories are displayed at the top. The vertical axis on the left shows RSL values (ranging from 5 to 100). Frequency is represented both by the number inside each cell and visually through color intensity, for which the closer the shade is to green, the higher the frequency.
Figure 9.
Service life range of all building non-structural products with their frequencies.
The highest frequency, the most reported RSL, is for Gypsum Board at 75 years, followed by Glass Wool at 60 and 75 years, Stone Wool at 60 years, PIR at 40 years, and XPS and Plastic Membrane at 75 years. In contrast, products such as Sealant, Plywood, and Concrete façade covering appear infrequently, with RSL values reported only 1 to 10 times in the EPDs.
This pattern is challenging to interpret. A low reporting frequency may indicate limited reliability or inconsistent data availability. However, high frequency does not necessarily imply reliability and accuracy, as many of the commonly reported values, particularly 60 and 75 years, align with standardized defaults recommended for EPDs when manufacturers do not provide measured service life data. This underscores the importance of critically evaluating both the frequency and source of RSL values when conducting life cycle assessments.
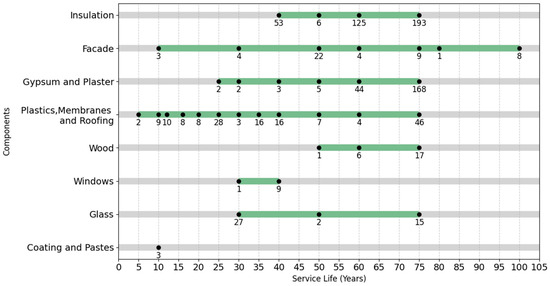
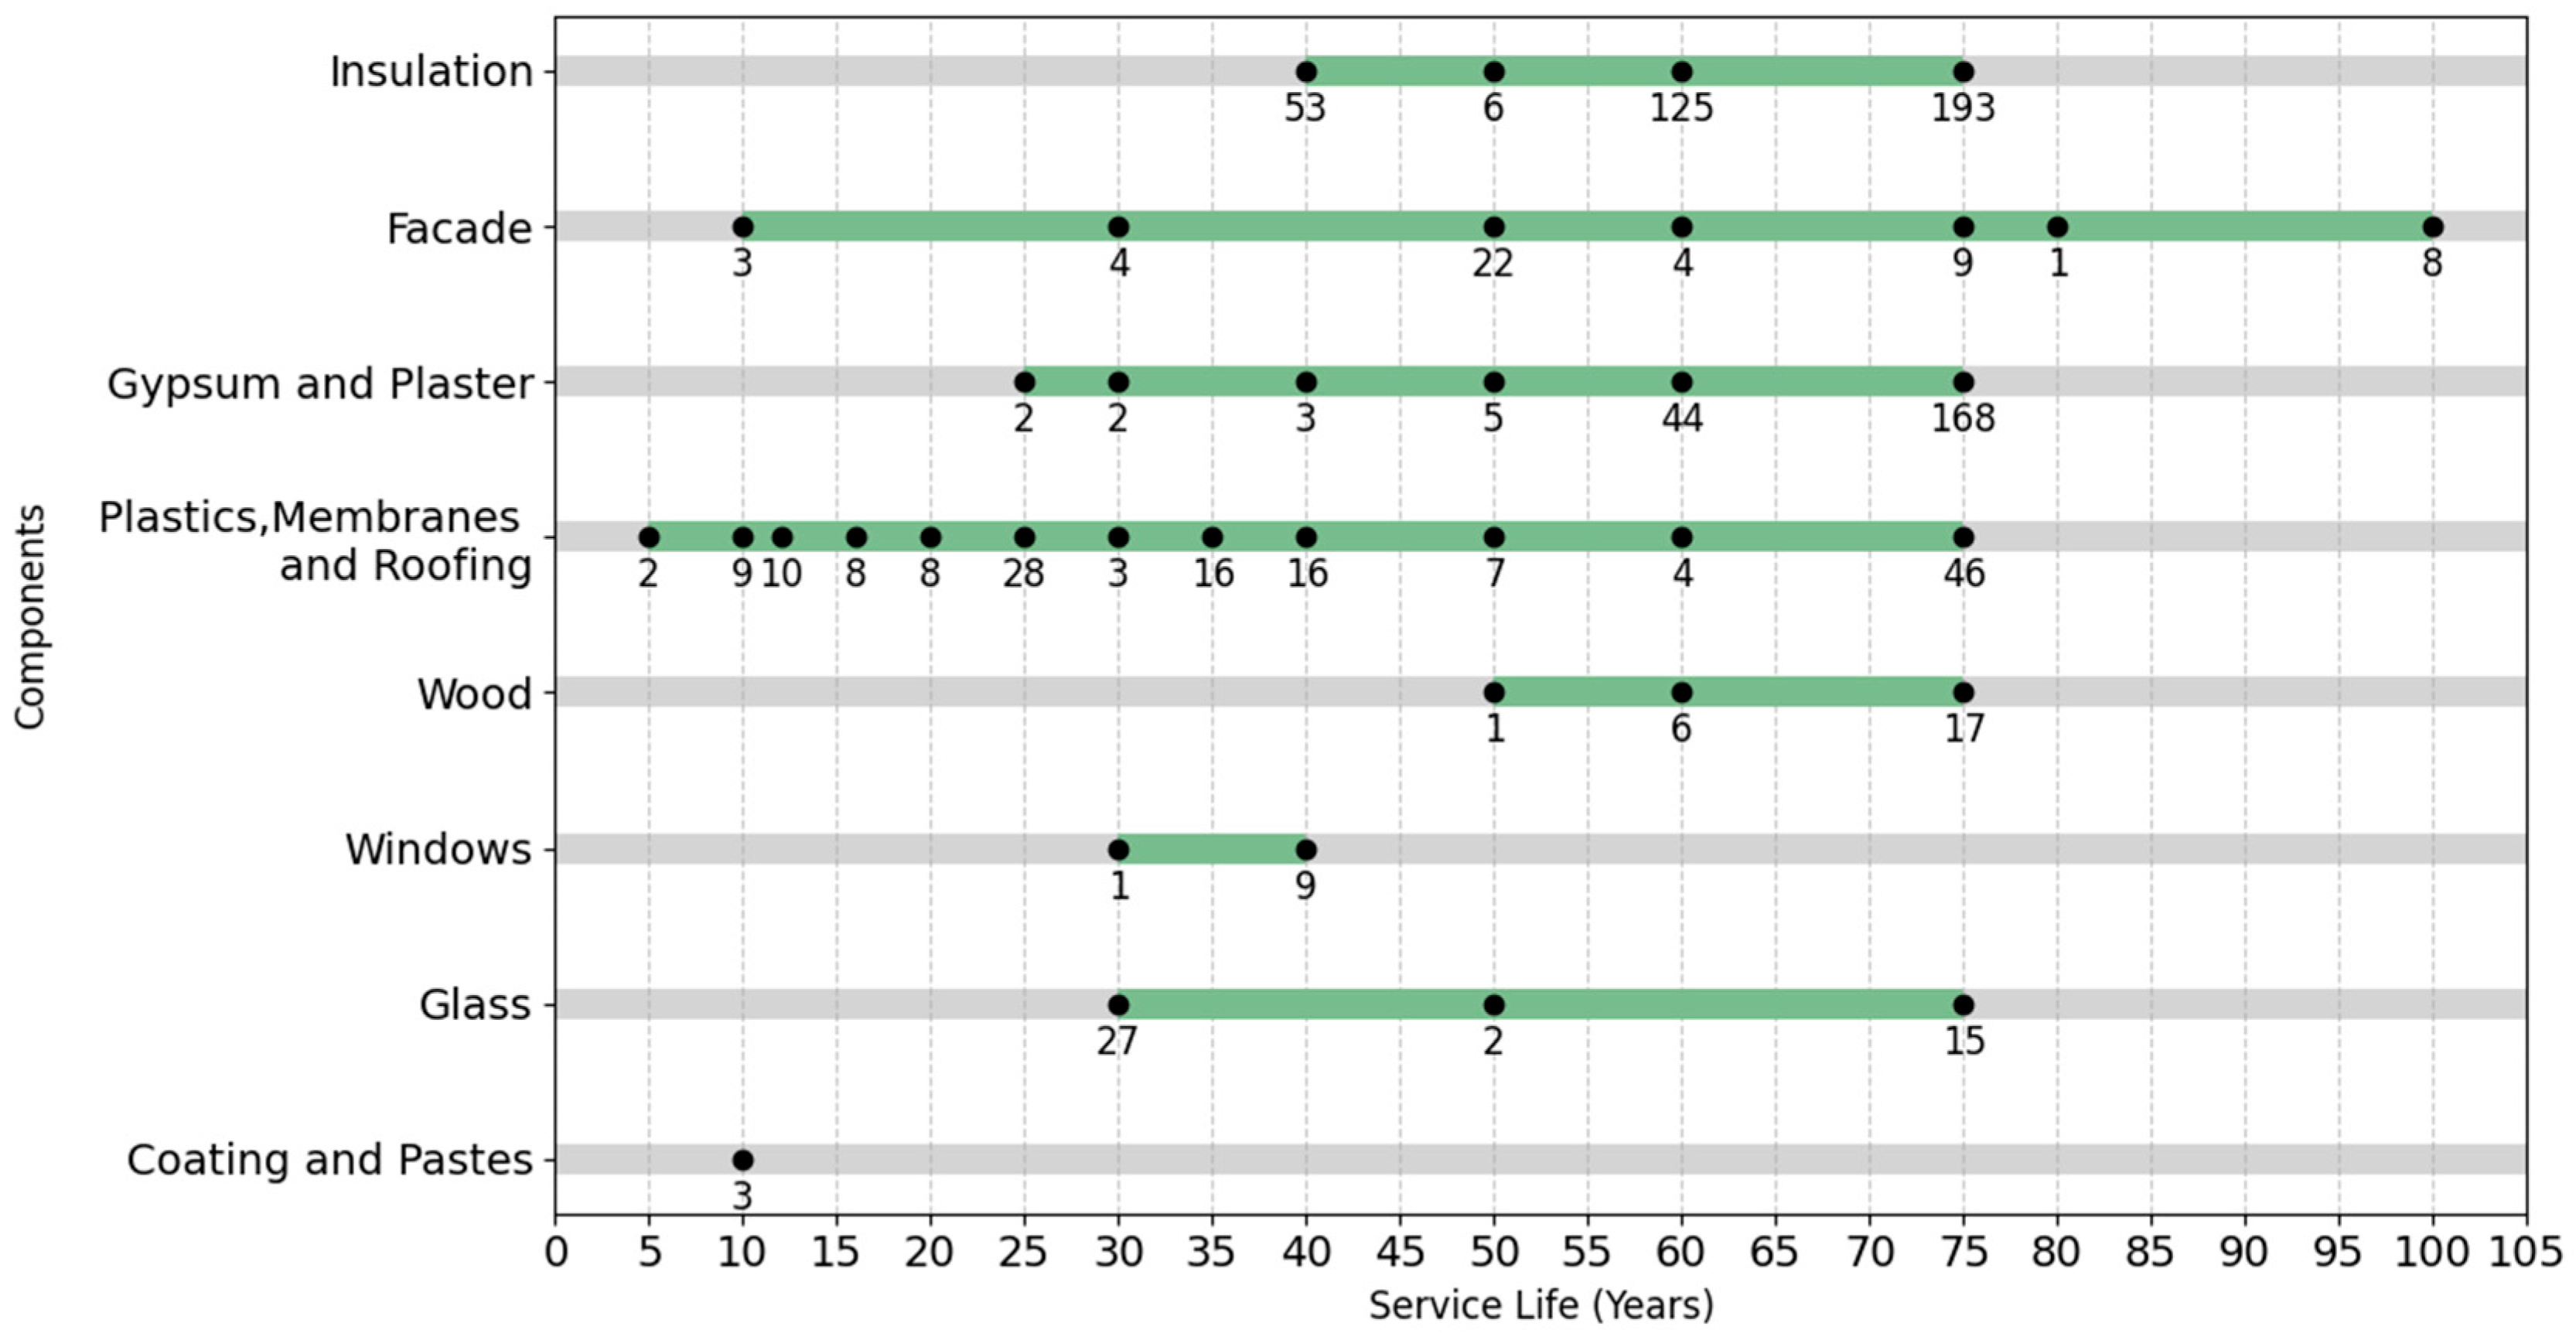
Figure 10 provides a comprehensive overview of the collected RSL data across building component categories. In this figure, green lines indicate the range of reported RSL values for each category, black dots represent specific RSL values, and the adjacent numbers indicate the frequency of each reported value. As shown, the Plastics, Membranes and Roofing category, along with Façade materials, shows the greatest variation in reported service lives, ranging from as little as 5–10 years up to 75 years.
Figure 10.
Service life range of all building non-structural components with their frequencies.
Following these categories, Gypsum and Plaster products also show notable variation, with service lives ranging from 25 to 75 years. In contrast, the ranges are narrower for categories such as Glass and Insulation, generally spanning from 30 or 40 years to 75 years. Wood products show one of the most consistent ranges, between 50 and 75 years; similarly, Windows typically ranges from 30 to 40 years. The Coating and Pastes category, which includes only Sealants, has a single reported value of 10 years.
Consequently, the prepared dataset should be interpreted as a compilation of all available reported RSL values for non-structural materials in North America, with particular attention to the Canadian market, rather than as confirmed indicators of actual service life performance. The observed inconsistencies define the reliability boundaries of the dataset. It is appropriate for identifying value ranges, data gaps, clustering patterns, and reporting inconsistencies, but it should not be used to establish normative or recommended service life values. These findings also confirm that the high level of inconsistency in the data requires urgent action to develop clearer policies or standards to guide manufacturers in declaring product RSL using more validated and transparent methods.
4. Methods
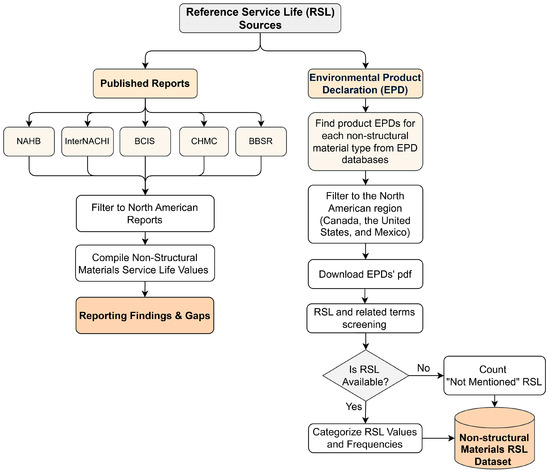
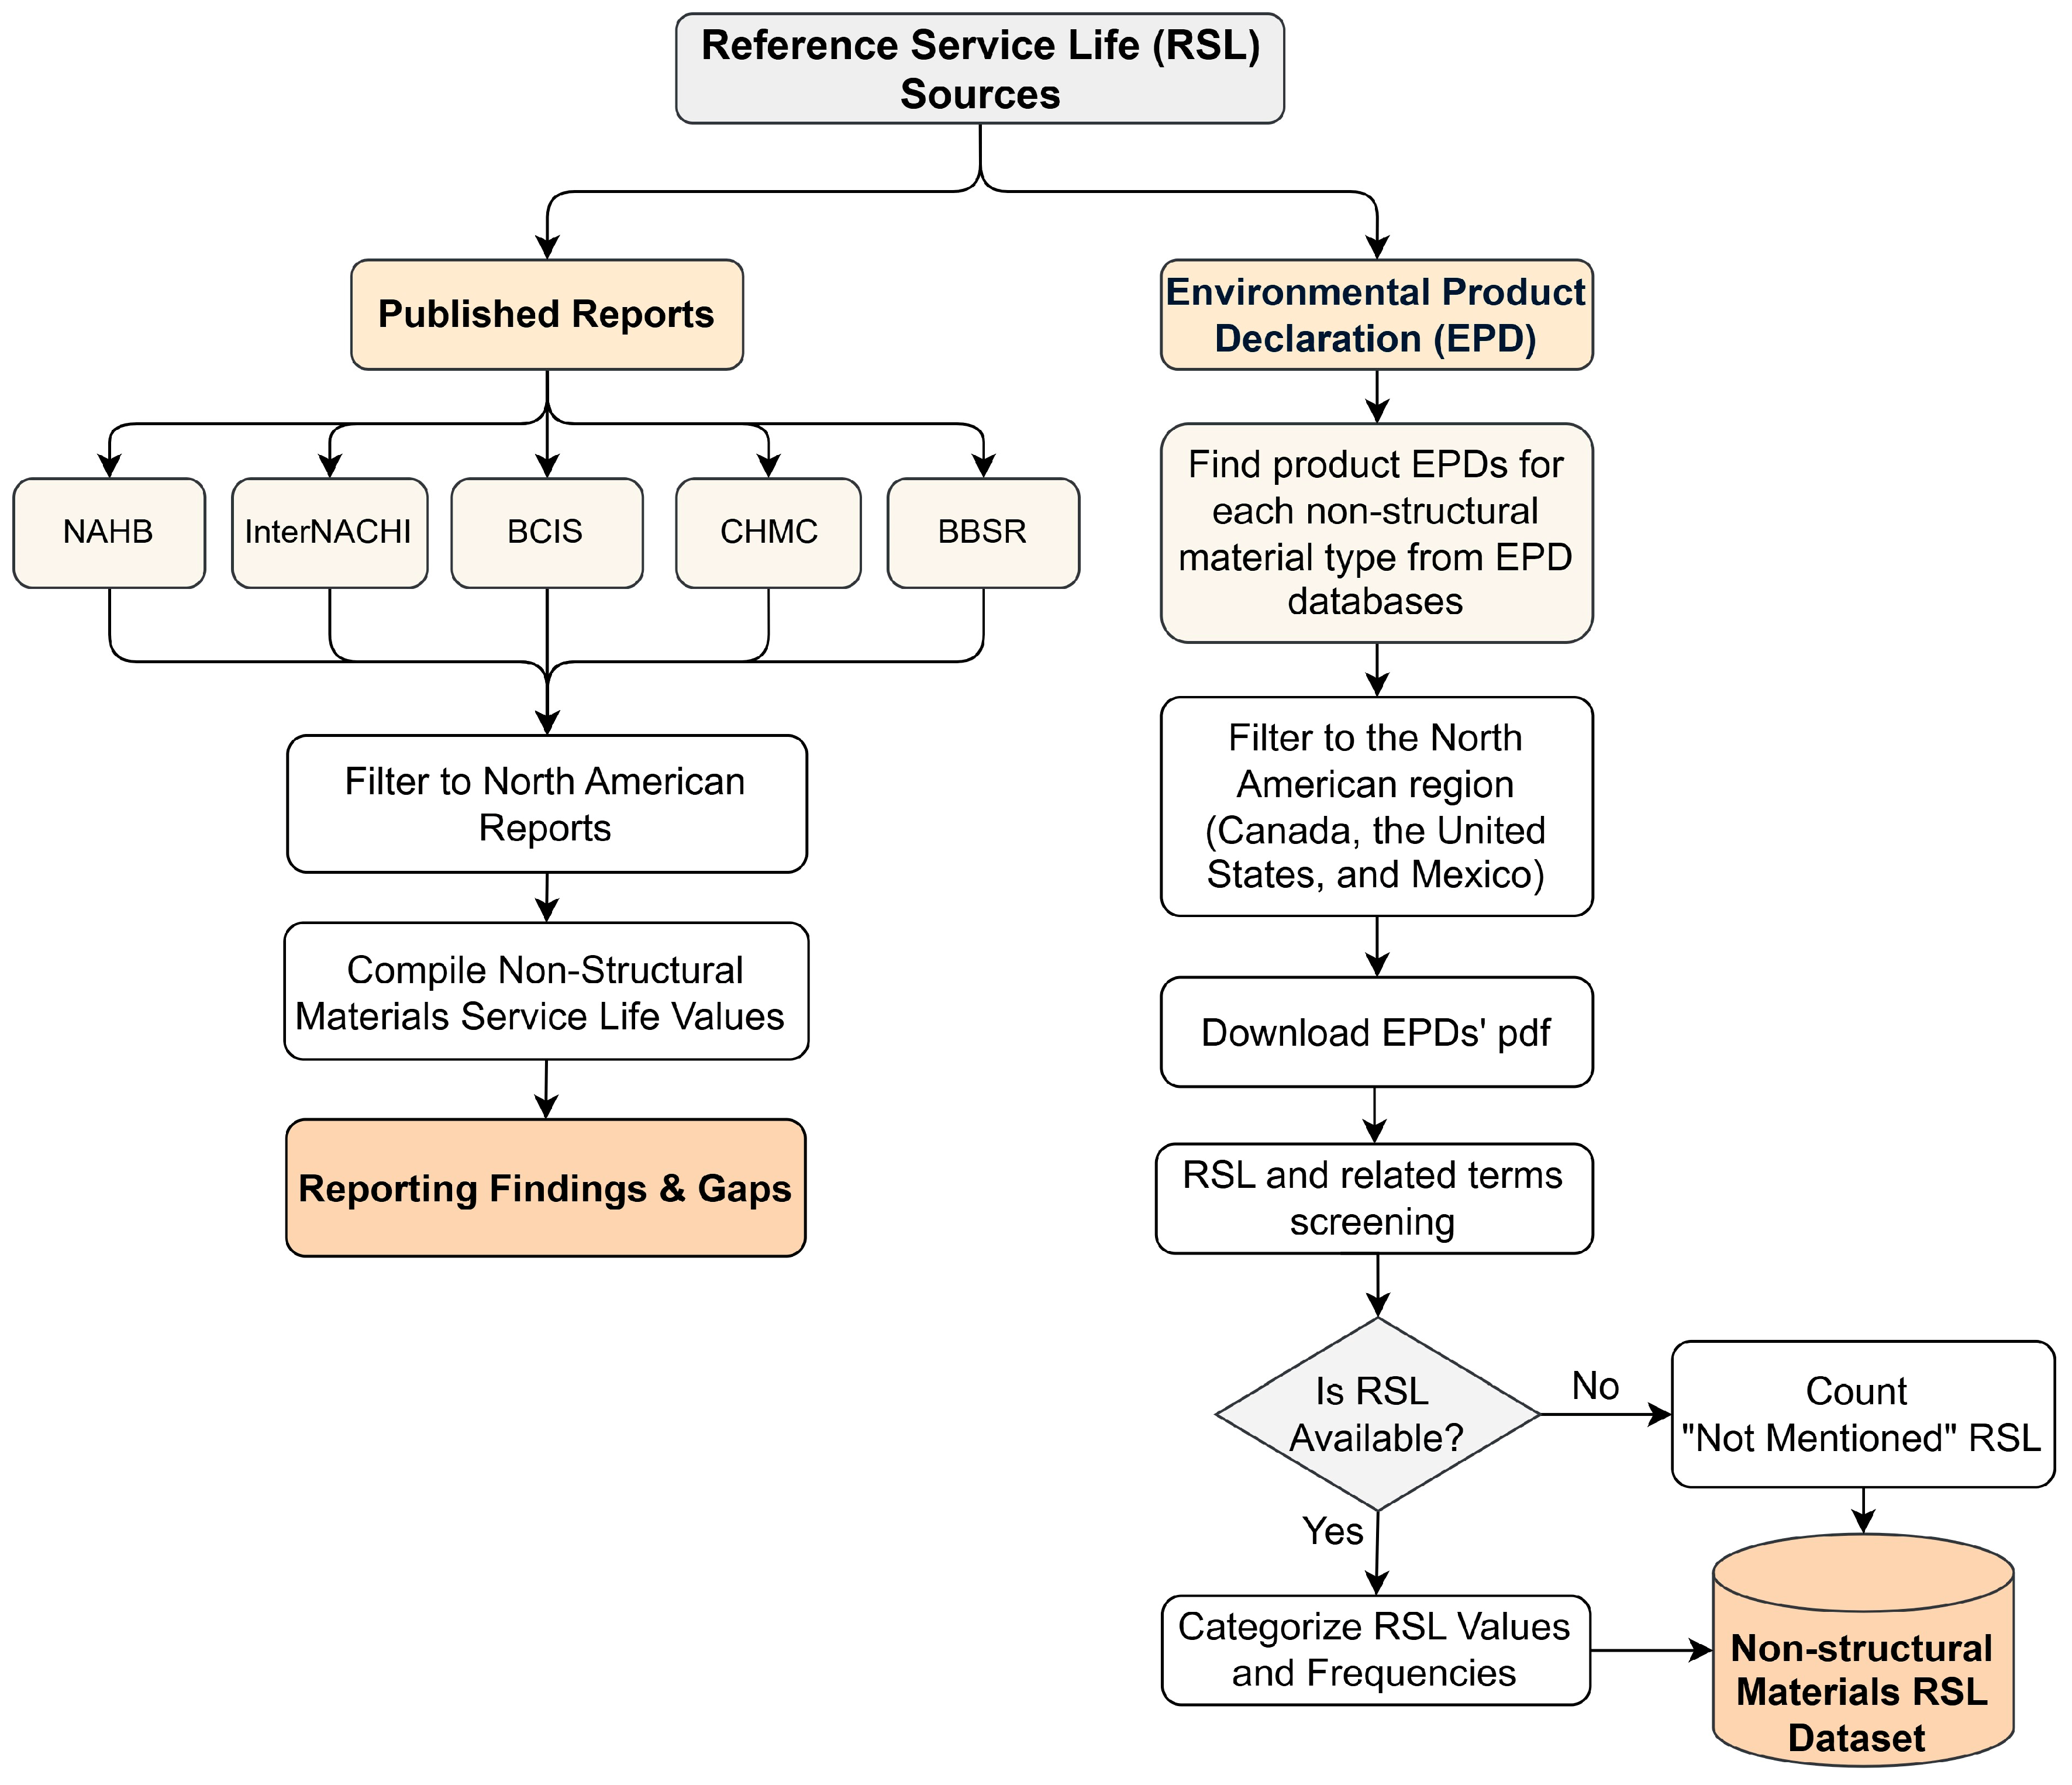
To construct a dataset of RSL values for non-structural building materials, a structured approach was followed, as illustrated in Figure 11. The process began with identifying potential sources of RSL data. These included direct communication with manufacturers, international reports, and EPD databases. EPD is defined as a standardized third-party verified document prepared by a product manufacturer to report the environmental impacts of a specific product across its life cycle, including the declared service life information of that product. These declarations are publicly disclosed either on the manufacturer’s official website or through recognized EPD databases.
Figure 11.
The methodology for creating non-structural material RSL database.
For the international reports research, key publications from various organizations were selected for review. These included the following:
- National Association of Home Builders (NAHB) [12],
- International Association of Certified Home Inspectors (InterNACHI) [10],
- Building Cost Information Service (BCIS) [15],
- Bundesinstitut für Bau-, Stadt- und Raumforschung (BBSR) [16],
- Canada Mortgage and Housing Corporation (CMHC) [17].
Thereafter, all the materials and components in these reports were subsequently exported to an Excel file and filtered to keep only non-structural materials. After compiling service life values for these non-structural materials and components into a single table, gaps were identified. To ensure consistency and regional relevance, the table was further filtered to include only North American sources, including NAHB, InterNACHI, and CMHC, due to their shared classification system, survey-based data collection methods, and regional applicability. This alignment enhances the reliability and accuracy of subsequent comparative analysis.
For the EPD-based research, all relevant non-structural EPDs were published after 2010 and were collected from platforms including EPD Hub, EC3, One Click LCA, and Ecoinvent. Here, non-structural components are defined as building envelope materials that do not carry structural loads and are not purely aesthetic. The product scope of this study includes major non-structural envelope systems and subcategories such as roofing systems, facade cladding systems (excluding structural elements), insulation, windows, cladding, membranes, gypsum products, and plasters, and sealants. Materials outside this defined envelope-focused scope were excluded. Then, the dataset was filtered to include only EPDs related to North America (Canada, the United States, and Mexico). This boundary was selected because the main focus of the study is the investigation of service life information for products available in Canada, while the United States and Mexico were included due to the accessibility and ease of transporting their products to the Canadian market. Each selected document was then downloaded and reviewed to identify references to RSL or related terms such as “service life”, “estimated service life (ESL)”, “design life”, and “life expectancy.” Then, extracted data were compiled into a structured dataset including product name, manufacturer, region, EPD publication year, and reported service life values. Duplicate entries and repeated EPD versions were identified and removed programmatically. In cases where RSL data was missing, these omissions were also documented to highlight data gaps. Finally, all extracted information, including the number of documents without RSL data and the frequency of each reported RSL value, was compiled into a comprehensive dataset focused on non-structural building materials.
5. Dataset Limitations
There are three main limitations that this study faced: First, manufacturers were contacted to obtain information on product service life, whether derived from test results or client feedback. However, clear answers were not provided in most cases. Many expressed concern that disclosing service life information might be interpreted as a warranty commitment or, if the lifespan appeared short, could imply inferior product quality. Therefore, the dataset relies primarily on reported values rather than independently verified performance data. This may introduce a tendency toward conservative or commonly assumed service life values and limits the ability to determine the level of evidence underlying individual RSL claims.
Second, the survey-based reports reviewed in this study employed different categorization schemes, making it difficult to organize and compare the data consistently across different sources. Despite these inconsistencies, this study consolidated the available information to the best extent possible.
Third, challenges arose when reviewing EPDs in databases such as Material Compass and EC3. Many EPDs reported a RSL of 75 years. This is problematic because certain standards, such as UL Environment Standard 10010 (Product Category Rules for Building Related Products and Services), state that if primary data to support a declaration is unavailable, a default RSL of 75 years may be assumed [2]. Due to the insufficient information on EPDs, it remains unclear whether the reported RSL values in the databases are based on experimental tests, surveys, general assumptions, or if they simply reflect the default value prescribed by the standard.
In addition, to provide a deeper examination of the dataset limitations, it is important to explicitly outline the potential bias pathways that may influence the findings. These limitations shape the interpretation of the results and define the scope within which the dataset can be reliably used.
- (1)
- Selection bias: The dataset reflects only publicly disclosed and voluntarily reported RSL values. Manufacturer reluctance to publish detailed service life information may result in underrepresentation of certain products, meaning the dataset does not capture the full market landscape.
- (2)
- Artificial consensus bias: The frequent use of default or benchmark RSL values may create a clustering effect in the data. High frequency values should not be interpreted as evidence of validated performance but rather as an indication of reliance on standardized assumptions.
- (3)
- Comparability bias: Inconsistent product classifications, variations in reporting formats, and differing levels of methodological justification across EPDs limit the validity of direct comparisons between categories.
6. Conclusions
This study combined industry consultations, global review of available standards and technical reports, and systematic analysis of all available North American EPDs available from online databases. Examination of five major published reports and 1612 relevant EPDs revealed many data gaps and substantial inconsistencies in reported RSLs. On the report side, many values come from client surveys, which can be unreliable because local climate varies, responses may be inaccurate, product durability changes under real operating conditions, maintenance practices differ, and manufacturers’ responses are not always consistent. Some reports also assign one fixed value to all products in a category, for example, a single value for insulation, overlooking the distinct durability characteristics of products such as glass wool versus organic insulation. A further limitation is the age of the available data, sometimes more than two decades old, much of which does not reflect modern manufactures technologies and product innovations, reducing its applicability to the current construction practices.
On the EPD side, more than half of the documents do not report any RSL, whereas many of the remaining ones simply adopt default values of 60 or 75 years, mirroring generic recommendations from standards rather than reflecting product-specific evidence. The rest report inconsistent values, with no clear methodological justification. All these findings show the need to develop a new consolidated RSL dataset.
In conclusion, this study highlights the substantial lack of consistency in RSL data for non-structural building materials. The analysis indicates that many RSL values tend to cluster around commonly adopted default benchmarks, suggesting a frequent reliance on assumed or standardized reference values rather than clearly documented, product-specific evidence. At the same time, the availability and depth of RSL information vary considerably across product categories, with some EPDs providing detailed justification while others offer limited or no methodological explanation. These patterns reveal a significant gap in current reporting practices and underscore the urgent need for more standardized, evidence-based, and methodologically transparent disclosure of RSL data. Clearer documentation of assumptions, data sources, and calculation approaches is essential to strengthen the reliability, consistency, and overall credibility of reported service life values in EPDs.
Despite these limitations, the compiled dataset offers valuable benefits for research, industry, and policy. For researchers, it improves the accuracy of LCAs and LCCs by clarifying how assumed RSL values affect assessment outcomes and by demonstrating that reliance on fixed numbers can lead to misleading results. For manufacturers, it serves as a consolidated resource drawn from EPDs that reveals reporting patterns and gaps across product categories, while also highlighting the need for experimental validation to establish credible RSLs and achieve more realistic ESLs. For policymakers and standards organizations, the dataset points to deficiencies in current reporting practices and emphasizes the importance of clearer methodological guidance, stricter verification mechanisms and harmonized reporting protocols for RSLs to enhance the reliability of building performance assessments.
7. User Notes
This dataset provides harmonized RSL information for non-structural building envelope materials in North America, compiled from the survey-based literature and EPDs. It is intended to support both research and applied work in building environmental performance assessment.
A key contribution of the dataset is its explicit identification of major gaps and inconsistencies in existing RSL data, including missing values, reliance on outdated survey-based estimates, and widespread use of unjustified default RSLs. Making these limitations visible raises awareness of data quality issues and supports more critical interpretation of service life assumptions in building performance studies.
The dataset can also inform region-specific LCA database development, support durability- and maintenance-informed design decisions, and assist policymakers, database developers, and industry stakeholders in establishing more consistent and evidence-based RSL values for non-structural building components.
The authors used the dataset to examine the sensitivity of LCA results to variations in non-structural material RSLs across different building typologies. By documenting reported RSL values, their frequencies, and the extent of missing or default data, the dataset enables transparent sensitivity and uncertainty analyses in LCA and ESL modeling, moving beyond fixed or generic service life assumptions.
The dataset is publicly available as an Excel file on the National Research Council (NRC) website at https://doi.org/10.4224/40003877.
Author Contributions
Conceptualization, M.A.L. and M.R.; methodology, S.S., M.R. and M.A.L.; software, S.S.; validation, M.R. and E.E.; formal analysis, S.S.; investigation, S.S.; resources, S.S. and M.R.; data curation, S.S.; writing—original draft preparation, S.S.; writing—review and editing, M.R., E.E. and M.A.L.; visualization, S.S.; supervision, M.R.; project administration, M.R.; funding acquisition, M.R. All authors have read and agreed to the published version of the manuscript.
Funding
The financial support for this research work was provided by the Low Carbon Built Environment Challenge program through the Platform to Decarbonize the Construction Sector at Scale at the National Research Council Canada.
Institutional Review Board Statement
Not applicable.
Informed Consent Statement
Not applicable.
Data Availability Statement
The dataset for reference service life is available at NRC Publications Archive: Direct URL to data: https://doi.org/10.4224/40003877; URL to the report of data: https://doi.org/10.4224/40003911.
Conflicts of Interest
The authors declare no conflicts of interest.
Abbreviations
The following abbreviations are used in this manuscript:
| BCIS | Building Cost Information Service |
| BBSR | Bundesinstitut für Bau Stadt und Raumforschung |
| CMHC | Canada Mortgage and Housing Corporation |
| CSA | Canadian Standards Association |
| EPD | Environmental Product Declaration |
| EPS | Expanded Polystyrene |
| ESL | Estimated Service Life |
| GHG | Greenhouse Gas |
| GWP | Global Warming Potential |
| InterNACHI | International Association of Certified Home Inspectors |
| ISO | International Organization for Standardization |
| LCA | Life Cycle Assessment |
| LCCs | Life Cycle Costs |
| NAHB | National Association of Home Builders |
| NR | No Replacement |
| OSB | Oriented Strand Board |
| PIR | Polyisocyanurate Foam |
| PVC | Polyvinyl Chloride |
| PUR | Polyurethane |
| RR | Replacement Rate |
| RSL | Reference Service Life |
| TSL | Total service life |
| WbLCA | Whole Building Life Cycle Assessment |
| XPS | Extruded Polystyrene |
References
- CSA S478:19; Durability in Buildings. Canadian Standards Association: Rexdale, ON, Canada, 2019.
- Fnais, A.; Rezgui, Y.; Petri, I.; Beach, T.; Yeung, J.; Ghoroghi, A.; Kubicki, S. The application of life cycle assessment in buildings: Challenges, and directions for future research. Int. J. Life Cycle Assess. 2022, 27, 627–654. [Google Scholar] [CrossRef] [Scilit]
- Silva, A.; De Brito, J. Service life of building envelopes: A critical literature review. J. Build. Eng. 2021, 44, 102646. [Google Scholar] [CrossRef] [Scilit]
- Emídio, F.; de Brito, J.; Gaspar, P.L.; Silva, A. Application of the factor method to the estimation of the service life of natural stone cladding. Constr. Build. Mater. 2014, 66, 484–493. [Google Scholar] [CrossRef] [Scilit]
- Galbusera, M.; De Brito, J.; Silva, A. Application of the factor method to the prediction of the service life of ceramic external wall cladding. J. Perform. Constr. Facil. 2015, 29, 04014086. [Google Scholar] [CrossRef] [Scilit]
- Hoxha, E.; Bazzana, M.; Habert, G.; Roy, R.L. Influence of service life on building LCA. In Proceedings of the Durability of Building Materials and Components (XIII DBMC), Sao Paulo, Brazil, 2–5 September 2014. [Google Scholar]
- Francart, N.; Malmqvist, T. Investigation of maintenance and replacement of materials in building LCA. IOP Conf. Ser. Earth Environ. Sci. 2020, 588, 032027. [Google Scholar] [CrossRef] [Scilit]
- Jorba, V.M.; Palumbo, E.; del Rosario, P.; Traverso, M. Interpreting environmental impacts of wooden windows based on existing EPDs: An application in Italy. Energy Build. 2025, 326, 114987. [Google Scholar] [CrossRef] [Scilit]
- Morales, M.F.D.; Reguly, N.; Kirchheim, A.P.; Passuello, A. Uncertainties related to the replacement stage in LCA of buildings: A case study of a structural masonry clay hollow brick wall. J. Clean. Prod. 2020, 251, 119649. [Google Scholar] [CrossRef] [Scilit]
- UL Environment. Part A: Life Cycle Assessment Calculation Rules and Report Requirements. In Product Category Rule (PCR) Guidance for Building-Related Products and Services; UL Environment: Northbrook, IL, USA, 2018. [Google Scholar]
- National Institute of Standards and Technology. Building for Environmental and Economic Sustainability (BEES) Online 2.0 Technical Manual; National Institute of Standards and Technology: Gaithersburg, MD, USA, 2018. [Google Scholar]
- National Association of Home Builders. Study of Life Expectancy of Home Components; National Association of Home Builders: Washington, DC, USA, 2007. [Google Scholar]
- The International Association of Certified Home Inspectors. InterNACHI’s Standard Estimated Life Expectancy Chart for Homes; The International Association of Certified Home Inspectors: Boulder, CO, USA, 2021. [Google Scholar]
- BS EN 15978:2011; Sustainability of Construction Works—Assessment of Environmental Performance of Buildings—Calculation Method. British Standards Institution: London, UK, 2011.
- The Building Cost Information Service. Life Expectancy of Building Components: Surveyors’ Experiences of Buildings in Use; The Building Cost Information Service: London, UK, 2006. [Google Scholar]
- Bundesinstitut für Bau-, Stadt- und Raumforschung (BBSR). Nutzungsdauern von Bauteilen für Lebenszyklusanalysen nach Bewertungssystem Nachhaltiges Bauen; Bundesinstitut für Bau-, Stadt- und Raumforschung (BBSR): Bonn, Germany, 2017. [Google Scholar]
- Canada Mortgage and Housing Corporation. Capital Replacement Planning Manual; Canada Mortgage and Housing Corporation: Ottawa, ON, Canada, 2003. [Google Scholar]

Disclaimer/Publisher’s Note: The statements, opinions and data contained in all publications are solely those of the individual author(s) and contributor(s) and not of MDPI and/or the editor(s). MDPI and/or the editor(s) disclaim responsibility for any injury to people or property resulting from any ideas, methods, instructions or products referred to in the content. |
© 2026 by the authors. Licensee MDPI, Basel, Switzerland. This article is an open access article distributed under the terms and conditions of the Creative Commons Attribution (CC BY) license.