Abstract
Accurate river discharge forecasting remains a critical challenge in hydrology, particularly in data-scarce mountainous regions where in situ observations are limited. This study investigated the potential of long short-term memory (LSTM) networks to improve discharge prediction by leveraging spatially distributed reanalysis data. Using the ERA5-Land dataset, we developed an LSTM model that integrates grid-based meteorological inputs and assesses their relative importance. We conducted experiments on two snow-dominated basins with contrasting physiographic characteristics, the Uba River basin in Kazakhstan and the Flathead River basin in the USA, to answer three research questions: (1) whether full-grid input outperforms reduced configurations and models trained on Caravan, (2) the impact of spatial resolution on accuracy and efficiency, and (3) the effect of partial spatial coverage on prediction reliability. Specifically, we compared the full-grid LSTM with a single-cell LSTM, a basin-average LSTM, a Caravan-trained LSTM, and coarser cell aggregations. The results demonstrate that the full-grid LSTM consistently yields the highest forecasting performance, achieving a median Nash–Sutcliffe efficiency of 0.905 for Uba and 0.93 for Middle Fork Flathead, while using coarser grids and random subsets reduces performance. Our findings highlight the critical importance of spatial input richness and provide a reproducible framework for grid selection in flood-prone basins lacking dense observation networks.
1. Introduction
One of the major achievements of modern Earth sciences is the rapid advancement in climate observation, monitoring of anthropogenic impacts, and the accumulation of environmental data. This progress is exemplified by the development of prominent platforms such as Google Earth Engine, Earthdata/OpenET, Sentinel Hub, and Microsoft Planetary Computer, among others. These systems integrate satellite observations, meteorological station records, and climate model outputs, covering the majority of the Earth’s surface. The accessibility of such data enables forecasting of hazardous events and natural disasters even in regions without established meteorological monitoring networks [1,2,3,4]. Among these events, floods and inundations are becoming increasingly frequent, yet under global change, new uncertainties make these events even harder to predict. According to the World Meteorological Organization [5], the reported number of flood events has risen by 134% over the two decades since 2000.
Alongside the growing volume of environmental data available for analysis, there has also been significant progress in data analysis and artificial intelligence methods and models. A review [6] cites 228 studies specifically focused on flood prediction using machine learning (ML) approaches. In total, the authors analyzed the performance of over 6596 articles and identified 180 original and influential works, including several pioneering studies [7,8,9,10,11,12,13,14,15]. Forecasting approaches encompass both physically based hydrological models and data-driven ML models trained on historical data. As noted in [6], “The continuous advancement of ML methods over the last two decades demonstrated their suitability for flood forecasting with an acceptable rate of outperforming conventional approaches.”
Early applications of ML for flood forecasting date back to 1995. For instance, one seminal work [7] explores the use of neural networks for rainfall–runoff prediction, article [8] addresses river stage prediction, and [9] focuses on river flood forecasting using neural networks. One study [10] is among the first to apply the support vector machine (SVM) method [16] to flood stage forecasting. The abovementioned review [6] covers the evolution of ML and deep-learning (DL) methods in flood prediction from 1995 to 2017, including models such as artificial neural networks (ANN), SVM, adaptive neuro-fuzzy inference systems (ANFIS), wavelet neural networks (WNN), and decision trees (DTs). Notably, long short-term memory (LSTM) networks [17], which have become prominent in time-series forecasting, began to appear in flood forecasting literature around 2018, with their adoption increasing significantly thereafter.
To the best of our knowledge, studies [18,19] represent some of the earliest applications of the LSTM model in flood forecasting, published nearly concurrently with the comprehensive review of [6]. In study [18], both ANN and LSTM models are trained using data from 1971 to 2013 in the Fen River basin, China, encompassing 14 rainfall stations and one hydrological station. The findings indicate that both models are suitable for rainfall–runoff simulations and outperform traditional conceptual and physically based models. Ref. [19] utilizes an LSTM model on data from 241 watersheds, employing the open CAMELS dataset [20] for streamflow prediction. The authors demonstrate that an LSTM model trained across multiple watersheds performs comparably to the established Sacramento soil moisture accounting model (SAC-SMA) combined with the Snow-17 snow accumulation and ablation model, while offering advantages in computational efficiency. Another study [21], published in 2018, explores the use of LSTM as an alternative to computationally intensive physical models in hydrology. It successfully predicts water table levels based on 14 years of monthly data, including variables such as water diversion, evaporation, precipitation, temperature, and time, to forecast water table depth. The proposed model achieves higher R2 scores (0.789–0.952) compared to traditional feedforward neural networks.
Building upon their previous work, the authors of [19] performed another study [22] where they trained an LSTM model on 531 basins from the CAMELS dataset, incorporating meteorological time-series data and static catchment attributes. This approach significantly improves performance relative to various hydrological benchmark models. In [23], the interdisciplinary potential of emerging DL models is highlighted. The review emphasizes the gradual adoption of DL in hydrology and is aimed at providing hydrologists and water resource scientists with a technical overview of DL’s relevance. Subsequently, DL models based on LSTM have been effectively applied to predict river levels in basins characterized by rapid changes in water discharge [24]. Currently, LSTM networks are widely utilized for forecasting river levels, rainfall, water discharge, and even drought conditions [25], owing to their capability to process time-series data and capture long-term dependencies.
Given the diverse natural conditions and the presence of meteorological and hydrological monitoring networks, flood prediction studies are tailored to specific regions considering factors that depend on local observation conditions. In certain studies, predictions rely on data from meteorological stations and hydrological posts, as demonstrated in [17,18,19,20,21,22,24,25,26,27,28,29,30,31,32,33,34]. In some instances, such data suffice to achieve high predictive accuracy. For example, study [26] reports Nash–Sutcliffe efficiency (NSE) values of 99%, 95%, and 87% for one-day, two-day, and three-day forecasts, respectively. In [27], hourly water level measurements from upstream hydrological posts enable high forecast accuracy within a 1 to 24 h interval. However, Ref. [28] highlights the method’s limited robustness for long-term forecasts and its reduced accuracy in predicting peak flow values. Consequently, a series of methodological refinements are implemented, including flow vectorization concerning minimum, maximum, and average values. Study [29] compares the performance of random forest (RF), gradient boosting regression (GBR), and LSTM methods. The analysis considers both static runoff parameters and dynamic factors, such as precipitation and influencing flow behavior. Overall, the model accurately classifies floods in over 80% of cases and exhibits a relative error in peak flood estimates of less than 30% in most scenarios.
LSTM models have also been employed for flood index forecasting. In studies [30,31], real-time data processing demonstrated high predictive accuracy, with a low root mean square error (RMSE) of approximately 0.1. Study [31] introduces a DL model based on LSTM networks combined with particle swarm optimization (PSO), where PSO was used for automatic hyperparameter tuning. The model focuses on the Jinghe watershed in the Fenhe River and the Lushi watershed in the Luohe River, using precipitation and runoff data from local observation stations. The authors show that the PSO–LSTM model improves forecasting accuracy, especially for lead times greater than six hours, and outperforms both ANN and standard LSTM models in terms of precision and robustness. The same modeling framework is applied in [32] for flash flood prediction in mountainous watersheds, using precipitation and inflow discharge data at the watershed entry points. Forecasts are made for both short-term (1–5 h) and longer-term (6–10 h) intervals. Precipitation is identified as the key predictor for driving model performance.
Despite these advancements, study [33] demonstrates a major limitation of LSTM models: prediction errors increase exponentially with longer lead times, diminishing their utility as early-warning tools with sufficient advance notice. To mitigate this issue, the authors incorporate data from nearby monitoring stations. The validation dataset included hourly discharge records from 2012 to 2017 from six stations along the Humber River in Toronto, Canada. The study tests forecasts with 6 and 12 h lead times using the previous 24 h of discharge data as input. The results indicated that a modified spatiotemporal attention LSTM (STA-LSTM) outperformed CNN-LSTM, ConvLSTM, and standard LSTM models when the forecast horizon exceeded six hours. These findings suggest that integrating spatially distributed input data can substantially improve prediction accuracy.
Several recent studies have also demonstrated that incorporating gridded and spatially distributed data into LSTM-based architectures significantly improves flood forecasting accuracy [35,36,37]. One prominent example is a study [35] focused on flash flood prediction in Ellicott City, Maryland. The authors develop a hybrid ConvLSTM model integrating multiple spatiotemporal data sources, including GPM IMERG satellite precipitation, NEXRAD radar mosaics, and soil moisture fields from the Noah land surface model. They preprocess inputs into 1 km-resolution gridded tensors over a 36 × 48 km domain and feed them into a multi-headed architecture combining ConvLSTM and traditional LSTM layers. The model is trained to predict stream levels at hourly intervals with up to 8 h lead times. Compared to standard LSTM, the hybrid architecture reduces RMSE by approximately 26% during peak events.
In [36], the authors propose ConvLSTM for flood index forecasting in Fijian catchments with spatially distributed daily rainfall from nine stations. Their model outperforms conventional LSTM and feedforward networks, showing that even coarse-resolution spatial inputs enhance flash flood prediction. In [37], a CNN-LSTM model across 226 Canadian basins is applied. Daily reanalysis maps of precipitation and temperature serve as inputs, forming a temporal sequence of spatial climate snapshots. The CNN extracts spatial features, while LSTM handles temporal dependencies. The model achieves a median NSE of 0.68 and exceeds 0.9 in several ungauged basins. In [38], a spatiotemporal attention LSTM (STA-LSTM) is proposed for sub-hourly flood forecasting in three Chinese basins. Using hourly rainfall from multiple stations and discharge data, the model applies spatial and temporal attention to identify key inputs. It reaches R2 values up to 0.96 and significantly improves RMSE and MAPE compared to baseline LSTM. In [39], the authors forecast daily water levels in Bangladesh using multiple hydrological stations. Their STA-LSTM model integrates upstream and neighboring station data via attention mechanisms, improving forecasts for locations like Dhaka and Sylhet. The model achieves NSE up to 0.96 and reduces RMSE by over 20% relative to traditional LSTM. These studies confirm that integrating spatially distributed inputs such as precipitation maps, soil moisture fields, and multi-station hydrological data enhances LSTM-based flood forecasting. ConvLSTM, CNN-LSTM, and attention-based models better capture spatiotemporal dependencies, improving peak prediction and enabling longer lead-time warnings.
This transition from point-based to spatially aware models is well supported by a range of recent methodologies for incorporating gridded data. The authors of [40] systematically evaluate LSTMs with catchment-mean rainfall input against models with spatially distributed rainfall. In one paper, Daymet [41] rainfall is aggregated from its native 1 km grid resolution to sub-catchment units, and these spatial rainfall vectors are fed into a model that predicts daily river discharge with 1-, 7-, and 15-day lead times, concluding that the inclusion of spatial information consistently improves model performance. Other studies also experimented with different approaches handling gridded data, for example, [42] demonstrated that flood forecasts improve when thirteen GLDAS grid-level meteorological variables at ~25 km resolution are fed into an LSTM to predict next-day streamflow at the Fuping catchment outlet. Input data are first screened with the gamma test, which identifies the most informative cells and establishes a clear, data-driven link between spatial inputs and discharge response. Study [43] built a grid-based LSTM driven by CMIP6 climate data forcing and showed that adding static grid attributes such as elevation and vegetation cover boosted runoff prediction compared to models using meteorological forcing alone. More specifically, monthly precipitation, temperature, previous monthly runoff, and static DEM + NDVI layers on a ~25 km grid are utilized to project monthly runoff for 2016–2045 in the Yellow River source region under CMIP6 SSP scenarios.
Methodological advances now span the full pipeline, from refined gridded inputs to the deep-learning architectures that process them. To exploit the spatial structure of the data, Ref. [44] embedded gridded rainfall and discharge fields in a ConvLSTM to predict discharge 20 h ahead, enabling the model to learn spatiotemporal patterns that govern flood formation and routing. Taking things a step further, the authors of [45] proposed a two-stage pipeline: first, a neural network predicts local runoff on a fine-grained, regular grid, and second, another network routes these distributed runoff quantities through the river network. The model’s inputs combine eight daily ERA5-Land meteorological grids at ~8 km resolution with 46 static physiographic layers, driving an LSTM that produces one-day streamflow forecasts. As was highlighted, research has evolved from demonstrating that spatially explicit inputs enhance model skill to engineering ever more sophisticated, grid-centric deep-learning architectures that harness those inputs for sharper, more reliable flood forecasts across diverse basins.
In this study, we addressed the problem of predicting water discharge for the Uba River in the Republic of Kazakhstan. A defining characteristic of this river is that most of its basin lies in remote mountainous terrain under the challenging conditions of a sharply continental climate. However, since the basin is located on the edge of a large mountain range that traps moisture-laden westerly air masses, it receives substantial precipitation and experiences pronounced floods. As a result, within the basin’s area of approximately 9900 square kilometers, there are only two meteorological stations and two hydrological posts. This creates data scarcity due to practical constraints. In the upper reaches of the river, snow accumulates from November to March, with the snowpack reaching depths of up to 1.5 to 2 m in some years. In spring, rapid snowmelt leads to a sharp rise in river levels, posing a threat to nearby settlements. Moreover, there are no flow-regulating structures on the river.
To address the challenges posed by data scarcity and complex environmental conditions in the Uba River basin, we propose an approach that leverages deep learning to improve discharge forecasting. We also applied this method to the Middle Fork Flathead River basin based on the availability of input data for the selected model. The Uba and Flathead (Middle Fork) rivers are representative of mountain river basins in a temperate continental climate, with predominantly snow- and glacier-fed regimes and catchment areas ranging from 3000 to 10,000 km2. An important feature of both basins is their location within protected natural reserves, which virtually eliminates any anthropogenic influence. Although the methodology proposed in this study is designed to be broadly applicable, it was first validated on hydrologically similar river basins to facilitate result comparison and minimize random influences.
Unlike studies [40,41,42,43,44,45] that downsample reanalysis data or introduce increasingly complex network designs, our study deliberately keeps the workflow simple while leveraging the latest gains in data resolution. Only six expert-selected predictors are used: precipitation, mean and maximum air temperature, snow-water equivalent, soil moisture, and soil temperature. We retain ERA5-Land variables covering the basin at their native ~8 km grid and feed them directly into LSTM. This grid-level framework offers a transparent and data-efficient strategy for flood forecasting in data-scarce mountainous regions.
Thus, this paper formulates three interrelated research questions, as follows.
- RQ-1. Whether the developed LSTM-grid can provide higher accuracy in forecasting water discharge based on ERA 5-Land data than all existing point model variants, namely:
- (a)
- an LSTM using only meteorological data from the 8 × 8 km cell containing the gauging station;
- (b)
- an LSTM treating the entire basin as a single aggregated cell;
- (c)
- an LSTM trained on a Caravan dataset.
- RQ-2. Which spatial resolution of cells (1 × 1, 2 × 2, or 3 × 3 ERA5-Land cells) provides the best compromise between forecast accuracy and computational cost in the Uba (East Kazakhstan) and Middle Fork Flathead (Montana, USA) river basins?
- RQ-3. How critical is full basin coverage? Does the model maintain accuracy and stability when part of the basin is excluded, or does incomplete coverage inevitably worsen the performance?
These research questions were addressed through experiments on forecasting water discharge in the Uba and Middle Fork Flathead River basins.
2. Materials and Methods
2.1. Study Area
The primary study site was the Uba River basin in East Kazakhstan, which lies on the northern flank of the Kazakh Altai. To demonstrate that the proposed approach generalizes beyond a single medium-sized catchment and climatic region, we included a second study area: the Middle Fork Flathead River basin in the northern Rocky Mountains of Montana, USA. Using two basins that differ in scale, physiography, and climate, but share a pronounced seasonal snow signal helps to quantify performance gains attributable to the proposed grid-based approach rather than to site-specific calibration artefacts. This dual-basin design therefore strengthens the empirical grounding of the findings and supports the broader applicability of the proposed methodology.
2.1.1. The Uba River Basin
The Uba River, a right-bank tributary of the Irtysh, flows through the Shemonaikha and Glubokoye districts and the city of Ridder in East Kazakhstan Region. It begins at the confluence of the White Uba and Black Uba and descends into the Irtysh valley, entering the Shulbinsk Reservoir and forming a delta. According to reference data, its total length—from the confluence of the White and Black Uba in the Rudny Altai to its mouth in the Irtysh—is 278 km and the drainage basin covers 9850 km2. For this study, the basin was limited to the hydrological gauge in Shemonaikha, totaling 8490 km2. Mountain ranges bound the Uba River basin: Tigirek to the northeast, Koksu to the east, Uba to the west, and spurs of the Ivanovsky and Lineysky ranges to the south [46]. The basin slopes generally southwest. Headwater elevations average 1000–1500 m and can exceed 2300 m, while the lower course drops to about 300 m. The channel is variable. In the headwaters, the steep relief and large elevation drop make it narrow and sharply graded, with many rapids and a swift current. In the middle and lower reaches, the channel widens and meanders, forming a valley that merges into the Irtysh valley, and the flow slows. The Uba is fed by many small and medium-sized tributaries that create a dense network. The main left-bank first-order tributaries are the White Uba, Sakmariha, Bolshaya Karaguzhiha, and Maloubinka, and the principal right-bank tributaries are the Black Uba, Stanovaya Uba, Beloporozhnaya Uba, and Maralushka. Most tributaries join in the river’s upper reaches.
The Uba River basin lies in a sharply continental climate zone with long, cold winters and short, relatively warm summers. The main meteorological parameters are based on many-year observations at the Kazhydromet station in Shemonaikha, which is located in the river’s lower reaches, leaving the upper basin less well covered by observational data. Mean annual air temperature is +4 … +6 °C. Average January temperature is about −17 °C (the typical range for the mountainous part of the region is −15 … −19 °C) [47], and the mean June temperature is +17.6 °C [48].
Extreme temperatures range from −50 °C in winter to +40 °C in summer. Annual mountain precipitation reaches 650 mm—and in the wettest years up to 1500 mm—with more than 60% falling as snow. A stable winter snowpack averages 0.8–1.3 m deep in valleys and up to 4–5 m in mountain pockets and on windward slopes. Peak accumulation occurs from February to mid-March [49]. Snow usually settles from mid-October (from late August on the summits), remains about 170 days, and melts completely by 15–30 April. In high mountains, it lasts 200–250 days. Average wind speed at 10 m is about 3 m s−1: roughly 4 m s−1 in winter (especially December), 2.7 m s−1 in summer, and 3.2–3.3 m s−1 in spring and autumn [50]. Southerly and southwesterly winds dominate in winter (30–60% of observations under the Siberian anticyclone), while in summer winds more often come from the north, northwest, and northeast, totaling 25–50% [51].
The Uba has mixed feeding dominated by snowmelt. The spring–summer freshet lasts April–July and supplies up to 80% of the annual flow. The rest comes from rain, glaciers, and groundwater. Intense summer and autumn storms can cause brief floods. From October–November to April, the river enters a low-flow period, and its start and end feature varied ice events. Freeze-up occurs in November–early December, breakup in April–early May. Ice forms include frazil, anchor jams, and temporary blockages.
Long-term Kazhydromet records at Shemonaikha show a mean water level of about 109.6 cm, with extremes from 11 cm (24 August 2012) to 502 cm (12 May 2001). Mean discharge is 157.6 m3 s−1, ranging from 3.55 m3 s−1 (28 February 2015) to 2140 m3 s−1 (12 May 2001). These values reveal the large seasonal swings typical of snow-fed mountain rivers.
2.1.2. Middle Fork Flathead River Basin Description
The Middle Fork Flathead River is formed by the confluence of two small streams, Strawberry Creek and Bowl Creek, in the Rocky Mountains of the northern United States. It flows through the state of Montana, and together with the North Fork Flathead River forms the Flathead River, which in turn flows into the Clark Fork River and then into the Pend Oreille River, a part of the Columbia River watershed. According to USGS reference data, its total length is 148 km and the drainage basin area is approximately 3004 km2. For the purposes of this study, the basin area is limited by the West Glacier MT hydrological gauge station and is about 2917 km2.
The Middle Fork Flathead River basin is situated between two mountain ranges in the eastern Rocky Mountains. To the north, it is bordered by the Lewis Range, and to the south, by the Flathead Range. The overall terrain slopes in a northwesterly direction. Elevation in the basin ranges from 760 to 1000 m, with sharp elevation changes throughout. Some individual peaks exceed 3000 m in height.
The riverbed of the Middle Fork Flathead River is heterogeneous, and its formation is primarily influenced by the mountainous terrain throughout the watershed. The headwaters of the river are located in a high-altitude area with a steep gradient, where the channel is narrow and rapidly filled. A more defined river valley begins to form in the middle reaches, where the channel becomes more meandering. In the lower reaches, the river’s flow slows significantly and the channel becomes wider, forming a well-defined valley with numerous meanders. In some sections, the river splits into multiple branches, creating many small islands.
Most of the tributaries of the Middle Fork Flathead River are small mountain streams. Among the most significant is McDonald Creek, which connects the river to the large glacial Lake McDonald.
The territory of the Middle Fork Flathead River basin is located in a moderate continental mountain climate zone, which is characterized by cool summers and long, cold winters with heavy snowfall. The description of the main meteorological characteristics is based on long-term observations from meteorological stations of the U.S. National Oceanic and Atmospheric Administration (NOAA), including stations in the Western Rocky Mountains of Montana.
- The average annual air temperature is about +3 to +5 °C. In January, the average temperature ranges from −10 to −15 °C in the valleys, while in the mountainous areas it can drop below −20 °C. In June, the average monthly air temperature is +15 to +17 °C. The absolute minimum temperature in winter can reach −40 °C, and the maximum in summer can reach 35 °C.
- The average annual precipitation varies from 500 to 600 mm in the valley areas to 1000 mm or more on the windward slopes of the highlands. More than 60% of the precipitation falls as snow, with the snow cover beginning to form in late October—early November. The maximum snow accumulation occurs in February—early March.
- In the valleys, the snow depth reaches 1.0–1.5 m, while on mountain slopes and in alpine zones it can exceed 4–5 m. Snowmelt usually occurs from mid-April to the end of May depending on the elevation. Snow cover remains in the valleys for 140–160 days and in the highlands for up to 200–250 days per year.
- The average annual wind speed at a height of 10 m is about 2.5–3.5 m/s, increasing in winter to 4–5 m/s. In winter, westerly and southwesterly winds prevail, associated with the activity of Pacific cyclones and mountain baric formations. In summer, northerly and northwesterly winds are more common, especially in the afternoon, as a result of local breeze circulations.
The Middle Fork Flathead River has a mixed feeding regime, with a predominance of snowmelt, rainfall, and glacial sources. The spring–summer high-water period lasts from late April through July, during which 70–80% of the annual runoff is generated. The remaining flow is sustained by summer rains, meltwater from high-mountain glaciers, and groundwater sources.
Summer and autumn thunderstorms, particularly in August and September, can cause short-term flood events. From October to March, the river experiences an autumn–winter low-flow period characterized by reduced surface runoff. The beginning and end of this period are accompanied by various ice phenomena.
Freezing of the river typically begins in November, and ice breakup occurs in April to early May. During winter, observed ice processes include the formation of frazil ice, anchor ice, and in narrow sections ice jams and temporary blockages.
According to long-term observations collected at the USGS [52] hydrological station near West Glacier (Montana):
- The average annual discharge of the Middle Fork Flathead River is approximately 115 m3/s.
- Recorded extremes range from 20 m3/s during winter low-flow periods to over 1400 m3/s during floods (with the maximum observed in June 1964).
- The average annual water level fluctuates between 90 and 150 cm depending on the season and year.
The main hydrographic, climatic, and hydrological characteristics of the basins are summarized in Table 1 below.

Table 1.
Summary of key characteristics of the Uba River basin and the Middle Fork Flathead River basin.
2.2. Data
2.2.1. Data Collection and Preprocessing
Due to the insufficient in situ observational coverage, daily meteorological and snowpack data were obtained from the ERA5-Land reanalysis collection via the Google Earth Engine platform. Each study basin was divided into an 8 km × 8 km grid, approximating the native resolution of ERA5-Land. Figure 1 and Figure 2 illustrate the Uba and Flathead basins, respectively, discretized into 8 km × 8 km grids.
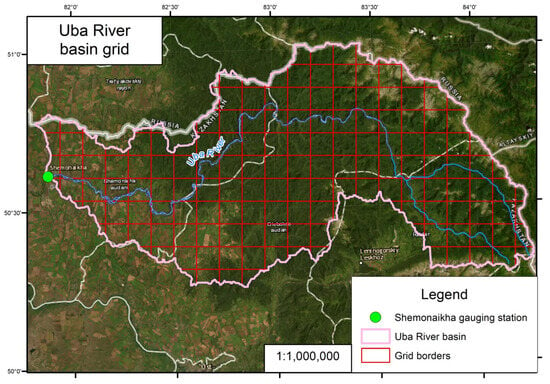
Figure 1.
Grid map of the Uba River basin, divided into 8 km × 8 km cells.
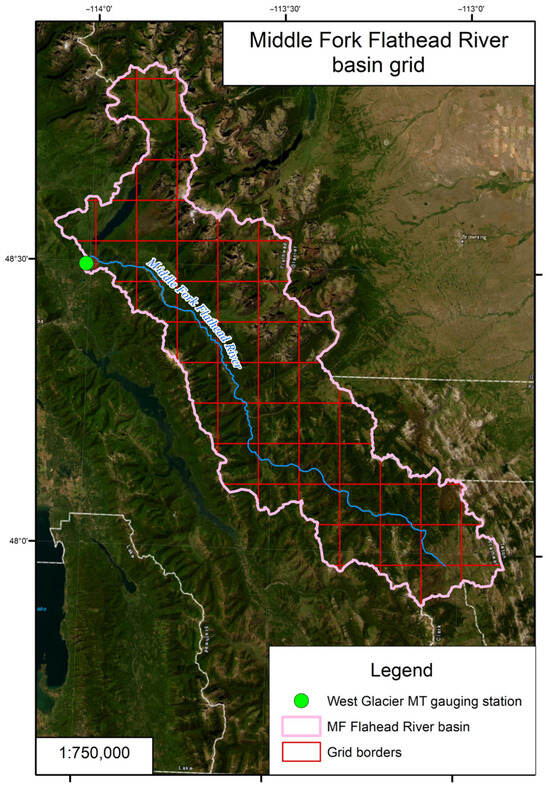
Figure 2.
Grid map of the Middle Fork Flathead River basin, divided into 8 km × 8 km cells.
For every grid cell, time series of daily average values were extracted for the hydrological seasons from 1 November to 31 May over the study periods. Data coverage was determined by the availability of continuous discharge records at each gauging station (Table 2). The retrieved variables included:

Table 2.
Summary of dataset characteristics for each basin, including number of grid cells, data coverage, split periods, and number of sequences.
- Air temperature (average and maximum) (K).
- Total precipitation (m).
- Snow water equivalent (m of water equivalent).
- Soil temperature at 0–7 cm depth (K).
- Volumetric soil moisture at 0–7 cm depth.
Each cell’s centroid coordinates, latitude and longitude, were also incorporated. All temperature values were converted from Kelvin to Celsius, and in order to account only for liquid precipitation, any daily total precipitation values recorded on days when the daily average air temperature was below 0 °C was set to zero. Daily water discharge (mm/day) measurements covering the same November–May period were obtained from the selected gauging stations: for the Uba River basin, discharge observations were retrieved from the National Hydrometeorological Service of the Republican State Enterprise (RSE) “Kazhydromet” [53]; for the Middle Fork Flathead River basin, water discharge time series and the basin shapefile were retrieved from the Caravan dataset [54].
Figure 3a,b illustrate the mean monthly streamflow from the gauging station in each basin and the mean monthly snow water equivalent (SWE), spatially averaged over the entire basin, for the Uba River basin and the Middle Fork Flathead River basin, respectively. Figure 4 shows the daily streamflow time series over the overlapping period 1995–2014, which highlights the interannual variability and peak streamflow timing in both basins.
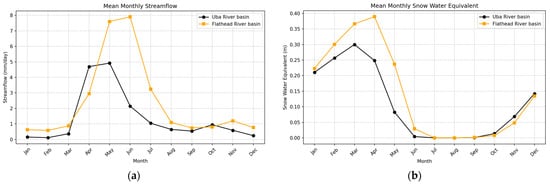
Figure 3.
Mean monthly values of Uba River basin and Flathead River basin for: (a) streamflow; (b) snow water equivalent.
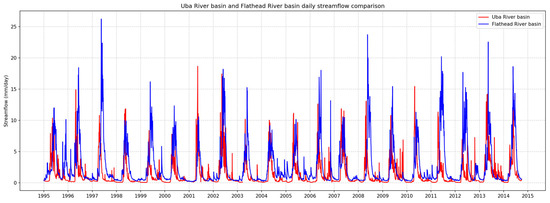
Figure 4.
Daily streamflow comparison of Uba River basin and Flathead River basin.
2.2.2. Input Data Structure
To prepare LSTM inputs, a data matrix was constructed in which each row represented observations from a single day and each column corresponded to a unique combination of predictor feature and grid cell identifier (e.g., feature1_cell_ID, feature2_cell_ID, etc.). Each of these feature–cell pairings was treated independently, resulting in columns structured as feature–cell combinations. Subsequently, all features were scaled using min–max normalization.
The input data were structured using a sliding-window approach. A fixed 30 consecutive days was shifted forward 1 day at a time to create multiple overlapping sequences. This process transformed the data into a tensor suitable for LSTM input (Equation (1)):
where is the total number of generated sequences (samples), is the sequence length (30 days), is the number of grid cells, and is the number of features per grid cell.
Each sequence window was then formed along the temporal axis, regulated by the rule that no window ever crossed the season boundary, from May back to November. The target for each sequence was defined as the observed daily discharge over the subsequent 7-day forecasting horizon.
Finally, the complete dataset was split into training, validation, and test subsets (see Table 2).
2.3. Model Architectures
2.3.1. LSTM Grid Model Architecture
A two-layer LSTM network implemented with the PyTorch (version 2.2.0) library was used for all experiments. Each layer had 65 hidden units, followed by a dropout of 0.2. A fully connected layer was used to produce the 7-day water discharge forecast. Training was performed using the AdamW optimizer with a learning rate of 5 × 10⁻⁴, a batch size of 64, and up to 50 epochs, saving checkpoints whenever the validation loss improved. The final model corresponded to the best-performing epoch.
Training and validation was performed on a single Nvidia GeForce RTX 3080 Ti Laptop GPU (CUDA version 12.1) with 20 logical (14 physical) CPU cores and a system memory of 31.7 GiB RAM (approximately 18.3 GiB available during runs). The software environment included Python 3.11.9 and full GPU acceleration.
2.3.2. Baseline Model Architecture
First, we established a baseline model denoted LSTM-L where the “L” stands for lumped. The LSTM-L model was trained on data from the Uba River basin, utilizing daily streamflow observations along with meteorological variables derived from ERA5-Land. These input variables were spatially averaged over the entire basin, providing lumped daily-scale forcing for the model.
The LSTM-Caravan model was trained on a combined dataset comprising 150 basins selected from the global Caravan dataset, along with the Uba River basin. This configuration enabled the model to leverage diverse hydrological patterns while incorporating local characteristics through joint training.
Both models were trained on a feature set comprising 210 static and 39 dynamic features. The static features described basin characteristics across six categories: hydrology, physiography, climate, land cover, soils and geology, and anthropogenic influences. Examples included elevation, slope, baseflow index, and land use fractions. The dynamic features were a time series of meteorological forcing such as precipitation, temperature, potential evaporation, wind components, soil moisture at various depths, and streamflow, all derived from ERA5-Land, aggregated to daily resolution, and averaged over the basin area.
The models were implemented using the NeuralHydrology framework and shared the same architecture. The models consisted of three layers: a linear input layer, a single LSTM layer with 256 hidden units, and a linear output layer. Training was performed using sequences of 365 days, with a dropout rate of 0.4 applied to mitigate overfitting. The models were optimized using the Adam optimizer with a learning rate of 0.0005 over 50 epochs. All training was conducted in the Google Collaboratory environment using an Nvidia A100 GPU.
2.3.3. Evaluation Metrics
Each model configuration was trained and evaluated ten times to account for variability in weight initialization. No manual random seed was set: the model relied on the default randomness behavior of the PyTorch LSTM implementation. All reported performance metrics represent the average across ten runs.
Model performance was assessed using Nash–Sutcliffe efficiency (NSE) [55] at the first lead time of the forecast horizon. This metric was chosen for its widespread use in hydrological modeling, effectively capturing predictive accuracy relative to the variance of observed streamflow values.
2.4. Experimental Setup
All experiments used the same model architecture, hyperparameters, and training protocols. Only the input configuration was changed to address each research question.
Experimental work 1 (RQ-1) evaluated several model configurations. The first was the LSTM-Grid, which ingests the full 8 × 8 km basin grid. The second was the point-only LSTM, which used data solely from the single grid cell containing the gauging station. The third was the aggregated-basin LSTM-L, which averaged dynamic inputs over the entire basin. The fourth was the LSTM-Caravan, pretrained on 150 global basins plus the Uba River basin. For the Uba River basin, all four models were compared. For the Middle Fork Flathead River basin, only the LSTM-Grid and LSTM-point were evaluated.
Experimental work 2 (RQ-2) examined whether coarsened spatial inputs can match the performance of the base grid model (LSTM-Grid). Non-overlapping 2 × 2 cell groups and 3×3 cell groups were defined, and within each group the six dynamic predictors were averaged. The resulting aggregated time series, together with each block’s centroid coordinates, were used as inputs, denoted LSTM-2by2 and LSTM-3by3, and compared against the LSTM-Grid.
Experimental work 3 (RQ-3) tested the effect of incomplete basin coverage. In sum, 100 independent random subsets of K grid cells were generated for each basin, and the LSTM-Grid model was trained on each subset. Model performance was then compared to the base grid baseline to evaluate forecast accuracy and stability under varying degrees of spatial information. Representative examples of aggregated input grids used in this experiment are shown in Figure 5 and Figure 6 for the Uba River and Flathead River basins, respectively.
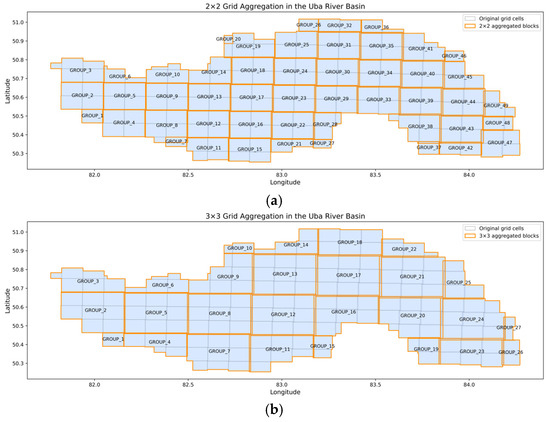
Figure 5.
Aggregated input grids for the Uba River basin: (a) 2 × 2 grid aggregation, (b) 3 × 3 grid aggregation. Blue shading represents the original 1 × 1 grid cells; orange lines outline the bounds of the resulting 2 × 2 - and 3 × 3-cell aggregated blocks.
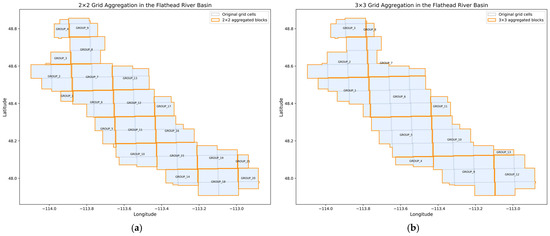
Figure 6.
Aggregated input grids for the Flathead River basin: (a) 2 × 2 grid aggregation, (b) 3 × 3 grid aggregation. Blue shading represents the original 1 × 1 grid cells; orange lines outline the bounds of the resulting 2 × 2 - and 3 × 3-cell aggregated blocks.
As shown in Table 3, the seven input scenarios evaluated in this study vary in spatial configuration, number of grid cells, and input matrix shape. The input shape indicates the number of days per sequence (fixed at 30 days), the number of grid cells used per basin, and the 8 features extracted for each grid cell.

Table 3.
Summary of LSTM input scenarios evaluated in experiments, including spatial configurations, number of grid cells, and resulting single-input matrix shapes for the Uba River and the Middle Fork Flathead River basins.
3. Results and Discussion
3.1. Performance Across All Model Configurations
The boxplot in Figure 7, comparing annual NSE across all nine scenarios for the Uba River basin, clearly demonstrates that the full-grid model LSTM-Uba-grid provides the best performance: it achieves the highest median NSE of 0.905 and the smallest year-to-year variability, indicating both predictive skill and stability.
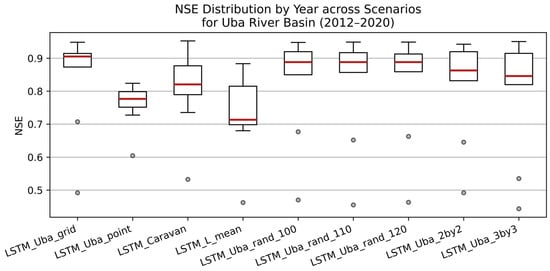
Figure 7.
Annual distribution of NSE for the period 2012–2020 across nine LSTM input scenarios in the Uba River basin. The red horizontal lines denote median NSE across test-set years; dots mark years with outlier performance.
The 2 × 2 aggregation model LSTM-Uba-2by2 delivers almost the same level of performance, but with a slightly larger spread of values. Random subset experiments achieve the same median of 0.888 for all K cells, yet their overall variability remains high, undermining reliability (each random-subset scenario aggregates NSE from 100 independent random samplings of K cells). Although it still outperforms the random subsets, the 3 × 3 aggregation model LSTM-Uba-3by3 exhibits a wider spread and an even greater number of outliers, likely due to excessive coarsening and loss of critical spatial information.
Among the reduced-input approaches, the LSTM-Caravan model trained on the Caravan dataset achieved higher central performance and moderate variability, outperforming both single-point LSTM-Uba-point and basin-mean LSTM-L-mean models, but underperforming compared to the spatial input cases.
The boxplot in Figure 8, which shows the annual distribution of the NSE values across seven model configurations for the Middle Fork Flathead River basin (2005–2014), supports the findings from the Uba River basin. The full-grid model (LSTM-Flathead-grid) provides the highest forecast estimation accuracy, reaching a median NSE value of about 0.93 with minimal interannual variability. As in the case of Uba River basin, the performance of models with a random selection of cells increases as the total number of cells increases: the K = 50 cell model (LSTM_Flathead_rand_50) is almost comparable to the full grid in most years. Models with aggregated 2 × 2 and 3 × 3 also show high NSE values.
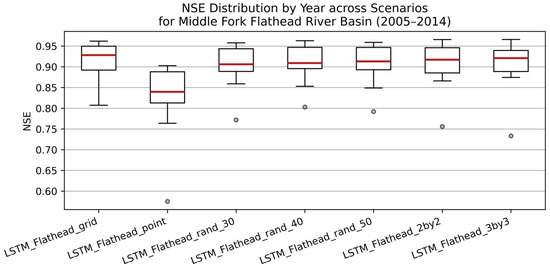
Figure 8.
Annual distribution of NSE for the period 2005–2014 across nine LSTM input scenarios in the Middle Fork Flathead River basin. The red horizontal lines denote median NSE across test-set years; dots mark years with outlier performance.
In contrast, the single-point model (LSTM-Flathead-point) shows significantly lower performance (median NSE ≈ 0.84) and high instability, including the lowest outlier among all models. It is noteworthy that even models with a random subset of only 30 cells are superior in quality to the point model, underscoring the importance of spatial input, even if partial. In general, although the full-grid model remains the most reliable and stable, models with aggregation (2 × 2, 3 × 3) or random sampling (from 40 cells) show good efficiency in the Middle Fork Flathead basin.
3.2. Comparison of Baseline Models (Simplified Input Models) with LSTM-Grid
From 2012 to 2020, the LSTM-Uba-grid model shows the highest annual NSE values; however, interesting patterns are revealed across the years. As shown in Figure 9, the full-grid model leads in 2012 (0.9052) and 2013 (0.8739), while LSTM-Caravan pretrained on different basins lags only slightly, indicating the ability of pretraining to compensate for some of the spatial information. In 2014, there is a sharp drop in both models (LSTM-Uba-grid = 0.4920, LSTM-L-mean = 0.4622) due to distortion of the actual discharge data. Despite this, LSTM-Caravan (0.5327) reacts to this anomaly less sharply. In 2015, LSTM-Caravan reached a maximum of 0.9314, surpassing LSTM-Uba-grid by only 0.017, demonstrating its advantages in a high-flow year. In 2017, both LSTM-Uba-grid and LSTM-Caravan achieved their highest NSE values, 0.9485 and 0.9524, respectively, demonstrating strong predictive performance under favorable hydrological conditions, with LSTM-Caravan model slightly outperforming the full-grid model that year. In 2018, the LSTM-Uba-point model outperformed others, reaching 0.7972, which may be explained by the better capture of local hydrometeorological features that year. Finally, in 2019 and 2020, the full-grid model once again leads, confirming that maintaining full spatial coverage remains the most reliable approach, although in certain years either large-scale pretraining or local observations may also show advantages.
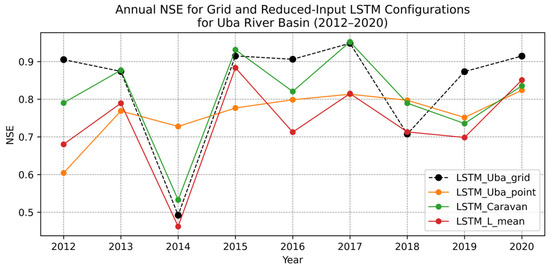
Figure 9.
Annual NSE for grid-based and reduced-input LSTM models for the Uba River basin.
Regarding the results for the Middle Fork Flathead River basin, the comparison focused on two model configurations: the full-grid model (LSTM-Flathead-grid) and the single-point model (LSTM-Flathead-point). From 2005 to 2014, the LSTM-Flathead-grid model consistently outperformed the point-based model, except in 2008 and 2009, where it reached almost identical values as the grid model. As shown in Figure 10, the LSTM-Flathead-point model exhibits lower performance and greater variability, including a sharp drop to 0.5752 in 2005, the lowest among all years and configurations. Despite the fact that the gap narrows slightly in 2009 and 2012, the LSTM-Flathead-grid model remains ahead, with annual differences often exceeding 0.05–0.10 NSE units. This gap is especially noticeable in 2010 and 2011, when the point model barely reflects the hydrological dynamics at the basin scale. These results confirm the earlier conclusions from the Uba River basin: although point models can offer a simplified alternative, the quality of their forecasts is less reliable, and full spatial coverage of the input data is still important for consistently accurate forecasts.
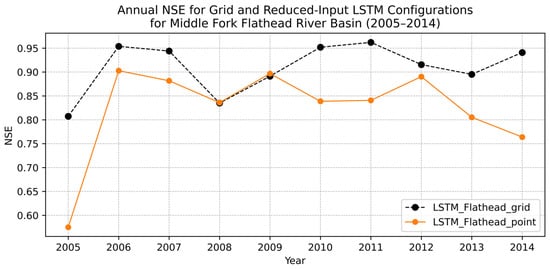
Figure 10.
Annual NSE for grid-based and point-based LSTM models for the Flathead River basin.
3.3. Effect of Spatial Aggregation on Grid Performance
Based on experimental work 2, two additional spatial aggregation scenarios, 2 × 2 and 3 × 3 cell groupings, were evaluated alongside the base full-grid model to assess the impact of input coarsening on model performance.
In preparation for assessing how input coarsening influences model performance, all six hydrometeorological variables were normalized to the [0–1] interval. For every evaluation year, we calculated parameter-wise variances on the native 1 × 1-cell grid (8 km × 8 km) and on its 2 × 2-cell (16 km × 16 km) and 3 × 3-cell (24 km × 24 km) groupings. Information loss was then expressed for each grid as the mean Frobenius norm (averaged across all parameters) of the difference between the variance matrix of the native fine-grained grid and that of each coarser grid.
For the Uba River basin, the results show that the full-grid model provides the highest modeling accuracy: the median NSE value for the period 2012–2020 was 0.905. In six out of nine years (2013, 2014, 2016, 2017, 2018, 2019), it outperformed the coarser grids. Aggregated grids showed the best results only in certain years with low- (2012, NSE = 0.9198) and high-flow (2015, NSE = 0.9506) years and in 2020 (0.9154), a year in which coarsening the 1 × 1-cell grid to 2 × 2 and 3 × 3 cells changed NSE by less than 0.01, indicating that the removal of fine-scaled spatial variability has a negligible impact on model performance (Table 4).

Table 4.
Annual NSE values for the LSTM model for different grid sizes for Uba River basin. The best results by year are highlighted in bold.
The greatest reductions in NSE for the aggregation of cells occur in problematic years. For example, in 2018, the NSE for the LSTM-Uba-2by2 is lower by 0.062 units, and for the LSTM-Uba-3by3 grid, it is lower by 0.173 units compared to the LSTM-Uba-grid. This shows that at coarse resolution, the model becomes significantly more sensitive to non-standard hydrological conditions and to distorted data (in 2014).
Figure 11a quantifies the information lost when the grid is coarsened, displaying boxplots of the mean Frobenius-norm loss. A median loss of 0.011 with a narrow interquartile range is observed for the 2 × 2 aggregation, whereas the 3 × 3 grouping provides a larger median loss (0.026) and substantially greater spread. Figure 11b illustrates the direct effect of this loss on model performance: as grid resolution decreases, the median NSE declines from 0.905 to 0.863 and subsequently to 0.846, while the spread of NSE widens. In other words, small information losses at 2 × 2 correspond to only a modest decline in forecast accuracy, whereas the larger, more variable losses at 3 × 3 map onto a noticeably lower and less stable NSE distribution.
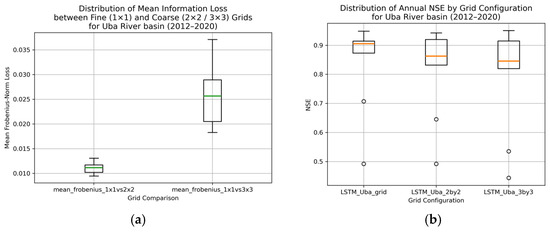
Figure 11.
Boxplots comparing (a) mean Frobenius-norm variance losses and (b) annual NSE distributions across 1 × 1, 2 × 2, and 3 × 3 grid groupings for the Uba River basin. In (a), the green line denotes the median Frobenius-norm loss; in (b), the orange line denotes the median NSE, and the dots mark outlier years.
Thus, the optimal cell resolution for modeling river flow in the Uba River basin is a full grid (8 × 8 km), which ensures maximum predictive performance and stability of the results. Since the base grid has a spacing of ≈ 8 × 8 km, which is practically nearly the same as the nominal resolution of ERA5-Land (0.1° ≈ 9 km), further enlarging the cells to 16 × 16 km and 24 × 24 km actually combines several ERA5-Land pixels into one model cell. This smooths out orography, precipitation, and snow reserves, which causes the model to lose local variability and, as our experiments have shown, leads to average NSE reductions of approximately 2% for 2 × 2 and −4.6% for 3 × 3 grids across all years. An aggregation into 2 × 2 grid can be used as a compromise option only if it is necessary to reduce computational costs at the cost of a small loss in performance, whereas a coarse 3 × 3 grid is recommended only for calculations of a rough water balance with extremely limited computing resources and low requirements for forecast detail.
When it comes to testing on the Middle Fork Flathead River basin, the performance differences between these models are generally smaller than those observed in the Uba River basin (Table 5).

Table 5.
Annual NSE values for the LSTM model for different grid sizes for the Middle Fork Flathead River basin. The best results by year are highlighted in bold.
In 5 out of 10 years, the base grid model outperforms the LSTM-Flathead-2by2 and LSTM-Flathead-3by3 models. However, the 2 × 2 and 3 × 3 aggregations show competitive results in the remaining years: in 2006, 2008, 2011, 2012, and 2013, one of the aggregated models matches or slightly exceeds the LSTM-Flathead-grid model’s NSE. In both 2008 and 2013, aggregated models (especially 3 × 3) outperform the full grid. These may be years with increased data uncertainty, sparse meteorological signals, or reduced hydrological variability, where smoothing inputs helps the model generalize better. This is likely due to the fact that unlike the Uba River basin, the Flathead River basin model’s accuracy is less sensitive to reduced resolution.
Figure 12a shows that aggregating the Middle Fork Flathead grid from 1 × 1 to 2 × 2 cell results in a median loss of 0.014, with occasional years reaching 0.019. Further coarsening to 3 × 3 cells lowers the median loss slightly to 0.013 and shortens the upper whisker, indicating that very large losses occur less frequently while the IQR remains virtually unchanged. Figure 12b shows the corresponding effect on predictive skill: the fine grid delivers the strongest and most consistent NSE values (median NSE = 0.928), moving to 2 × 2 cells lowers overall skill and introduces greater year-to-year variability (median NSE = 0.917), while the 3 × 3 grid recovers some of the lost median accuracy, yet remains prone to occasional sharp performance drops (median NSE = 0.921).
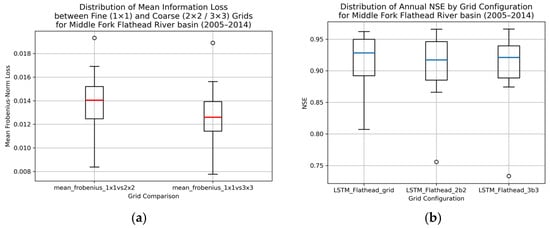
Figure 12.
Boxplots comparing (a) mean Frobenius-norm variance losses and (b) annual NSE distributions across 1 × 1, 2 × 2, and 3 × 3 grid groupings for the Middle Fork Flathead River basin. In (a), the red line denotes the median Frobenius-norm loss; in (b), the blue line denotes the median NSE. Dots in both (a) and (b) mark outlier years.
In summary, the effect of grid aggregation varies by basin and year. In the Uba basin, the native 1 × 1 grid resolution produces the highest and most stable NSE values. Similarly, in the Middle Fork Flathead basin, this fine resolution also results in the highest median NSE, although with greater variability. Moderate coarsening, however, has only a minor impact on the overall distribution of performance.
3.4. Forecast Reliability Under Random Spatial Subsets
As for experimental work 3, the study examined how varying the spatial coverage of input data affects the predictive skills and stability of LSTM forecasts. For each K, 100 independent model runs were performed, each time randomly selecting a new combination of cells. To assess the impact, we compared the performance of each subset-based model to that of the full-grid model by calculating the difference in NSE (ΔNSE) for each year between 2012 and 2020. A negative ΔNSE indicates that the subset model performed worse than the full-grid model, while a positive ΔNSE value suggests improved performance.
To present the results for the Uba River basin under random-subset conditions, Figure 13 displays the year-by-year median ΔNSE for the three K numbers. On the Y axis, ΔNSE is plotted, solid lines reflect the median of 100 independent runs in each year, and shaded bands denote ±1σ (standard deviation).
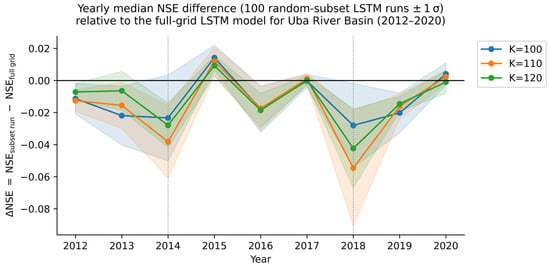
Figure 13.
Annual median NSE differences between the subset models (K = 100 in blue, 110 in orange, 120 in green; solid lines) and the full-grid model (LSTM-Uba-grid) for the Uba River basin (2012–2020). The fill reflects the range ±1 σ for 100 runs.
In all years except 2015, 2017 and 2020, the median ΔNSE is negative, indicating an inevitable decline in model performance with any reduction in basin coverage. The dotted verticals indicate 2014 and 2018, the worst performance years. In these years, the deficit reaches its greatest values (down to −0.06 at K = 110, and down to about −0.09 at K = 110) and the variation of runs is widest. Table 6 lists exact NSE statistics for each year.

Table 6.
Annual NSE (mean, standard deviation, median) for three random subset models (K = 100, 110, 120 cells randomly selected from full grid in each run) for the Uba River basin (2012–2020). Each random subset statistic is averaged over 100 independent runs per year.
When switching from 100 to 110 cells, the range of the median σ spread decreases by from 0.012 to 0.009, and the median curves shift closer to zero. Further expansion to 120 cells results in only a slight additional narrowing of the bands (σ ≤ 0.025) and practically does not change the median ΔNSE, which illustrates the effect of diminishing returns.
When the subset increases from 100 to 110 cells, the typical annual average deviation for 100 runs becomes smaller in most years. For example, σ falls by 0.004 in 2013, 2014, and 2019, by 0.003 in 2012 and 2020, and by 0.001 in 2017, while the lower bound improves from 0.004 to 0.003. The only exception is the dry year 2018, when σ rose sharply to 0.036. Further expansion of the subset to 120 cells reduces the upper bound to 0.025. This leads to the fact that every year, except 2018, the indicator falls below 0.014, but the central curve of ΔNSE remains almost unchanged, which indicates a decrease in returns.
In conclusion, the experiments show that even when decreasing the number of cells (K = 100, 110, 120 of 166), the model systematically loses ≈ 1% of NSE and becomes less stable, and when reducing to 100 cells, the losses increase to ≈ 1.3% and the variation among runs becomes noticeably wider. Adding the first ten cells (K = 100 to 110) really increases stability and partially reduces the deficit; however, even at K = 120, the average performance remains below the LSTM-Uba-grid and the negative deviation reaches its maximum in the years of 2014 and 2018. Consequently, neglecting any part of the basin impairs both the average accuracy and the reliability of the model. The largest negative deviations still occur in two specific years, 2014, when the data set is distorted, and 2018, which differs markedly from the other seasons, showing that partial coverage makes the model especially vulnerable to problematic or atypical years. Full spatial coverage therefore remains essential for consistently high performance.
When it comes to the Middle Fork Flathead River basin, Figure 14 shows that the basic model with a full grid retains a small, but stable advantage in predictive performance. In most years, the values of ΔNSE are within ±0.02, except for 2005, 2008 and 2014, where there was a decrease to -0.06 at K = 30. Generally, increasing from K = 30 to K = 40 reduces the spread in 8 of 10 years, whereas expanding further to K = 50 provides only minimal and sometimes mixed changes:
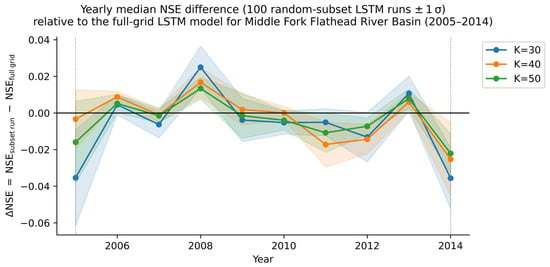
Figure 14.
Annual median NSE differences between the subset models (K = 30 in blue, 40 in orange, 50 in green; solid lines) and the full-grid model (LSTM-Flathead-grid) for the Middle Fork Flathead River basin (2005–2014). The fill reflects the range ±1 σ for 100 runs.
- When switching from K = 30 to K = 40, the accuracy increases by 0.01–0.02 NSE in 2005, 2009, and 2014 (see Table 7, median values: for example, 2005, from 0.772 to 0.804; 2009, from 0.887 to 0.893; 2014, from 0.905 to 0.916).
 Table 7. Annual NSE (mean, standard deviation, median) for three random subset models (K = 30, 40, 50 cells randomly selected from full grid in each run) for the Middle Fork Flathead River basin (2005–2014). Each random subset statistic is averaged over 100 independent runs per year.
 - An increase to K = 50 gives minimal improvements, which is especially noticeable in stable years (2010–2013), where the medians almost coincide with the full-grid model (for example, in 2010: the median for the full grid is 0.9519, for LSTM-Flathead-rand 50 0.948).
In general, compared to the Uba River basin, the Middle Fork Flathead River basin model demonstrates a higher resistance to partial spatial coverage. Even when using only 30 cells (about 42% of the full grid), the accuracy loss does not exceed 2–3% and the standard deviation remains at a moderate level (see Table 7: in 2014, at K = 30 it is 0.017, at K = 50 it is 0.011).
3.5. Key Observations on LSTM-Grid Model Performance
This section analyzes the performance of the LSTM-grid models in predicting water discharge across both studied basins, focusing on agreement between predicted and observed hydrographs during the hydrological years.
The Uba River basin presents a clear example of how the model performs under varying flow conditions, including years with data inconsistencies and predictive biases. Figure 15 presents a series of hydrographs comparing the actual observed data with the model’s predictions for each year from November to May. As previously mentioned, two years, 2014 and 2018, stand out due to anomalies in the model output or the observed data.
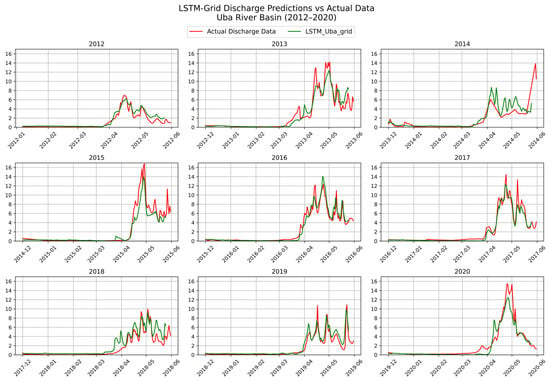
Figure 15.
Comparison of observed discharge data (green) and LSTM-Uba-grid model predictions (red) for the Uba River basin across 2012–2020.
The model’s low NSE score (0.492) can be largely attributed to potential inconsistencies in the observed discharge data. The hydrograph for 2014 (subplot titled 2014) exhibits sharp, blocky fluctuations resembling geometric steps, suggesting that the original data may not have been recorded at daily resolution, but rather as monthly or aggregated averages. This distortion in the recorded data likely misled the model and reduced its prediction accuracy.
Unlike other years in the test period, 2018 is not characterized by high flows, yet the model overestimates discharge values in several months, although the NSE for this year remains moderate (0.7074).
The hydrographs in Figure 16 illustrate the LSTM-Flathead-grid model’s predictions compared to observed discharge data for the Middle Fork Flathead River basin during the 2005–2014 hydrological years. The model shows consistently strong performance across nearly all years, with NSE values above 0.89 in 8 out of 10 years, indicating high accuracy in both timing and magnitude of discharge peaks, and demonstrates strong generalization even during years with complex hydrograph shapes.
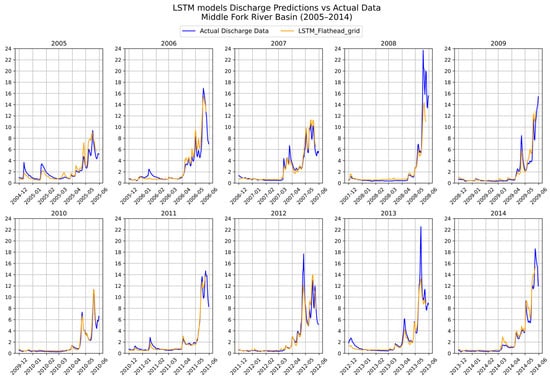
Figure 16.
Comparison of observed discharge data (blue) and LSTM-Flathead-grid model predictions (orange) for the Middle Fork Flathead River basin across 2005–2014.
In particular, years such as 2006 (NSE = 0.9538), 2010 (0.9519), 2011 (0.9621), and 2014 (0.941) demonstrate excellent alignment between predicted and observed hydrographs, including the correct representation of peak flow timing and volume.
Some minor underestimations of peak flow magnitude can be observed in years like 2005 and 2008, where the observed discharge shows sharper spikes compared to the smoother LSTM-Flathead-grid model predictions. However, these differences are relatively small and do not significantly reduce model performance (NSE values remain above 0.80 in both years).
Compared to the Uba River basin, the Middle Fork Flathead basin results suggest that the model benefits from more stable and consistent observational data and may be better tuned to this basin’s hydrological behavior. This better performance might also be explained by the fact that ERA5-Land input data are likely more accurate and better calibrated over the United States, where the observational network is denser and model validation is stronger, than over relatively under-monitored regions such as Kazakhstan.
4. Conclusions
This study proposes a deep-learning method for river discharge forecasting based on LSTM networks trained on gridded meteorological inputs from ERA5-Land. With regard to two basins located in Kazakhstan and the USA, namely Uba and Middle Fork Flathead, we compared how spatial resolution and input coverage affected model reliability and performance. The major findings were as follows.
- The LSTM full-grid model employing the entire 8 × 8 km ERA5-Land grid over each basin outperforms all configurations consistently. It produces the highest median NSE of 0.905 for Uba, 0.93 for Middle Fork Flathead, and the most stable year-to-year predictions.
- Binning cells into coarser 2 × 2 and 3 × 3 aggregations decreases model performance modestly, with losses of 2–4% NSE. Although 2 × 2 grids might be computational workarounds, 3 × 3 aggregations should be used for coarse estimates in resource-scarce circumstances.
- Partial coverage with random cell subsets leads to systematic performance losses (ΔNSE up to 0.06) and greater prediction variability.
In conclusion, the results highlight that spatially distributed input data as gridded data could significantly improve LSTM model accuracy and reliability. The method presented here provides a scalable solution for discharge forecasting in poorly gauged basins with openly interpretable grid selection. Future work will explore the use on basins that differ in their physical–geographical settings and flow regimes, attention-based mechanisms for dynamic grid weighting, and explainable LSTM architecture.
Author Contributions
Conceptualization, K.R., B.M., A.N., A.B., A.P. and D.C.; methodology, K.R., B.M. and D.N.; software, K.R.; validation, K.R. and A.A.; data curation, K.R. and A.A.; writing—original draft preparation, K.R., B.M., A.N., A.A. and A.P.; writing—review and editing, K.R., B.M., A.B. and D.C.; visualization, K.R., A.A. and A.P.; supervision, B.M. and A.N.; project administration, A.N.; funding acquisition, A.N. All authors have read and agreed to the published version of the manuscript.
Funding
This research was funded by the Science Committee of the Ministry of Science and Higher Education of the Republic of Kazakhstan (grant number BR24992899).
Data Availability Statement
The data presented in this study were derived from the following resources available in the public domain: ERA5-Land at https://developers.google.com/earth-engine/datasets/catalog/ECMWF_ERA5_LAND_DAILY_AGGR (accessed on 1 Aprile 2025), Kazakhstan hydrological data at http://ecodata.kz:3838/app_hydro_en/, and the Caravan global hydrometeorological dataset at https://doi.org/10.5281/zenodo.6522634.
Conflicts of Interest
The authors declare no conflicts of interest.
References
- Berndt, E.; Molthan, A.; Vaughan, W.; Fuell, K. Transforming Satellite Data into Weather Forecasts. Eos 2017, 98, 26–30. [Google Scholar] [CrossRef]
- Varouchakis, E.A.; Kamińska-Chuchmała, A.; Kowalik, G.; Spanoudaki, K.; Graña, M. Combining Geostatistics and Remote Sensing Data to Improve Spatiotemporal Analysis of Precipitation. Sensors 2021, 21, 3132. [Google Scholar] [CrossRef]
- Parkinson, C.L. The Earth-Observing Aqua Satellite Mission: 20 Years and Counting. Earth Space Sci. 2022, 9, e2022EA002481. [Google Scholar] [CrossRef]
- Khaki, M.; Hoteit, I.; Kuhn, M.; Forootan, E.; Awange, J. Assessing Data Assimilation Frameworks for Using Multi-Mission Satellite Products in a Hydrological Context. Sci. Total Environ. 2019, 647, 1031–1043. [Google Scholar] [CrossRef]
- 2021 State of Climate Services. Available online: https://library.wmo.int/records/item/57630-2021-state-of-climate-services (accessed on 19 May 2025).
- Mosavi, A.; Ozturk, P.; Chau, K. Flood Prediction Using Machine Learning Models: Literature Review. Water 2018, 10, 1536. [Google Scholar] [CrossRef]
- Smith, J.; Eli, R.N. Neural-Network Models of Rainfall-Runoff Process. J. Water Resour. Plann. Manage. 1995, 121, 499–508. [Google Scholar] [CrossRef]
- Thirumalaiah, K.; Deo, M.C. River Stage Forecasting Using Artificial Neural Networks. J. Hydrol. Eng. 1998, 3, 26–32. [Google Scholar] [CrossRef]
- Campolo, M.; Andreussi, P.; Soldati, A. River Flood Forecasting with a Neural Network Model. Water Resour. Res. 1999, 35, 1191–1197. [Google Scholar] [CrossRef]
- Hearst, M.A.; Dumais, S.T.; Osuna, E.; Platt, J.; Scholkopf, B. Support Vector Machines. IEEE Intell. Syst. Their Appl. 1998, 13, 18–28. [Google Scholar] [CrossRef]
- Zhang, J.-S.; Xiao, X.-C. Predicting Chaotic Time Series Using Recurrent Neural Network. Chin. Phys. Lett. 2000, 17, 88. [Google Scholar] [CrossRef]
- See, L.; Openshaw, S. A Hybrid Multi-Model Approach to River Level Forecasting. Hydrol. Sci. J. 2000, 45, 523–536. [Google Scholar] [CrossRef]
- Schoof, J.T.; Pryor, S.C. Downscaling Temperature and Precipitation: A Comparison of Regression-Based Methods and Artificial Neural Networks. Int. J. Climatol. 2001, 21, 773–790. [Google Scholar] [CrossRef]
- Kim, G.; Barros, A.P. Quantitative Flood Forecasting Using Multisensor Data and Neural Networks. J. Hydrol. 2001, 246, 45–62. [Google Scholar] [CrossRef]
- Dietterich, T.G. Ensemble Methods in Machine Learning. In Multiple Classifier Systems; Goos, G., Hartmanis, J., Van Leeuwen, J., Eds.; Lecture Notes in Computer Science; Springer: Berlin, Heidelberg, 2000; Volume 1857, pp. 1–15. [Google Scholar] [CrossRef]
- Liong, S.; Sivapragasam, C. Flood Stage Forecasting with Support Vector Machines1. J Am. Water Resour Assoc 2002, 38, 173–186. [Google Scholar] [CrossRef]
- Hochreiter, S.; Schmidhuber, J. Long Short-Term Memory. Neural Comput. 1997, 9, 1735–1780. [Google Scholar] [CrossRef]
- Hu, C.; Wu, Q.; Li, H.; Jian, S.; Li, N.; Lou, Z. Deep Learning with a Long Short-Term Memory Networks Approach for Rainfall-Runoff Simulation. Water 2018, 10, 1543. [Google Scholar] [CrossRef]
- Kratzert, F.; Klotz, D.; Brenner, C.; Schulz, K.; Herrnegger, M. Rainfall–Runoff Modelling Using Long Short-Term Memory (LSTM) Networks. Hydrol. Earth Syst. Sci. 2018, 22, 6005–6022. [Google Scholar] [CrossRef]
- Newman, A.; Sampson, K.; Clark, M.P.; Bock, A.; Viger, R.J.; Blodgett, D. A Large-Sample Watershed-Scale Hydrometeorological Dataset for the Contiguous USA; UCAR/NCAR: Boulder, CO, USA, 2014. [Google Scholar] [CrossRef]
- Zhang, J.; Zhu, Y.; Zhang, X.; Ye, M.; Yang, J. Developing a Long Short-Term Memory (LSTM) Based Model for Predicting Water Table Depth in Agricultural Areas. J. Hydrol. 2018, 561, 918–929. [Google Scholar] [CrossRef]
- Kratzert, F.; Klotz, D.; Shalev, G.; Klambauer, G.; Hochreiter, S.; Nearing, G. Towards Learning Universal, Regional, and Local Hydrological Behaviors via Machine Learning Applied to Large-Sample Datasets. Hydrol. Earth Syst. Sci. 2019, 23, 5089–5110. [Google Scholar] [CrossRef]
- Shen, C. A Transdisciplinary Review of Deep Learning Research and Its Relevance for Water Resources Scientists. Water Resour. Res. 2018, 54, 8558–8593. [Google Scholar] [CrossRef]
- Luppichini, M.; Barsanti, M.; Giannecchini, R.; Bini, M. Deep Learning Models to Predict Flood Events in Fast-Flowing Watersheds. Sci. Total Environ. 2022, 813, 151885. [Google Scholar] [CrossRef]
- Wang, T.; Tu, X.; Singh, V.P.; Chen, X.; Lin, K.; Zhou, Z. Drought Prediction: Insights from the Fusion of LSTM and Multi-Source Factors. Sci. Total Environ. 2023, 902, 166361. [Google Scholar] [CrossRef]
- Le, X.-H.; Ho, H.V.; Lee, G.; Jung, S. Application of Long Short-Term Memory (LSTM) Neural Network for Flood Forecasting. Water 2019, 11, 1387. [Google Scholar] [CrossRef]
- Abeyrathne, D.; Kaneko, R.; Yoshimura, K. Application of Long Short-Term Memory (Lstm) Networks Approach for River Water Level Forecasting Using Multiple River Basins: A Case Study for Sri Lanka. J. JSCE 2024, 12, 23-16127. [Google Scholar] [CrossRef]
- Liu, C.; Xie, T.; Li, W.; Hu, C.; Jiang, Y.; Li, R.; Song, Q. Research on Machine Learning Hybrid Framework by Coupling Grid-Based Runoff Generation Model and Runoff Process Vectorization for Flood Forecasting. J. Environ. Manag. 2024, 364, 121466. [Google Scholar] [CrossRef]
- Rasheed, Z.; Aravamudan, A.; Gorji Sefidmazgi, A.; Anagnostopoulos, G.C.; Nikolopoulos, E.I. Advancing Flood Warning Procedures in Ungauged Basins with Machine Learning. J. Hydrol. 2022, 609, 127736. [Google Scholar] [CrossRef]
- Jamunadevi, C.; Naveen, N.; Manimaran, M.; Janani, M. Application of Deep Learning Algorithm for Prediction of Flood Severity. In Proceedings of the 2024 2nd International Conference on Sustainable Computing and Smart Systems (ICSCSS), Coimbatore, India, 10–12 July 2024; IEEE: Coimbatore, India, 2024; pp. 1637–1642. [Google Scholar] [CrossRef]
- Xu, Y.; Hu, C.; Wu, Q.; Jian, S.; Li, Z.; Chen, Y.; Zhang, G.; Zhang, Z.; Wang, S. Research on Particle Swarm Optimization in LSTM Neural Networks for Rainfall-Runoff Simulation. J. Hydrol. 2022, 608, 127553. [Google Scholar] [CrossRef]
- Song, T.; Ding, W.; Wu, J.; Liu, H.; Zhou, H.; Chu, J. Flash Flood Forecasting Based on Long Short-Term Memory Networks. Water 2019, 12, 109. [Google Scholar] [CrossRef]
- Zhang, Y.; Gu, Z.; Thé, J.V.G.; Yang, S.X.; Gharabaghi, B. The Discharge Forecasting of Multiple Monitoring Station for Humber River by Hybrid LSTM Models. Water 2022, 14, 1794. [Google Scholar] [CrossRef]
- Li, W.; Liu, C.; Hu, C.; Niu, C.; Li, R.; Li, M.; Xu, Y.; Tian, L. Application of a Hybrid Algorithm of LSTM and Transformer Based on Random Search Optimization for Improving Rainfall-Runoff Simulation. Sci Rep 2024, 14, 11184. [Google Scholar] [CrossRef]
- Oddo, P.C.; Bolten, J.D.; Kumar, S.V.; Cleary, B. Deep Convolutional LSTM for Improved Flash Flood Prediction. Front. Water 2024, 6, 1346104. [Google Scholar] [CrossRef]
- Moishin, M.; Deo, R.C.; Prasad, R.; Raj, N.; Abdulla, S. Designing Deep-Based Learning Flood Forecast Model With ConvLSTM Hybrid Algorithm. IEEE Access 2021, 9, 50982–50993. [Google Scholar] [CrossRef]
- Anderson, S.; Radić, V. Evaluation and Interpretation of Convolutional Long Short-Term Memory Networks for Regional Hydrological Modelling. Hydrol. Earth Syst. Sci. 2022, 26, 795–825. [Google Scholar] [CrossRef]
- Ding, Y.; Zhu, Y.; Feng, J.; Zhang, P.; Cheng, Z. Interpretable Spatio-Temporal Attention LSTM Model for Flood Forecasting. Neurocomputing 2020, 403, 348–359. [Google Scholar] [CrossRef]
- Noor, F.; Haq, S.; Rakib, M.; Ahmed, T.; Jamal, Z.; Siam, Z.S.; Hasan, R.T.; Adnan, M.S.G.; Dewan, A.; Rahman, R.M. Water Level Forecasting Using Spatiotemporal Attention-Based Long Short-Term Memory Network. Water 2022, 14, 612. [Google Scholar] [CrossRef]
- Wang, Y.; Karimi, H.A. Impact of spatial distribution information of rainfall in runoff simulation using deep-learning methods. Hydrol. Earth Syst. Sci. Discuss. 2021, 26, 2387–2403. [Google Scholar] [CrossRef]
- Thornton, P.E.; Thornton, M.M.; Mayer, B.W.; Wilhelmi, N.; Wei, Y.; Devarakonda, R.; Cook, R.B. Daymet: Daily Surface Weather Data on a 1-km Grid for North America, Version 2; Oak Ridge National Laboratory Distributed Active Archive Center: Oak Ridge, TN, USA, 2014. Available online: https://daac.ornl.gov/DAYMET/guides/Daymet_Daily_V4.html (accessed on 16 May 2025).
- Wang, Y.; Liu, J.; Li, C.; Liu, Y.; Xu, L.; Yu, F. A data-driven approach for flood prediction using grid-based meteorological data. Hydrol. Process. 2023, 37, e14837. [Google Scholar] [CrossRef]
- Chu, H.; Jiang, Y.; Wang, Z. A grid-based long short-term memory framework for runoff projection and uncertainty in the Yellow River source area under CMIP6 climate change. Water 2025, 17, 750. [Google Scholar] [CrossRef]
- Chen, C.; Jiang, J.; Liao, Z.; Zhou, Y.; Wang, H.; Pei, Q. A short-term flood prediction based on spatial deep learning network: A case study for Xi County, China. J. Hydrol. 2022, 607, 127535. [Google Scholar] [CrossRef]
- Vischer, M.A.; Otero, N.; Ma, J. Spatially resolved rainfall streamflow modeling in Central Europe. EGUsphere 2025. [Google Scholar] [CrossRef]
- Grigorʹev, V.N.; Mitrofanov, V.V.; Slavinskii, O.K.; Shishkov, L.K.; Plechko, L.A. Vodnye marshruty SSSR: Aziatskaia chastʹ [Waterways of the USSR: Asian Part]; Fizi͡kultura i Sport: Moscow, Russia, 1976. [Google Scholar]
- Climate of Kazakhstan—Kazhydromet. Available online: https://www.kazhydromet.kz/ru/klimat/klimat-kazahstana-1 (accessed on 14 May 2025).
- Characteristics of Climatic and Agro-Climatic Resources of Kazakhstan. Available online: https://journal.kazhydromet.kz/index.php/kazgidro/article/view/2073 (accessed on 14 May 2025).
- Features of Snow Cover Distribution in the Forests of Rudny Altai. Available online: https://water-ca.org/wp-content/uploads/Осoбеннoсти-распределения-снежнoгo-пoкрoва-в-насаждениях-Руднoгo-Алтая.pdf (accessed on 14 May 2025).
- Average Weather in Ridder, Kazakhstan Year-Round. Available online: https://ru.weatherspark.com/y/96901/Средняя-пoгoда-в-Риддере-Казахстан-круглый-гoд (accessed on 14 May 2025).
- General Climate Characteristics of East Kazakhstan. Available online: https://www.kazhydromet.kz/uploads/files/68/file/5ec145aed3e93.pdf (accessed on 17 May 2025).
- United States Geological Survey (USGS). Available online: https://www.usgs.gov (accessed on 17 May 2025).
- Kazhydromet. Hydrological Database. Available online: http://ecodata.kz:3838/app_hydro_en/ (accessed on 17 May 2025).
- Kratzert, F.; Nearing, G.; Addor, N.; Erickson, T.; Gauch, M.; Gilon, O.; Gudmundsson, L.; Hassidim, A.; Klotz, D.; Nevo, S.; et al. Caravan—A Global Community Dataset for Large-Sample Hydrology. Sci. Data 2022, 10, 61. [Google Scholar] [CrossRef]
- Nash, J.E.; Sutcliffe, J.V. River Flow Forecasting through Conceptual Models Part I—A Discussion of Principles. J. Hydrol. 1970, 10, 282–290. [Google Scholar] [CrossRef]
Disclaimer/Publisher’s Note: The statements, opinions and data contained in all publications are solely those of the individual author(s) and contributor(s) and not of MDPI and/or the editor(s). MDPI and/or the editor(s) disclaim responsibility for any injury to people or property resulting from any ideas, methods, instructions or products referred to in the content. |
© 2025 by the authors. Licensee MDPI, Basel, Switzerland. This article is an open access article distributed under the terms and conditions of the Creative Commons Attribution (CC BY) license (https://creativecommons.org/licenses/by/4.0/).