Abstract
The data descriptor introduces an open, high-resolution dataset of real-world bus operations in Astana, Kazakhstan, captured from GPS trajectories between July and September 2024. The data covers three high-frequency routes and have been processed into a GTFS format, enabling direct use with existing transit modeling tools. Unlike typical static GTFS feeds, this dataset provides empirically observed dwell times, run times, and travel times, offering a detailed snapshot of operational variability in urban bus systems. The dataset supports applications in machine learning–based travel time prediction, timetable optimization, and transit reliability analysis, especially in settings where live feeds are unavailable. By releasing this dataset publicly, we aim to promote transparent, data-driven transport research in emerging urban contexts.
Dataset: https://doi.org/10.5281/zenodo.15769359.
Dataset License: Creative Commons Attribution 4.0 International
1. Summary
Urbanization continues to grow at a historic pace—from 55% of the world’s population living in cities in 2018 [1] to approximately 57.5% (around 4.6 billion people) in 2023, with the urban population increasing at an average annual rate of about 1.7% during 2020–2025 [2]. This trend is expected to continue, with the urban population projected to reach 68% by 2050, adding around 2.5 billion people to cities worldwide [1,2]. Nearly 90% of this growth is anticipated to occur in Asia and Africa, underscoring the need for strategic urban planning in rapidly developing regions [2].
As cities grow and the number of commuters increases, urban mobility challenges intensify, resulting in widespread issues such as traffic congestion, environmental degradation, and the growing risk of road accidents [3]. In response to these growing mobility demands, many cities are investing in Intelligent Transportation Systems (ITS) to modernize their public transport infrastructure. In developing countries, where buses remain the dominant mode of public transportation, these investments are crucial to maintaining service reliability and attractiveness.
Public buses play a pivotal role in alleviating congestion, reducing emissions, and ensuring transport equity by decreasing dependency on private vehicles. However, the effectiveness of bus systems depends heavily on their ability to provide timely and well-organized services [4]. One of the core components of ITS in this context is accurate bus arrival time prediction. Reliable predictions support the development of efficient timetables, improve fleet management, and enhance passenger satisfaction by minimizing uncertainty and wait times [5]. Travel time prediction is therefore central to informed decisions about route planning, vehicle deployment, and service frequency. Moreover, to ensure these predictions translate into meaningful service improvements, performance evaluation serves a key complementary process.
Despite its importance, accurately predicting bus travel times remains a significant challenge. Commuters tend to place greater trust and use public transportation when prediction models effectively capture the variability inherent in everyday transit operations [6,7]. To achieve this, recent research has focused on incorporating more detailed and dynamic data inputs. One key strategy involves route segmentation, which enables the model to account for micro-level variations across different segments of a bus journey. Unlike path-based methods, which predict travel time between origin and destination as a continuous entity, segment-based approaches divide the route into smaller, analyzable units.
Among these efforts, GPS-based segmentation has emerged as a widely used approach for implementing machine learning models, offering spatial granularity. These approaches often involve splitting the bus route into uniform segments, such as fixed-length intervals to enhance spatial granularity [8,9]. For instance, some models apply linear interpolation across 100-m segments to estimate segment-level travel times, though they treat the entire trip as a continuous flow without isolating dwell time at stops [8]. Whereas [9] uses 20-m segments, emphasizing that shorter links yield higher prediction accuracy compared to longer ones. Other researchers segment routes based on structural features like intersections [10,11] estimating vehicle speeds between each pair of intersections to model travel dynamics. A widely adopted technique segments routes using stop-to-stop intervals [12] leveraging the natural structure of bus lines to estimate segment-level travel times from historical GPS traces. While such methods introduce localized prediction, they have traditionally modeled travel time primarily in terms of running time, often neglecting or aggregating dwell times. This omission limits their applicability for scenarios requiring accurate total travel time predictions, particularly when passenger boarding, alighting behavior, or congestion-induced delays introduce significant variability.
Recent studies have highlighted the growing necessity to include dwell time variability in travel time models [13,14,15,16,17,18,19,20,21,22], noting that dwell time is not a static or negligible factor but a dynamic component influenced by multiple contextual variables, such as time of day, passenger load, and stop characteristics. As a result, when dwell time is excluded or treated as constant, “travel time” approximates only the vehicle’s running time. In contrast, comprehensive modeling approaches now recognize that total travel time must be represented as the sum of running time and dwell time. This distinction is particularly important for offline modeling, high-resolution prediction tasks, and applications in congested urban environments.
To capture such variability, some researchers [13,14,15,16,17,18] indirectly account for dwell times using passenger-demand data sourced from automatic passenger counters (APCs), smart ticketing systems, or mobile tracking technologies. Others [19,20,21,22], however, rely on the General Transit Feed Specification Real Time (GTFS-RT), an extension of the widely adopted GTFS standard. Originally developed through a collaboration between Google and Portland’s TriMet agency, GTFS has become the global framework for structuring and sharing public transit schedules [23]. Unlike passenger-demand data, which may be unavailable or unreliable due to technological or operational limitations, GTFS offers a standardized, broadly available, and infrastructure-independent basis for analyzing transit operations. However, GTFS is inherently static, providing only scheduled stop times and uniform dwell times, typically 0 s or 1 min, without reflecting real-time fluctuations in service [19,24,25]. GTFS-RT was introduced to address this limitation by offering live streams of operational data including trip updates, vehicle positions, and service alerts using efficient protocol buffer formats.
However, the potential of GTFS-RT remains underutilized due to several practical and systemic constraints. Firstly, GTFS-RT data is transient in nature: once a vehicle has passed a stop, its real-time update disappears from the feed [26]. These updates are retrieved through periodic API queries, typically at one-minute intervals, and each new query overwrites previous data. Consequently, there is no persistent source of truth, making it impossible to retrospectively reconstruct full service operations unless the data are continuously captured and stored. Secondly, GTFS-RT feeds are rarely made publicly available. While some transit agencies do provide access, it is often through restricted APIs governed by licensing or confidentiality agreements that prohibit data sharing or long-term archiving [26,27]. Moreover, this kind of research infrastructure is largely absent in developing contexts, where open data initiatives are limited and system variability is often higher. In particular, Central Asia remains virtually unrepresented in publicly available transit datasets, constraining opportunities for region-specific innovation in public transport systems.
Motivated by the need to evaluate service reliability and delay in data-scarce environments, we archived high-resolution GPS traces of real-world bus activity over a three-month period across three high-frequency routes (10, 12, and 46) in Astana, Kazakhstan. These traces were transformed into a GTFS structure with empirically observed stop- and trip-level timestamps.
This paper contributes to the literature in several important ways:
- The study presents a replicable and scalable framework for converting raw GPS traces into a GTFS format, enabling adoption in data-scarce environments.
- It introduces the first GTFS-compatible, GPS-derived public bus dataset from Astana, Kazakhstan, addressing a major geographic gap in open transit data.
- The dataset supports segment-level modeling and analysis in the absence of GTFS-RT feeds, automatic passenger counters, or other advanced infrastructure.
- It provides a benchmark resource for developing offline prediction models and assessing public transit reliability in rapidly urbanizing cities.
The dataset was curated as part of a research project conducted at Astana IT University, within the broader initiative aimed at supporting open transport data infrastructure and enabling smart city applications in Kazakhstan. No prior publications have been made using this exact version of the dataset, though a preprint evaluating segment-level deep learning models on an earlier variant is under preparation. The current version will serve as a stable benchmark for future comparative studies and applications.
2. Data Description
This data descriptor presents a dataset comprising three ZIP archives that support transit analysis in Astana, Kazakhstan: (1) gtfs_data.zip, which contains a General Transit Feed Specification (GTFS) feed; (2) segment_level_data.csv.zip, a flat file version of the GTFS data for easy analysis; and (3) gps_data.csv.zip, which includes the raw GPS traces collected from public buses. The GTFS feed in gtfs_data.zip is constructed from continuous GPS traces covering three bus routes and follows the standard GTFS relational structure, with required files such as agency.txt, stops.txt, routes.txt, trips.txt, stop_times.txt, and calendar_dates.txt. To broaden accessibility, the same GTFS data are also released as a single comma-separated file (segment_level_data.csv) for use in spreadsheet applications. The original GPS traces used for GTFS construction are provided separately as gps_data.csv.
The system logged a total of 19,769 valid trips across all the routes. Each trip was matched to its corresponding stop sequence, resulting in 785,976 records in stop_times.txt. These stop-level events are proportionally distributed across the routes, reflecting the number of stops and frequency of operation for each line. Table 1 provides a summary of the number of rows in each GTFS file and their distribution by route.

Table 1.
Summary of the compressed files in the dataset.
2.1. Raw GPS Data
Astana city has no metro or light-rail network, thus public transport relies completely on surface buses. The present study analyses three bus routes that together serve two hundred stops and link, among other destinations, the international airport with the main railway station. The original data were provided by LLP “INNOFORCE SOLUTIONS”, which recorded real-time vehicle locations using on-board GPS loggers. The sampling interval ranged from one to five seconds, and the resulting transit trajectories appear in Figure 1. The unfiltered stream contains more than 61 million position fixes, which are stored in a PostgreSQL database and visualized in Figure 2.
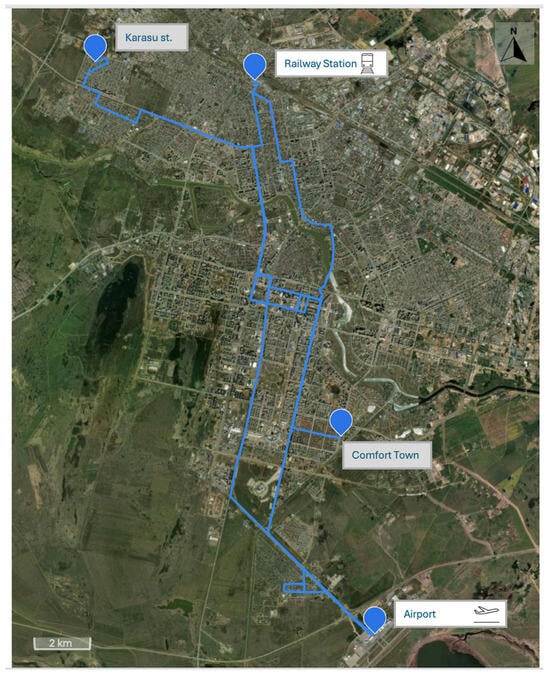
Figure 1.
Service-area coverage map for bus lines 10, 12 and 46 in Astana.

Figure 2.
Sample of raw GPS position fixes stored in database.
2.2. The Processed Dataset
The processed dataset captures the full structure and operations of the three selected bus routes in Astana over the 55-day observation period from 29 July to 21 September 2024. We generated the six required GTFS text files, each of which plays a specific role in representing the transit system. The contents of these files reflect the real-world configuration of the network. Figure 3 presents an entity–relationship diagram that highlights these core tables and the foreign-key links that bind them.
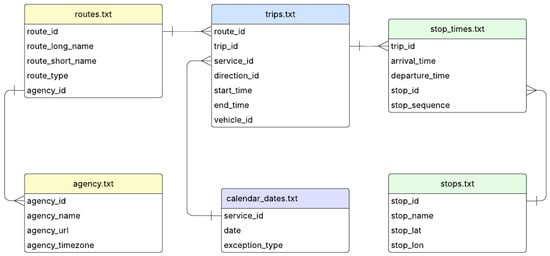
Figure 3.
Entity–relationship diagram of GTFS files.
In addition to the structured GTFS format, we provide a single flattened CSV file segment_level_data.csv that consolidates the entire feed into one table, capturing information about the route, trip, stop location, timing, and service date. The structure of this file enables users to work with the data directly in spreadsheet applications or statistical tools without requiring prior knowledge of the GTFS relational model. Table 2 outlines the column names and provides brief description of content.

Table 2.
The structure of segment_level_data.csv: Attribute descriptions and sample values.
By offering both the structured GTFS feed and a ready-to-use flat CSV version, the dataset accommodates a wide range of analytical needs, from transport modelling and schedule analysis to machine learning and visualization.
3. Methods
Figure 4 provides a high-level flow-chart of the methodology developed in this study. The workflow begins with on-board acquisition of raw GPS probe data, passes through a multi-stage quality-assurance and transmission pipeline, and culminates in the derivation of trip- and stop-level GTFS tables suitable for public release and downstream analytics.

Figure 4.
Overview of the data collection, validation, and information extraction pipeline.
3.1. Obtaining GPS Data
This subsection describes the methodology employed for acquiring and processing GPS coordinates to construct a high-quality location dataset for public transport tracking applications. The coordinate collecting system utilizes Google’s Fused Location Provider API integrated with a multi-stage validation and filtering pipeline to ensure data reliability and accuracy. The methodology is implemented across the buses equipped with Android-based positioning terminals for comprehensive route monitoring and passenger information services.
The overview of the GPS data collection and processing pipeline implemented in this study is shown in Figure 5. The methodology encompasses three main phases: (1) hardware configuration with GPS antennas and Android tablets for high-accuracy positioning, (2) real-time data quality assurance through multiple validation filters, and (3) data transmission and storage using MQTT protocol with PostgreSQL database backend and Grafana monitoring dashboards.
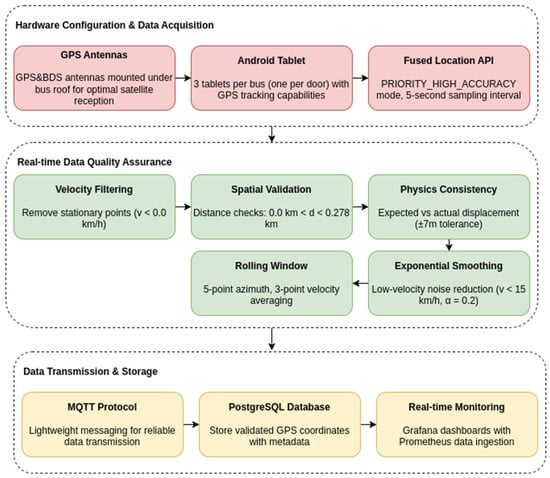
Figure 5.
Data obtaining process flowchart.
3.1.1. Hardware Configuration
The coordinate collecting system is deployed on public transit buses operating within an urban transportation network. Each vehicle is equipped with three multifunctional tablets based on Android OS, one of the functions of which is collecting the coordinates of the bus in real time. There are three tablets because Astana’s buses have three doors, one tablet for each door. The GPS antennas presented in Figure 6, connected to the tablets, are located under the roof of the bus to optimize satellite signal reception and provide protection from environmental influences. This hardware configuration ensures continuous data availability even in cases of individual device failure, while the interior mounting of processing units provides protection from weather conditions and reduces vandalism risk.
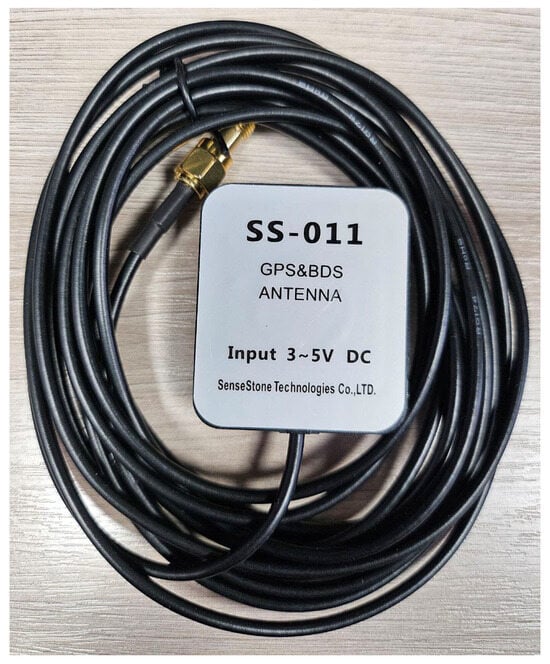
Figure 6.
GPS&BDS Antenna.
During the antenna installation we are checking signals, such that maximum number of satellites detected, via special application AndroiTS GPS Test, see Figure 7. The left panel demonstrates optimal signal acquisition with 27 satellites tracked, showing strong signal-to-noise ratios (yellow and green indicators) and precise coordinate determination (51°11.8295′ N, 071°28.1775′ E). The right panel illustrates degraded signal conditions with no active satellite tracking, resulting in coordinate acquisition failure and system status indicating “WAIT 0/0” with last known position display (51°10.3385′ N, 071°25.5004′ E). This comparison validates the importance of antenna positioning and environmental factors in maintaining reliable coordinate acquisition for the transit tracking system.
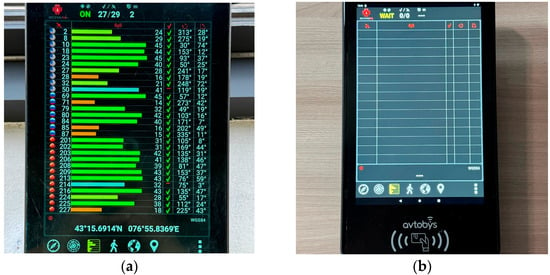
Figure 7.
GPS signal reception quality assessment: (a) Optimal reception—27 satellites tracked; (b) Degraded reception—0 satellites tracked.
3.1.2. Location Service
The coordinate collecting system implements a singleton-pattern LocationController that interfaces with Android’s location services through the FusedLocationProviderClient. This client provides access to fused location data that combines multiple positioning sources including GPS satellites, Wi-Fi access points, cellular towers, and inertial sensors to optimize accuracy and power consumption based on environmental conditions and accuracy requirements.
The Fused Location Provider API offers multiple priority configurations that balance accuracy requirements with power consumption:
- PRIORITY_HIGH_ACCURACY: Utilizes GPS satellites as the primary positioning source, supplemented by network-based positioning when satellite signals are degraded. This mode provides meter-level accuracy suitable for precise vehicle tracking but requires increased battery consumption. Optimal for urban transit applications where route adherence monitoring requires high spatial precision and energy consumption in this case does not affect the efficiency of work, since the tablets are connected to the bus power supply.
- PRIORITY_BALANCED_POWER_ACCURACY: Employs a hybrid approach combining GPS, WiFi, and cellular positioning sources with intelligent switching based on signal availability and power optimization algorithms. Provides accuracy within 100 m while significantly reducing power consumption compared to high-accuracy mode.
- PRIORITY_LOW_POWER: Primarily relies on network-based positioning (WiFi and cellular towers) with minimal GPS utilization. Suitable for applications requiring general location awareness with extended battery life but insufficient for precise vehicle tracking applications.
- PRIORITY_PASSIVE: Utilizes only passively available location data from other applications without actively requesting position updates, resulting in minimal power consumption but unpredictable data availability.
For buses tracking, PRIORITY_HIGH_ACCURACY mode is employed to ensure sufficient spatial resolution for route monitoring and schedule adherence analysis. The system operates with a temporal resolution of 5 s (0.2 Hz sampling frequency) using high-accuracy priority settings to maximize GPS utilization for precise coordinate determination. Location updates are processed asynchronously on dedicated background threads to prevent interference with primary application processes.
Raw coordinate pairs are extracted from LocationResult objects provided by the location service callback mechanism. Each coordinate measurement includes:
- Latitude (φ): Geographic latitude in decimal degrees (−90° to +90°)
- Longitude (λ): Geographic longitude in decimal degrees (−180° to +180°)
- Velocity (v): Instantaneous speed in meters per second
- Temporal stamp (t): Unix timestamp of coordinate acquisition
- Accuracy metrics: Horizontal accuracy estimates provided by the positioning system
3.1.3. Data Quality Assurance
Numerous issues affect the quality of raw GPS traces in urban bus systems, including stationary coordinates due to signal loss, duplicate records, implausible displacements, jitter at low speeds, and directional instability. These limitations have been reported in prior research [8,28,29,30], and our work builds directly on those findings. Accordingly, our data processing pipeline incorporates and adapts established validation techniques to the local context of Astana’s public bus system and the five-second sampling resolution used in this study. The coordinate dataset undergoes a comprehensive multi-stage validation process to ensure data integrity, as described below.
The first validation is Velocity-Based Filtering. Coordinates associated with velocities below a minimum threshold (v_min = 0.0 km/h) are flagged as potentially stationary.
The second is Spatial Consistency Validation. For consecutive coordinate pairs (P_i, P_i+1), the distance d is calculated using the WGS84 ellipsoid. Coordinates are rejected if:
- d < d_min (0.0 km)—indicating duplicate measurements
- d > d_max (0.278 km)—indicating physically impossible displacement given the 5-s sampling interval
The third validation is Physics-Based Consistency Check. Expected displacement is calculated based on reported velocity and temporal interval:
where k represents unit conversion factors and Δt is the sampling interval. Coordinates are validated against expected displacement with a tolerance margin of ±7 m to account for GPS accuracy limitations.
d_expected = v × Δt × k,
The fourth validation is Exponential Smoothing. For low-velocity scenarios (v < 15 km/h), coordinate noise is reduced using exponential smoothing with smoothing parameter α = 0.2:
φ_smoothed = α × φ_current + (1 − α) × φ_previous
λ_smoothed = α × λ_current + (1 − α) × λ_previous
This approach effectively reduces GPS signal fluctuations while maintaining realistic traffic patterns during low-speed driving typical of urban public transport at bus stops and in congested traffic conditions.
The fifth validation is Rolling Window Analysis. The system maintains sliding windows of recent coordinate measurements. Azimuth calculation window: 5 most recent valid coordinates. Velocity averaging window: 3 most recent valid coordinates. Average velocity is computed using:
v_avg = (1/n) × Σ(v_i) for i ∈ [t − n, t]
Bearing/azimuth is calculated between the oldest and newest coordinates in the azimuth window to provide stable directional information for route matching and adherence monitoring.
3.1.4. Data Transmission and Backend Integration
Validated coordinate data are transmitted to backend systems using Message Queuing Telemetry Transport (MQTT) protocol, a lightweight messaging protocol optimized for constrained devices and unreliable networks. This approach ensures reliable data delivery even under variable network conditions common in urban transit operations.
Each coordinate transmission includes comprehensive vehicle state information:
- Spatial coordinates: Validated latitude and longitude with accuracy metrics.
- Temporal information: ISO 8601 formatted timestamps for temporal synchronization.
- Vehicle identification: Unique identifiers linking coordinates to specific transit units.
- Operational metadata: Route assignments, schedule adherence metrics, and vehicle status indicators.
- Kinematic parameters: Velocity, bearing, and distance measurements for trajectory analysis.
Messages are transmitted with normal priority classification to balance delivery reliability with network resource utilization. The system implements automatic retry mechanisms with exponential backoff to handle temporary network disruptions common in mobile environments.
3.1.5. Data Visualization
The coordinates dataset is visualized and monitored through a comprehensive dashboard infrastructure utilizing Grafana and Prometheus for real-time operational intelligence. Prometheus servers subscribe to MQTT message queues to ingest the transmitted coordinate data streams, providing scalable time-series data storage and query capabilities. The collected coordinate data are subsequently visualized through Grafana dashboards that render vehicle positions on maps, enabling real-time monitoring of bus movements and route adherence across the urban transit network. This visualization framework provides operations personnel with immediate situational awareness of system performance, facilitating rapid response to service disruptions and enabling data-driven operational decision-making through intuitive geographic representations of the coordinate dataset.
Real-time coordinate tracking heatmap on Figure 8, displaying the complete operational trajectory of a single transit vehicle on Route 10, captured over a 12-h service period in Astana. It demonstrates the comprehensive spatial coverage and route adherence monitoring capabilities of the coordinate collecting system.
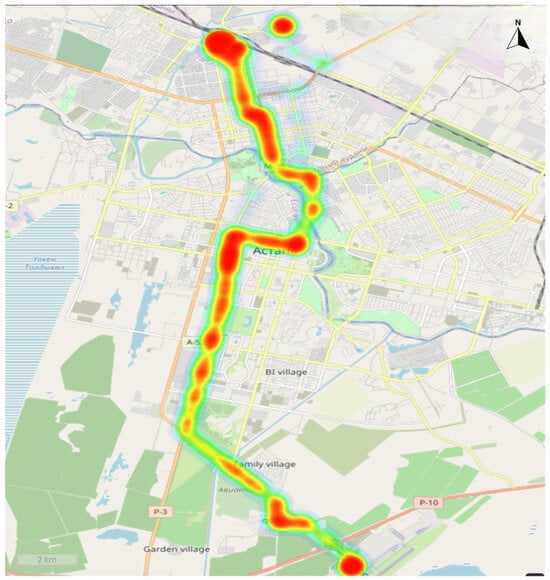
Figure 8.
GPS trajectory visualization of route 10 bus operations over 12-h period. Heatmap: Point density (green–yellow–red = low to high concentration).
Figure 9 shows data collected from three Android tablets over a period of 3 h. The yellow trajectory lines illustrate the challenge of maintaining smooth path representation when sampling coordinates at 5-s intervals on curved road segments. The sparse coordinate density results in angular trajectory segments that deviate from the actual circular road geometry, particularly evident where the vehicle maintains higher speeds through the roundabout without prolonged stops. This visualization highlights the trade-off between sampling frequency, data transmission costs, and trajectory smoothness in urban transit monitoring systems, demonstrating how coordinate interpolation algorithms may be necessary to reconstruct accurate vehicle paths on complex road geometries.
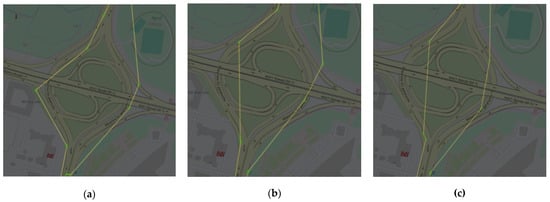
Figure 9.
Multi-device coordinate aggregation visualization: (a) Tablet 1; (b) Tablet 2; (c) Tablet 3.
3.2. The Conversion of GPS Probe Data into GTFS Format
3.2.1. Trip-Level Information Extraction
The raw GPS data were imported into a PostgreSQL database and underwent a series of preprocessing steps to enhance data quality. Records with missing or incorrect GPS coordinates and timestamps outside the expected range were removed, addressing issues potentially caused by device resets. Next, observations with abnormally high speeds values were excluded. After cleaning, GPS records were chronologically sorted to enable accurate trip identification.
Trip extraction was conducted through SQL procedures that matched GPS points to terminal stop areas. Terminal locations were stored as geometry points, and a 50-m buffer () was applied to each terminal to define a matching zone. GPS points were joined with these buffered zones using spatial joins and tagged with the respective terminal IDs.
After matching GPS records to terminal locations, records within terminal buffers were grouped by terminal ID and date. Within each group, the earliest and latest timestamps were identified to mark terminal entry and exit, respectively. These were labeled accordingly to represent the start and end of a potential trip. The resulting entry and exit points were then examined sequentially. When a pair of terminal points with different terminal IDs occurred on the same date, a trip was registered and assigned a unique trip ID.
Finally, only valid trips—those with both start and end terminal records—were retained. Trips without two defined terminal events were considered outliers and excluded. The output is a structured trips table where each trip is defined by its terminal entry and exit, along with a corresponding trip ID.
After identifying valid trips, we extracted additional trip-level features to enrich the dataset. For each trip, we assigned the end time and end terminal by shifting the corresponding start values of the following terminal record. We then determined the trip direction based on the start terminal. A direction value of 1 was assigned to trips originating from the first terminal in the route list, and 2 otherwise. The trip duration was calculated as the difference between the start and end times and was expressed in minutes. The data were added to the structured dataset for further use in downstream processing.
3.2.2. Segment-Level Information Extraction
To extract stop-level segments from the GPS trajectories, we first created spatial buffer around each bus stop, separated by direction. of 25 m was generated to account for potential GPS inaccuracies. The full GPS dataset was then filtered based on spatial proximity to these buffers. The filtered records were split by trip direction and matched against the corresponding directional stop buffer. GPS points falling within the buffer were tagged with the respective stop ID.
Next, GPS trajectories were augmented with trip identifiers by merging processed trip terminal records with the raw GPS data. GPS points not falling between identified terminal pairs were discarded. Directional information was then assigned to each trajectory based on the trip-level metadata.
Once the trajectories were labeled with both trip ID and direction, stop segments were extracted. Points matched to stop buffers were grouped based on temporal and spatial continuity. For each group of stop-tagged points, we computed arrival and departure times. If a zero-speed record was available, the earliest such timestamp was treated as the arrival time, while the departure time was inferred either directly from the latest zero-speed record or adjusted based on the last observed timestamp in the buffer. If no zero-speed point was present, the first timestamp was used for both arrival and latest for departure.
After determining arrival and departure times, the dwell time at each stop was calculated as their difference and expressed in seconds. The resulting dataset contains structured stop-level records, each annotated with trip, temporal, and operational features.
4. User Notes
As the data have been cleaned, validated, and formatted to GTFS format, they can be directly ingested by transit modeling tools or used in custom machine learning pipelines. The dataset adheres to the FAIR principles—Findability, Accessibility, Interoperability, and Reusability [31]:
- Findability: The dataset is assigned a unique and persistent identifier (DOI), ensuring it can be reliably located and cited.
- Accessibility: It is hosted on Zenodo, an open-access platform that provides unrestricted access to download and explore the data.
- Interoperability: The dataset is provided in widely accepted formats (.txt and .csv), facilitating seamless integration with various data analysis tools and programming environments.
- Reusability: Detailed metadata is included, and the dataset is shared under a Creative Commons Attribution 4.0 International (CC BY 4.0) License, permitting broad reuse and redistribution with appropriate credit.
This dataset supports researchers and practitioners working on the evaluation and prediction of public transport operations. It is structured to enable the development of machine learning models for travel time estimation, arrival time prediction, and delay forecasting. The data consist of bus trips segmented at a fine-grained level, capturing both the run time between consecutive stops and the dwell time at each stop. This format is well-suited for sequential modeling approaches, including deep learning architectures such as LSTMs, as well as traditional methods like XGBoost, Random Forest, and Support Vector Machines.
Notably, operational phenomena such as bus overtaking, bunching, and dispatch irregularities are retained in the dataset. While not corrected during preprocessing, these features reflect real-world transit dynamics and enable deeper investigation into service reliability and system performance.
We recommend that users adapting this methodology to other cities carefully consider the characteristics of their GPS data and local transit environment. In particular, if the GPS sampling frequency exceeds 10–15 s, additional preprocessing such as interpolation may be needed to accurately reconstruct trajectories and segment events. Likewise, the buffer radius used to match GPS points to bus stops or terminals should be adjusted based on local conditions such as stop density, road geometry, and signal accuracy.
5. Conclusions and Future Work
This paper presents GTFS-compatible feed derived directly from high-resolution GPS trajectories for bus operations in Astana, Kazakhstan, covering the period from 29 July to 21 September 2024. By providing empirically observed dwell times, run times, and travel times for over 19,000 trips on three high-frequency routes, this work addresses three recurring gaps in transit research: (i) the absence of realistic operational variability in static feeds, (ii) the scarcity of shareable historical archives, and (iii) discontinuous historical coverage. Distributed together with the raw GPS traces (over 61 million fixes) and a flattened CSV view, the release complies with FAIR principles. The structured and standardized nature of the dataset supports a range of downstream applications, including machine learning–based bus arrival time prediction, transit performance evaluation, timetable optimization, and event detection.
A limitation of the current dataset is that observation window captures only fifty-five days at the tail end of the summer timetable, leaving seasonal demand effects such as winter weather and academic-term variation unrepresented. Future versions of the dataset could address this gap through temporal and network expansion, extending data collection across the full annual cycle and incorporating additional routes. In future, data on the forthcoming Astana Light Rail Transit (LRT) system could also be integrated, transforming the current bus-only snapshot into a multimodal representation of the city’s public transport network. Additionally, this dataset could be fused with external variables and socioeconomic indicators (e.g., population density, land use patterns) to enable more comprehensive analyses of transport accessibility, equity, and urban mobility patterns. For instance, the open-access built environment dataset available at https://doskaz.kz/en, accessed on 11 July 2025 offers location-based infrastructure evaluations that could be spatially joined with our data to explore contextual influences on travel time and delays. Moreover, the persistent nature of GPS data quality issues across studies highlights a broader need for more robust GPS and IoT solutions. In the meantime, our work reinforces the typicality of these challenges and demonstrates how they can be effectively mitigated through targeted preprocessing and validation in a real-world pipeline.
Author Contributions
Conceptualization, A.N.; methodology, A.M. (Aigerim Mansurova) and A.N.; software, A.M. (Aigerim Mansurova) and A.M. (Aigerim Mussina); validation, A.M. (Aigerim Mansurova); formal analysis, A.M. (Aigerim Mansurova) and A.M. (Aigerim Mussina); investigation, A.M. (Aigerim Mansurova) and A.M. (Aigerim Mussina); resources, S.A.; data curation, A.M. (Aigerim Mussina) and A.M. (Aigerim Mansurova); writing—original draft preparation, A.M. (Aigerim Mansurova), A.N. and A.M. (Aigerim Mussina); writing—review and editing, D.Y.; visualization, A.M. (Aigerim Mansurova) and A.M. (Aigerim Mussina); supervision, A.N. and S.A.; project administration, D.Y.; funding acquisition, D.Y. All authors have read and agreed to the published version of the manuscript.
Funding
This research has been funded by the Committee of Science of the Ministry of Science and Higher Education of the Republic of Kazakhstan (Grant No. BR24992852 «Intelligent models and methods of Smart City digital ecosystem for sustainable development and the citizens’ quality of life improvement»).
Data Availability Statement
Link to the dataset: https://doi.org/10.5281/zenodo.15769359.
Acknowledgments
The authors would like to thank Innoforce solutions LLP, part of the larger holding company Innoforce Public Limited Company, for providing access to the original GPS-based vehicle location data. The data were published with permission from the rightsholder under a data-sharing agreement.
Conflicts of Interest
The authors declare no conflicts of interest.
Abbreviations
The following abbreviations are used in this manuscript:
| GTFS | General Transit Feed Specification |
| GTFS-RT | GTFS Realtime |
| GPS | Global Positioning System |
| ITS | Intelligent Transportation Systems |
| APCs | Automated Process Control Systems |
| LSTM | Long Short-Term Memory |
References
- United Nations, Department of Economic and Social Affairs. World Urbanisation Prospects: The 2018 Revision (ST/ESA/SER.A/420); United Nations: New York, NY, USA, 2019. [Google Scholar]
- World Population Review. Most Urbanized Countries 2025. 2025. Available online: https://worldpopulationreview.com/country-rankings/most-urbanized-countries (accessed on 15 July 2025).
- Gonçalves, L.A.P.J.; Ribeiro, P.J.G. Resilience of Urban Transportation Systems. Concept, Characteristics, and Methods. J. Transp. Geogr. 2020, 85, 102727. [Google Scholar] [CrossRef]
- Sogbe, E.; Susilawati, S.; Pin, T.C. Scaling up public transport usage: A systematic literature review of service quality, satisfaction and attitude towards bus transport systems in developing countries. Public Transp. 2025, 17, 1–44. [Google Scholar] [CrossRef]
- Singh, N.; Kumar, K. A Review of Bus Arrival Time Prediction Using Artificial Intelligence. WIREs Data Min. Knowl. Discov. 2022, 12, e1457. [Google Scholar] [CrossRef]
- Zhong, G.; Yin, T.; Li, L.; Zhang, J.; Zhang, H.; Ran, B. Bus Travel Time Prediction Based on Ensemble Learning Methods. IEEE Intell. Transp. Syst. Mag. 2022, 14, 174–189. [Google Scholar] [CrossRef]
- Fayyaz, S.; Kiavash, S.; Liu, X.C.; Porter, R.J. A genetic-algorithm and regression-based model for analyzing fare payment structure and transit dwell time. In Transportation Research Board 95th Annual Meeting; Transportation Research Board: Washington, DC, USA, 2016; No. 16-4815. [Google Scholar]
- Kumar, B.A.; Vanajakshi, L.; Subramanian, S.C. Bus travel time prediction using a time-space discretization approach. Transp. Res. Part C Emerg. Technol. 2017, 79, 308–332. [Google Scholar] [CrossRef]
- Han, Q.; Liu, K.; Zeng, L.; He, G.; Ye, L.; Li, F. A Bus Arrival Time Prediction Method Based on Position Calibration and LSTM. IEEE Access 2020, 8, 42372–42383. [Google Scholar] [CrossRef]
- Liu, H.; Xu, H.; Yan, Y.; Cai, Z.; Sun, T.; Li, W. Bus Arrival Time Prediction Based on LSTM and Spatial-Temporal Feature Vector. IEEE Access 2020, 8, 11917–11929. [Google Scholar] [CrossRef]
- Nadeeshan, S.; Perera, A.S. Multi-Step Bidirectional LSTM for Low Frequent Bus Travel Time Prediction. In Proceedings of the 2021 Moratuwa Engineering Research Conference (MERCon), Moratuwa, Sri Lanka, 27–29 July 2021; IEEE: Moratuwa, Sri Lanka, 2021; pp. 462–467. [Google Scholar]
- Pili, F.; Olivo, A.; Barabino, B. Evaluating alternative methods to estimate bus running times by archived automatic vehicle location data. IET Intell. Transp. Syst. 2019, 13, 523–530. [Google Scholar] [CrossRef]
- Osman, O.; Rakha, H.; Mittal, A. Application of Long Short Term Memory Networks for Long- and Short-Term Bus Travel Time Prediction. 2021; preprint. [Google Scholar] [CrossRef]
- Hou, Y.; Edara, P. Network Scale Travel Time Prediction Using Deep Learning. Transp. Res. Rec. J. Transp. Res. Board 2018, 2672, 115–123. [Google Scholar] [CrossRef]
- Yuan, Y.; Shao, C.; Cao, Z.; He, Z.; Zhu, C.; Wang, Y.; Jang, V. Bus Dynamic Travel Time Prediction: Using a Deep Feature Extraction Framework Based on RNN and DNN. Electronics 2020, 9, 1876. [Google Scholar] [CrossRef]
- Yin, Z.; Zhang, B. Bus Travel Time Prediction Based on the Similarity in Drivers’ Driving Styles. Future Internet 2023, 15, 222. [Google Scholar] [CrossRef]
- Kwesiga, D.K.; Guin, A.; Hunter, M. Analysis of bus dwell times from automated passenger count data and the impact of dwell-time variability on the performance of transit signal priority. Public Transp. 2025, 1–23. [Google Scholar] [CrossRef]
- Abdelhalim, A.; Zhao, J. Computer vision for transit travel time prediction: An end-to-end framework using roadside urban imagery. Public Transp. 2024, 17, 1–26. [Google Scholar] [CrossRef]
- Chondrodima, E.; Georgiou, H.; Pelekis, N.; Theodoridis, Y. Public Transport Arrival Time Prediction Based on GTFS Data. In Machine Learning, Optimization, and Data Science; Nicosia, G., Ojha, V., La Malfa, E., La Malfa, G., Jansen, G., Pardalos, P.M., Giuffrida, G., Umeton, R., Eds.; Lecture Notes in Computer Science; Springer International Publishing: Cham, Switzerland, 2022; Volume 13164, pp. 481–495. ISBN 978-3-030-95469-7. [Google Scholar]
- Wu, J.; Wu, Q.; Shen, J.; Cai, C. Towards Attention-Based Convolutional Long Short-Term Memory for Travel Time Prediction of Bus Journeys. Sensors 2020, 20, 3354. [Google Scholar] [CrossRef] [PubMed]
- BV, S.K.; Fedujwar, R.; Agarwal, A. Travel Time Variability of Bus Routes in Delhi Using Real-Time GTFS Data. In Proceedings of the 2024 16th International Conference on COMmunication Systems & NETworkS (COMSNETS), Bengaluru, India, 3–7 January 2024; IEEE: New York, NY, USA, 2024; pp. 210–215. [Google Scholar]
- Ratneswaran, S.; Thayasivam, U. An Improved Bus Travel Time Prediction Using Multi-Model Ensemble Approach for Heterogeneous Traffic Conditions. In Proceedings of the 2023 IEEE 26th International Conference on Intelligent Transportation Systems (ITSC), Bilbao, Spain, 24–28 September 2023; IEEE: Bilbao, Spain, 2023; pp. 2410–2415. [Google Scholar]
- Reference-General Transit Feed Specification. Available online: https://gtfs.org/documentation/schedule/reference/ (accessed on 24 March 2025).
- Liu, D.; Guo, J.; Gu, Y.; King, M.; Han, L.D.; Brakewood, C. Analyzing Transit Systems Using General Transit Feed Specification (GTFS) by Generating Spatiotemporal Transit Networks. Information 2025, 16, 24. [Google Scholar] [CrossRef]
- Goldstein, B.; Dyson, L. (Eds.) Beyond Transparency: Open Data and the Future of Civic Innovation; Code for America Press: San Francisco, CA, USA, 2013; ISBN 978-0-615-88908-5. [Google Scholar]
- Xian, T.; Chin, T.K.; Marks, B.; Nelson, J.D.; Moylan, E. Bus arrival and departure time updates in the Greater Sydney Area. Sci. Data 2024, 11, 1034. [Google Scholar] [CrossRef] [PubMed]
- Prommaharaj, P.; Phithakkitnukoon, S.; Demissie, M.G.; Kattan, L.; Ratti, C. Visualizing public transit system operation with GTFS data: A case study of Calgary, Canada. Heliyon 2020, 6, e03729. [Google Scholar] [CrossRef] [PubMed]
- Trompet, M.; Liu, X.; Graham, D.J. Development of key performance indicator to compare regularity of service between urban bus operators. Transp. Res. Rec. 2011, 2216, 33–41. [Google Scholar] [CrossRef]
- Cortés, C.E.; Gibson, J.; Gschwender, A.; Munizaga, M.; Zúñiga, M. Commercial bus speed diagnosis based on GPS-monitored data. Transp. Res. Part C Emerg. Technol. 2011, 19, 695–707. [Google Scholar] [CrossRef]
- Furth, P.G.; Hemily, B.; Muller, T.H.; Strathman, J.G. Using Archived AVL-APC Data to Improve Transit Performance and Management; Transportation Research Board: Washington, DC, USA, 2006; No. Project H-28. [Google Scholar]
- Wilkinson, M.D.; Dumontier, M.; Aalbersberg, I.J.; Appleton, G.; Axton, M.; Baak, A.; Mons, B. The FAIR Guiding Principles for scientific data management and stewardship. Sci. Data 2016, 3, 1–9. [Google Scholar] [CrossRef] [PubMed]
Disclaimer/Publisher’s Note: The statements, opinions and data contained in all publications are solely those of the individual author(s) and contributor(s) and not of MDPI and/or the editor(s). MDPI and/or the editor(s) disclaim responsibility for any injury to people or property resulting from any ideas, methods, instructions or products referred to in the content. |
© 2025 by the authors. Licensee MDPI, Basel, Switzerland. This article is an open access article distributed under the terms and conditions of the Creative Commons Attribution (CC BY) license (https://creativecommons.org/licenses/by/4.0/).