Article

Sensory Analysis as a Simple and Low-Cost Tool to Evaluate and Valorize a New Product from Local Fruits in Rural Communities: The Case of Highly Aromatic Vinegar from Prickly Pear Fruits

by
Ikram Es-Sbata
1,2,
Remedios Castro-Mejías
1,
Carmen Rodríguez-Dodero
1,*,
Rachid Zouhair
3 and
Enrique Durán-Guerrero
1
1
Analytical Chemistry Department, Faculty of Sciences-IVAGRO, Agrifood Campus of International Excellence (ceiA3), University of Cadiz, University Campus of Puerto Real, 11510 Puerto Real, Cádiz, Spain
2
Polydisciplinary Faculty of Sidi Bennour, Chouaib Doukkali University, El Jadida 24000, Morocco
3
Laboratory of Plant Biotechnology and Molecular Biology, Department of Biology, Faculty of Sciences, Moulay Ismail University, Meknes 11201, Morocco
*
Author to whom correspondence should be addressed.
Beverages 2023, 9(3), 74; https://doi.org/10.3390/beverages9030074
Submission received: 19 July 2023 / Revised: 16 August 2023 / Accepted: 24 August 2023 / Published: 4 September 2023

Abstract

:
Prickly pear (Opuntia ficus-indica (L). Mill.) is a plant that belongs to the Cactaceae family and can grow in arid and semi-arid climates. This fruit is considered a good source of nutrients, antioxidant constituents and health-promoting substances, such as betalains and polyphenols. One of the ways in which the communities in the cultivation areas can revalorize this fruit is by diversifying the products that can be made from it. This research proposes the elaboration of prickly pear vinegars and their sensory characterization. Their aromatic profile has been determined using two different methodologies, the traditional Quantitative Descriptive Analysis (QDA) and the Free Choice Profiling (FCP). Similar aromatic profiles have been obtained by both techniques, QDA and FCP, although the last one has proven to be a less time- and effort-demanding method. The vinegars with the highest aromatic intensity and the highest fruity and floral notes were those that had been produced through submerged culture at 30 °C and using Acetobacter malorum strains. It was revealed that the Free Choice Profiling sensory technique is a useful and low-cost tool for innovating in products obtained from a local sugary raw material.

1. Introduction

The fruit from the prickly pear (Opuntia ficus-indica (L). Mill.) is an important biological material that can be the subject of industrial processes to produce new products or by-products (cosmetic products, foods, functional foods or drug-like products). This fruit is considered a good source of nutrients, antioxidant constituents and health-promoting substances, such as betalains and polyphenols [1]. In a cross-cultural study published in 2019 [2], traditional and potential consumers of prickly pears from Mexico and Brazil, respectively, confirmed the popularity of cookies made with prickly pears because of their beneficial functional properties. In recent years, a great diversity of vinegars have been elaborated from different fruits as alternative industrial products that can be produced at low cost and with simple technologies [3,4]. Prickly pear juice is an alternative to be used for these processes because of its high content of fermenting sugars. The production of vinegar opens up a new form of consumption and adds value to these fruits [5]. Some previous studies on the production of vinegar from prickly pear fruit have been described. Pérez et al. [6] prepared vinegar from orange prickly pears using different species of Acetobacter as starter cultures for acetic fermentation, while Prieto et al. [7] carried out trials on the production of balsamic-type vinegar, and Es-Sbata et al. [8] studied the influence of different operational variables on the aromatic and polyphenolic composition of prickly pear vinegar that had been produced using the surface culture method.
Since these are new food products, in addition to their physicochemical characterization, their sensory characterization is essential, even if limitations in the volume of samples available and/or the required number of trained personnel may often represent a difficulty to complete this process. From the late twentieth century, several rapid methods have been developed and demonstrated their great potential and reliability for sensory differentiation which, in addition to their being relatively easier to apply, they also result in a clear advantage in product-developing environments where rapid responses are highly valued [9]. Free Choice Profiling (FCP), between these methods, has been applied in numerous studies with barely trained assessors and even untrained consumers, and has succeeded in providing really positive results [10,11,12,13,14,15]. This technique is based on the hypothesis that almost everybody perceives approximately the same things in qualitative terms, although they may express them differently, depending on people’s previous experiences and acquired sensory background. The use of appropriate and specific vocabulary minimizes the training stage requirements of the sensory evaluation panel, which is of great interest, and this is possible as long as the appropriate data processing techniques are applied. Generalized Procrustes Analysis (GPA) is one of these mathematical tools that allows a different number of descriptors to be used by each assessor, as well as a different use of the scales [16,17,18,19]. On the other hand, the quantitative descriptive analysis (QDA) is one of the most developed tools within sensory analysis and one of the most accepted and established at international level. This method is based on the comparison, assessment, discrimination and quantitative description of a product, carried out by a panel of trained tasters according to previously defined descriptors, in order to obtain objective data. QDA includes the identification and development of a lexicon for the product to be studied, and the training of the panel of tasters with reference material, i.e., samples in which the selected attributes are perceived with known intensities.
The objective of this work was to characterize the aromatic profile of prickly pear vinegars from a sensory point of view. It also aims to investigate whether comparable results are obtained using the traditional Quantitative Descriptive Analysis (QDA) and the FCP method, with the purpose of selecting the one that provides the best results to be used in future studies on the same line of research. The comparison was carried out both at the stage of specific descriptor generation for this type of samples, and at the stage of evaluation of the final prickly pear vinegars produced.

2. Materials and Methods

2.1. Samples

The prickly pear juice vinegars were elaborated under the different conditions described in Table 1.
Two acetification methods (submerged and surface) and two types of bacteria (Acetobacter malorum and Gluconobacter oxydans) at three different temperatures (30, 37 and 40 °C) were used. Each elaboration assay produced about 2 L of vinegar, and it was sampled at different times in order to characterize it from a chemical point of view. As a result, the final volume of each vinegar was even lower than 2 L. For this reason, the vinegar used to carry out the generation of descriptors and the training of the assessors was that from the sampling immediately prior to the final vinegar, which would be considered quite similar to the final one. In addition, a sample composed (CS) of an equal volume of some of these non-final samples was used to test the repeatability of the evaluators during the descriptor selection stage by FCP methodology.

2.2. Methodology

The sensory evaluation sessions were carried out in a standardized tasting room [20], where the influence of external stimuli on the judgments would be minimized. The room temperature was set at 22 °C. The evaluation of the vinegars was exclusively olfactory. In all cases, 15 mL of vinegar were poured into a blue oil tasting glass [21], which was covered with a lid until the moment of evaluation to favor the concentration of the aromas. The serving temperature of the samples was 22 °C (room temperature).
According to the methodology described by Ares and Varela [22], who advocate for the use of small panels for evaluation using a similar flash profile technique, as long as the assessors were trained ones, the committee was made up of 4 judges who have frequently performed sensory evaluations on other types of vinegars and are familiar with the evaluation procedure. The assessors had adequate description skills and an extensive vocabulary to be able to describe products with a large number of attributes. They were selected because they had previously worked with vinegars in different projects. For FCP, there was no specific training beyond a briefing on the test and how to conduct it. For QDA, the training focused on the recognition of the selected descriptors and their intensity in the samples that served as standards.
A total of 9 sessions were scheduled. At the first session, the assessors were presented with 7 prickly pear vinegars from the samplings immediately preceding the final vinegars. They were asked to brainstorm as many terms as they found appropriate to describe the samples’ odor, both regarding similarities and differences. The panel leader eliminated from such lists the hedonic terms (pleasant, unpleasant), quantitative ratings (high, medium, low), gustatory descriptors (sweet, sour) and those describing the product itself (vinegar). At the second session, the FCP evaluation method was explained to the assessors, and they were presented with their lists of individual terms. Then, they were asked to choose as many as they considered of interest for the characterization and differentiation by quantitative evaluation with continuous scales of the set of samples used in the previous session, to which the replica of one of them was added. At Session 3, the 10 final prickly pear vinegars (Table 1) were evaluated using the FCP methodology. For the selection of the appropriate descriptors to be used in the traditional QDA, the terms that had been individually generated in the first session were unified and sieved onto a single list that was discussed at the 4th session to make sure that the meaning of every term was clearly understood. The samples from Session 1 were then evaluated using 9-point interval scales for each of these descriptors (from 0 to 8, being 0 absent, 2 light, 4 medium, 6 intense, and 8 very intense), along with the replicate of one of them. Different criteria were then applied to these data to reduce the number of terms, as provided by UNE 87027 [23]. The standards used for the 2 training sessions of 1.5 h each were real vinegar samples, selected from those produced in the research, presenting each descriptor at an intensity of level 6 in the 9-point scale. The assessors’ ability to identify each of the descriptors was tested and confirmed during the 5th and 6th sessions. Subsequently, the final 10 vinegars of the study were evaluated in duplicate over 3 sessions (7th to 9th).

2.3. Data Processing

For the implementation of the FCP method, the directions of the ISO 13229 standard [24] were followed. The scales used were continuous lines with the labels “absent” and “very intense” on the ends. The consensus index, which is defined as the proportion of the original variance explained by the consensus configuration obtained in the Generalized Procrustes Analysis (GPA) [25] was used for assessor validation. The GPA can transform the different multidimensional configurations of each evaluator so that they are as similar as possible. A comparison of the transformed configurations can then be carried out.
For the traditional QDA, the selection of the descriptors was carried out according to the guidelines in the UNE 87027 standard [23]. In this case, 9-point interval scales (0–8) were used. To evaluate the performance of the judges in QDA, a two-way analysis of variance (assessor x sample) was applied and the p-values of the assessor factor were calculated for each of the olfactory descriptors in the vinegars produced and analyzed, according the guidelines in the standard ISO [26]. The processing of the vinegars data was carried out by applying the one-way analysis of the variance taking into account the factors: culture system, bacterium, and temperature.
The regression vector coefficient Rv [27] was used to calculate the similarity between the matrices of quantitative variables recorded from the vinegars using the FCP and QDA methods.
For the implementation of the GPA and the calculation of Rv, the XLSTAT 2014 trial version software (Addinsoft, New York, NY, USA) was used. The spider charts were constructed using Microsoft Excel 2016 (Microsoft Corp., Redmond, Washington, DC, USA), and the Factor Analysis (FA) was performed using the online version of Statgraphics 18 (Statpoint Technologies, Inc., Warrenton, VA, USA).

3. Results

3.1. Stage 1: Generation of the Odor Descriptors

At the first session, each assessor generated a list of between 15 and 31 descriptors to describe the samples. which was reduced to between 14 and 27 terms per panel member by the panel leader.

3.1.1. Free Choice Profiling (FCP) Methodology

Taking the above individual terms as a starting point, the number of terms used by each assessor to characterize the samples was reduced to between 6 and 11 (Table 2).
By applying a GPA to these data, we obtained a 66.8% consensus index (Rc) among the panelists, which is an intermediate level between those described in the literature [28,29]. Figure 1 shows the projection of the original variables on dimensions F1 (57.81%) and F2 (19.17%). For their interpretation, only those descriptors whose correlation coefficients corresponding to absolute values that were equal or greater than 0.6 and were used by more than one assessor were considered. Factor 1 was explained by to negative notes to the left (off-odor, straw, wet earth, very dried fruit) and positive notes to the right (fruity, ripe fruit, floral, and pungent). Moreover, in this half-plane of F1 > 0, the positive values of F2 were related to the fresh and balsamic notes, while the negative values of F2 were characterized by the spicy notes. The location of the samples on the F1–F2 plane is shown in Figure 2. Given that the CS analyzed by duplicate are located quite close to each other, this would allow to confirm the repeatability of the panel.

3.1.2. Descriptive Quantitative Analysis (QDA) Methodology

The sensory terms agreed after discussion of the initial list were: aromatic intensity, floral, ethyl acetate, fresh, balsamic, vinous, fruity, ripe fruit, dried fruit, raisin, very dried fruit, spicy, peppery, milky, smoky, toasty, vegetal, green vegetal, animal, earthy, wet earth, straw, brew, off-odor, and complexity, to which the olfactory quality was added. The samples were evaluated using 9-point interval scales for each of these descriptors, along with the replicate of one of them. Geometric means %M (√FxI) below 20 ruled out animal, smoke/smoky, brew, and toasted. Raisin, pepper, vegetal, and wet earth’s correlation coefficients with dried fruit, spicy, vegetal and earthy, respectively, were above 0.80, which allowed us to remove the former. The high p-values from the analysis of variance, when taking the sample as a factor, confirmed that the descriptors dried fruit and dairy had no discriminatory capacity whatsoever, so they were also discarded. Finally, by implementing a FA, five factors were extracted that explained 94.5% of the total variability of the data and allowed the identification of some descriptors highly correlated to others, which were discarded in order to facilitate the training (vinous, ethyl acetate, earthy, straw, and fresh). The following twelve terms were finally selected for the evaluation of the prickly pear vinegars produced: pungency, aromatic intensity, floral, balsamic, fruity, ripe fruit, raisin, spicy, vegetal, complexity, off-odor (earth, straw, and very dried fruit), and olfactory quality. The definition of each of these is given in Table 3.

3.2. Stage 2: Sensory Analysis of the Prickly Pear Vinegars

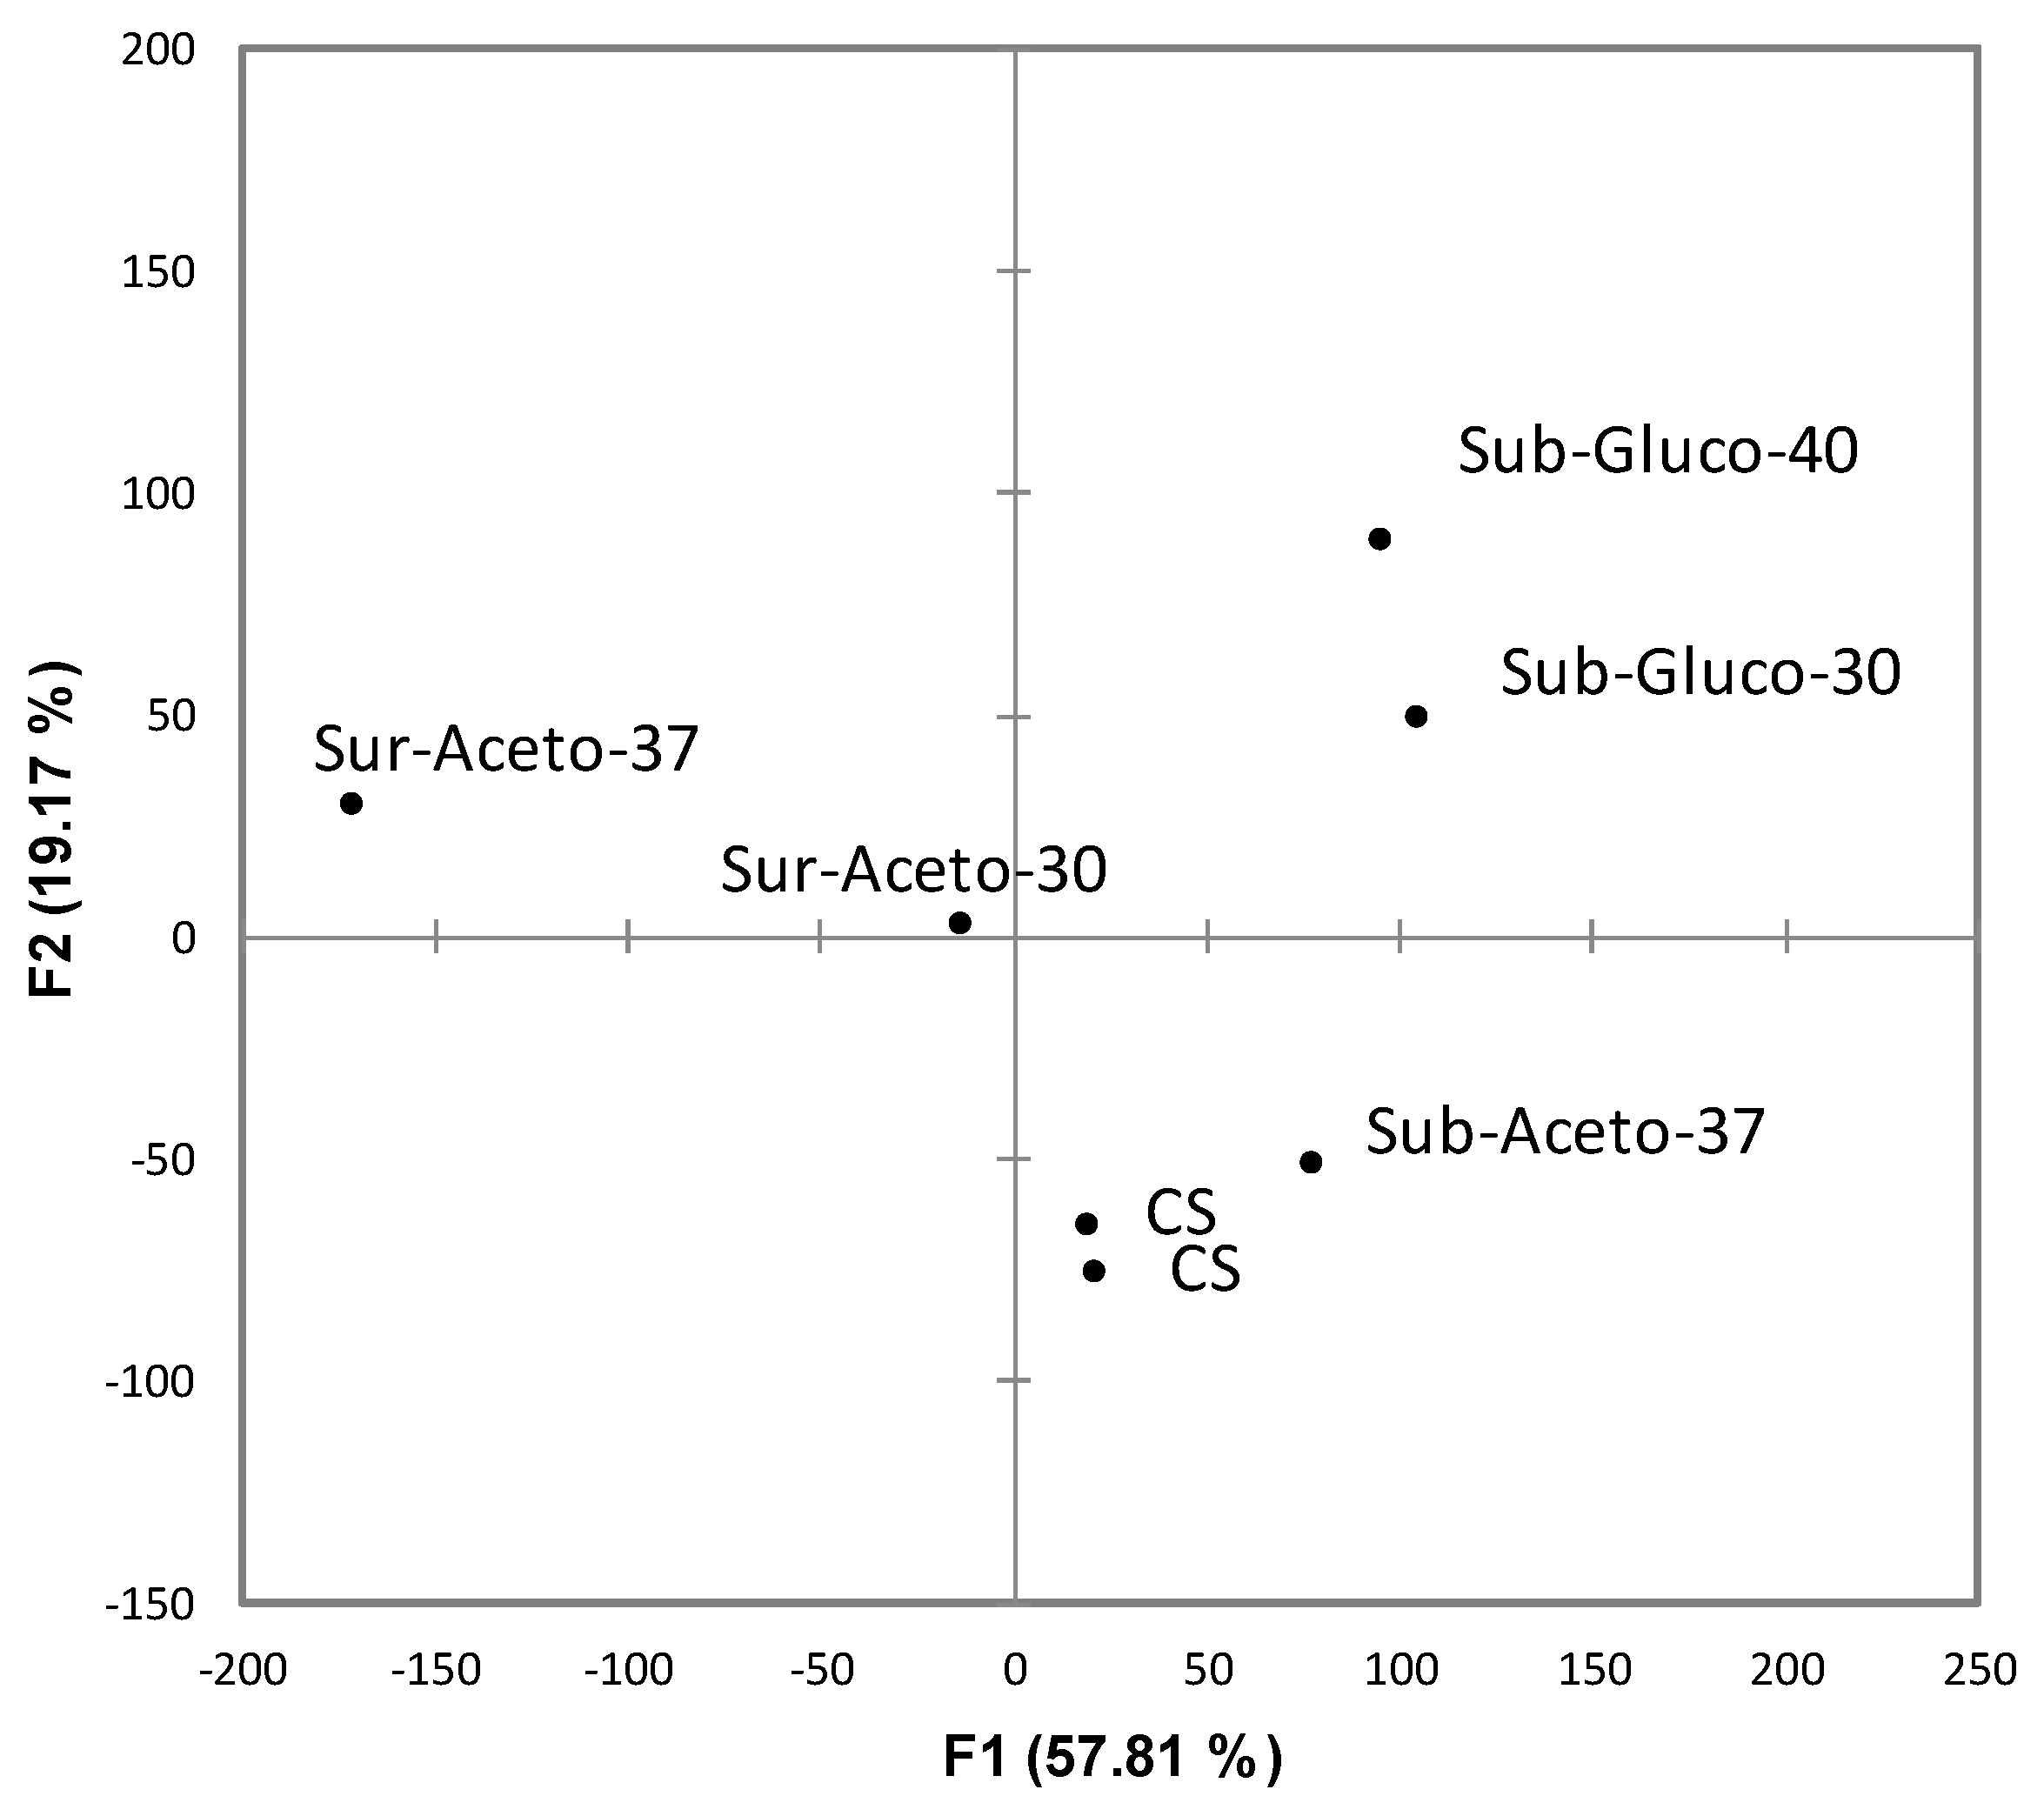
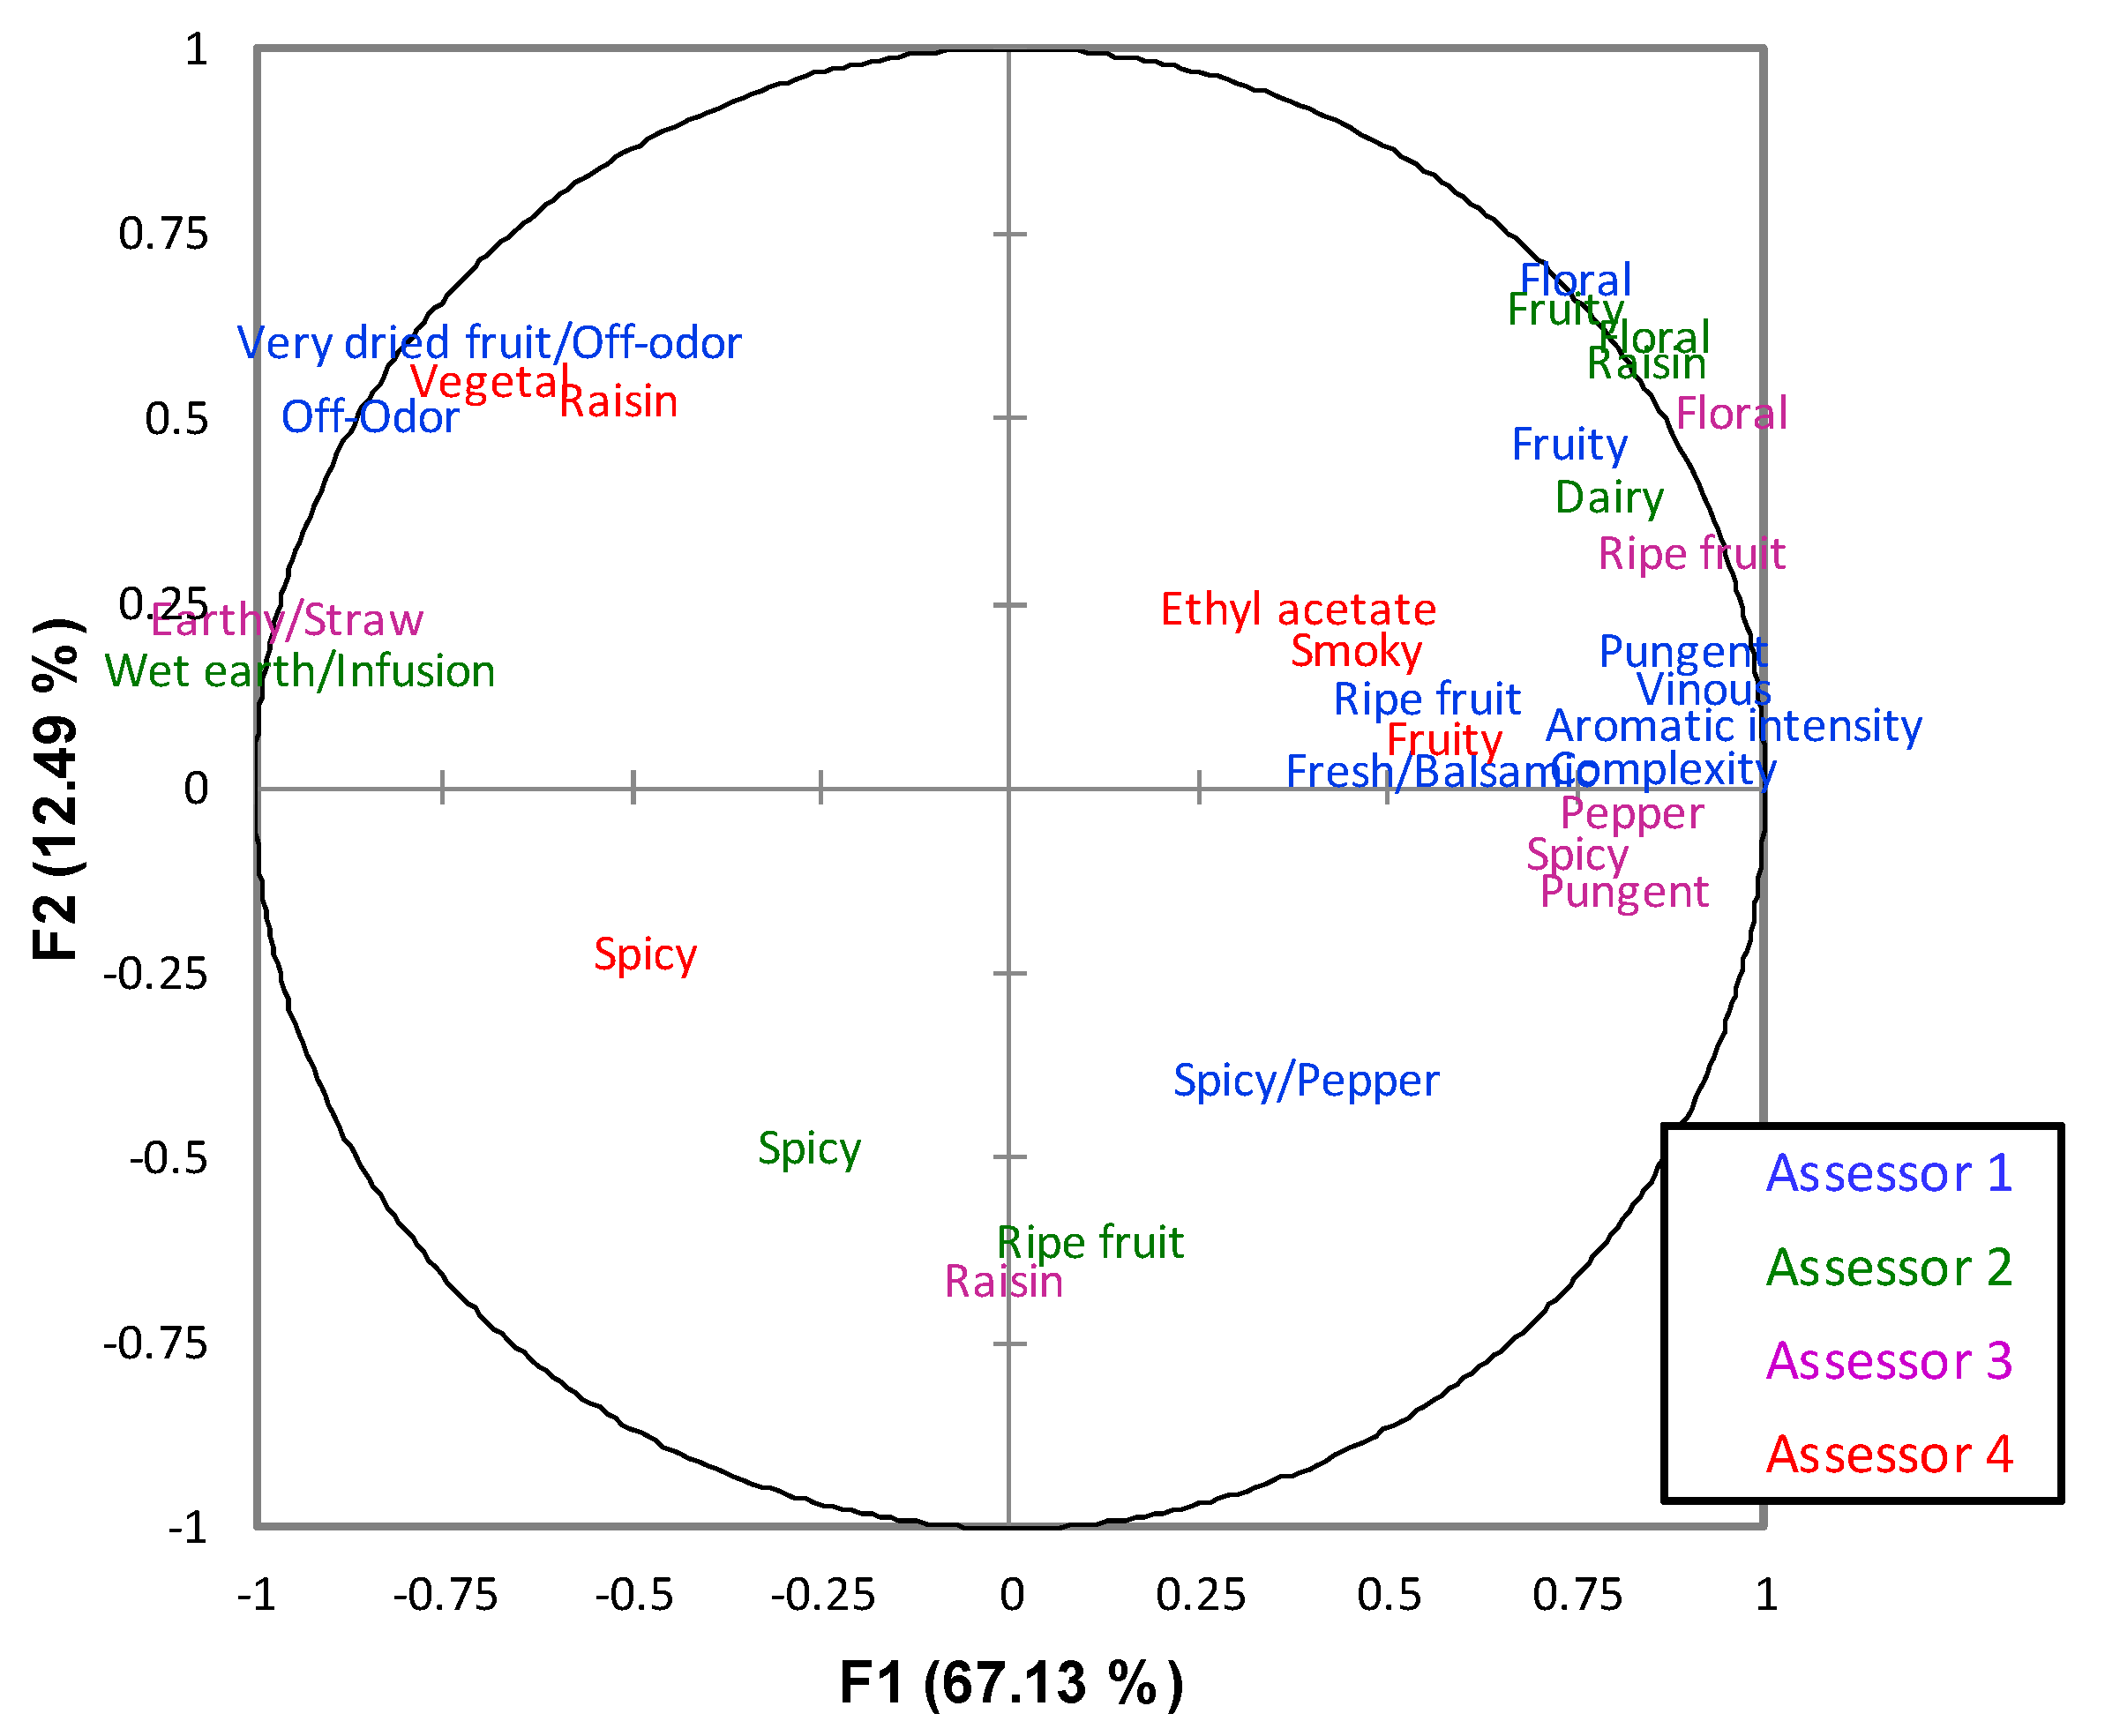
3.2.1. Free Choice Profiling (FCP)

The 10 final prickly pear vinegars (Table 1) were evaluated using the FCP methodology. The GPA applied to the sensory data yielded an acceptable 62.6% consensus rate between the assessors. Figure 3 shows the projection of the descriptors on the plane of the first two factors in the FA, which explain 79.62% of the total variation in the data. It can be observed that it presents a very similar distribution to that obtained during the selection of the descriptors (which was performed using different samples): the positive values of F1 are related to positively valued attributes such as fruity, flower, or pungent, while the negative values are related to negative notes (earth, straw, very dried fruit, off-odor). Likewise, F2 presents negative values correlated with the spicy note, while the floral attribute appears more than once among the positive values.
According to this interpretation of the axes, the projection of the consensus profile of each prickly pear vinegar on the factorial plane (Figure 4) allows us to describe those vinegars that had been produced by surface culture as less aromatic and with some clear defects when compared against those that had been produced by submerged culture, which had been described as more fruity and floral. With respect to F2, the vinegars that had been generated using Acetobacter malorum are in higher positions than those obtained under the same acetification conditions (acetification method and temperature) through the use of Gluconobacter oxydans, which is associated with a predominance of the floral note over the spicy one in the former, and inversely in the latter. Regarding temperature, vinegars produced under surface culture are negatively affected by the highest temperatures tested (37 °C), while those obtained by submerged culture do not show such a clear influence.

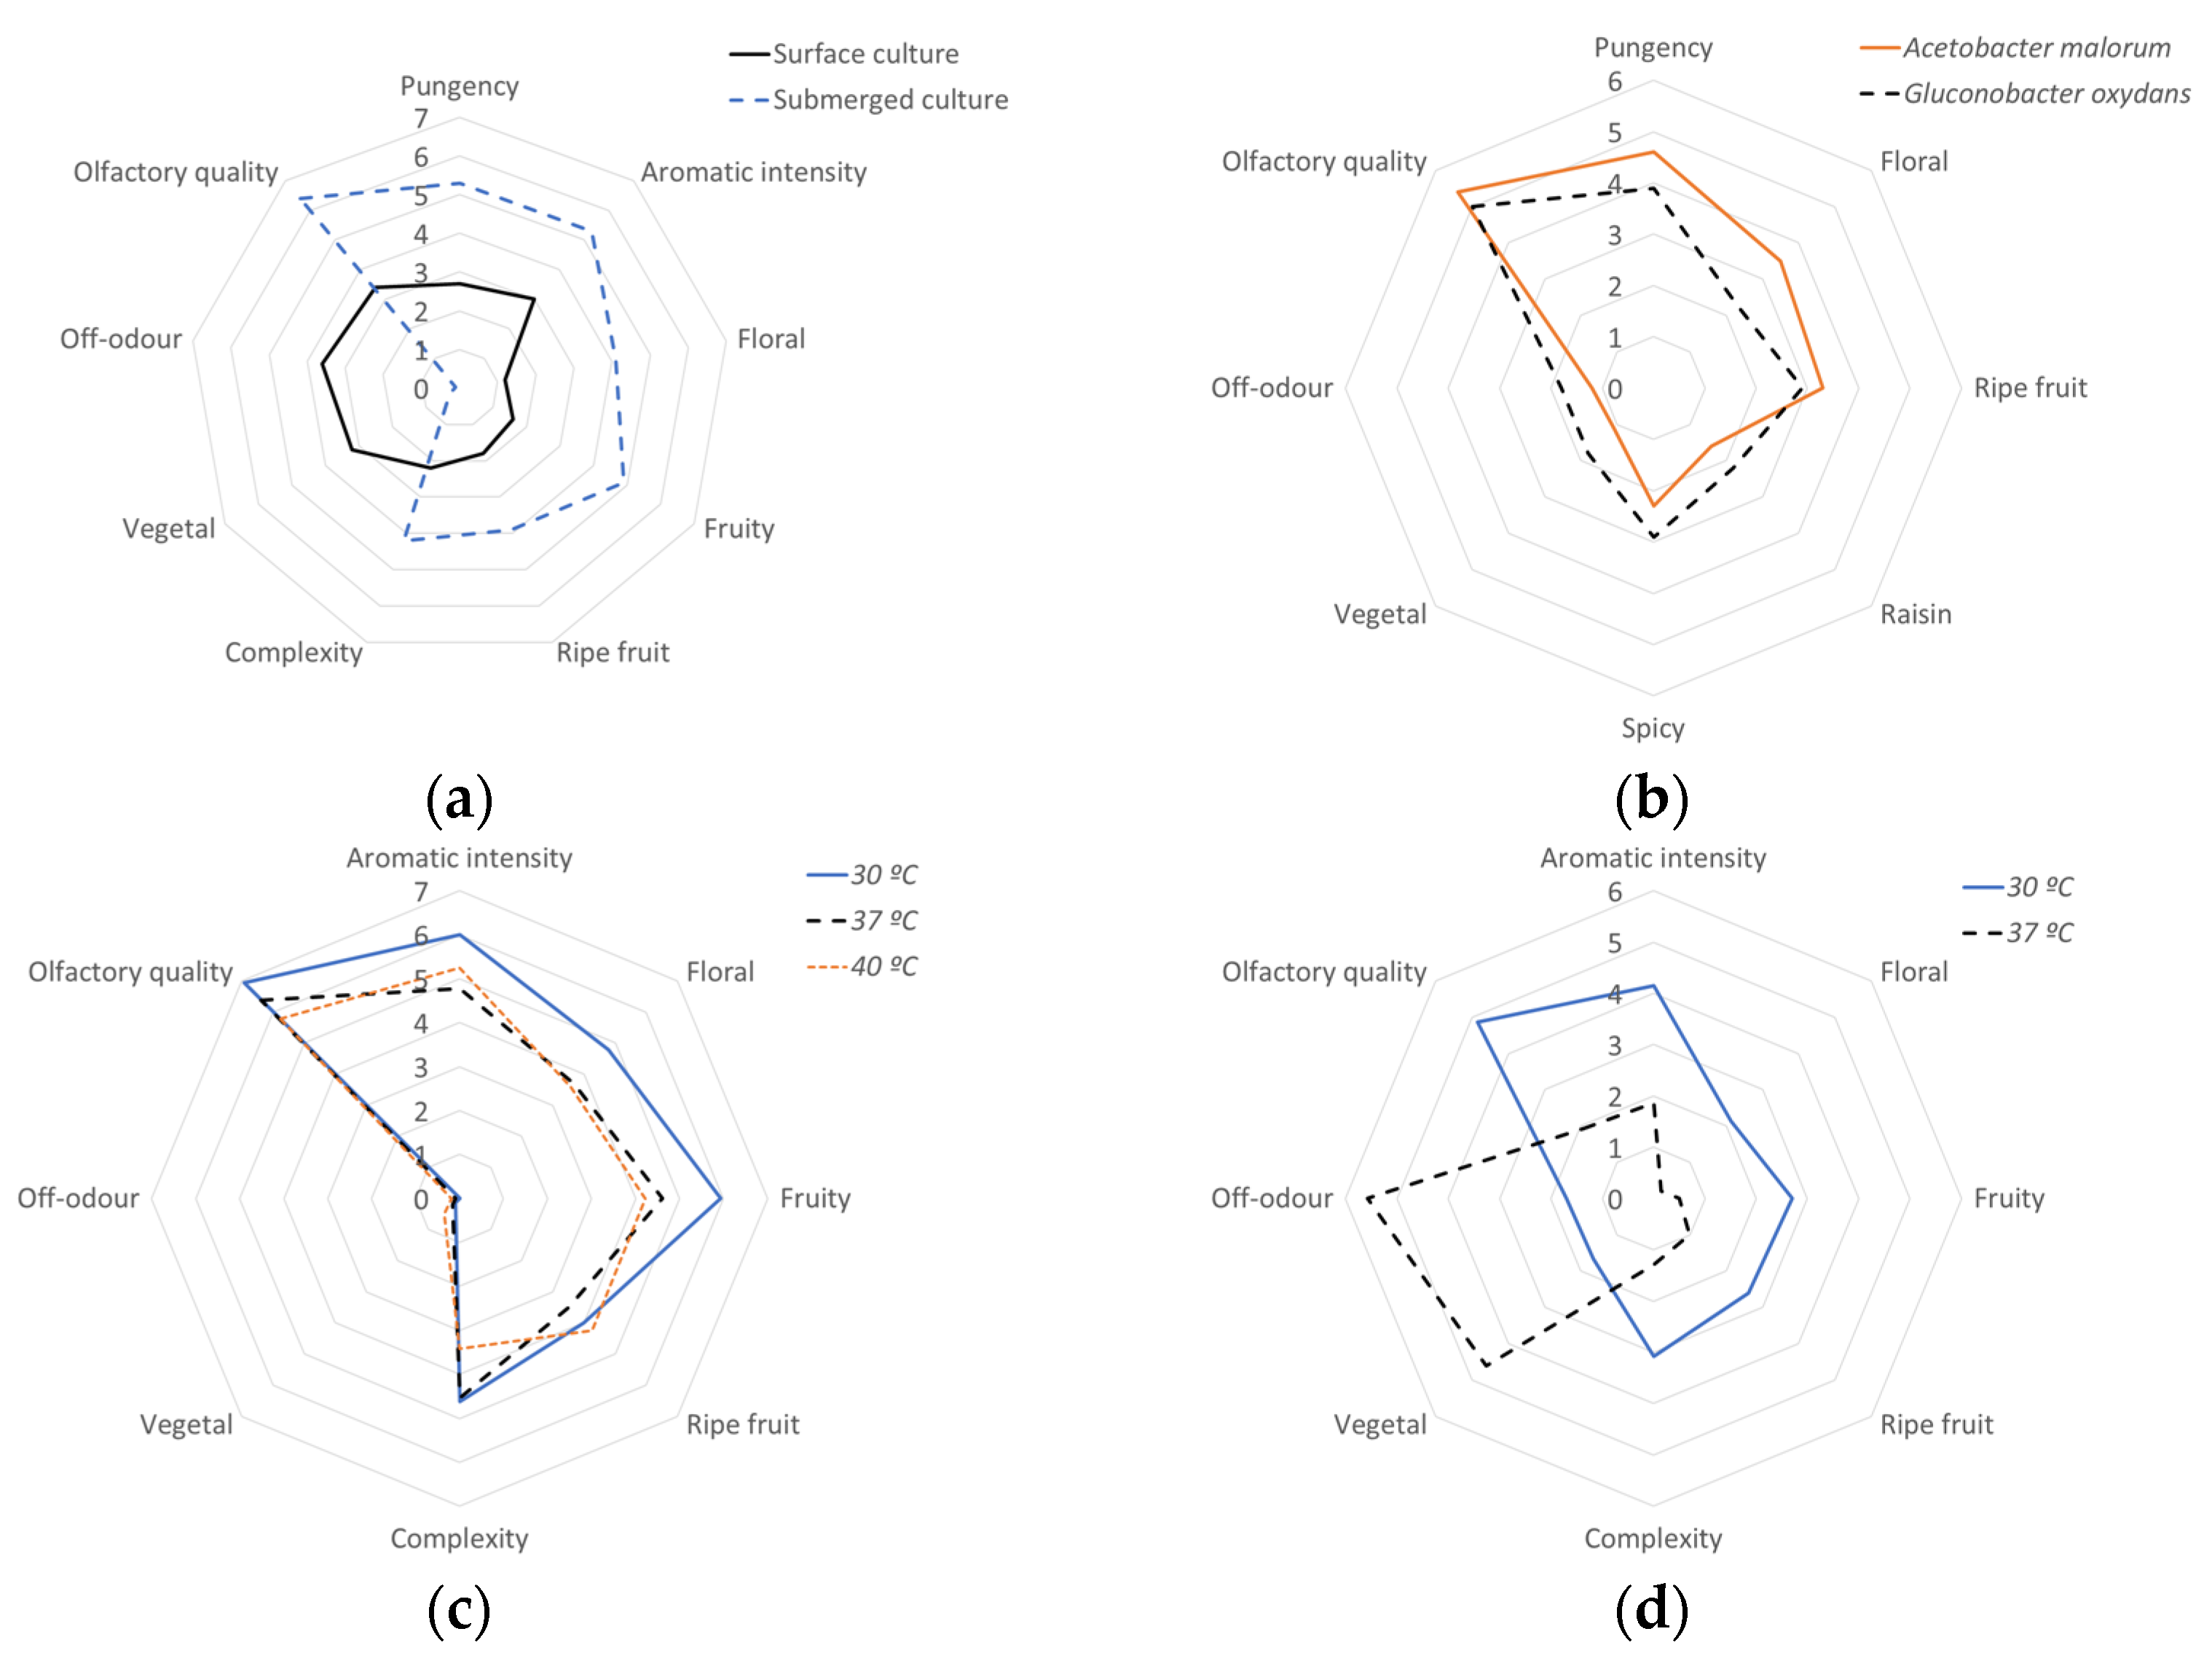
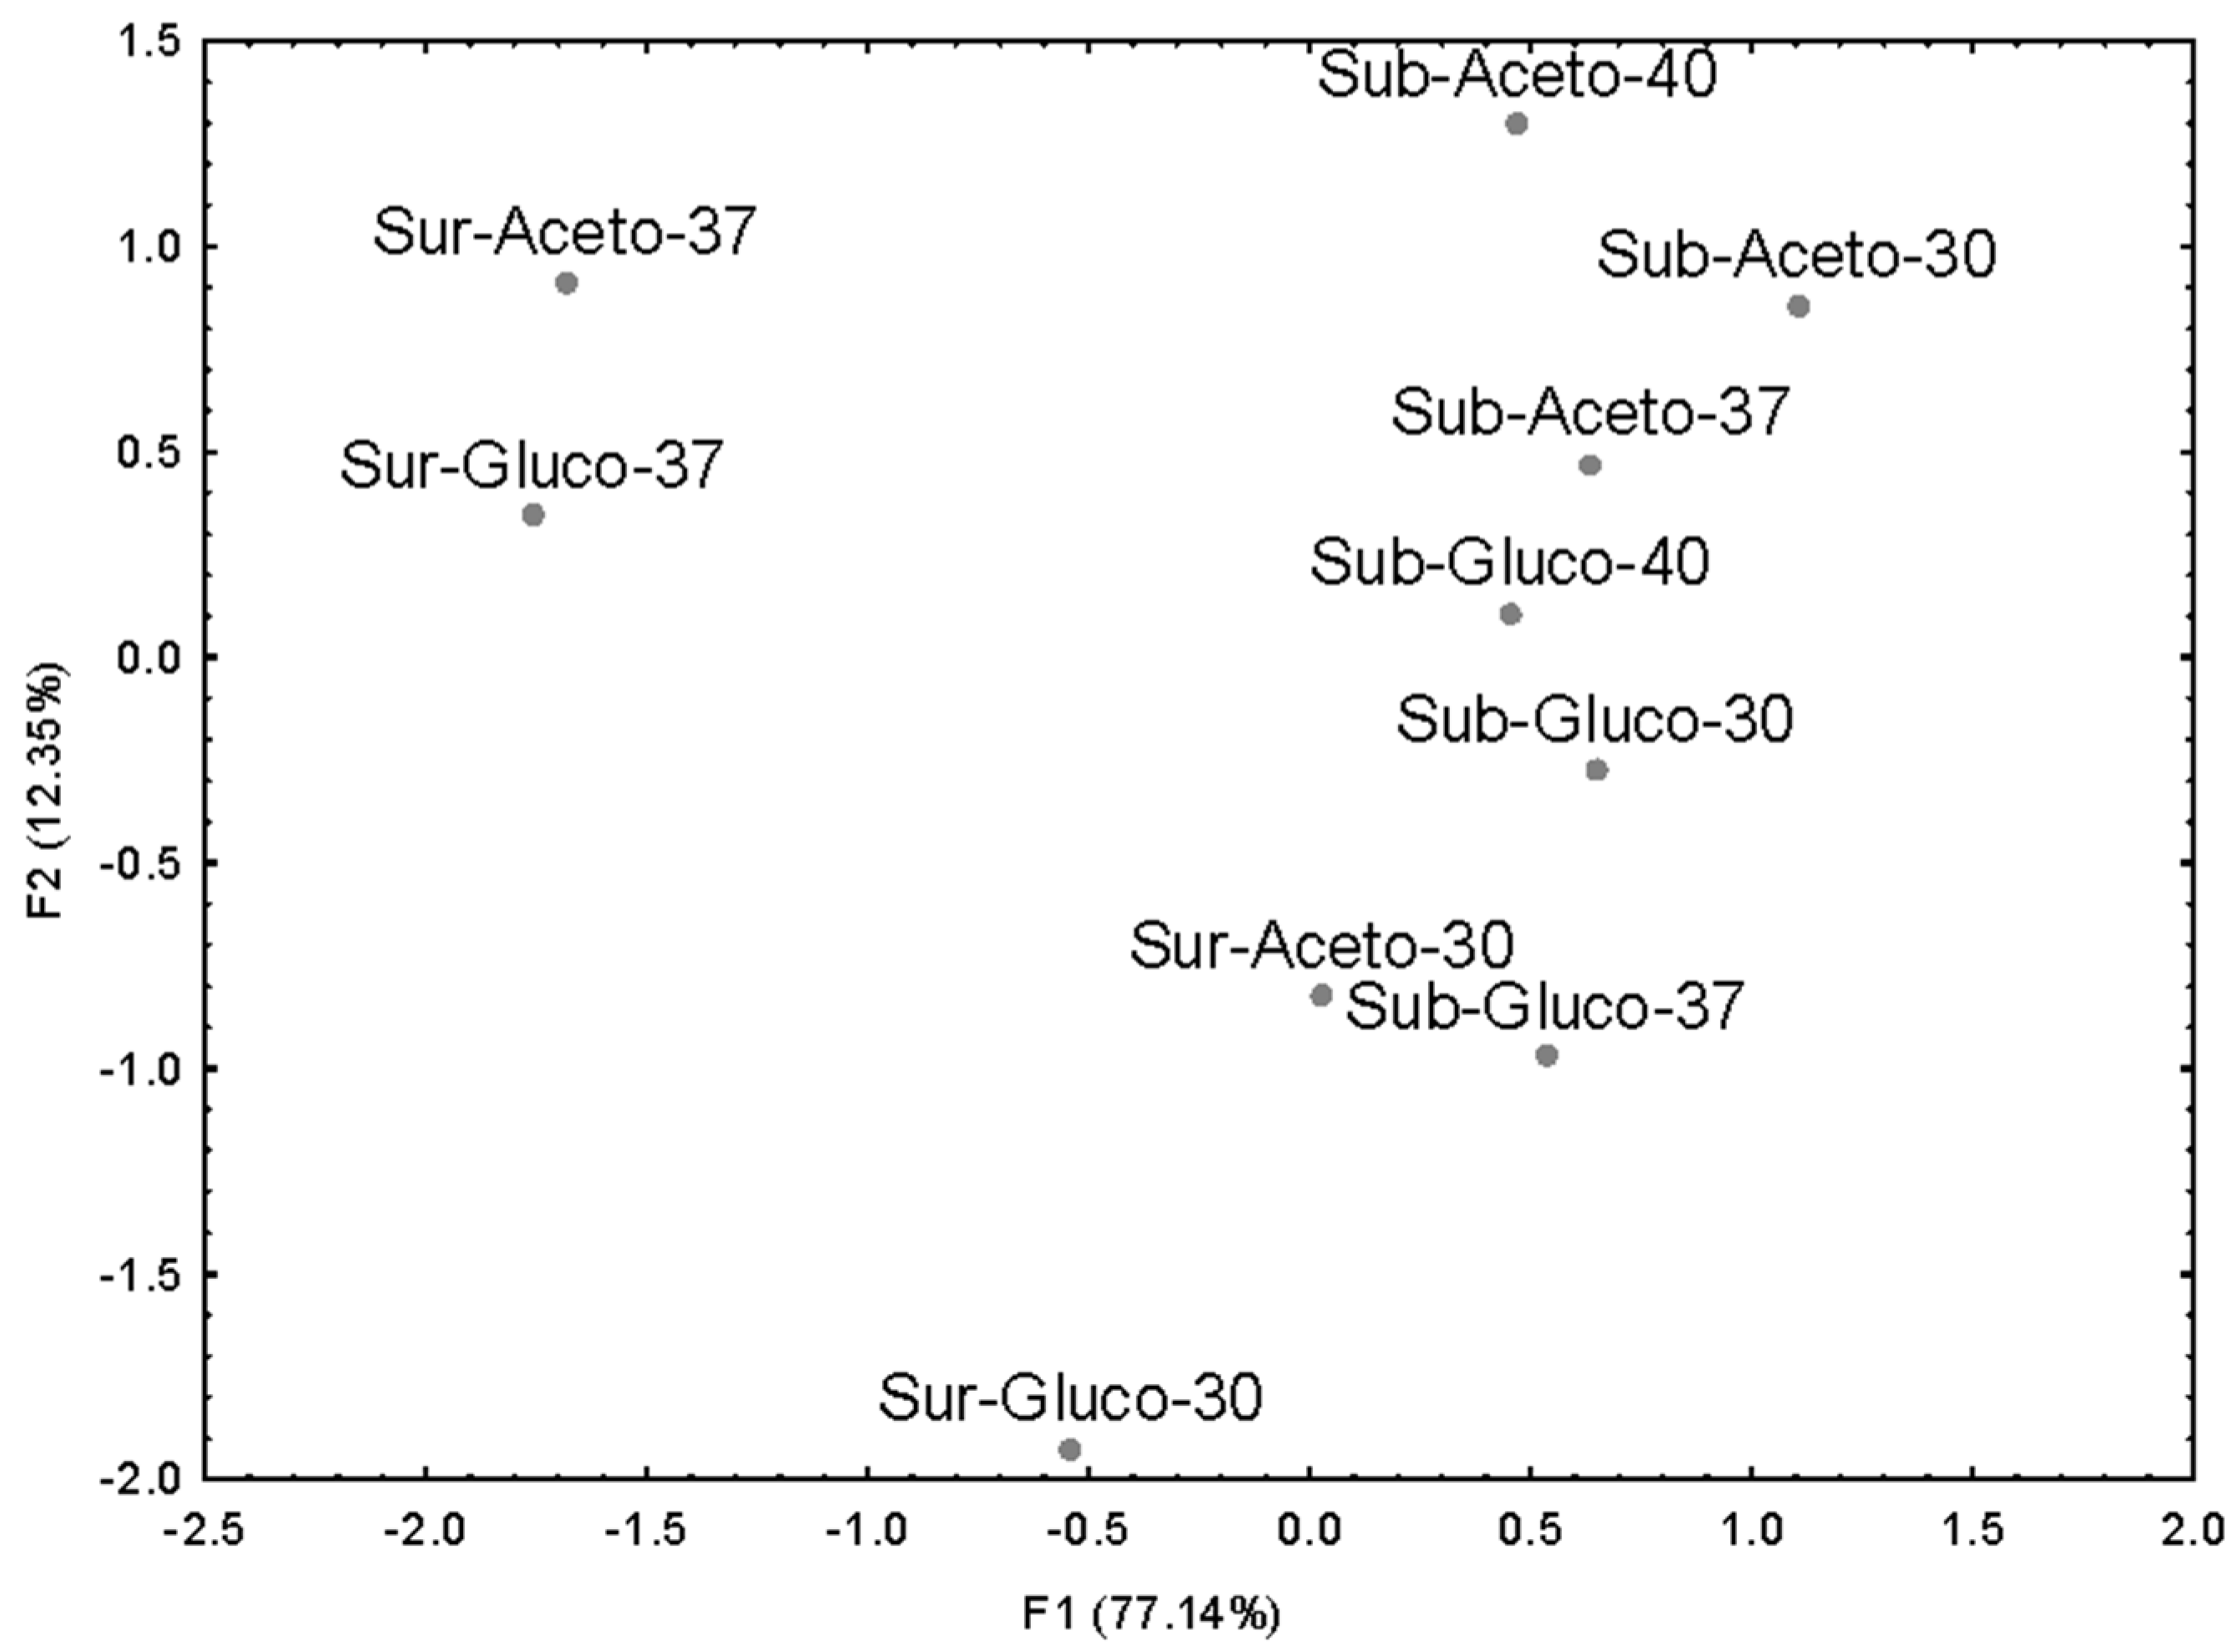
3.2.2. Descriptive Quantitative Analysis (QDA)

The final 10 vinegars of the study were evaluated in duplicate over three sessions. Table 4 summarizes the mean scores granted by the panel to each one of these, together with the results of both analysis of variance corresponding to the samples-by-assessors and culture-by-bacteria-by-temperature. The p-values of the assessor factor greater than 0.05 confirmed the homogeneity of the panel with regard to each of the olfactory descriptors to be considered.
The type of culture used to produce the vinegars had a significant influence on most of the olfactory notes, as can be seen from their respective p-values in Table 4 and through the spider charts in Figure 5a.
The vinegars produced through submerged culture were more complex and aromatic, with notes of flower, fruit, and ripe fruit, as well as a characteristic pungency, compared to those obtained by means of surface culture, which presented clear aromatic defects, and vegetal and raisin notes. Regarding the influence of the acetification process on the sensory properties of prickly pear vinegar, our results are in accordance with those obtained by Cejudo-Bastante et al. [30], who used both acetification systems (surface and submerged cultures) for the production of orange vinegar. As a result of their sensory evaluation, the authors revealed that the vinegar produced by submerged culture presented higher intensities of pungency, fruity, floral, and glue, and better values for general impression, compared to the vinegars produced by surface culture. In another study on Turkish grape vinegar produced by surface and submerged cultures, the only significant difference with respect to their sensory characteristics corresponded to ethyl acetate odor and aromatic intensity, both of which were higher in the vinegars elaborated by surface culture, whereas the rest of the descriptors were very similar regardless of the acetification methods [31]. Contrarily to our results, another study conducted by Callejón et al. [32] reported that an increment in the concentration of aroma compounds was observed in red wine vinegars produced by surface culture acetification, which could be explained by the use of wood barrels, instead of glass vessels, for the fermentation process.
On the other hand, the vinegars that had been produced using Acetobacter malorum strains were somewhat better valued (higher olfactory quality), probably due to their more intense floral and ripe fruit notes, while those elaborated with Gluconobacter oxydans were characterized by spicy and raisin notes (Figure 5b).
The quality of the final vinegars depends on the selection of the appropriate starter cultures to lead the process, the quality of the starting material itself, and the rest of variables in the production method. The G. oxydans used as a starter culture for the production of prickly pear vinegar has the ability to convert glycerol, produced by yeast and molds, into dihydroxyacetone under aerobic conditions, and to form gluconic acid, its lactone derivatives, and ketogluconic acids, as well as 5-oxofructose. These products can alter the chemical composition of the must and provide the sensory quality of the vinegar with a sweet/etherish note that can also react with proline and produce a “crust-like” aroma [33,34]. In another study on the acetic fermentation of pineapple using Acetobacter species, it was found that A. aceti BCRC 14156 was the best strain for the production of pineapple vinegar. This bacteria provided not only a higher fermentation efficiency, but also a larger amount of volatile compounds with floral and fruity aroma [35]. The sensorial characteristics associated with ripe fruit or floral aroma registered by the ester- and alcohol-rich vinegars obtained in that study were similar to ours (fruity and floral) when using A. malorum.
Regarding the effect of the temperature at which the fermentation process was carried out, most of the descriptors with a p-value < 0,05 also showed a significant effect in the interaction with type of culture. As it can be seen in Figure 5c (effect of temperature in submerged culture assays) and Figure 5d (effect of temperature in surface culture assays), temperature was a highly significant factor when vinegar is produced by surface culture. In the vinegars obtained by submerged culture, only the fruity note showed a significant variation depending on the temperature. However, the lowest temperature (30 °C) was related to a better aromatic profiles in both types of cultures. This is in agreement with previously published results [8], which confirmed that concentrations of volatile compounds in vinegars elaborated at 30 °C were higher than those in vinegars produced at higher temperatures.

3.2.3. FCP vs. QDA

When comparing the distribution of the vinegars on the plane corresponding to the first two factors obtained from a FA of the data from QDA (Figure 6) against the pattern resulting from the FCP (see Figure 4), we could confirm that the results obtained by the two methodologies coincide. The calculated RV was 0.78 (p = 0.002), which confirmed a significant correlation between both distributions. This suggests that either of the two methodologies used in this study (QDA and FCP) could be useful to study the aromatic characteristics of prickly pear vinegars.

4. Conclusions

The implementation of QDA, as well as FCP, to the sensory characterization of the prickly pear vinegars produced in this work allowed the successful definition of similar aromatic profiles. Nevertheless, the panel working time spent on the QDA (seven sessions) was much longer than that dedicated to the FCP (three sessions). QDA also presented greater sample volume and data processing time demands. For these reasons, FCP has been confirmed as a quite interesting methodology for the sensory evaluation of edible vinegars with respect to further development phases of this product. The main limitation of the work is related to the size of the panel, which had to be reduced due to the limited availability of sample volumes.
It has also been observed that the type of both culture configuration and acetic acid bacteria used had a relevant influence on the final vinegars’ aroma. A clear influence from the process temperature on the olfactory profiles of the prickly pear vinegars obtained by surface culture could be also confirmed. But, contrary to expectations, the effect of temperature on submerged culture vinegars was not as evident. This indicates that further studies to delve into this aspect should be conducted.
Finally, those vinegars that had been produced through submerged culture at 30 °C and using Acetobacter malorum were rated higher for aromatic intensity and the highest fruity and floral notes. As for the continuation of the research, in order to verify these best results obtained, it would be of great interest to evaluate the vinegars that showed the highest aromaticities by applying the fast FCP methodology with a larger tasting panel.

Author Contributions

Conceptualization, C.R.-D. and R.Z.; Methodology, C.R.-D.; Formal analysis, C.R.-D.; Investigation, I.E.-S.; Resources, I.E.-S. and R.Z.; Writing—original draft preparation, C.R.-D. and I.E.-S.; Writing—review and editing, E.D.-G., R.C.-M. and C.R.-D.; Visualization, C.R.-D.; Supervision, E.D.-G. and R.C.-M.; Funding acquisition, R.C.-M. All authors have read and agreed to the published version of the manuscript.

Funding

This work was supported by the University of Cadiz (Proyectos Puente del Programa de Fomento e Impulso de la Investigación y de la Transferencia de la Universidad de Cádiz, PR2020-009).

Conflicts of Interest

The authors declare no conflict of interest.

References

  1. Coria Cayupán, Y.S.; Ochoa, M.J.; Nazareno, M.A. Health-promoting substances and antioxidant properties of Opuntia sp. fruits. Changes in bioactive-compound contents during ripening process. Food Chem. 2011, 126, 514–519. [Google Scholar] [CrossRef]
  2. de Albuquerque, J.G.; de Souza Aquino, J.; de Albuquerque, J.G.; de Farias, T.G.S.; Escalona-Buendía, H.B.; Bosquez-Molina, E.; Azoubel, P.M. Consumer perception and use of nopal (Opuntia ficus-indica): A cross-cultural study between Mexico and Brazil. Food Res. Int. 2019, 124, 101–108. [Google Scholar] [CrossRef] [PubMed]
  3. Ousaaid, D.; Mechchate, H.; Laaroussi, H.; Hano, C.; Bakour, M.; El Ghouizi, A.; Conte, R.; Lyoussi, B.; El Arabi, I. Fruits Vinegar: Quality Characteristics, Phytochemistry, and Functionality. Molecules 2022, 27, 222. [Google Scholar] [CrossRef] [PubMed]
  4. Luzón-Quintana, L.M.; Castro, R.; Durán-Guerrero, E. Biotechnological processes in fruit vinegar production. Foods 2021, 10, 945. [Google Scholar] [CrossRef]
  5. Sudzuki, F.; Muñoz, C.; Berger, H. El Cultivo de la Tuna (Cactus Pear); Facultad de Ciencias Agrarias y Forestales, Universidad de Chile: Santiago, Chile, 1993. [Google Scholar]
  6. Pérez, M.; Rodríguez, M.; Martínez, M. Elaboración de vinagre de tuna amarilla “Naranjona o Pico Chulo”. In Proceedings of the VIII Congreso Nacional y VI Internacional sobre Conocimiento y Aprovechamiento del Nopal, San Luis Potosí, México, 6–10 September 1999; pp. 8–9. [Google Scholar]
  7. Prieto, C.; Sáenz, C.; Silva, P.; Loyola, E. Balsamic Type Vinegar from Colored Ecotypes of Cactus Pear (Opuntia ficus-indica). Acta Hortic. 2009, 811, 123–126. [Google Scholar] [CrossRef]
  8. Es-Sbata, I.; Castro, R.; Carmona-Jiménez, Y.; Zouhair, R.; Durán-Guerrero, E. Influence of Different Bacteria Inocula and Temperature Levels on the Chemical Composition and Antioxidant Activity of Prickly Pear Vinegar Produced by Surface Culture. Foods 2022, 11, 303. [Google Scholar] [CrossRef]
  9. Varela, P.; Ares, G. Sensory profiling, the blurred line between sensory and consumer science. A review of novel methods for product characterization. Food Res. Int. 2012, 48, 893–908. [Google Scholar] [CrossRef]
  10. De Carvalho, M.A.; Benassi, M.T.; De Londrina, U.E.; Scholz, M.B.S. Free choice profiling sensory analysis and principal component analysis as tools to support an apple breeding program. AIMS Agric. Food 2020, 5, 769–784. [Google Scholar] [CrossRef]
  11. Cristovam, E.; Paterson, A.; Piggott, J.R. Differentiation of port wines by appearance using a sensory panel: Comparing free choice and conventional profiling. Eur. Food Res. Technol. 2000, 211, 65–71. [Google Scholar] [CrossRef]
  12. Jack, F.R.; Piggott, J.R. Free choice profiling in consumer research. Food Qual. Prefer. 1991, 3, 129–134. [Google Scholar] [CrossRef]
  13. Liu, J.; Bredie, W.L.P.; Sherman, E.; Harbertson, J.F.; Heymann, H. Comparison of rapid descriptive sensory methodologies: Free-Choice Profiling, Flash Profile and modified Flash Profile. Food Res. Int. 2018, 106, 892–900. [Google Scholar] [CrossRef] [PubMed]
  14. Parolari, G. Taste quality of Italian raw ham in a free-choice profile study. Food Qual. Prefer. 1994, 5, 129–133. [Google Scholar] [CrossRef]
  15. Williams, A.; Arnold, G. A comparison of the aromas of 6 coffees characterized by conventional profiling, free-choice profiling and similarity scaling methods. J. Sci. Food Agric. 1985, 36, 204–214. [Google Scholar] [CrossRef]
  16. Arnold, G.; Williams, A. The use of generalised procrustes techniques in Sensory Analysis. In Statistical Procedures in Food Research; Piggott, J.R., Ed.; Elsevier Applied Science Publishers Ltd.: Amsterdam, The Netherlands, 1986; pp. 233–253. [Google Scholar]
  17. Dijksterhuis, G.B.; Gower, J.C. The interpretation of Generalized Procrustes Analysis and allied methods. Food Qual. Prefer. 1991, 3, 67–87. [Google Scholar] [CrossRef]
  18. Dijksterhuis, G. Procrustes analysis in sensory research. In Multivariate Analysis of Data in Sensory Science; Noes, T., Risvik, E., Eds.; Elsevier Science B.V.: Amsterdam, The Netherlands, 1996; pp. 185–219. [Google Scholar]
  19. Gower, J.C. Generalized procrustes analysis. Psychometrika 1975, 40, 33–51. [Google Scholar] [CrossRef]
  20. ISO 8589:2007; Sensory analysis. General Guidance for the Design of Test Rooms. International Organization for Standardization (ISO): Geneva, Switzerland, 2007.
  21. ISO 16657:2006; Sensory Analysis. Apparatus. Olive Oil Tasting Glass. International Organization for Standardization (ISO): Geneva, Switzerland, 2007.
  22. Ares, G.; Varela, P. Novel Techniques in Sensory Characterization and Consumer Profiling; CRC Press; Taylor & Francis Group: London, UK; New York, NY, USA, 2014. [Google Scholar]
  23. UNE 87027; Análisis Sensorial. Identificación y Selección de Descriptores para la Elaboración de un Perfil Sensorial Mediante Diferentes Enfoques. Asociación Española de Normalización: Madrid, Spain, 2018.
  24. ISO 13299:2016; Sensory Analysis. Methodology. General Guidance for Establishing a Sensory Profile. International Organization for Standardization (ISO): Geneva, Switzerland, 2016.
  25. Wakeling, I.; Raats, M.; MacFie, H. A new significance test for consensus in Generalised Procrustes Analysis. J. Sens. Stud. 1992, 7, 91–96. [Google Scholar] [CrossRef]
  26. ISO 8586:2012; Sensory Analysis. General Guidelines for the Selection, Training and Monitoring of Selected Assessors and Expert Sensory Assessors. International Organization for Standardization (ISO): Geneva, Switzerland, 2014.
  27. Schlich, P. Defining and validating assossor compromises about product distances and attribute correlations. In Multivariate Analysis of Data in Sensory Sciences; Naes, T., Risvik, E., Eds.; Elsevier: New York, NY, USA, 1996. [Google Scholar]
  28. Rodríguez-Noriega, S.; Buenrostro-Figueroa, J.J.; Rebolloso-Padilla, O.N.; Corona-Flores, J.; Camposeco-Montejo, N.; Flores-Naveda, A.; Ruelas-Chacón, X. Developing a descriptive sensory characterization of flour tortilla applying flash profile. Foods 2021, 10, 1473. [Google Scholar] [CrossRef]
  29. Wu, W.; Guo, Q.; De Jong, S.; Massart, D.L. Randomisation test for the number of dimensions of the group average space in generalised Procrustes analysis. Food Qual. Prefer. 2002, 13, 191–200. [Google Scholar] [CrossRef]
  30. Cejudo-Bastante, C.; Durán-Guerrero, E.; García-Barroso, C.; Castro-Mejías, R. Comparative study of submerged and surface culture acetification process for orange vinegar. J. Sci. Food Agric. 2018, 98, 1052–1060. [Google Scholar] [CrossRef]
  31. Ünal Turhan, E.; Canbaş, A. Chemical and Sensory Properties of Vinegar from Dimrit Grape by Submerged and Surface Method. Gida 2016, 41, 1–7. [Google Scholar] [CrossRef]
  32. Callejón, R.M.; Tesfaye, W.; Torija, M.J.; Mas, A.; Troncoso, A.M.; Morales, M.L. Volatile compounds in red wine vinegars obtained by submerged and surface acetification in different woods. Food Chem. 2009, 113, 1252–1259. [Google Scholar] [CrossRef]
  33. Hommel, R.K. Gluconobacter. Encycl. Food Microbiol. 2014, 2, 955–961. [Google Scholar]
  34. Campaniello, D.; Sinigaglia, M. Wine Spoiling Phenomena; Elsevier Ltd.: Amsterdam, The Netherlands, 2017; ISBN 9780081005033. [Google Scholar]
  35. Ou, A.S.; Chang, R. Taiwan Fruit Vinegar. In Vinegars of the World; Solieri, L., Giudici, P., Eds.; Springer: Milan, Italy, 2009. [Google Scholar]
Figure 1. Sensory space of the olfactory descriptors of the FCP during their generation stage.
Beverages 09 00074 g001
Figure 2. Sensory space of the samples in the FCP during the descriptors’ generation. CS: composed samples.
Beverages 09 00074 g002
Figure 3. Sensory space of the FCP descriptors during the evaluation of the prickly pear vinegars in the research.
Beverages 09 00074 g003
Figure 4. Sensory space of the samples after the implementation of the FCP methodology to the sensory study of the prickly pear vinegars in the research.
Beverages 09 00074 g004
Figure 5. QDA. Spider charts of the descriptors with significantly varying intensity according to: (a) the type of culture; (b) the bacteria used for the production; (c) temperature (in submerged culture assays); (d) temperature (in surface culture experiments). Intensity scales: 0 Absent, 2 Light, 4 Medium, 6 Intense, 8 Very intense.
Beverages 09 00074 g005
Figure 6. Projection of the samples on the factor space obtained from the olfactory scores of the prickly pear vinegars evaluated according to the traditional QDA method.
Beverages 09 00074 g006
Table 1. Variables involved in the production of the prickly pear vinegars.
SampleAcetification MethodsBacteriumTemperature (°C)
Sub-Aceto-30SubmergedAcetobacter malorum30
Sub-Aceto-37SubmergedAcetobacter malorum37
Sub-Aceto-40SubmergedAcetobacter malorum40
Sub-Gluco-30SubmergedGluconobacter oxydans30
Sub-Gluco-37SubmergedGluconobacter oxydans37
Sub-Gluco-40SubmergedGluconobacter oxydans40
Sur-Aceto-30SurfaceAcetobacter malorum30
Sur-Aceto-37SurfaceAcetobacter malorum37
Sur-Gluco-30SurfaceGluconobacter oxydans30
Sur-Gluco-37SurfaceGluconobacter oxydans37
Table 2. Olfactory descriptors used by each of the 4 assessors constituting the panel for FCP.
Assessor 1Assessor 2Assessor 3Assessor 4
FruitySpicySpicyEthyl acetate
ComplexityFloralFloralSpicy
Off-odorFruityRipe fruitFruity
Spicy/PepperRipe fruitRaisinSmoky
FloralDairyPepperRaisin
Fresh/BalsamicRaisinPungentVegetal
Very dried fruit/Off-odorWet earth/InfusionEarthy/Straw
Ripe fruit/Raisin
Aromatic intensity
Pungent
Vinous
Table 3. Sensory descriptors selected from the traditional QDA and their definitions.
Olfactory DescriptorDefinition
PungencyPungent feeling in the nose when inhaling, mainly due to acetic acid.
Aromatic intensityIntensity of the positive aromatic notes as a whole.
FloralOlfactory reminiscence of flowers.
BalsamicRefreshing sensation reminiscent of pine and camphor.
FruityFruity notes, particularly prickly pear or other tropical fruit (mango, pineapple).
Ripe fruitRipe fruit notes.
RaisinNotes of dried fruit (grape, plumps).
SpicySpicy notes, particularly pepper.
VegetalOlfactory reminiscence of cooked vegetables.
ComplexityDiversity of positive aromatic notes.
Off-odor Unpleasant sensation with reminiscences of earth, straw, or very dried fruit.
Olfactory qualityGeneral orthonasal perception of the aromatic complexity and intensity and lack of flaws.
Table 4. QDA. Average ratings (±standard deviation) by the tasting panel of the prickly pear vinegars elaborated in this work, and p-values from the analysis of the variance applied. p < 0.05 indicates significant variation in the rating as a function of the specified variance factor.
SamplePungencyAromatic IntensityFloralBalsamicFruityRipe FruitRaisinSpicyVegetalComplexityOff-OdorOlfactory Quality
Sub-Aceto-306.3 ± 1.46.6 ± 1.56.0 ± 2.02.9 ± 1.36.4 ± 1.03.7 ± 1.11.0 ± 1.42.1 ± 1.10.3 ± 0.54.8 ± 1.50.0 ± 0.07.4 ± 1.0
Sub-Aceto-375.4 ± 1.75.0 ± 1.94.3 ± 2.12.7 ± 1.74.7 ± 2.13.4 ± 1.70.8 ± 12.5 ± 1.40.0 ± 0.04.4 ± 2.10.0 ± 0.06.0 ± 1.6
Sub-Aceto-405.3 ± 0.85.5 ± 1.43.7 ± 2.12.0 ± 1.34.0 ± 2.14.8 ± 2.01.0 ± 1.32.1 ± 1.30.3 ± 0.83.0 ± 1.00.3 ± 0.56.0 ± 1.7
Sub-Gluco-304.5 ± 0.55.4 ± 1.03.6 ± 1.63.3 ± 1.25.4 ± 1.54.3 ± 1.42.5 ± 1.82.3 ± 1.60.0 ± 0.04.4 ± 0.50.0 ± 0.06.4 ± 1.1
Sub-Gluco-374.8 ± 1.04.5 ± 0.83.0 ± 2.02.7 ± 0.54.5 ± 1.43.6 ± 1.61.0 ± 1.33.7 ± 2.00.4 ± 0.84.7 ± 1.00.2 ± 0.46.8 ± 0.8
Sub-Gluco-405.3 ± 1.15.0 ± 0.93.4 ± 1.12.7 ± 1.74.4 ± 2.13.7 ± 2.01.4 ± 1.12.6 ± 1.40.7 ± 1.34.0 ± 1.40.0 ± 0.05.6 ± 2.1
Sur-Aceto-304.8 ± 0.84.3 ± 0.52.7 ± 1.33.2 ± 1.33.0 ± 1.93.2 ± 1.22.6 ± 2.02.7 ± 1.01.0 ± 0.83.6 ± 1.10.2 ± 0.45.3 ± 1.5
Sur-Aceto-371.0 ± 1.31.7 ± 1.50.3 ± 0.51.1 ± 1.20.4 ± 0.51.3 ± 1.72.6 ± 0.82.0 ± 1.54.0 ± 1.11.4 ± 1.55.6 ± 1.82.1 ± 1.3
Sur-Gluco-304.0 ± 1.34.0 ± 1.21.6 ± 1.33.1 ± 1.12.4 ± 0.52.1 ± 1.83.6 ± 1.13.4 ± 1.12.6 ± 1.92.5 ± 1.53.0 ± 2.14.4 ± 1.7
Sur-Gluco-371.0 ± 1.82.0 ± 1.50.1 ± 2.11.4 ± 1.50.6 ± 2.10.7 ± 2.12.3 ± 1.52.5 ± 1.55.1 ± 2.01.1 ± 1.85.6 ± 2.11.7 ± 2.1
psample0.0000.0000.0000.0000.0000.0000.0000.0090.0000.0000.0000.000
passessor0.0710.9530.4490.0520.7230.4670.2190.0850.8860.5940.1980.060
pculture0.0000.0000.0400.0950.0000.0000.0010.9760.0000.0000.0000.000
pbacteria0.0220.2370.0030.6810.2750.1160.1380.0530.1220.3200.0680.100
ptemperature0.0900.0000.0000.0060.0000.0170.0680.9530.0880.1190.1650.077
Disclaimer/Publisher’s Note: The statements, opinions and data contained in all publications are solely those of the individual author(s) and contributor(s) and not of MDPI and/or the editor(s). MDPI and/or the editor(s) disclaim responsibility for any injury to people or property resulting from any ideas, methods, instructions or products referred to in the content.

