Article

Non-Thermal Processing of a Protein Functional Beverage Using Pulsed Electric Fields: Escherichia coli Inactivation and Effect on Proteins

1
Department of Chemical and Materials Engineering, The University of Auckland, Private Bag 92019, Auckland 1142, New Zealand
2
LEAF—Linking Landscape, Environment, Agriculture and Food, Associated Laboratory TERRA, Instituto Superior de Agronomia, Universidade de Lisboa, Tapada da Ajuda, 1349-017 Lisboa, Portugal
*
Author to whom correspondence should be addressed.
Beverages 2022, 8(4), 68; https://doi.org/10.3390/beverages8040068
Submission received: 16 June 2022 / Revised: 23 October 2022 / Accepted: 25 October 2022 / Published: 1 November 2022
(This article belongs to the Special Issue Preservation of Beverages by Continuous Pasteurization Technologies)

Abstract

:
The application of pulsed electric fields (PEFs) for the inactivation of Escherichia coli, suspended in a protein shake beverage and diluted with sterilized distilled water was carried out. Square bipolar pulses in the range of 25–40 kV/cm electric field intensities were applied at different frequencies (400–900 Hz) to investigate the effect of different PEF conditions on the microbial population and proteins relevant to this functional beverage. The treatment temperature was kept below the lethal temperature of the microorganism under investigation. As power consumption plays an important role in the efficiency of the PEF application, the dissipated power was also estimated. Four log reductions in the E. coli population were obtained with 10 pulses at a 40 kV/cm field intensity and 25 pulses at a 25 kV/cm field intensity. PEF-treated whey-protein concentrates showed less denaturation in proteins than thermally treated concentrates, especially for lower electric field intensities (0% denaturation ± 0.007 at 25 kV/cm and 900 Hz, 4.41% denaturation ± 0.008 at 40 kV/cm and 400 Hz). Soy protein isolates manifested high sensitivity to PEF processing and resulted in denaturation and aggregation in the protein structure.

1. Introduction

Pulsed electric field (PEF) technology is widely used in food-processing applications, including pasteurization and extraction applications. The efficacy of the technology lies in the conditions employed, namely lower processing times and temperatures, which preserve the foods natural and sensory attributes, nutritional values and safety. In regard to microbial inactivation, PEF technology has been reported to exhibit a volumetric effect by providing rapid and constant microbial inactivation throughout the treated product [1]. The mechanism of PEF microbial inactivation encapsulates within the electroporation phenomenon, which results from the integrity loss of the microorganism’s cell wall, leading to cell death [1,2,3]. In the 1960s, Unilever scientists (Sale and Hamilton) [4,5] defined the major factors that lead to cell death, which include current density, energy input, electric field intensity, pulse width and microbial morphology. The PEF pasteurization of milk and liquid egg has been extensively studied and demonstrated in the literature [6,7,8,9,10,11,12,13,14,15,16,17] where the technology was considered a complement to, or even a replacement to conventional thermal pasteurization [1]. However, the PEF pasteurization of sport formulations and protein-fortified beverages, such as the one used in this study, has not been investigated thoroughly. This technology has also been reported to cause protein conformational changes in different media [18,19,20,21]. A recent review by Vanga et al. (2021) on the effect of PEF on proteins and enzymes showed no changes or effects in the secondary and tertiary structures of proteins in many food products, depending on the intensity of the PEF process, type of beverage matrix and properties of the protein itself present in the beverage [22]. In addition, these changes can also cause physio-chemical and functional property changes (e.g., aggregation, gelation) [22].
This study investigated different PEF treatment conditions (electric field intensities, frequencies and beverage flow rates) for the inactivation of Escherichia coli in a high-protein sport beverage. E. coli (namely the shiga toxin-producing strain) was chosen by an analogy of raw milk hazards, as this pathogen has been recommended by the European Food Safety Authority (EFSA, 2022) and used as a reference for the design of safe pasteurization processes, both thermal and non-thermal (e.g., high-pressure processing and PEFs) pasteurization [23]. A comparison of PEF and thermal treatments in terms of microbial inactivation was carried out. The optimum PEF treatment conditions for the inactivation of the targeted microbe (E. coli) that caused minimal denaturation to the proteins present in this fortified beverage were also determined. Lastly, the effect of PEF and conventional thermal treatments on the denaturation of the whey protein solution and surface free-sulfhydryl groups in whey-protein-isolate solutions were investigated, as these were the two major proteins of this beverage.

2. Materials and Methods

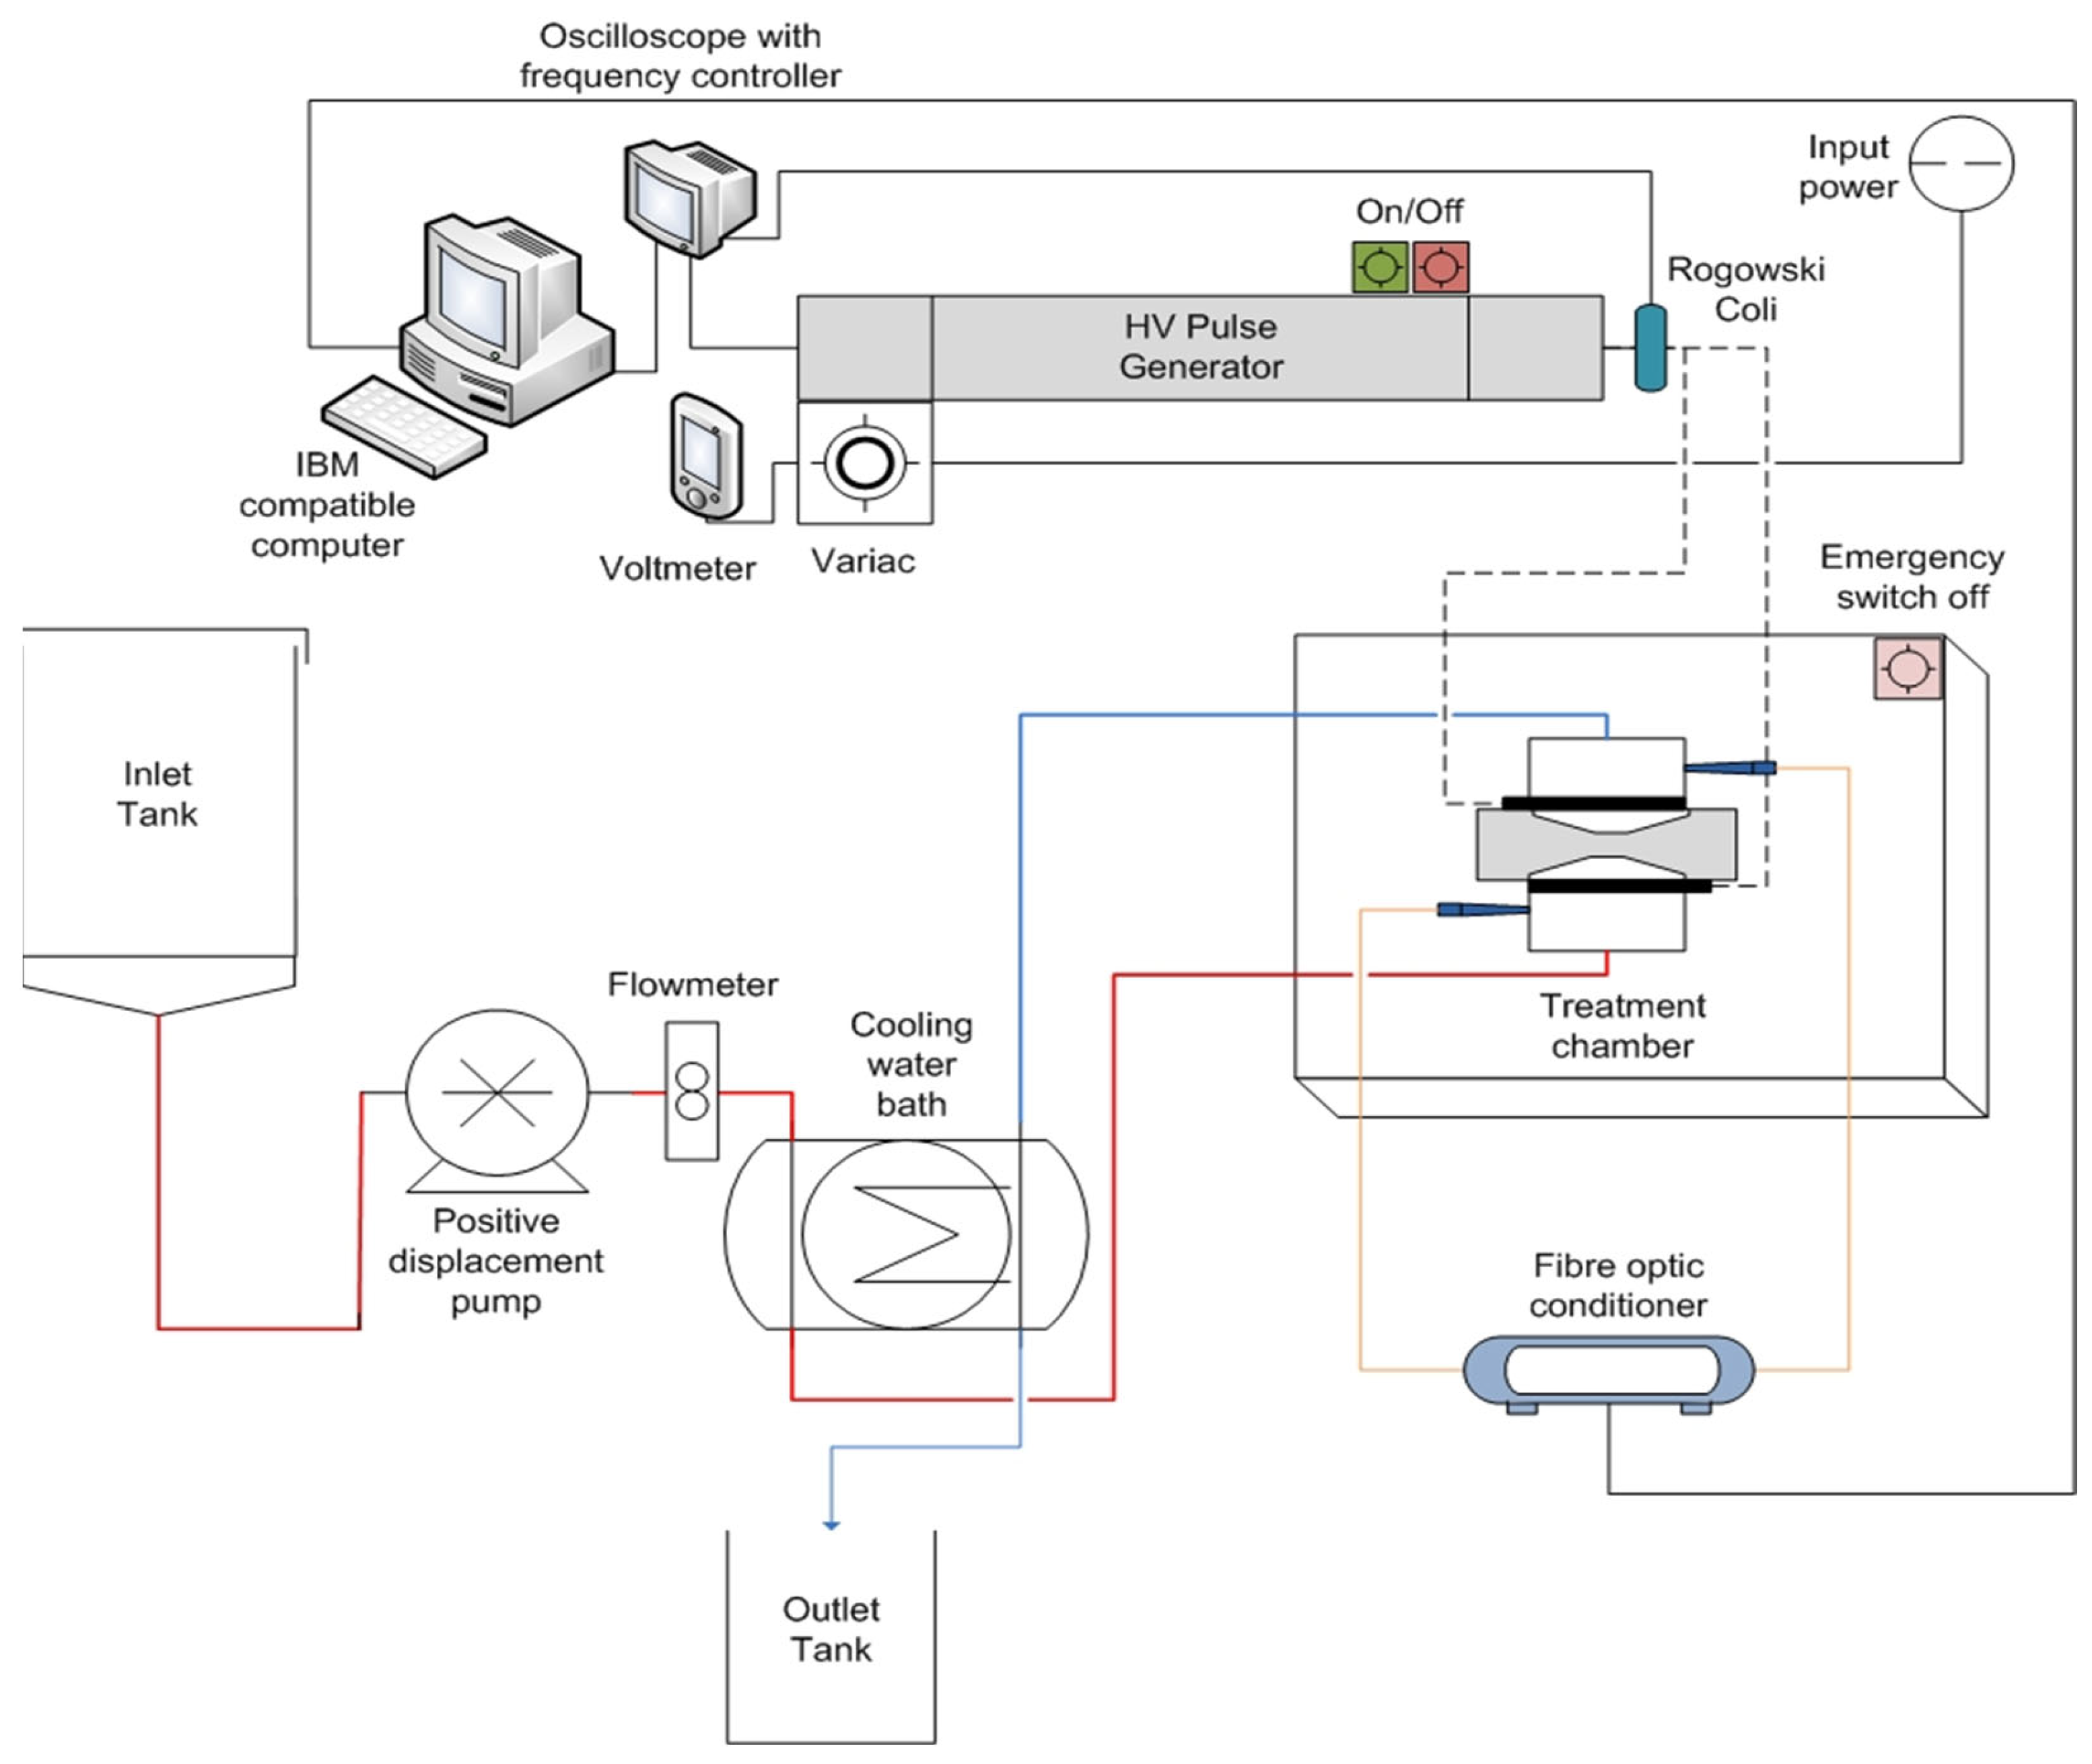
2.1. Pulsed Electric Fields Equipment

A continuous laboratory-scale PEF system designed and constructed at the University of Auckland [24] was used in this study as illustrated in Figure 1. The system includes a high-voltage pulse generator, continuous treatment chamber, data acquisition systems, fluid handling system, voltage and current devices, and cooling system. The design of the unit yields high efficiency in terms of microbial inactivation and energy saving [25].

2.1.1. Pulse Generator

The pulse generator was constructed and designated by H. F. Power Ltd. (Auckland, New Zealand). This generator has the ability to provide a high voltage of up to 30 kV, as well as square bipolar pulses (Figure 2) with a duration of 1.5 μs and frequencies up to 1 kHz. The application of bipolar pulses can minimize the ohmic heating and cause further stress on the microbial cell wall, which enhances the electrical breakdown (cell death). Further, better energy utilization, reduction in the deposition of solids on the electrode surface, food electrolysis and corrosion was minimized when using the square bipolar pulse waveform [24].

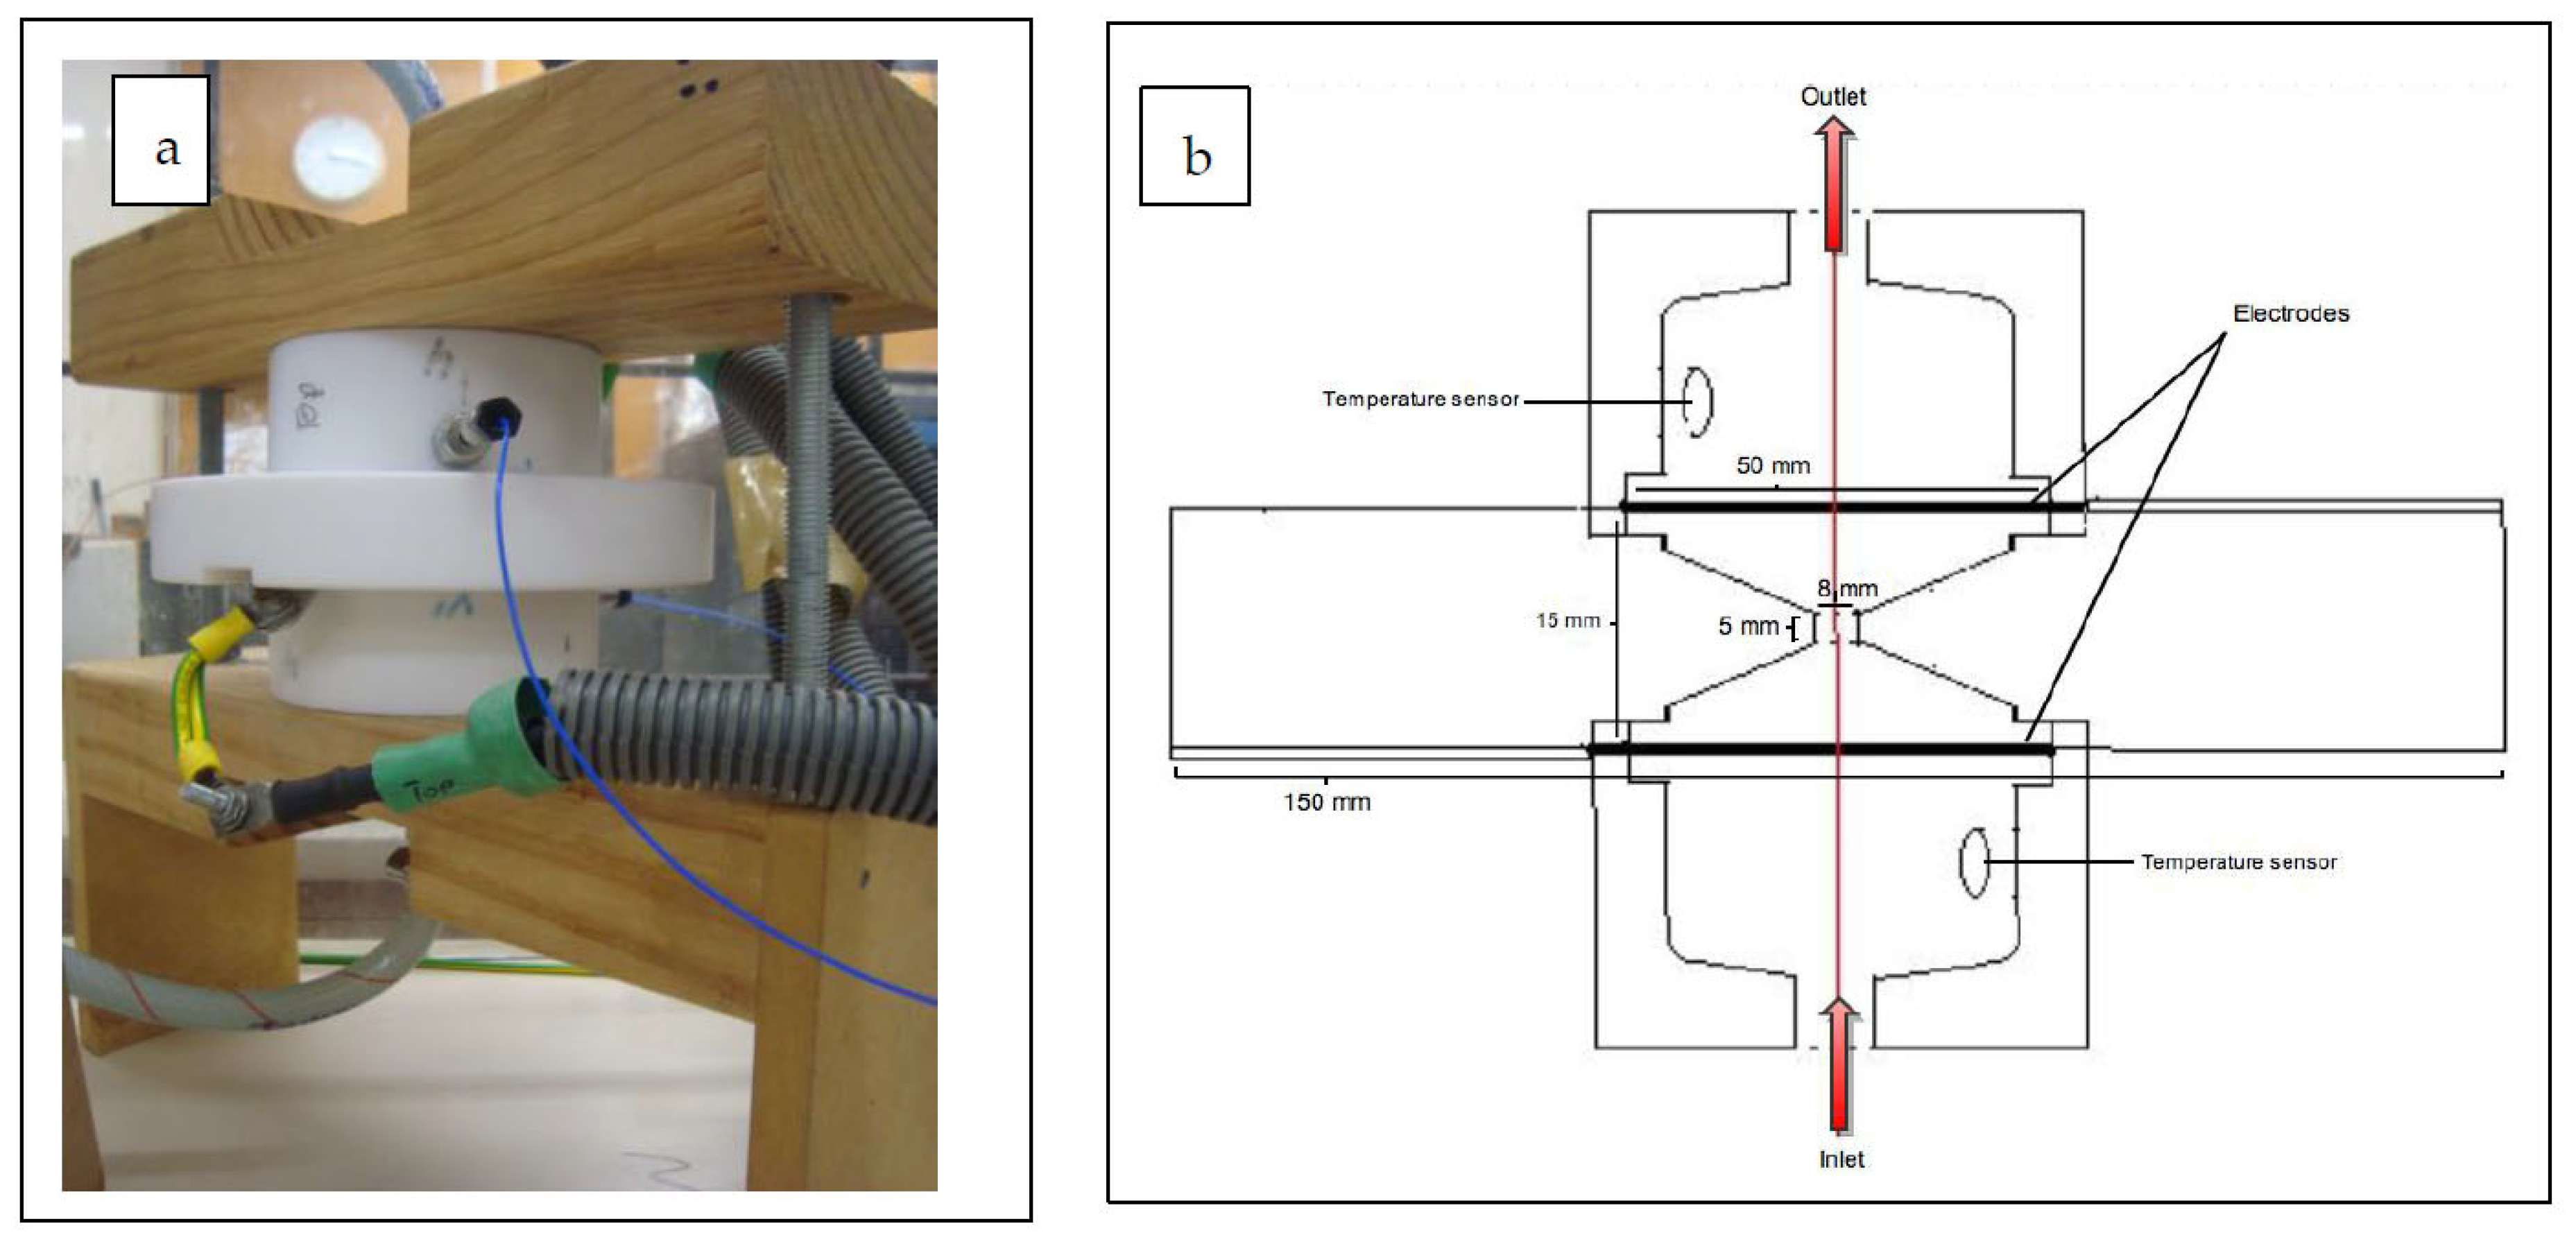
2.1.2. Treatment Chamber

The novel treatment chamber (Figure 3a,b) included in the PEF system was designed where high electric field intensities of up to 50 kV/cm can be generated. The treatment chamber consisted of two mesh electrodes made of 316 food grade stainless steel. The diameter of the treatment zone was 8 mm, and the depth was 5 mm. Each electrode diameter was 50 mm, and the distance between electrodes was fixed at 15 mm. The area between the electrode and the treatment chamber was made of insulator material. The fluid flowed through the openings of the mesh electrodes. The two electrodes were electrically isolated from each other by an insulator element, designed to form a small orifice where most of the electric field was concentrated. A dielectric breakdown inside the treatment chamber was prevented by removing the electrodes far from the narrow gap.

2.1.3. Temperature Control and Measurements

The inlet and outlet temperatures were controlled using a water bath from Grant Instruments Ltd. (Cambridge, UK). During treatment, the temperature was monitored using fiber-optic temperature sensors developed by FISO Technologies (Quebec, QC, Canada), which have a rapid response time (<1 ms). The fiber-optic temperature sensors were inserted in the outlet and inlet of the treatment zone as illustrated in (Figure 3).

2.2. PEF and Thermal Inactivation of E. coli Suspended in the Diluted Protein Shake beverage

2.2.1. Protein Beverage Composition and Preparation

The protein beverage (Sculpt—a vanilla flavored protein shake drink—HORLEYS© NZ) used in this study is a beverage formulated as a healthy everyday snack for women that provides energy, high-quality protein and vital minerals. Apart from water, the main ingredients were whey protein concentrate (WPC) and soy protein isolate (SPI). Thickeners, inulin, natural flavor (vanilla), minerals and vitamins, Aquamin® (calcium mineral complex), Carnipure™ (L-carnitine L-tartrate) and sweeteners (sucralose, steviol glycosides) are other ingredients used to produce this beverage so that each 250 mL pack provides essential macro- and micronutrients. (Table 1) shows the nutritional value of 100 mL serve of the beverage.
The UHT-treated protein shake beverage was diluted with distilled sterilized water to a concentration of 70% (v/v). This dilution was made so that the pumping of the liquid was smoother, and to avoid any significant increment in the outlet temperature with PEF treatment by reducing the ionic strength of the solution. The electrical conductivity of the diluted beverage (70% v/v) used in the experiments was 4.41 mS and pH 6.7. The electrical conductivity was measured using the electrical conductivity radiometer (model CDM206) and meter lab.

2.2.2. Microbial Cultivation and Enumeration

E. coli ATCC 25922 cultures was obtained in a slant from Fort Richard Lab Ltd. (Auckland, New Zealand). The culture was cultivated following the method described by Pothakamury et al. (1995) [26] and Alkhafaji (2006) [24]. The procedure was conducted by growing it in a 150 mL tryptic soy broth with continuous agitation in a temperature-controlled shaker (New Brunswick Scientific, Hertfordshire, UK) at 37 °C ± 0.1 for 18 h to obtain a culture in the early stationary phase (initial cell concentration 6 × 10 8   cfu / mL ± 1 ) . The fresh grown culture was then centrifuged at 5000 rpm at 4 °C for 10 min, and then was washed and centrifuged twice with sterilized distilled water.
One loop (one smear taken from the culture using an inoculation loop/microstreaker) of freshly grown and washed cells was then re-suspended in 50 mL of the diluted protein shake beverage, mixed using a vortex, and left for five minutes at 4 °C for serial dilutions. The BacTracTM microbial analyzer was used for the microbial count, based on impedance analyses. The microbial metabolism utilizes nutrients and produces lower molecular compounds, which alter the conductivity of the liquid nutrients. This change can be technically measured using two electrodes placed in the nutrient solution. When an electrical AC voltage is applied to the electrodes, the reduction in the solution impedance in the AC current field can then be measured. The calibration curve of the microbial analyzer was generated according to the procedure previously described by Alkhafaji (2006) [24]. One milliliter of the original inoculum and each dilution tube was transferred into duplicate 3M Petrifilms™ for a viable count and into BacTrac pre-filled (9 mL) vials for the electrical measurement of the detection time. The original detection time was recorded for duplicate samples and the average was calculated. The number of log microbes was then obtained from the corresponding averaged duplicate 3M Petrifilms™ count as the reference method. The calibration curve is illustrated in Figure 4.

2.2.3. Thermal Inactivation Experiments

The thermal treatment of the diluted protein shake beverage inoculated with E. coli was performed using four different treatment temperatures of 45, 50, 53 and 55 °C for various interval times, in the range of 0.8–60 min. The selected inactivation temperatures were achieved using a temperature-controlled water bath (Grant Instruments Ltd, Cambridgeshire, UK). For each temperature and treatment time, 1 mL of the E. coli-contaminated protein shake beverage was transferred into duplicate sterilized glass tubes with internal diameters of 5 mm (come up time of 40 s). The samples’ temperature was monitored using thermocouple fibers. For each temperature–time-processing condition, the duplicate samples were then instantly removed—after the treatment—to an ice bath to avoid further inactivation. E. coli was enumerated as described in the previous section and the inactivation results for each treatment condition were expressed as the average log reductions in the two replicate samples.

2.2.4. PEF Inactivation Experiments

Experimental investigations were carried out to study the effect of different PEF-processing conditions on the inactivation of E. coli suspended in a diluted protein functional beverage. In all experiments, the contaminated beverage’s inlet temperature was fixed at 10 °C ± 0.5, the outlet temperature did not reach the lethal temperature of the targeted microbe (45 °C for E. coli) and the dissipated power was maintained below 0.7 kJ/s.
A total of 2 L of the diluted protein functional beverage was placed in the feed tank and pumped using a piston pump (Fluid Metering Inc, New Zealand) through the PEF system. The generator was then started, the voltage was set to a pre-selected value, and the contaminated medium received the electrical pulses at the treatment zone inside the treatment chamber. The outlet temperature was monitored at all times to ensure non-thermal application. The product circulation time was recorded to be 49 s and 45 s according to a flow rate of 9.17 and 12.01 mL/s, respectively. A sample was then collected in sterilized tubes after the application of the electric pulses and the outlet temperature was recorded. The collected samples were immediately transferred to an ice water bath (0–4 °C) to avoid cell wall repair after the PEF treatment. After each experiment, the unit was cleaned using a detergent solution of 2% w/v caustic soda (NaOH), dissolved in distilled water and circulated at 65–80 °C. This detergent dissolves fats and protein-based deposits. The whole system was then rinsed with distilled water to wash all the caustic soda residues. Then, the unit was disinfected using disinfectant solution Vircon™ (1% w/v) in distilled sterilized water and rinsed again by sterilized water.
In order to estimate the proper processing conditions for the inactivation of E. coli suspended in the diluted protein shake beverage, different process parameters were examined. The effect of PEF processing on E. coli at different frequencies (600, 700, 800 and 900 Hz) was studied for an electric field intensity fixed at 25 kV/cm. The flow of the beverage was initially set at 9.17 mL/s. The same treatment procedures were repeated using a 12.01 mL/s flow rate. The outlet temperature was recorded at each condition.
The effect of different electric field intensities (25, 35 and 40 kV/cm) on E. coli population was also examined. The experiment was conducted at two frequencies (400 and 500 Hz) and at a flow rate of 12.01 mL/s. For all E. coli inactivation experiments in this study, sampling was duplicated for different conditions used. E. coli was enumerated as described previously and inactivation results for each treatment condition were expressed as the average log reductions in the two replicate samples.

2.3. PEF and Thermal Processing of Proteins Solutions

2.3.1. Preparation of Whey and Soy Protein Solutions

Whey protein concentrate (WPC) and soy protein isolate (SPI) powders were purchased from a local health store (Red 8 Ltd., Auckland, New Zealand). The whey protein dispersion was prepared by dissolving 400 g of whey protein powder in 1 L of distilled water (0.4 g/mL concentration, pH 6.7). This specific concentration had an electrical conductivity of 3.59 mS. A total of 140 g of SPI powder was suspended in 1 L of distilled water to make up SPI dispersion with a concentration of 0.14 g/mL and an electrical conductivity of 4.3 mS. The SPI and WPC dispersions were stirred frequently until fully suspended. The concentrations of protein in the solutions of whey protein and SPI protein were chosen to be close to the protein concentration of the diluted functional beverage (0.12 g/mL), as well as the electrical conductivity.

2.3.2. Denatured Protein Quantification

The method reported by Sharma et al. (1997) [27] to quantify protein content before and after the PEF treatment was applied. Two milliliters of each of the PEF-treated, heat-treated and control (non-treated) samples were transferred into two centrifuge tubes. Each sample was diluted with 32 mL deionized water to a final concentration of 1 mg/mL bovine serum albumin (BSA), which is an important compound that is usually used for protein analysis. The control, PEF-treated and thermally treated samples (1 mg/mL) were centrifuged at 21 °C using Sigma Centrifuge for 5 min at 1500 rpm. The centrifuged samples were then filtered using Whatman™ No.1 filter to obtain the supernatant, and the precipitate, being the denatured protein, was discarded.
The protein content of the filtered supernatant from the control, PEF-treated and heat-treated (1 mg/mL) samples was determined using the Bradford protein assay [28]. The Bradford assay is based on the instantaneous binding of the Coomassie Brilliant Blue G-250 dye to the arginine and histidine residues, as well as to the aromatic amino acids’ tryptophan, tyrosine and phenylalanine residues. The absorbance was then measured at a wavelength of 595 nm in a UV–Vis spectrophotometer (UV Lambda 35 double-beam spectrophotometer; PerkinElmer Inc., Waltham, MA, USA).
Prior to starting the measurement of the protein content in the samples (control, PEF-treated and heat-treated samples), the BSA standards containing a range of 20–200 μg protein were prepared, and the calibration curve was constructed to obtain the equation of the regression line for the protein concentration calculations.
Five dilutions were then made from the control, PEF-treated and heat-treated duplicate samples (1 mg/mL) to an estimated concentration of 20–200 μg protein per tube in the same volume as the standard. Afterwards, 5 mL of the Bradford reagent was added to each tube and vortexed, and the absorbance was measured at a 595 nm wavelength with a slit width of 2 nm using a UV–Vis spectrophotometer. A reagent blank and a sample blank were also measured to correct the color from the reagent and protein solutions. The percentage of denatured protein (% D) was estimated using the equation adapted from Hollar et al. (1995) [29] in the control, PEF-treated and heat-treated samples:
% D = [(concC − concT)/concC] × 100
where concC is the protein concentration in the control sample and concT is the protein concentration in the sample after treatment. For each thermal- or PEF-processing condition, the % D was expressed as the average ± standard deviation of the two treated samples.

2.3.3. Measurement of Surface Free Sulfhydryls (SHFs) Content in Soy Protein Solution

The method reported by Breveridge et al. (1974) [30] and Li et al. (2007) [31] to measure SHFs in the SPI dispersion was applied in this work. In this method, Ellman‘s reagent (5,5’-dithiobis 2-nitrobenzoic acid) is used to determine the free sulfhydryl groups. The reagent reacts with the free sulfhydryls to yield a mixed disulfide and 2-nitro-5-thiobenzoic acid (TNB). TNB is the colored species produced (light yellow) and has a high molar extinction coefficient (1.36 × 10⁴) in the visible range (at 412 nm wavelength). Ellman‘s reagent was prepared by dissolving 40 mg of 5,5’-dithiobis (2-nitrobenzoic acid) or DTNB from Sigma Chemicals Co. (St. Louis, MO, USA) in 10 mL of methanol. Duplicate samples from the control, PEF-treated and heat-treated SPI dispersion (0.14 g/mL) were diluted with deionized water to a final concentration of 2 mg/mL.
One milliliter of the original SPI concentration of 2 mg/mL from the control, PEF-treated and heat-treated samples was transferred into duplicate tubes, and 5 mL of Tris-Gly buffer (0.086 mol Tris and 0.09 mol/L Gly, pH = 8.0) was added into each of the samples. Afterwards, 40 μL of Ellman‘s reagent prepared earlier was added to the samples for the color reaction. The mixtures were then vortexed and incubated at room temperature for 10 min. Subsequently, the absorbance was measured at 412 nm wavelength and a slit width of 2 nm on a UV–Vis spectrophotometer (PerkinElmer Inc.). Reagent blanks and sample blanks were measured for the correct color from the reagent and the protein samples. The free sulfhydryl’s content was calculated using the following equation [30,31]:
μM SH/g = 73.53 A412 DF/C
where A412 is the absorbance at a 412 nm wavelength, 73.53 is derived from 106/(1.36 × 104), 1.36 × 10⁴ is the molar absorptivity [32] and 106 is the conversion factor from the molar basis to μM/mL basis and from mg to g solids. DF is the dilution factor and C is the concentration in mg solids/mL. For each thermal- or PEF-processing condition, the free sulfhydryls content was expressed as the average ± standard deviation of the two treated samples.

2.3.4. Thermal Processing of Proteins Solutions

Thermal treatment of the WPC and SPI dispersions was conducted using a controlled-temperature water bath at a pasteurization temperature of 71 °C ± 0.5 [33], as this is the temperature used for milk thermal pasteurization. A total of 1 mL of the WPC and SPI dispersion was placed into two duplicated small glass tubes with a 5 mm inside diameter (come up time of 40 s). Then, the glass tubes were submerged in the water bath for a treatment time of 15 s. After, the tubes were removed simultaneously and placed in an ice water bath. The same heat treatment procedures were followed for SPI dispersions.

2.3.5. PEF Processing of Protein Solutions

PEF processing of the WPC and SPI solutions was carried out as follows. One liter of the WPC dispersions at a 10 °C inlet temperature, flowing at 9.17 mL/s, was introduced into the PEF system. WPC dispersion was exposed to 24.6 and 8.3 electric pulses at an electric field intensity of 25 and 40 kV/cm, respectively. The same PEF treatment procedures of WPC dispersions were followed for the treatment of the SPI dispersions. The samples from the treated WPC and SPI dispersions were cooled down in an ice water bath to 2–5 °C. Two replicates for each PEF treatment condition were carried out.

3. Results and Discussion

3.1. PEF and Thermal Inactivation of Escherichia coli Suspended in the Diluted Protein Shake Beverage

3.1.1. Thermal Inactivation

The thermal treatment of the diluted protein shake drink inoculated with E. coli showed that the E. coli culture was not affected at temperatures ≤ 45 °C. In contrast, at higher treatment temperatures (50, 53 and 55 °C), E. coli inactivation was time- and temperature-dependent (Figure 5). The pre-selected temperatures (50, 53 and 55 °C) for the thermal treatment were intentionally selected to substantiate the efficacy of the PEF treatment to inactivate E. coli at lower, sub-lethal temperatures and times. Temperatures of 45 °C are known to be lethal to targeted microorganisms. As the temperature increases, the E. coli cell membrane, and all the proteinaceous compounds within the cell, will consequently undergo a denaturation process that leads to cell death.
The decimal reduction time (D-values) was calculated for the thermal microbial inactivation at different treatment temperatures of the protein shake beverage inoculated with E. coli, and the results were compared to the microbial log reductions achieved by PEF treatments at different field intensities and frequencies. The decimal reduction times (D-values) calculated for each thermal treatment temperature were as follows: 1.86, 0.35 and 0.29 min at 50, 53 and 55 °C, respectively.

3.1.2. PEF Microbial Inactivation

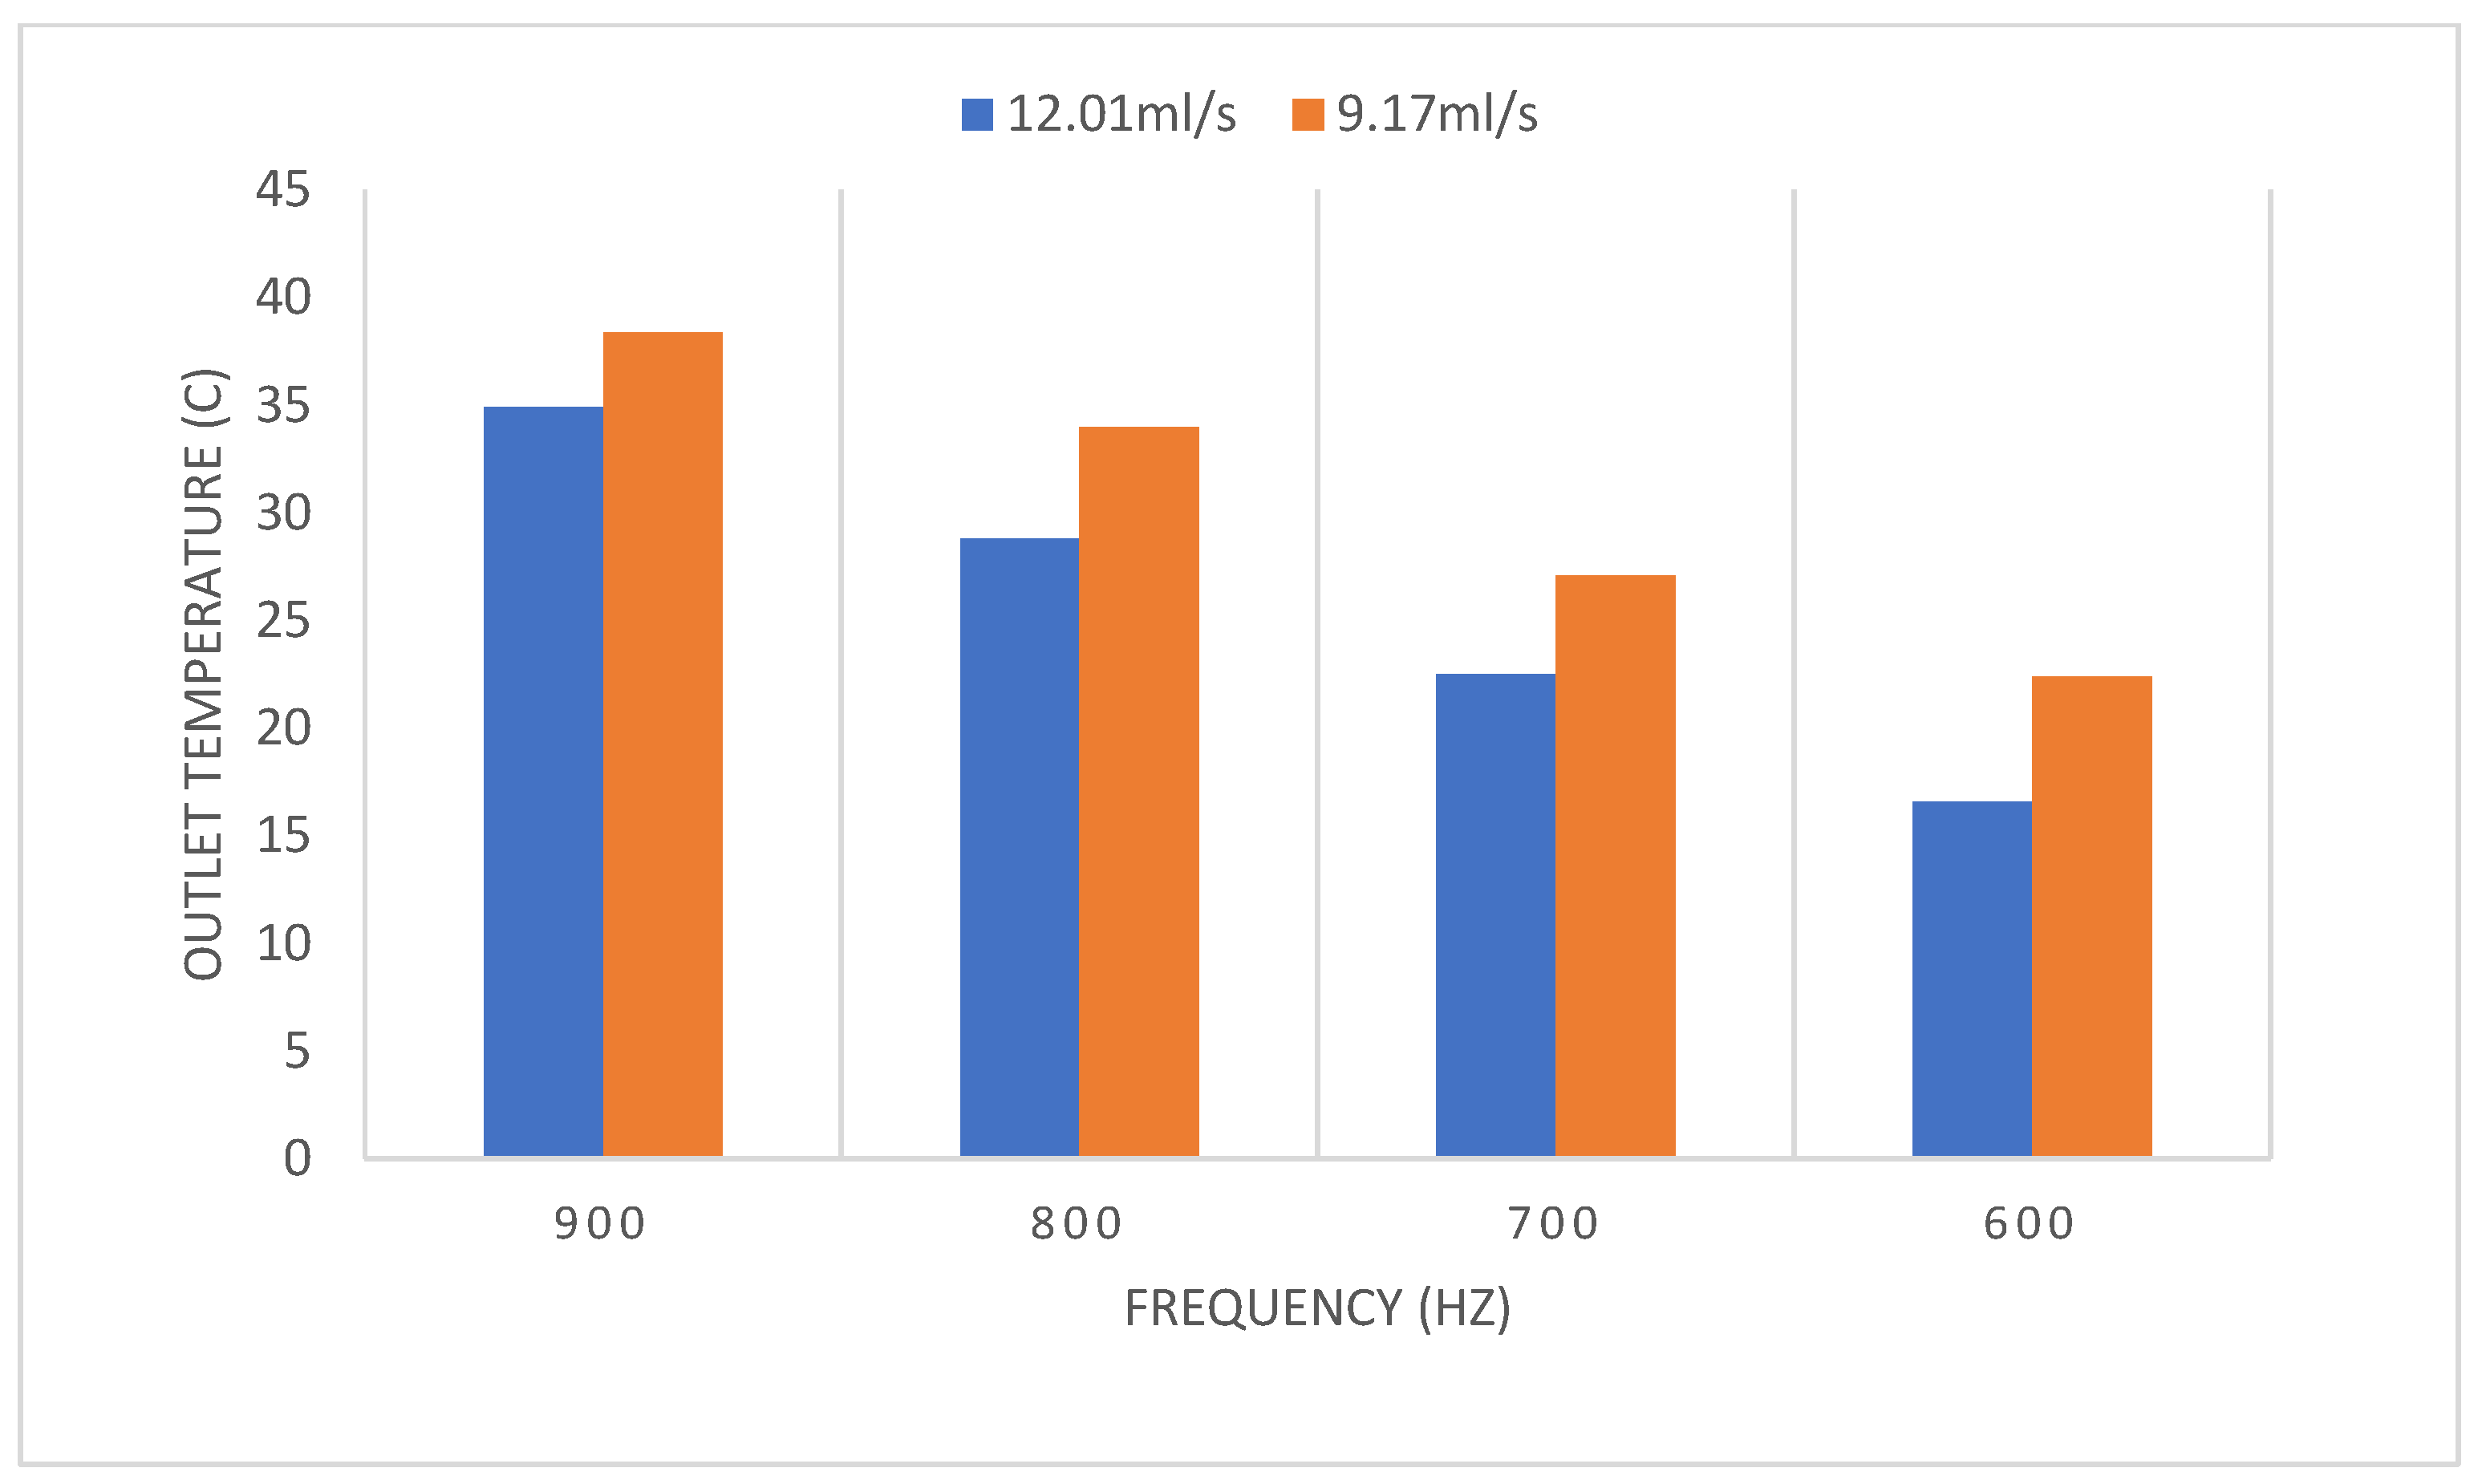
Effect of Treatment Time Using Different Flow Rates and Frequencies

The first set of experiments was conducted to measure the effect of using two different flow rates (9.17 and 12.01 mL/s) at 25 kV/cm on E. coli viable counts. As expected, decreasing the flow rate of the diluted beverage resulted in a higher E. coli inactivation (Figure 6). The highest E. coli reduction rate of 4.2 log was achieved at a higher frequency (900 Hz) and a lower flow rate (9.17 mL/s), corresponding to a treatment time of 37 μs, where the outlet temperature was 38.4 °C. For the flow rate of 12.01 mL/s, the highest E. coli inactivation of 1.9 log was also obtained at 900 Hz, corresponding to a treatment time of 28 μs and a 34.9 °C outlet temperature. These results suggest that lower flow rates are recommended for microbial inactivation experiments due to the higher number of electrical pulses the liquid food receives that enhances microbial inactivation, which is mainly due to a longer residence time inside the treatment zone [34].
The effect of the treatment time on the E. coli population was also examined using flow rates of 9.17 and 12.01 mL/s and at 25 kV/cm and at other different frequencies. At 32 μs (800 Hz frequency), a 2.4 log reduction was achieved. At 28 μs (700 Hz frequency), a 2.2 log reduction was achieved, and a 0.6 log reduction was achieved when using a 26 μs treatment time (600 Hz frequency). Meanwhile, at a 12.01 mL/s flow rate, the treatment times were lower at the same frequencies; subsequently, a lesser E. coli reduction was registered as illustrated in (Figure 6).
These results suggest a direct relationship between the PEF treatment time and the log microbial reduction at a constant electric field intensity. Increasing the treatment time also resulted in more inactivation of the microbial population suspended in the food medium. These results are in agreement with previous studies [1,8,9,35,36,37,38,39,40,41].
The treatment temperature was always maintained below the lethal temperature of the microorganism under investigation, which is illustrated in Figure 7.
One problem associated with lowering the flow of the treated liquid is that the longer it stays inside the treatment zone, the more heat is generated to the liquid food. This leads, to some extent, to a significant increase in the outlet temperature. In addition to what has been reported in the previous section, the concentration of the liquid food also plays a major role in the increase in the outlet temperature as liquid foods with higher concentrations are richer in ionic species, making more currents pass through the food inside the treatment zone, which leads to an increase in the temperature. Thus, an advantage of using higher flow rates is that the liquid food spends less time inside the treatment zone, and the temperature stays within the acceptable range as a cold microbial inactivation treatment.

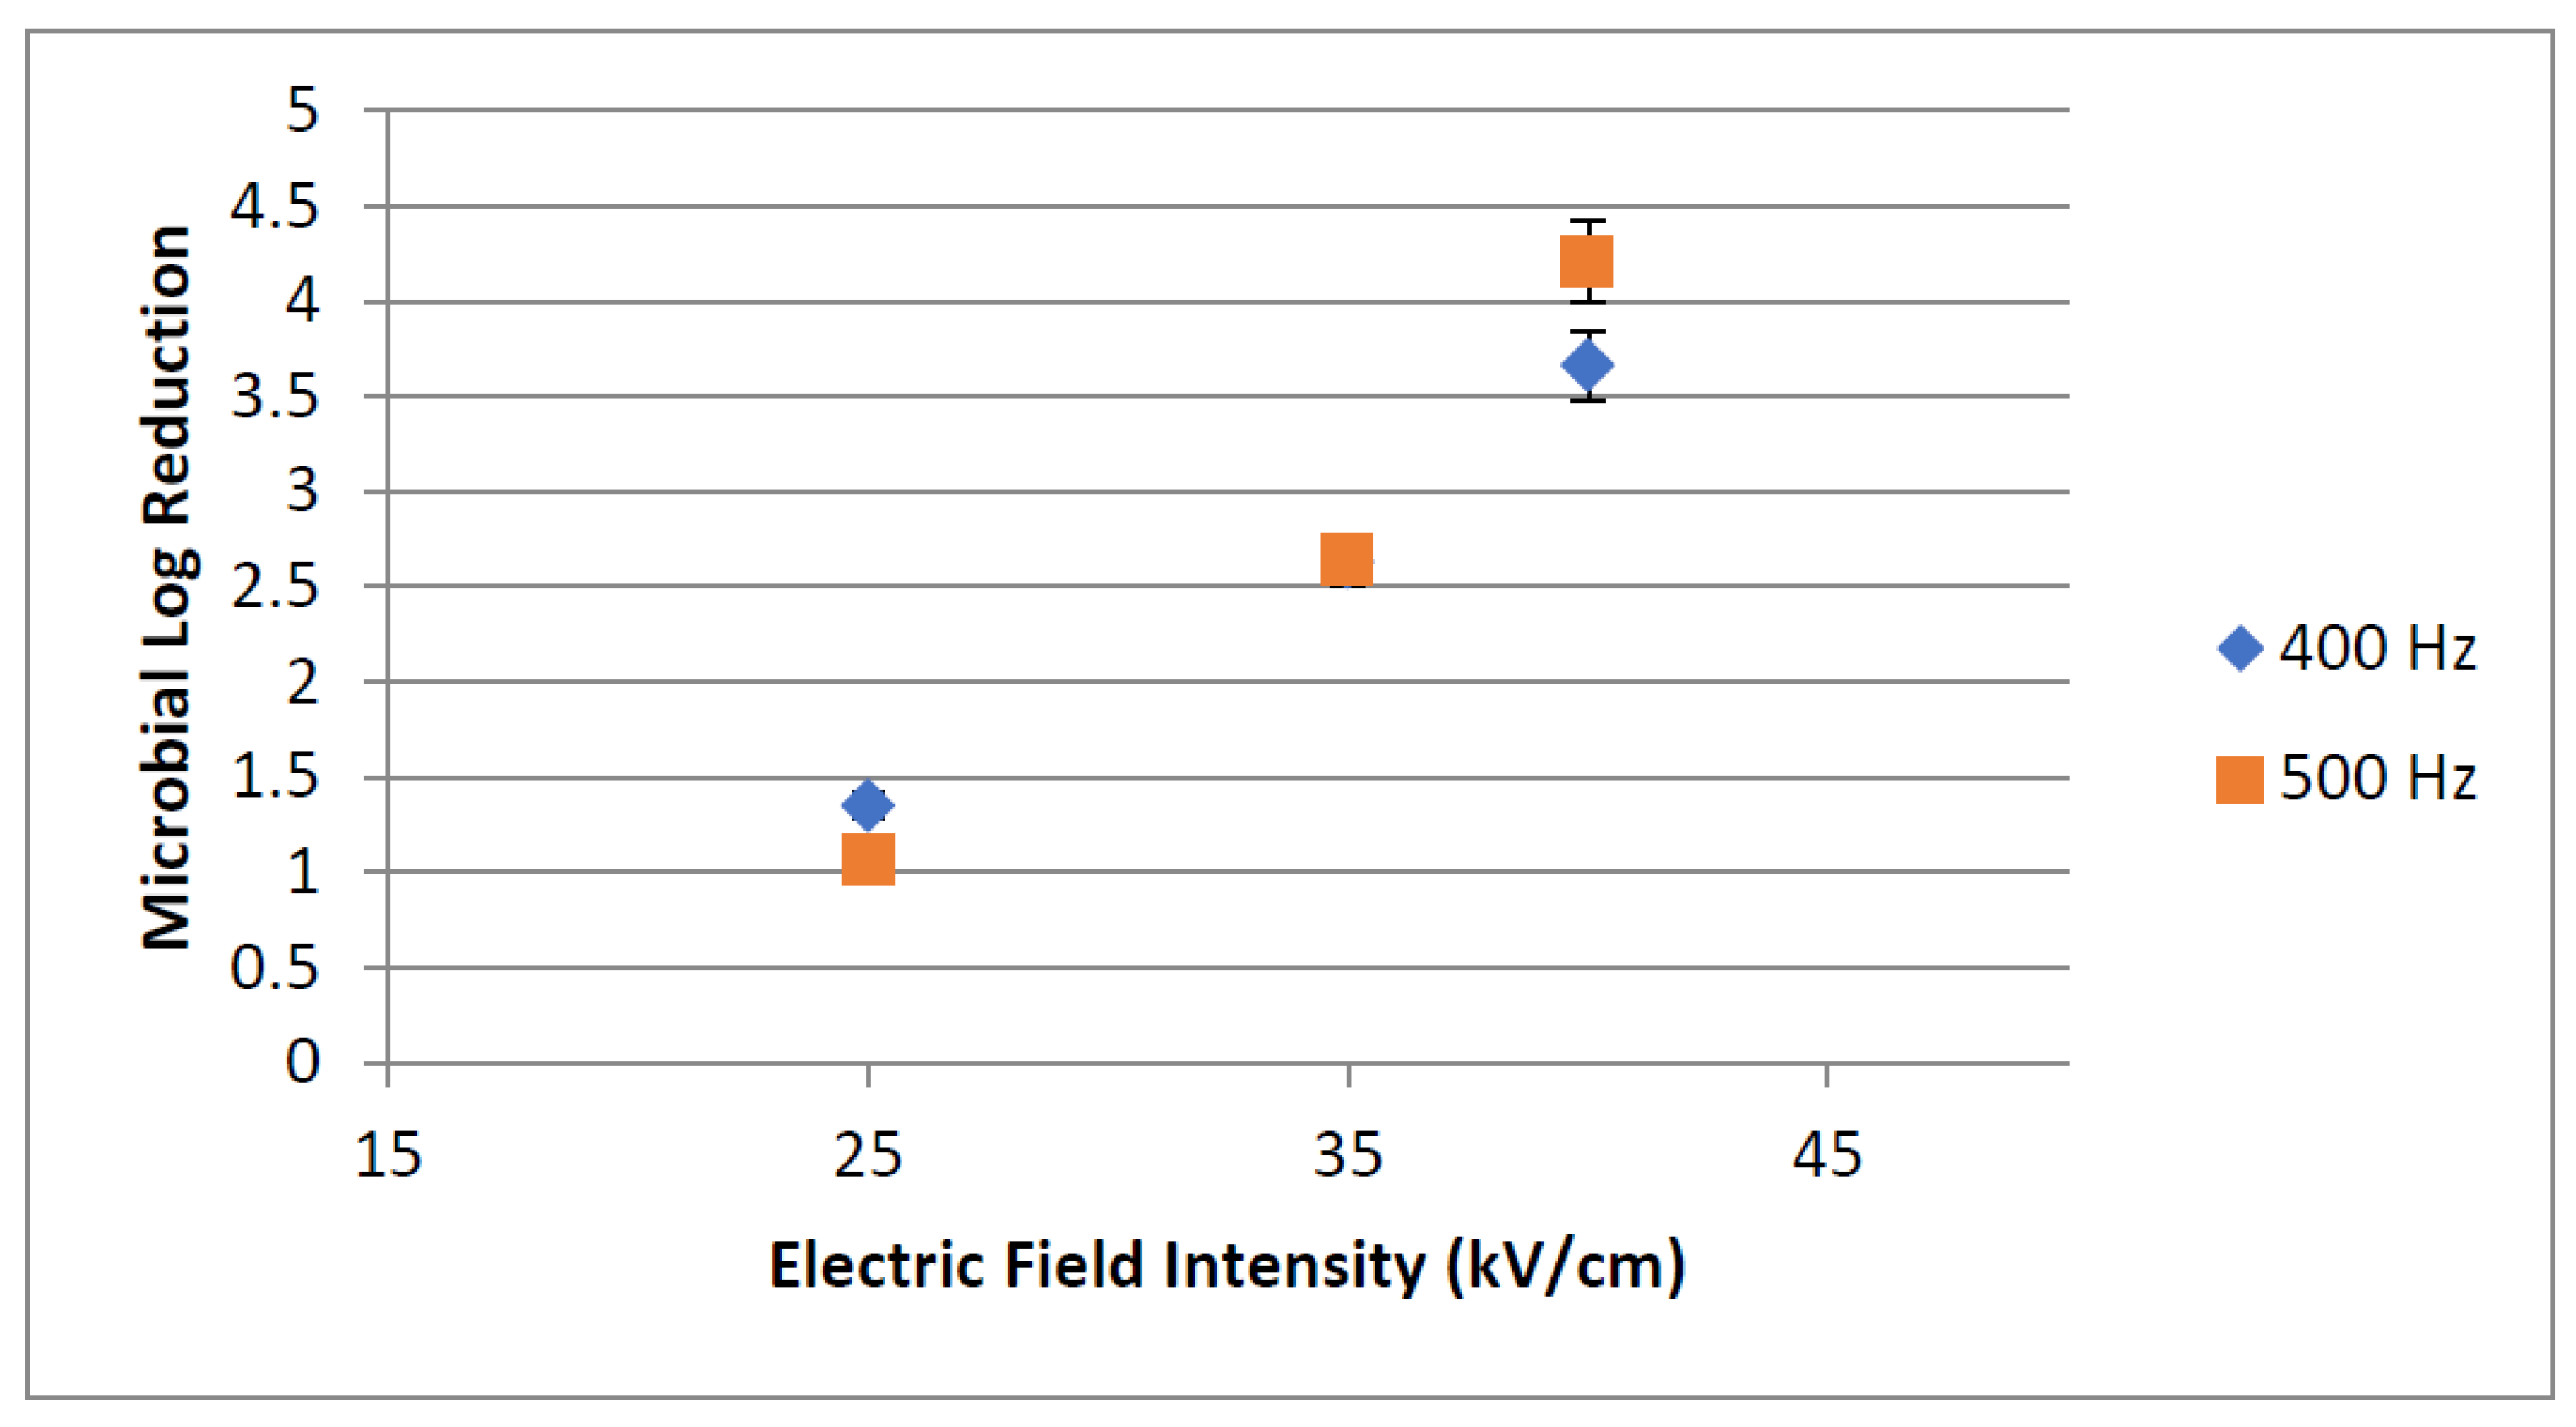
Effect of Electric Field Intensity

Another set of experiments was also conducted at a constant flow rate of 12.01 mL/s to measure the effect of changing the electric field intensity (25, 35 and 40 kV/cm) on the inactivation of E. coli suspended in diluted protein shake beverage. The frequencies used were 400 and 500 Hz, and the reason for choosing these low frequencies in this study was to maintain the temperature below 45 °C when increasing the electric field intensity (Figure 8).
As expected, increasing the electric field intensity increased the microbial inactivation. The highest E. coli reduction was 4.2 log at an electric field intensity of 40 kV/cm, a frequency of 500 Hz and a treatment temperature of 39.2 °C; meanwhile, at the same frequency, a 2.46 and 1.07 log reduction in E. coli was achieved at an electric field intensity of 35 and 25 kV/cm, respectively, when the treatment temperatures were 31.7 and 14.1 °C. Using a frequency of 400 Hz, a 3.66, 2.63 and 1.35 log reduction in E. coli was achieved at field intensities of 40, 35 and 25 kV/cm, respectively.
The result for the 500 Hz frequency using a 40 kV/cm field intensity corresponds to that of using a 900 Hz frequency and a 25 kV/cm field intensity. These results show that a higher microbial inactivation can be achieved, either by increasing the field intensity while keeping the frequency low, or by increasing the frequency and keeping the electric field intensity low. With these conditions, the temperature increase will fall within the acceptable range and will not cause any thermal effect on the microbial inactivation process, making the PEF process a non-thermal process.
When compared to the thermal treatment, 1 log microbial reduction was achieved at 55 °C after 0.29 min (excluding the come-up time of 40 s), while 1.86 min were required for 1 log reduction at 50 °C, as illustrated previously in Figure 5. On the other hand, a PEF treatment of 24.6 pulses, a 25 kV/cm electric field intensity and a 900 Hz frequency reduced the microbial population by 4.2 log in only 37 microseconds (outlet temperature of 34.9 °C). These results demonstrated that PEF treatment is much more effective in terms of microbial inactivation, requiring lower treatment times and temperatures for the same microbial inactivation.
Although many publications have shown the effectiveness of PEFs to inactivate microorganisms, it is hard to compare the results, especially for energy use, due to the wide variety of equipment and experimental procedures and conditions used. The experimental conditions, such as the electric field intensity, number of pulses, as well as the pulse shape, width and processing type should be considered when establishing a fair comparison. The frequency of the PEF treatment pulses was found to be directly proportional to the energy use. The dissipated power use was estimated, using a flow rate of 9.17 and 12.01 mL/s at a frequency of 900 Hz for E. coli inactivation at an electric field intensity of 25 kV/cm, to be 0.556 and 0.441 kJ/sec, respectively. More detailed optimization information on this PEF unit can be found from Alkhafaji S, 2006 [24].

3.2. Protein denaturation

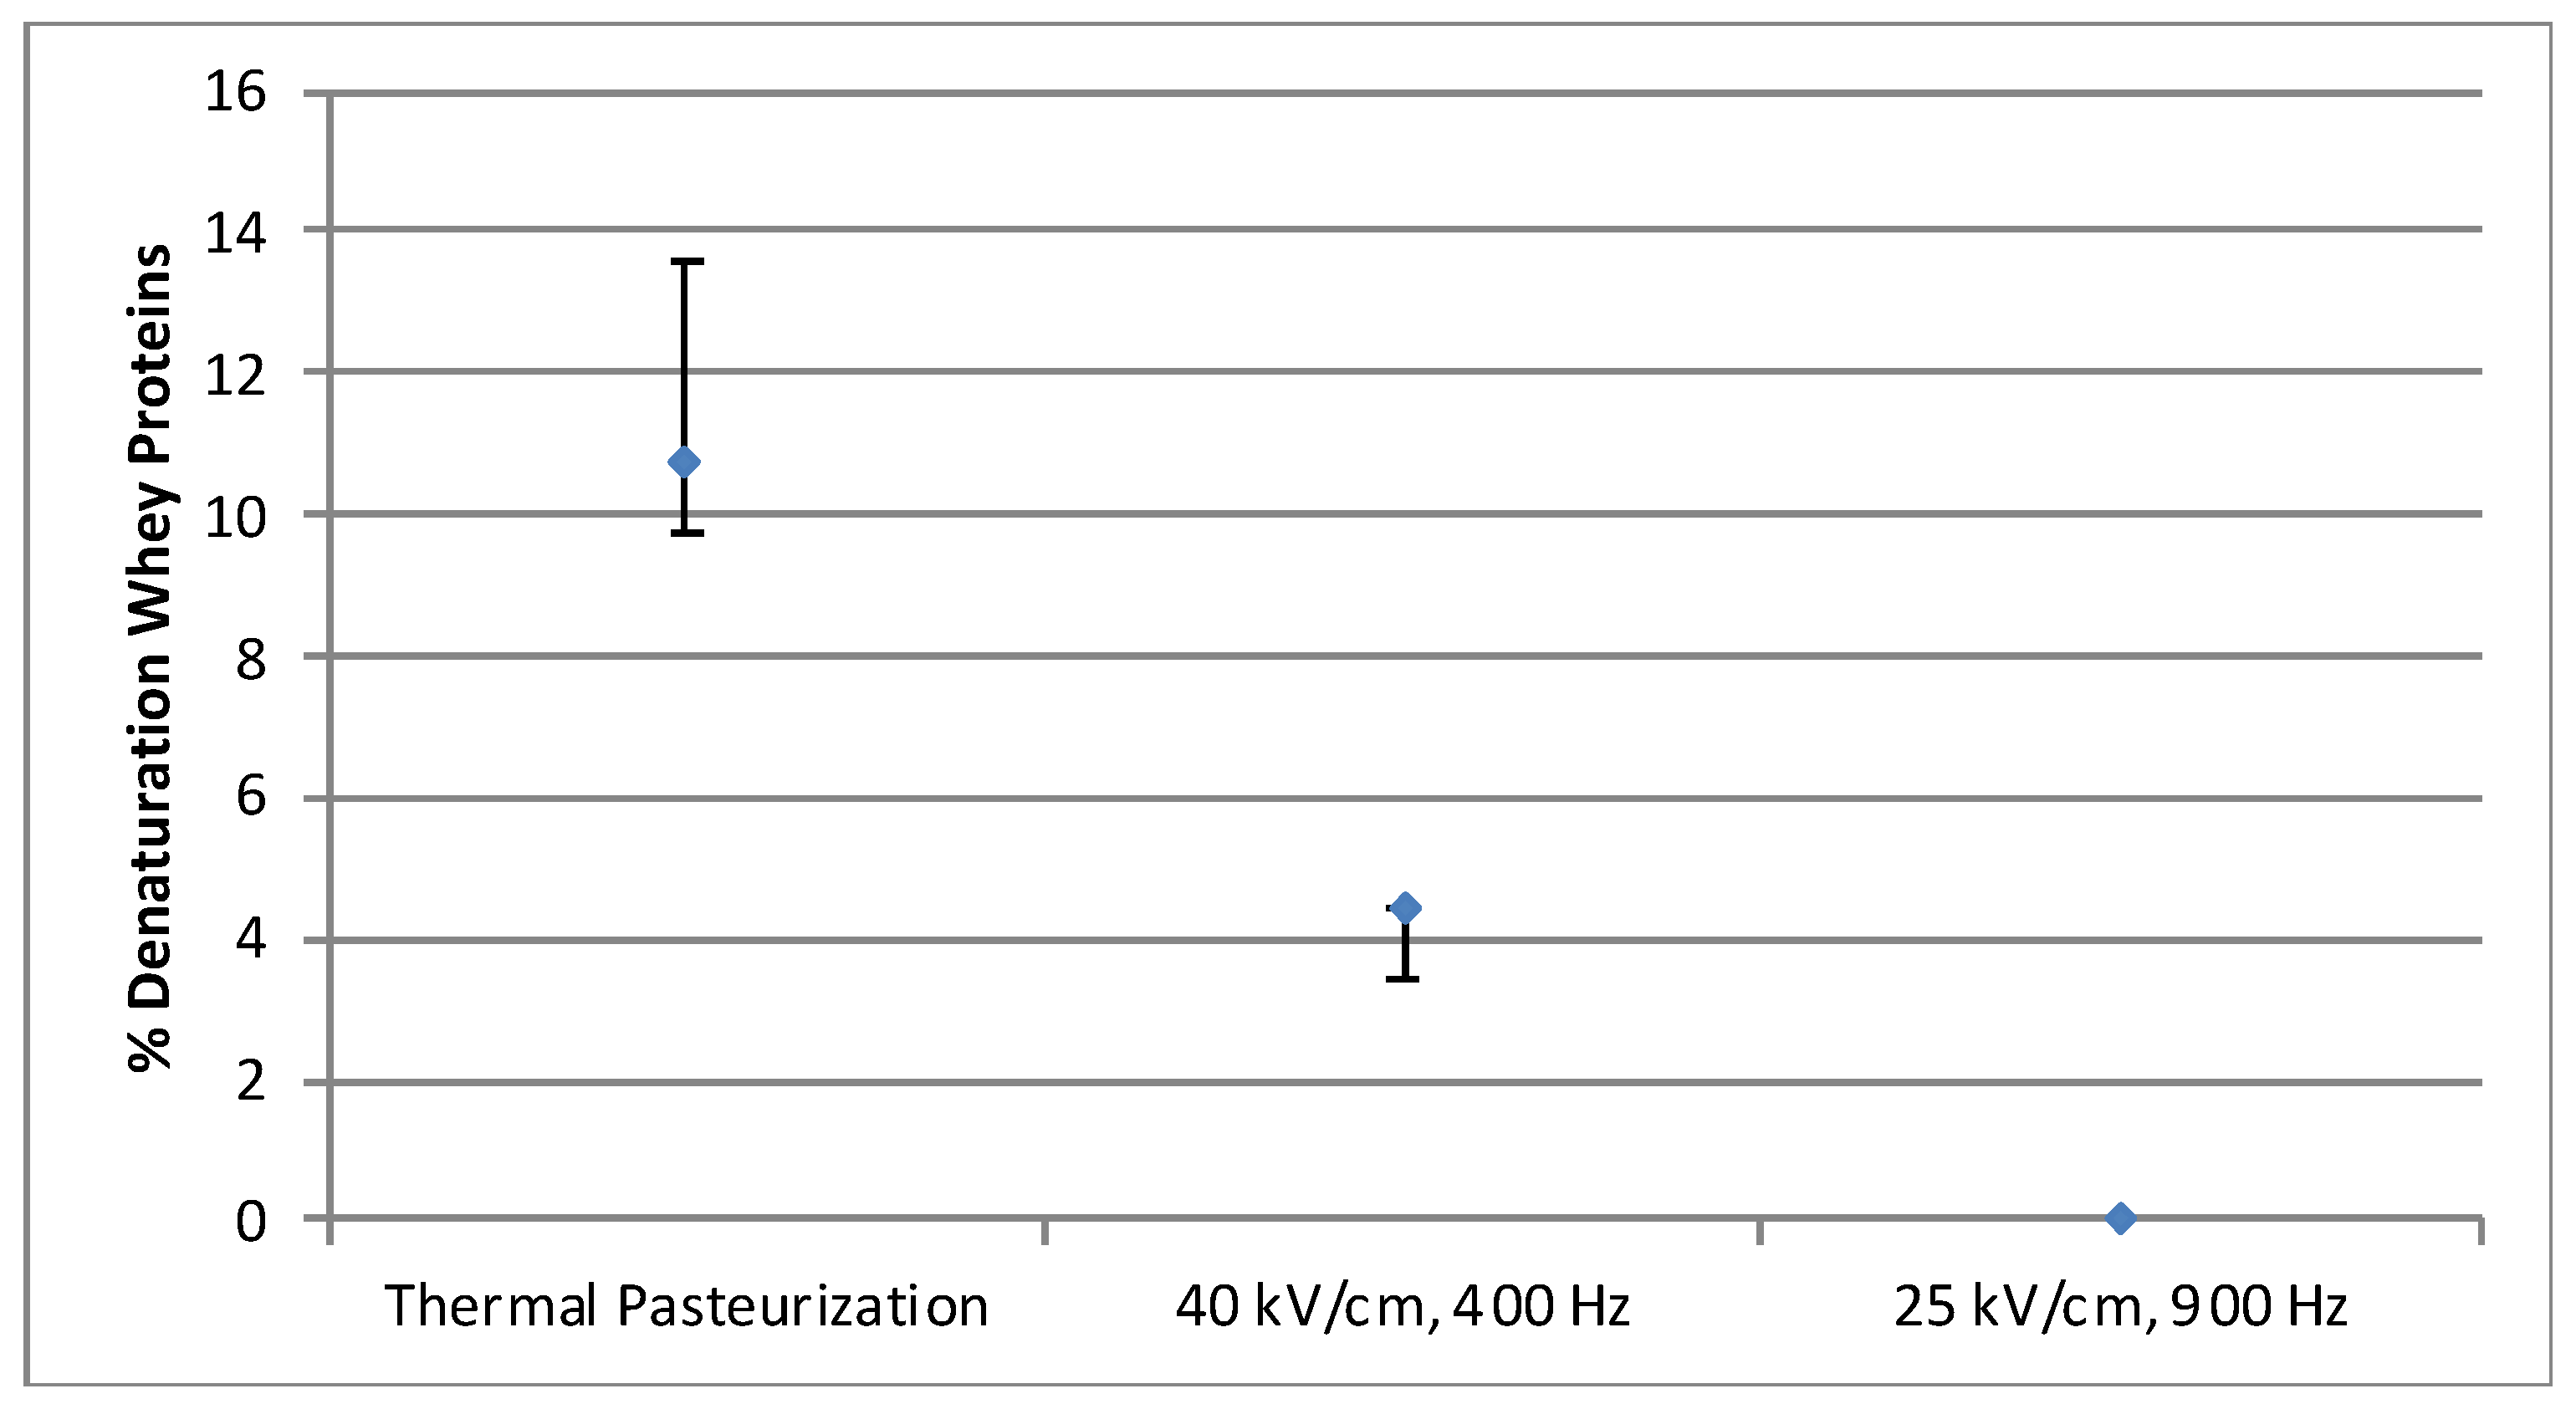
3.2.1. Whey Protein Solution

The PEF treatment with an electric field intensity of 25 kV/cm and 900 Hz, at a constant flow rate of 9.17 mL/s, did not denature the protein (0% denaturation) (Figure 9). In contrast, the PEF treatment at 40 kV/cm and a frequency of 400 Hz at the same flow rate showed 4.41% ± 0.008 denaturation, which is close to the results reported by Sharma et al. (1997) [27] (6% denaturation). The heat treatment using 71 °C ± 0.5 for 15 s caused a negative impact on protein (10.75% ± 1.77 denaturation). The thermal denaturation rate was approximately twice as high than the PEF denaturation at 40 kV/cm (4.41%). The PEF treatment at a flow rate 9.17 mL/s, high frequency (900 Hz) and lower field intensity (25 kV/cm) did not denaturize this protein, which suggests that the frequency (37 μs treatment time) does not significantly affect the protein structure, as opposed to the electric field intensity. The results also demonstrate that the PEF treatment, although it induced protein denaturation, was not as harsh as the heat treatment on the protein structure and caused less denaturation than that observed after the heat treatment. The results obtained in this study are in agreement with the findings of Sharma et al. (1997) and Xiang et al. (2009) [27,42]. A lower denaturation of whey protein by the PEF pasteurization method, compared to the conventional thermal pasteurization, might indicate a higher bioavailability of the whey protein solution and ultimately of the protein drink rich in whey protein.

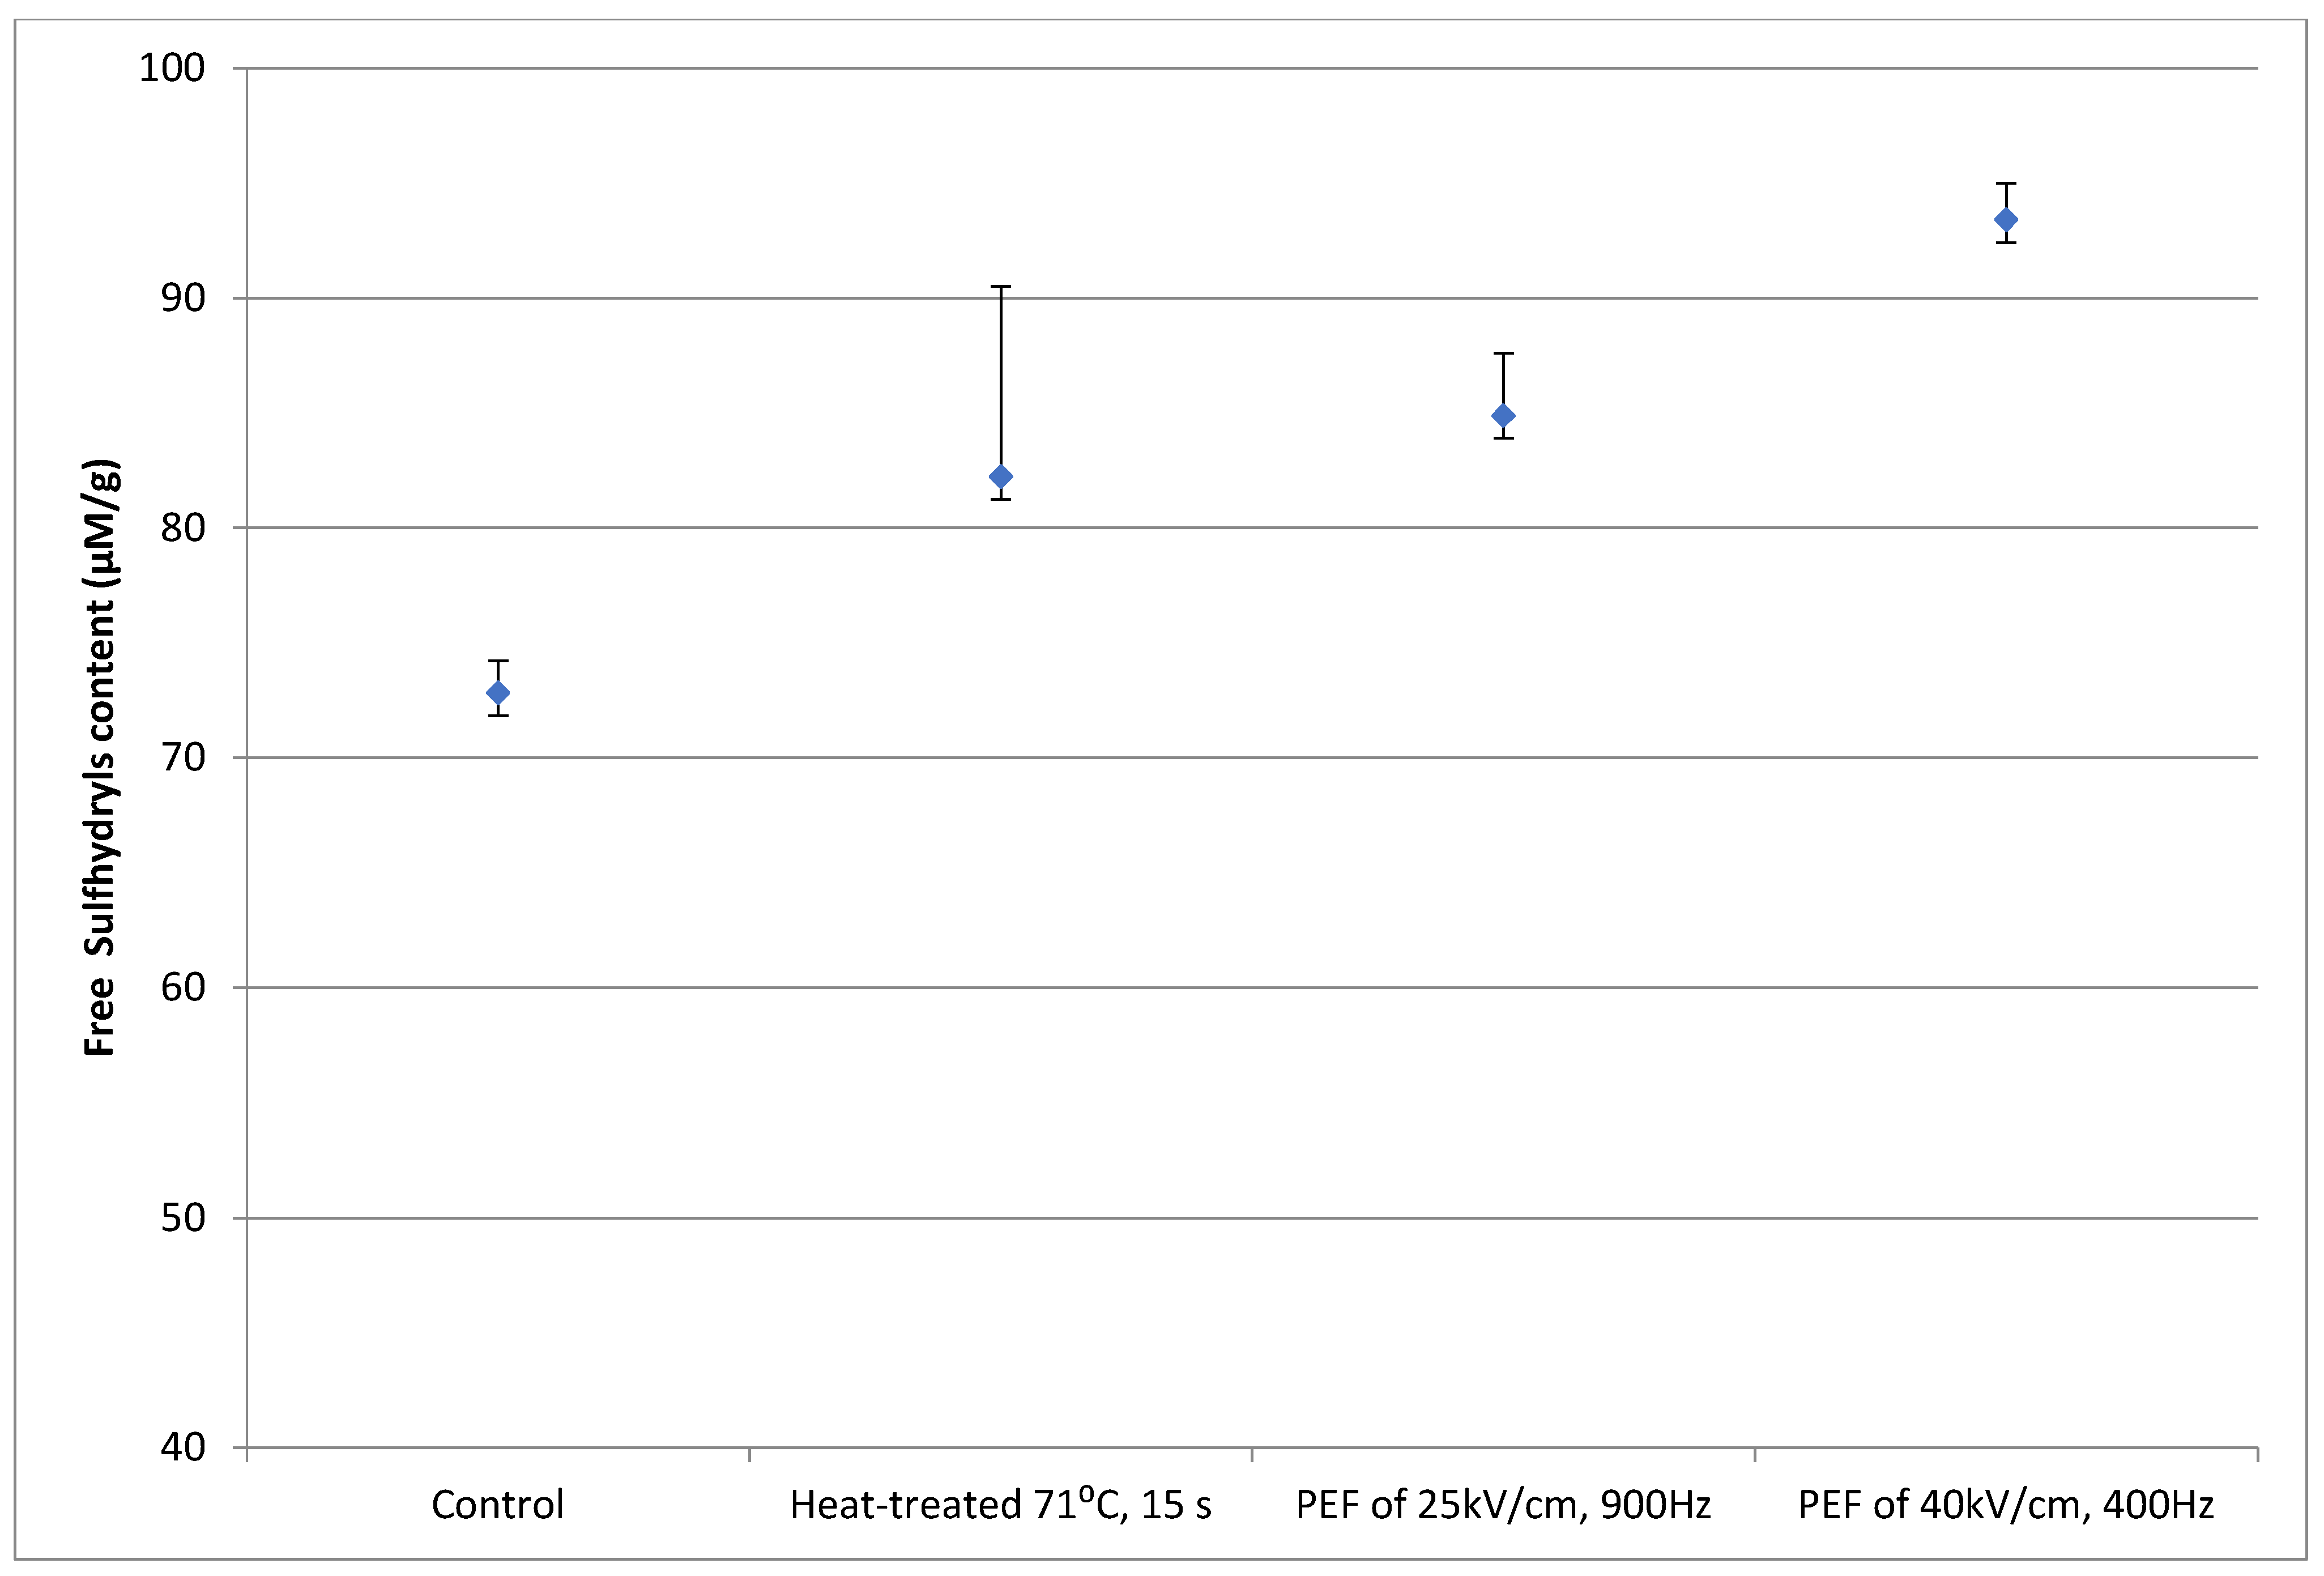
3.2.2. Soy Protein Solution

In this study, PEF processing using a high electric field intensity of 40 kV/cm and a 400 Hz frequency induced the partial unfolding of proteins and exposed the free SH to the surface to form disulphide bridges, denoting protein aggregation (Figure 10). In addition, processing SPI dispersion with 25 kV/cm and 900 Hz also caused protein unfolding (84.9 μM/g SPI ± 2.7) compared to the control SPI sample (72.83 μM/g SPI ± 1.3).
Surprisingly, heat treatment at 71 °C for 15–20 s showed less unfolding (82.23 μM/g SPI ± 8.2) compared to the PEF-treated SPI dispersions, although the PEF treatment outlet temperatures did not reach the protein denaturation temperature (>60 °C). These results suggest that the PEF treatment of soy proteins could lead to protein aggregation, dissociation and denaturation, and cause modification in their structure and functionality. The results obtained from this study are in agreement with the findings reported by Fernandez-Diaz et al. (2000) and Li et al. (2007) [18,31]. The reaction observed of ovalbumin with DTNB after PEF treatment could be due to either the partial unfolding of the proteins or the enhancement of the ionization of SH groups, but the reactivity of SH is reversible.

4. Conclusions

PEF processing of a diluted protein beverage deliberately contaminated with E. coli (ATCC 25922) required less time and a lower treatment temperature than thermal treatment to achieve the same, or even higher, microbial inactivation results. The optimization of the PEF treatment parameters is of great importance to obtaining high-quality food products. This was achieved by controlling the energy input by selecting the optimum process parameters for effective microbial inactivation at the lowest possible treatment temperatures.
PEF-treated WPC, when compared to thermally treated WPC, showed less denaturation in the protein structure, especially when treated with lower field intensities. Soy protein isolates manifested a high sensitivity toward PEF processing and resulted in denaturation and aggregation in the protein structure. More studies should focus on the structural integrity, flow behavior, nutritional value and biological value of the treated food proteins and their effect on the protein bioavailability, health and wellbeing, especially for sport formulas, functional food products/ingredients and infant formulas.

Author Contributions

Conceptualization, S.A.; methodology, S.A. and M.A.; formal analysis, S.A., M.A. and F.V.M.S.; writing—original draft preparation, M.A.; writing—review and editing, S.A. and F.V.M.S.; supervision, S.A. All authors have read and agreed to the published version of the manuscript.

Funding

This research received no external funding.

Conflicts of Interest

The authors declare no conflict of interest.

References

  1. Barbosa-Canovas, G.V.; Sepulveda, D. Present Status and the future of PEF Technology. In Novel Food Processing Technologies; Barbosa-Canovas, G.V., Tapia, M.S., Cano, M.P., Eds.; CRC Press: Boca Raton, FL, USA, 2005; pp. 1–44. [Google Scholar]
  2. Gusbeth, C.; Frey, W.; Volkmann, H.; Schwartz, T.; Bluhm, H. Pulsed electric field treatment for bacteria reduction and its impact on hospital wastewater. Chemosphere 2009, 75, 228–233. [Google Scholar] [CrossRef] [PubMed]
  3. Monfort, S.; Gayán, E.; Saldaña, G.; Puértolas, E.; Condón, S.; Raso, J.; Álvarez, I. Inactivation of Salmonella Typhimurium and Staphylococcus aureus by pulsed electric fields in liquid whole egg. Innov. Food Sci. Emerg. Technol. 2010, 11, 306–313. [Google Scholar] [CrossRef]
  4. Sale, A.; Hamilton, W. Effects of high eletric fields on microorganisms. Lysis of erythrocytes and protoplasts. Biochemica. Biophysica. Acta 1968, 163, 37–43. [Google Scholar] [CrossRef]
  5. Sale, A.; Hamilton, W. Effects of high electric fields on microorganisms: Killing of bacteria and yeast. Biochem. Biophys. Acta 1967, 148, 781–788. [Google Scholar] [CrossRef]
  6. Dunn, J.E.; Pearlman, J.S. Methods and Apparatus for Extending the Shelf Life of Fluid Food Products. U.S. Patent No. 4,695,472, 22 September 1987. [Google Scholar]
  7. Gupta, R.P.; Murray, W. Pulsed High Electric Field Sterilization. In Proceedings of the 7th Pulsed Power Conference, Monterey, CA, USA, 11–14 June 1989; pp. 58–64. [Google Scholar]
  8. Martin-Belloso, O.; Vega-Mercado, H.; Qin, B.L.; Barbosa-Canovas, G.V.; Swanson, B.G. Inactivation of E. coli suspended in liquid egg using pulsed electric fields. J. Food Process. Preserv. 1997, 21, 193–208. [Google Scholar] [CrossRef]
  9. Reina, L.D.; Jin, Z.T.; Zhang, Q.H.; Yousef, A.E. Inactivation of Listeria monocytogenes in milk by pulsed electric field. J. Food Prot. 1998, 61, 1203–1406. [Google Scholar] [CrossRef]
  10. Gongora-Nieto, M.M.; Seignour, L.; Riquet, P.; Davidson, P.M.; Barbosa-Canovas, G.V.; Swanson, B.G. Hurdle Approach for the Inactivation of Pseudomonas Fluorescens in Liquid Whole Egg. In Proceedings of the IFT Annual Meeting, New Orleans, LA, USA, 22–26 June 1996; Insitute of Food Technologists: Chicago, IL, USA, 1999. [Google Scholar]
  11. Gongora-Nieto, M.M.; Seignour, L.; Riquet, P.; Davidson, P.M.; Barbosa-Canovas, G.V.; Swanson, B.G. Nonthermal inactivation of Pseudomonas fluorescens in liquid whole egg. Pulsed Electr. Fields Food Process. Fundam. Asp. Appl. 2001, 193–211. [Google Scholar] [CrossRef]
  12. Calderón-Miranda, M.L.; Barbosa-Cánovas, G.V.; Swanson, B.G. Inactivation of Listeria innocua in liquid whole egg by pulsed electric fields and nisin. Int. J. Food Microbiol. 1999, 51, 7–17. [Google Scholar] [CrossRef]
  13. Fernandez-Molina, J.J.; Barbosa-Canovas, G.V.; Swanson, B.G. Inactivation of Listeria innocua by Combining Pulsed Electric Fields and Acetic Acid In Skim Milk. In Proceedings of the IFT Annual Meeting, New Orleans, LA, USA, 22–26 June 1996; Insitute of Food Technologists: Chicago, IL, USA, 2001. [Google Scholar]
  14. Mañas, P.; Barsotti, L.; Cheftel, J.C. Microbial inactivation by pulsed electric fields in a batch treatment chamber: Effects of some electrical parameters and food constituents. Innov. Food Sci. Emerg. Technol. 2000, 2, 239–249. [Google Scholar] [CrossRef]
  15. Smith, K.; Mittal, G.S.; Griffiths, M.W. Pasteurization of milk using pulsed electrical field and antimicrobials. J. Food Sci. 2002, 67, 2304–2308. [Google Scholar] [CrossRef]
  16. Amiali, M.; Ngadi, M.O.; Smith, J.P.; Raghavan, V.G. Inactivation of Escherichia coli O157: H7 and Salmonella enteritidis in liquid egg white using pulsed electric field. J. Food Sci. 2006, 71, M88–M94. [Google Scholar] [CrossRef]
  17. Vega-Mercado, H.; Gongora-Nieto, M.M.; Barbosa-Canovas, G.V.; Swanson, B.G. Pulsed Electric Field in Food Preservation. In Handbook of Food Preservation; Rahman, M.S., Ed.; CRC Press: Boca Raton, FL, USA, 2007; pp. 783–813. [Google Scholar]
  18. Fernandez-Diaz, M.D.; Barsotti, L.; Dumay, E.; Cheftel, J.C. Effects of pulsed electric fields on ovalbumin solutions and dialyzed egg white. J. Agric. Food Chem. 2000, 48, 2332–2339. [Google Scholar] [CrossRef]
  19. Perez, O.E.; Pilosof, A.M.R. Structure/function modification of B-lactoglobulin and egg white proteins by pulsed electric field. Presented at the IFT Annual Meeting, New Orleans, LA, USA, 22–26 June 1996. [Google Scholar]
  20. Martin-Belloso, O.; Bendicho, S.; Elez-Martinez, P. Does High-Intensity Pulsed Electric Fields Induce Changes in Enzymatic Activity, Protein Conformation, and Vitamin and Flavor Stability. In Novel Food Processing Technologies; Barbosa-Canovas, G.V., Tapia, M.S., Cano, M.P., Eds.; CRC Press: Boca Raton, FL, USA, 2005; pp. 87–104. [Google Scholar]
  21. Mañas, P.; Vercet, A. Effect of PEF on Enzymes and Food Constituents. In Pulsed Electric Fields Technology for the Food Industry: Fundamental and Applications; Raso, J., Heinz, V., Eds.; Springer Science and Business Media: New York, NY, USA, 2006; pp. 131–149. [Google Scholar]
  22. Vanga, S.K.; Wang, J.; Jayaram, S.; Raghavan, V. Effects of Pulsed Electric Fields and Ultrasound Processing on Proteins and Enzymes: A Review. Processes 2021, 9, 722. [Google Scholar] [CrossRef]
  23. EFSA BIOHAZ Panel (EFSA Panel on Biological Hazards); Koutsoumanis, K.; Alvarez-Ordóñez, A.; Bolton, D.; Bover-Cid, S.; Chemaly, M.; Davies, R.; De Cesare, A.; Herman, L.; Hilbert, F.; et al. Scientific Opinion on the efficacy and safety of high-pressure processing of food. EFSA J. 2022, 20, 7128. [Google Scholar]
  24. Alkhafaji, S. An Investigation on the Non-Thermal Pasteurization Using Pulsed Electric Fields. Ph.D. Thesis, The University of Aucklan, Auckland, New Zealand, 2006. [Google Scholar]
  25. Alkhafaji, S.R.; Farid, M. An investigation on pulsed electric fields technology using new treatment chamber design. Innov. Food Sci. Emerg. Technol. 2007, 8, 205–212. [Google Scholar] [CrossRef]
  26. Pothakamury, U.; Monsalve-Gonzalez, A.; Barbosa-Canovas, G.; Swanson, B. Inactivation of Escherichia coli and Staphylococcus aureus in model foods by pulsed electric field technology. Food Res. Int. 1995, 28, 167–171. [Google Scholar] [CrossRef]
  27. Sharma, S.K.; Zhang, Q.H.; Chism, G.W. Development of protein fortified fruit beverage and its quality when processed with pulsed electric field treatment. J. Food Qual. 1997, 21, 459–473. [Google Scholar] [CrossRef]
  28. Bradford, M.M. A rapid and sensitive method for the quantification of microgram quantities of protein utilizing the principle of protein-dye binding. Anal. Chem. 1976, 72, 248–254. [Google Scholar]
  29. Hollar, C.M.; Parris, N.; Hsieh, A.; Cockley, K.D. Factors affecting the denaturation and aggregation of whey proteins in heated whey protein concentrate mixtures. J. Dairy Sci. 1995, 78, 260–267. [Google Scholar] [CrossRef]
  30. Breveridge, T.; Toma, S.J.; Nakai, S. Determination of SH- and SS-groups in some food proteins using Ellman’s reagent. J. Food Sci. 1974, 39, 49–51. [Google Scholar] [CrossRef]
  31. Li, Y.; Chen, Z.; Mo, H. Effects of pulsed electric fields on physiochemical properties of soybean protein isolates. Swiss Soc. Food Sci. Technol. 2007, 40, 1167–1175. [Google Scholar]
  32. Ellman, G.L. Tissue sulfhydryl goups. Arch. Biochem. Biophys. 1959, 82, 70–77. [Google Scholar] [CrossRef]
  33. Lin, M.; Ramaswamy, H.S. Evaluation of Phosphatase Inactivation Kinetics in Milk Under Continuous Flow Microwave and Conventional Heating Conditions. Int. J. Food Prop. 2011, 14, 110–123. [Google Scholar] [CrossRef]
  34. Jeantet, R.; Baron, F.; Nau, F.; Roignant, M.; Brule, G. High intensity pulsed electric fields applied to egg white: Effect on Salmonella enteritidis inactivation and protein denaturation. J. Food Prot. 1999, 62, 1381–1386. [Google Scholar] [CrossRef] [PubMed]
  35. Hulsheger, H.; Pottel, J.; Niemann, E. Killing of bacteria with electric pulses of high field strength. Radiat. Environ. Biophys. 1981, 20, 53–65. [Google Scholar] [CrossRef]
  36. Mizuno, A.; Hori, Y. Destruction of living cells by pulsed high-voltage application. IEEE Trans. Ind. Gen. Appl. 1988, 24, 387–394. [Google Scholar] [CrossRef]
  37. Qin, B.L.; Pothakamury, U.R.; Vega-Mercado, H.; Martin-Belloso, O.M.; Barbosa-Canovas, G.V.; Swanson, B.G. Food pasteurization using high-intensity pulsed electric field. Food Technol. 1995, 12, 55–60. [Google Scholar]
  38. Grahl, T.; Markl, H. Killing of microorganisms by pulsed electric fields. Appl. Microbiol. Biotechnol. 1996, 45, 148–157. [Google Scholar] [CrossRef]
  39. Pothakamury, U.; Vega, H.; Zhang, Q.; Barbosa-Canovas, G.; Swanson, B. Effect of growth stage and processing temperature on the inactivation of Escherichia coli by pulsed electric fields. J. Food Prot. 1996, 59, 1167–1171. [Google Scholar] [CrossRef]
  40. Sensoy, I.; Zhang, Q.; Sastry, S. Inactivation kinetics of Salmonella dublin by pulsed electric field. J. Food Process. Eng. 1997, 20, 367–381. [Google Scholar] [CrossRef]
  41. Heinz, V.; Phillips, S.T.; Zenker, M.; Knorr, D. Inactivation of Bacillus subtilis by high-intensity pulsed electric fields under close to isothermal conditions. J. Food Biotechnol. 1999, 13, 155–168. [Google Scholar] [CrossRef]
  42. Xiang, B.Y.; Sundararajan, S.; Mis Solval, K.; Espinoza-Rodezno, L.; Aryana, K.; Sathivel, S. Effects of pulsed electric fields and thermal pasteurization on physiochemical and quality properties of carrot juice. J. Food Qual. 2013, 38, 1556–1564. [Google Scholar]
Figure 1. The pulsed electric field unit [24], located in the Chemical and Materials Engineering Department at the University of Auckland.
Beverages 08 00068 g001
Figure 2. A square bipolar pulse generated at the University of Auckland [24].
Beverages 08 00068 g002
Figure 3. (a) The treatment chamber designed and constructed at the University of Auckland [24,25]. (b) Cross-sectional view of the treatment chamber.
Beverages 08 00068 g003
Figure 4. Calibration of BacTrac equipment for Escherichia coli enumeration in the diluted protein shake beverage.
Beverages 08 00068 g004
Figure 5. The effect of thermal treatment on E. coli suspended in a diluted protein shake drink beverage at different temperatures (data are means of two replicates).
Beverages 08 00068 g005
Figure 6. The effect of different flow rates and frequencies for a field intensity of 25 kV/cm on the E. coli population suspended in diluted protein shake drink.
Beverages 08 00068 g006
Figure 7. The outlet temperatures using different flow rates and frequencies for a field intensity of 25 kV/cm on the E. coli population suspended in diluted protein shake drink.
Beverages 08 00068 g007
Figure 8. The effect of electric field intensity (40, 35 and 25 kV/cm) using two different frequencies (400 and 500 Hz) on the E. coli population suspended in the diluted protein shake beverage using a flow rate of 12.01 mL/s.
Beverages 08 00068 g008
Figure 9. Percentage of whey protein denaturation after the pulsed electric field treatment and heat treatment. Mean results of duplicate experiments are presented. Error bars show the standard deviations of the data obtained.
Beverages 08 00068 g009
Figure 10. Free surface sulfhydryl content of soy protein isolates (SPIs) dispersions treated with different PEF conditions and thermally treated at 71 °C for 15–20 s. The results are presented as a mean of duplicate samples, and the numbers above each point represent the standard deviation of each data point.
Beverages 08 00068 g010
Table 1. Nutritional composition of 100 mL of the protein shake beverage used in this study.
Energy570 kJ (136 cal)
Protein17.5 g
Fat total1.1 g
Saturated0.5 g
Carbohydrates total14 g
Sugars12 g
Na223 mg
K558 mg
Ca426 mg
Fiber0.6 g
Publisher’s Note: MDPI stays neutral with regard to jurisdictional claims in published maps and institutional affiliations.

