Article

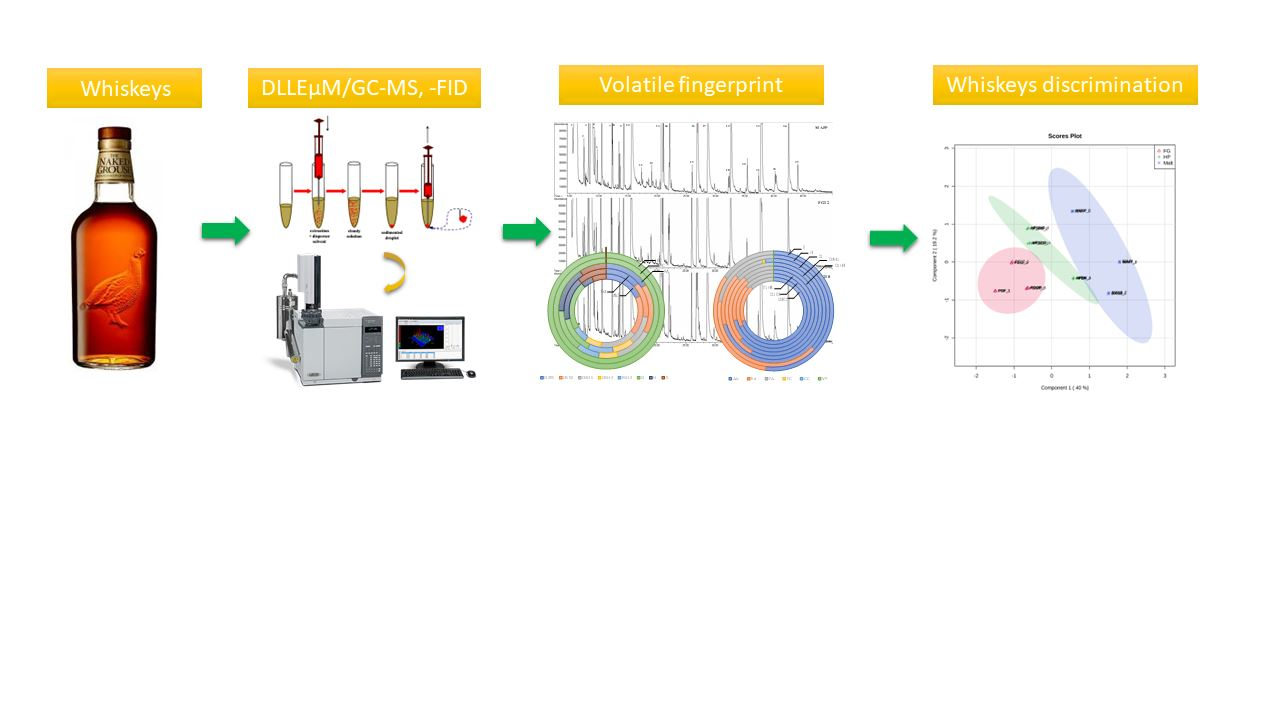
DLLμE/GC-MS as a Powerful Analytical Approach to Establish the Volatilomic Composition of Different Whiskeys

by
Rosa Perestrelo
1,
Michael Caldeira
1,
Freddy Rodrigues
1,
Jorge A. M. Pereira
1 and
José S. Câmara
1,2,*
1
CQM—Centro de Química da Madeira, Universidade da Madeira, Campus Universitário da Penteada, 9000-390 Funchal, Portugal
2
Departamento de Química, Faculdade de ciências e Tecnologia da Universidade da Madeira, Universidade da Madeira, Campus Universitário da Penteada, 9000-390 Funchal, Portugal
*
Author to whom correspondence should be addressed.
Beverages 2022, 8(3), 53; https://doi.org/10.3390/beverages8030053
Submission received: 2 August 2022 / Revised: 17 August 2022 / Accepted: 19 August 2022 / Published: 1 September 2022
(This article belongs to the Section Wine, Spirits and Oenological Products)

Abstract

:
The volatilomic fingerprint of nine different whiskeys was established using a rapid and sensitive analytical approach based on dispersive liquid–liquid microextraction (DLLμE) followed by gas chromatography mass spectrometry detection (GC-MS) and gas chromatography with flame ionization detection (GC-FID). The influence of the extractor solvent on the extraction efficiency of volatile compounds (VOCs) was evaluated by DLLμE/GC-MS. The highest amounts of VOCs were obtained using 5 mL of sample, dichloromethane as the extractor solvent, and acetone as the disperser solvent. The proposed method showed no matrix effect, good linearity (R2 ≥ 0.993) in the assessed concentration range, recovery (ranging from 70 to 99%, precision (RSD ≤ 15%) and sensitivity (low limits of detection and quantification). A total of 37 VOCs belonging to different biosynthetic pathways including alcohols, esters, acids, carbonyl compounds, furanic compounds and volatile phenols were identified and quantified using DLLμE/GC-MS and DLLμE/GC-FID, respectively. Alcohols (3-methylbutan-1-ol, propan-1-ol), esters (ethyl decanoate, ethyl octanoate, ethyl hexanoate), and acids (decanoic acid, octanoic acid, hexanoic acid) were the most abundant chemical families. The multivariate statistical analysis allowed for the discrimination of whiskeys based on their volatilomic fingerprint, namely octanoic acid, 2-furfural, ethyl octanoate, ethyl hexanoate, acetic acid, ethyl dodecanoate, butan-1-ol, and ethyl decanoate.

Graphical Abstract

1. Introduction

Whisky is a popular distilled spirit consumed worldwide. It can be produced from different grains such as barley, corn, wheat, or rye, following a sequence of malting, mashing, fermentation, distillation, and maturation procedures [1]. These processes will contribute to the final aroma and flavor, which are among the most important factors defining the organoleptic characteristics of whisky, and consequently their quality and typicity. Such a volatilomic profile spans many compounds, covering a wide range of volatilities and concentrations [2,3,4]. This includes alcohols, esters, acids, carbonyl compounds, and furan compounds, with concentrations ranging from µg/L to mg/L, which, as referred above, are responsible for the characteristic aroma of whiskeys, similar to other distilled beverages [2,5]. Among the different procedures involved in whiskey production, the fermentation process and the wooden barrels in which the spirit are matured are the most important sources of volatile compounds. The fermentation process is led by yeasts that are the most important aroma producers. Fermentable substances such as long-chain fatty acids, organic nitrogen, sulfur compounds, and many other components participate in different biochemical processes, resulting in several volatile compounds (VOCs) as by-products, influencing the organoleptic characteristics of whiskeys [1]. This includes, among others, alcohols, carbonyl compounds, especially aldehydes, esters, and furfural [6]. The contribution of ester to the aromatic complexity, for instance, depends on their concentrations, but usually, when the concentration is higher than their sensory thresholds, there is generally a positive effect on the overall organoleptic characteristics [7]. Despite this, it is impossible to refer to any single aroma compound that is responsible for the typical aroma of the beverage [6,8]. Different fermentation conditions greatly influence the amounts of aroma compounds in distilled beverages, in a process that depends to a great extent on how the distillation is performed. The wood of the barrels is the second most important source of flavor and aroma compounds reported in whiskeys and other distilled beverages [9,10]. This contribution lies in the substances extracted from the wood that will impart characteristic aromas to the whiskeys and such influence will be obviously proportional to the aging time of the spirits in the barrels [9,11,12]. In a recent study, Roullier-Gall et al. provided evidence that the transference of compounds from the wood barrels to the distillates was not linear over time, with the largest migration of compounds occurring around twelve years of maturation [12]. Furthermore, the quality and usage history of the casks also determine the richness of the VOCs that will migrate to the whiskeys [10,13,14]. Regardless of these considerations on the quality of the casks and the type of compounds that will be transferred to the spirits, aging in casks has an additional effect on aroma, which related to the compounds that will be lost by evaporation through the cask wood, reducing their presence in the final product. This phenomenon is dependent on the humidity and temperature conditions, but inevitably results in a general increase in concentration as water and ethanol will be also lost by evaporation [12,15]. Beyond the fermentation and aging conditions, other factors such as seasonal variations in the raw materials used in the whisky production or the “terroir” can influence the whiskey flavor [12,16]. This is a growing concern for the wine industry as climate changes are affecting the production and quality of the different raw materials used and consequently, the consistency of the final product.
Alcohols, quantitatively the largest group of distilled beverages, are produced during fermentation by either an anabolic biosynthetic pathway from sugars or by a catabolic process from exogenous amino acids. Overall, the levels are higher in Scotch whisky than in other types. In addition to alcohols, several other congeners are produced during yeast fermentation such as carbonyl compounds, especially aldehydes, esters, and furfural. Esters of fatty acids and acetates are the most interesting esters. These compounds are formed enzymatically in alcohol fermentation or by esterification in the maturation and aging processes. Temperature, yeast type, and SO2 content are some factors that influence the formation of ethyl esters along the fermentative process. Ethyl ester’s contribution to the aromatic complexity depends on their concentrations, but usually, when the concentration is higher than their sensory threshold, there is generally a positive effect on the overall organoleptic characteristics [7].
Among the aldehydes, acetaldehyde is the major component and generally constitutes more than 90% of the total aldehyde content. For this reason, we could expect that this compound would be of importance, but due to the relatively high sensory threshold value, small variations in the acetaldehyde content hardly affect the odor of the beverage. On the other hand, low acetaldehyde content is most often associated with improved quality. Syringaldehyde is also a compound of interest because it is responsible, along with vanillin, for the vanilla flavor that is characteristic of oak-aged beverages. This compound arises from the oxidation of sinapic alcohols, which are produced by the ethanolysis of oak lignins [17,18].
The analysis of the aroma and flavor of alcoholic beverages has been reported in the literature using several classical or more sophisticated extraction procedures. This includes, among others, approaches such as liquid–liquid extraction (ELL) [2,19], purge, trap (i.e., dynamic headspace sampling) [20], supercritical fluid extraction [21], solid-phase extraction [22], solid-phase microextraction [3,23,24], stir bar sorptive extraction (SBSE) [10], direct thermal desorption [10], and dehydration homogeneous liquid–liquid extraction (DHLLE) [24,25]. Each of these approaches present advantages and disadvantages such as the use or not of organic solvents in the liquid extraction approaches or the use of solid sorbents to collect the headspace VOCs of the samples that are obtained under equilibrium conditions. Overall, to obtain the real representation of the aroma profile in spirits, it may be necessary to combine different extraction methods. In this context, LLE is a reference technique for the extraction of the VOCs from whiskey, where all VOCs (with low, medium, and high volatility) can be isolated in one extraction step. However, the extract normally requires concentration by solvent evaporation using a nitrogen stream. In some cases, this may result in the loss or degradation of some VOCs and the formation of others not present in the original sample. DLLμE appears as a green microextraction procedure, which consists of a ternary phase system of the aqueous sample and the addition of an extractor solvent (water-immiscible) and a dispersive solvent (water-miscible) to enhance the extraction efficiency [26]. Owens et al. [26] identified and compared the volatile fingerprint of whiskeys using ultrasound-assisted DLLμE with chloroform (as extractor solvent). Fontana et al. [27] demonstrated that DLLμE presents remarkable features for the extraction of volatile and semi-volatile compounds from grape marc distillates such as small solvent consumption, fast extraction times, and appropriate yields for a huge variety of species from different chemical families. In this context, this work, will explore the use of DLLμE followed by gas chromatography coupled with mass spectrometry detection (GC-MS) to establish the volatilomic fingerprint of non-commercial whiskey, in addition to gas chromatography with flame ionization detection (GC-FID) to determine the concentration levels of the identified volatiles. As far as we know, the VOCs were quantified for the first time in whiskeys using DLLμE combined with GC-FID. Additionally, the possibility of the differentiation of the samples assayed was evaluated using multivariate statistical tools.

2. Materials and Methods

2.1. Chemicals and Materials

Ethanol was purchased from Panreac (Barcelona, Spain), whereas anhydrous sodium sulfate (Na2SO4, analytical grade) was purchased from Merck (Darmstadt, Germany). Dichloromethane, ethyl ether, and hexane were purchased from LabScan (Dublin, Ireland). Water was obtained from a Milli-Q purification system (Millipore, Bedford, MA, USA). All authentic standards including the internal standard (IS) of octan-3-ol and C7 to C30 alkane solution were obtained from Sigma-Aldrich (Madrid, Spain). The individual stock solution (10 mg/L) of each authentic standard were prepared in ethanol. The highest concentration mixed standard was then prepared using 1 mg/L individual stock solutions to provide the correct calibration concentration for each analyte when a 10 µL spike was added to 5 mL of hydroalcoholic solution of 40% v/v. Then, the mix solutions were submitted to the same extraction procedure as described in Section 2.3.

2.2. Whiskeys

The non-commercial whiskeys used in this study were kindly supplied by the Famous Grouse distillery through Primedrinks SA, which included Malt Whisky “A” New Spirit (MANS, 500 mL, 46% vol, year of production: 2019), Malt Whisky ”A” 4 years old cask (MA4Y, 500 mL, 46% vol, 2017), Malt Whisky “A” Final Product (MAFP, 500 mL, 40% vol, 2019), Highland Park Malt (HPDK, 500 mL, 40% vol, 2019), Highland Park 1210 Malt (HP1210, 500 mL, 40% vol, 2019), Highland Park 1840 Malt (HP1840, 500 mL, 42% vol, 2009), Famous Grouse Old Reserve (FGOR, 500 mL, 43% vol, 2010), Famous Grouse Finest (FGF, 500 mL, 40% vol, 2019), and Famous Grouse 12 year old Malt (FG12, 500 mL, 40% vol, 2010). All samples were stored at −28 °C until analysis.

2.3. Dispersive Liquid–Liquid Microextraction Procedure

The extraction of the VOCs was carried out by DLLμE. In accordance with this extraction procedure, 5 mL of whisky, 25 µL of octan-3-ol (IS, 422 μg/L), and 0.5 g of Na2SO4 (remove water) were added in a screw cap glass tube with a conic bottom. Fifty µL of dichloromethane (D), ethyl ether (E), hexane (H), and mixture of these extractor solvents (D:E (3:1 v/v), D:E (1:3 v/v), D:H (3:1 v/v), D:H (1:3 v/v), E:H (1:3 v/v)) were tested to select the optimal extractor solvent using 1 mL of acetone as the disperser solvent in each solution. Then, the mixture was centrifuged for 10 min at 3000 rpm, and 2 µL of the separated phase was removed using a 10 µL microsyringe (zero dead volume, Hamilton) and injected into a gas chromatography-mass spectrometer (GC-MS) for VOC identification and selection of the best extractor solvent based on the number of VOCs identified, total relative peak area (extraction efficiency), and reproducibility expressed as the percentage of relative standard deviation (RSD%). In addition, the separated phase was injected into a gas chromatography-flame ionization detector (GC-FID) for VOC quantification.

2.4. Instrumental Analysis

2.4.1. Gas Chromatography-Mass Spectrometry (GC-MS) Conditions

GC-MS analysis was performed using an Agilent 6890 N (Palo Alto, CA, USA) gas chromatograph system coupled to an Agilent 5975 quadrupole inert mass selective detector equipped with a BP-20 fused silica capillary (30 m × 0.25 mm i.d. × 0.25 μm film thickness). Splitless injections were used. The initial oven temperature program was 50 °C (holds for 1 min) and then the temperature increased in two steps from 50 °C to 150 °C at 5 °C/min (2 min) and from 150 to 220 °C at 10 °C/min (25 min). The overall GC run time was 55 min. The transfer line, ion source, and quadrupole analyzer temperatures were maintained at 220, 180, and 200 °C, respectively, and a solvent delay of 4 min was selected. The mass spectrometer was set in electron ionization mode using a scan time of 0.37 sec/scan and covering a mass-to-charge (m/z) range from 35 to 300. The electron impact mass spectra were recorded at a 70 eV ionization voltage (emission current and maximum ionization time were 10 μA and 15 μs, respectively). The VOCs were identified through a comparison their mass spectra and retention times with those of standards, and by comparison of the mass spectrum with those in the NIST 05 MS library, and a comparison of their retention index (RI) with the values reported in the literature (LRI) for similar columns [28,29,30] and relevant MS-spectra.

2.4.2. Gas Chromatography-Flame Ionization Detector (GC-FID) Conditions

A Hewlett-Packard HP 5890 series II gas chromatograph equipped with a flame ionization detector (FID) was used. The column used was a BP-20 fused silica capillary (30 m × 0.25 mm i.d. × 0.25 μm film thickness). The initial oven temperature program was 50 °C (holds for 1 min) and then the temperature increased in two steps from 50 °C to 150 °C at 5 °C/min (2 min) and from 150 to 220 °C at 10 °C/min (25 min). The instrument parameters were as follows: 250 °C inlet temperature, 230 °C detector temperature, and carrier gas linear velocity 25 cm/s. All of the injections were conducted in split mode (1:10). A Star Chromatography workstation version 4.0 was used to acquire and process the data. The VOCs were tentatively identified by comparing the retention times (RTs) with the authentic standards, which were run under the same chromatographic conditions as the samples. In addition, the RI of each VOC was calculated using n-alkanes C7–C30 as the external references and compared to the RI reported in the literature (RIL) for similar columns [28,29,30].

2.5. Analytical Method Validation

The proposed DLLμE/GC-FID approach for the identification and quantification of VOCs in whiskeys was properly validated in terms of linearity, selectivity, limit of detection (LOD) and quantification (LOQ), trueness (expressed as recovery %), and precision (intra- and inter-day precision). The linearity of the method was evaluated by constructing a calibration curve for each analyte with seven calibration points (n = 7), being the concentration range selected based on the sensitivity of the GC-FID toward each VOC as well as the range of VOC concentration usually detected in whiskeys. The limits of detection (LOD) and quantification (LOQ) were estimated as the concentration of the analyte that produces a signal-to-noise ratio of three times, and the standard deviation of the y-residuals of the calibration graph is 3 and 10 times the ratio of Sy/x/b, respectively, where Sy/x is the blank standard deviation and b is the slope of the line regression. The linear range experiments provide the necessary information to calculate the LOD by extrapolating from the lowest concentration point on the linear calibration curve. The trueness (extraction efficiency) of the method, expressed as recovery percentage (%), was evaluated by spiking the whiskey (FG12) in triplicate with a medium concentration of each authentic standard. The precision was assessed in terms of intra-day (repeatability, n = 6) and inter-day (reproducibility, n = 18) using the same spiked level used in the trueness assays.

2.6. Statistical Analysis

The statistical analysis of the whiskeys was carried out using the MetaboAnalyst 5.0 web-based tool [31]. All experiments were performed in triplicate, and the concentration is shown as the mean ± standard deviation (SD). The data obtained were normalized through data transformation by cubic root and data scaling by autoscaling, and subjected to one-way analysis of variance (ANOVA) followed by Fisher’s test for the post hoc multiple comparisons of means from the data of nine whiskeys at a p-value < 0.05 to identify significant differences. Furthermore, principal component analysis (PCA) and partial least squares-discriminant analysis (PLS-DA) were applied to provide insights into the separations among the whiskeys under study and to identify the VOCs that could contribute to discriminate these whiskeys. Finally, hierarchical cluster analysis (HCA) was developed, considering the VOCs identified in whiskeys with variable-importance-in-projection (VIP) higher than 1, using Ward’s algorithm and Euclidean distance analysis. The HCA was conducted with the purpose of identifying cluster patterns that could help in the characterization of the whiskeys investigated.

3. Results and Discussions

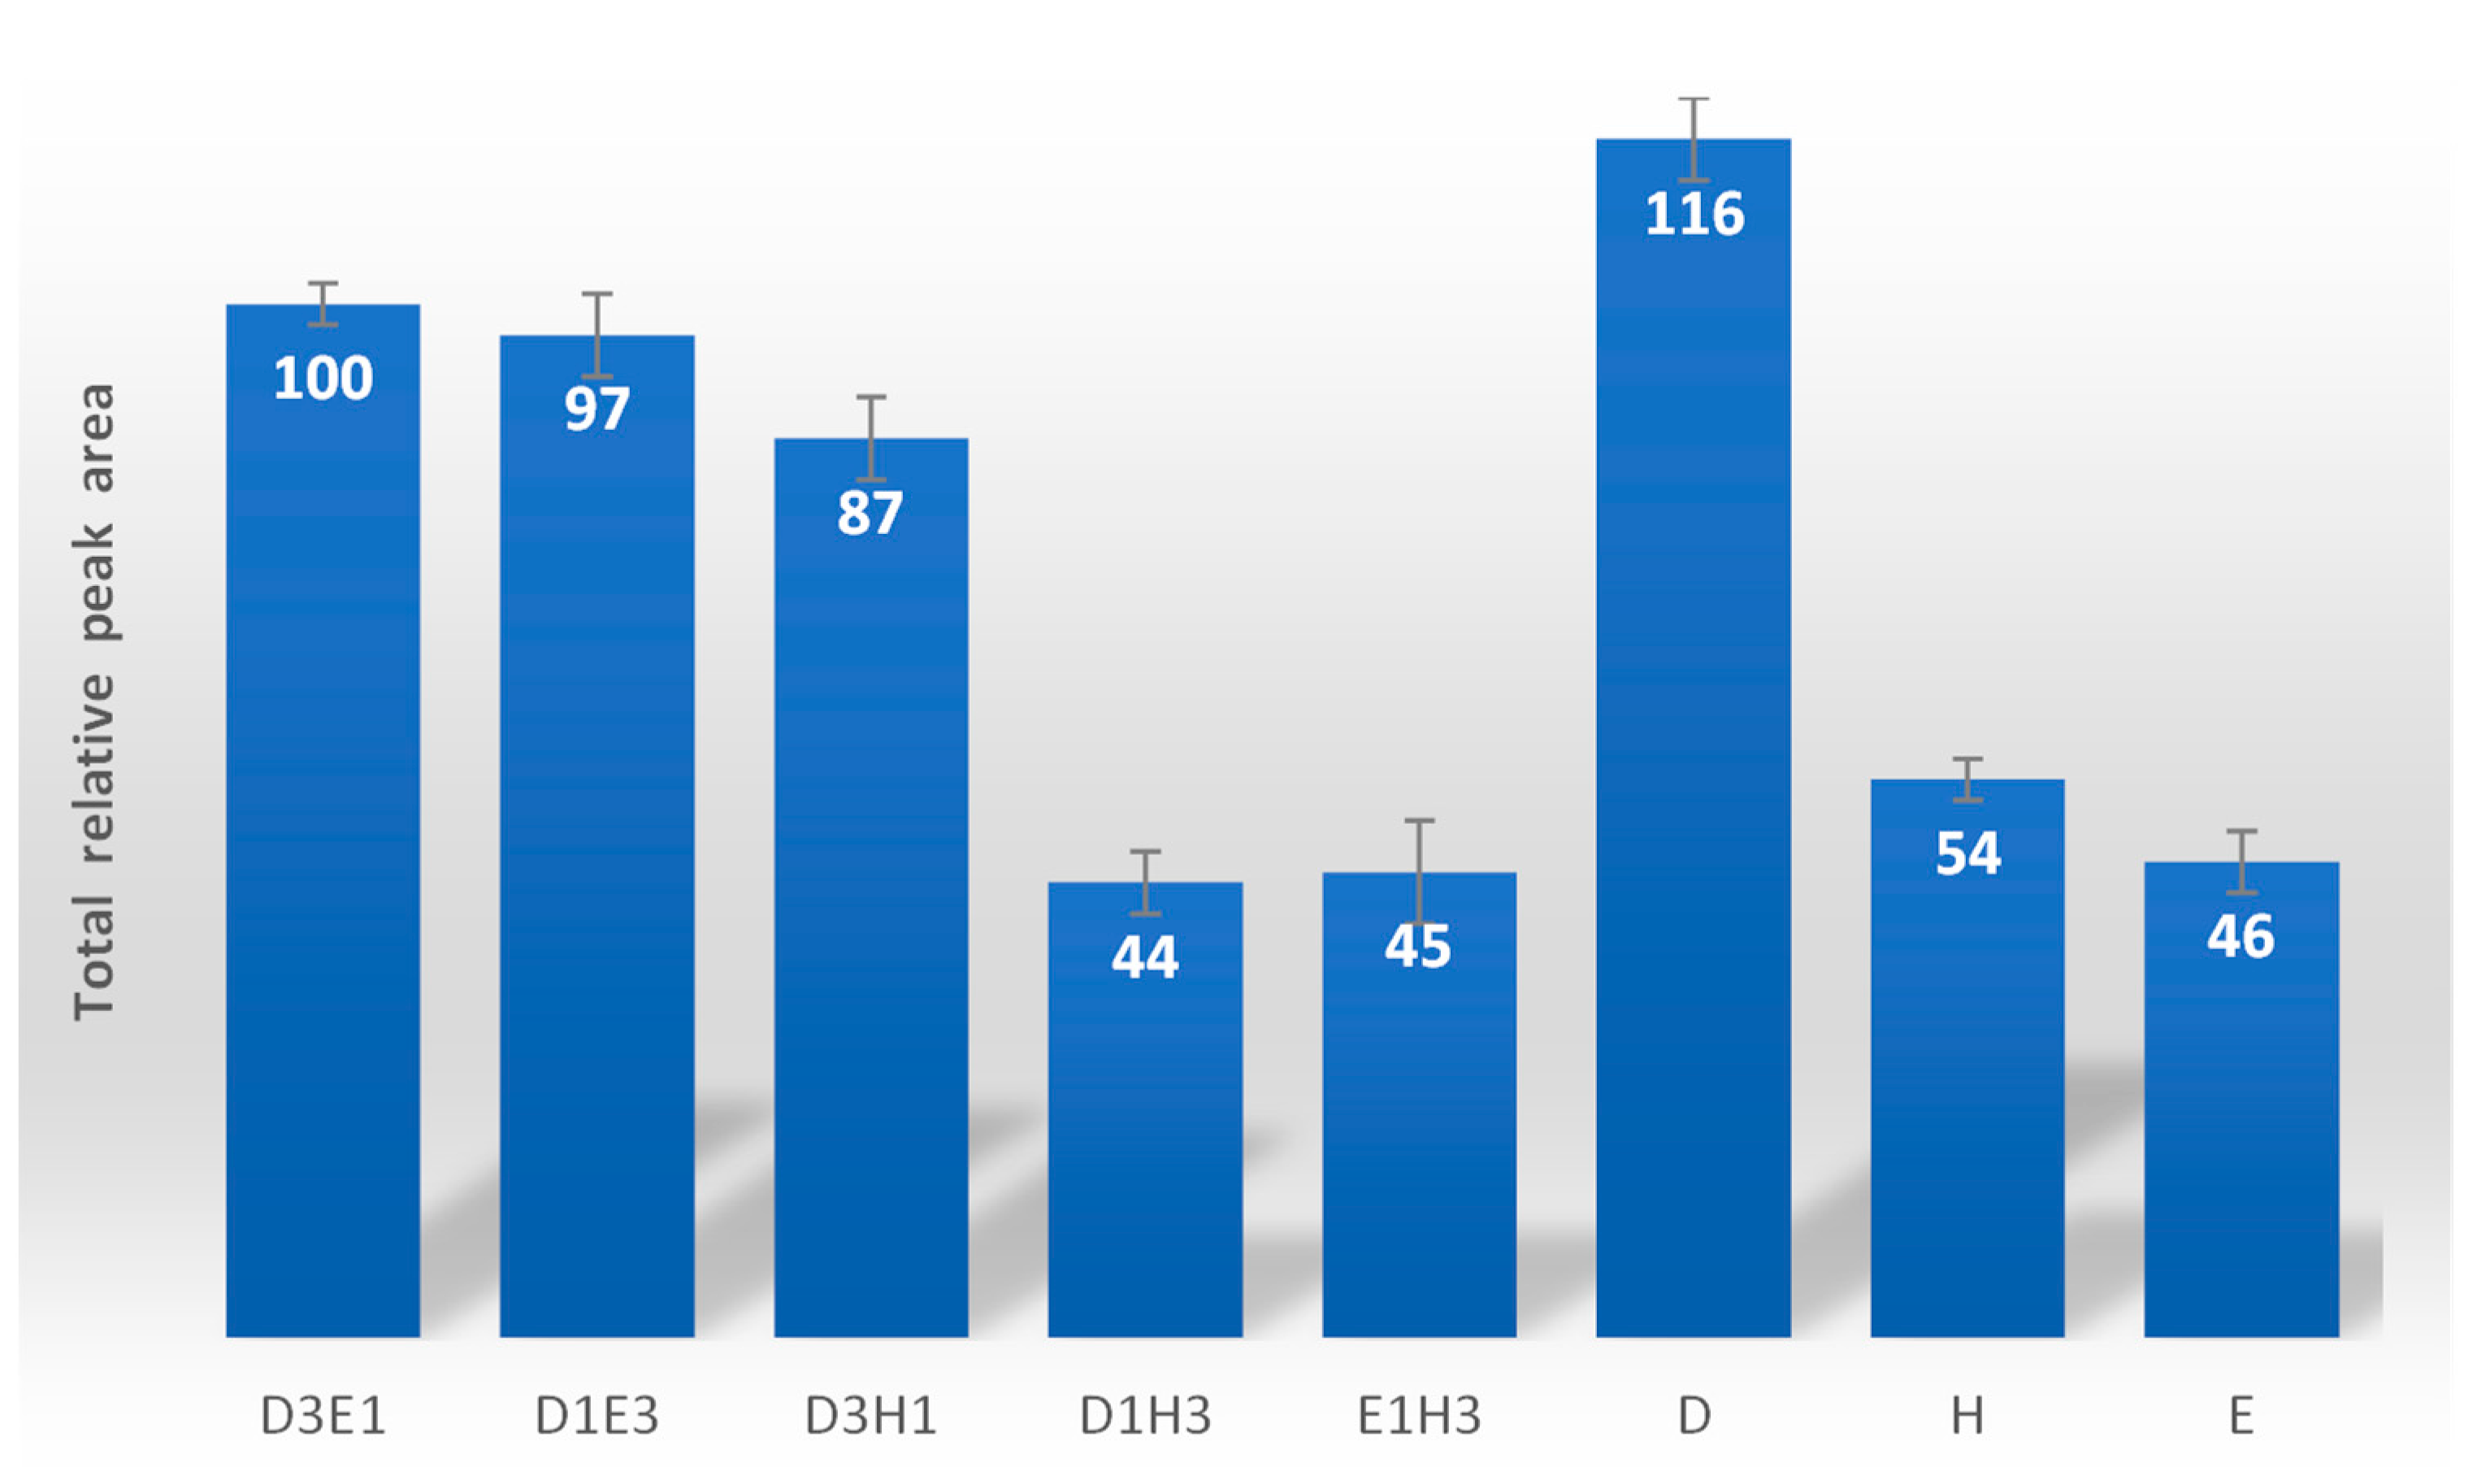
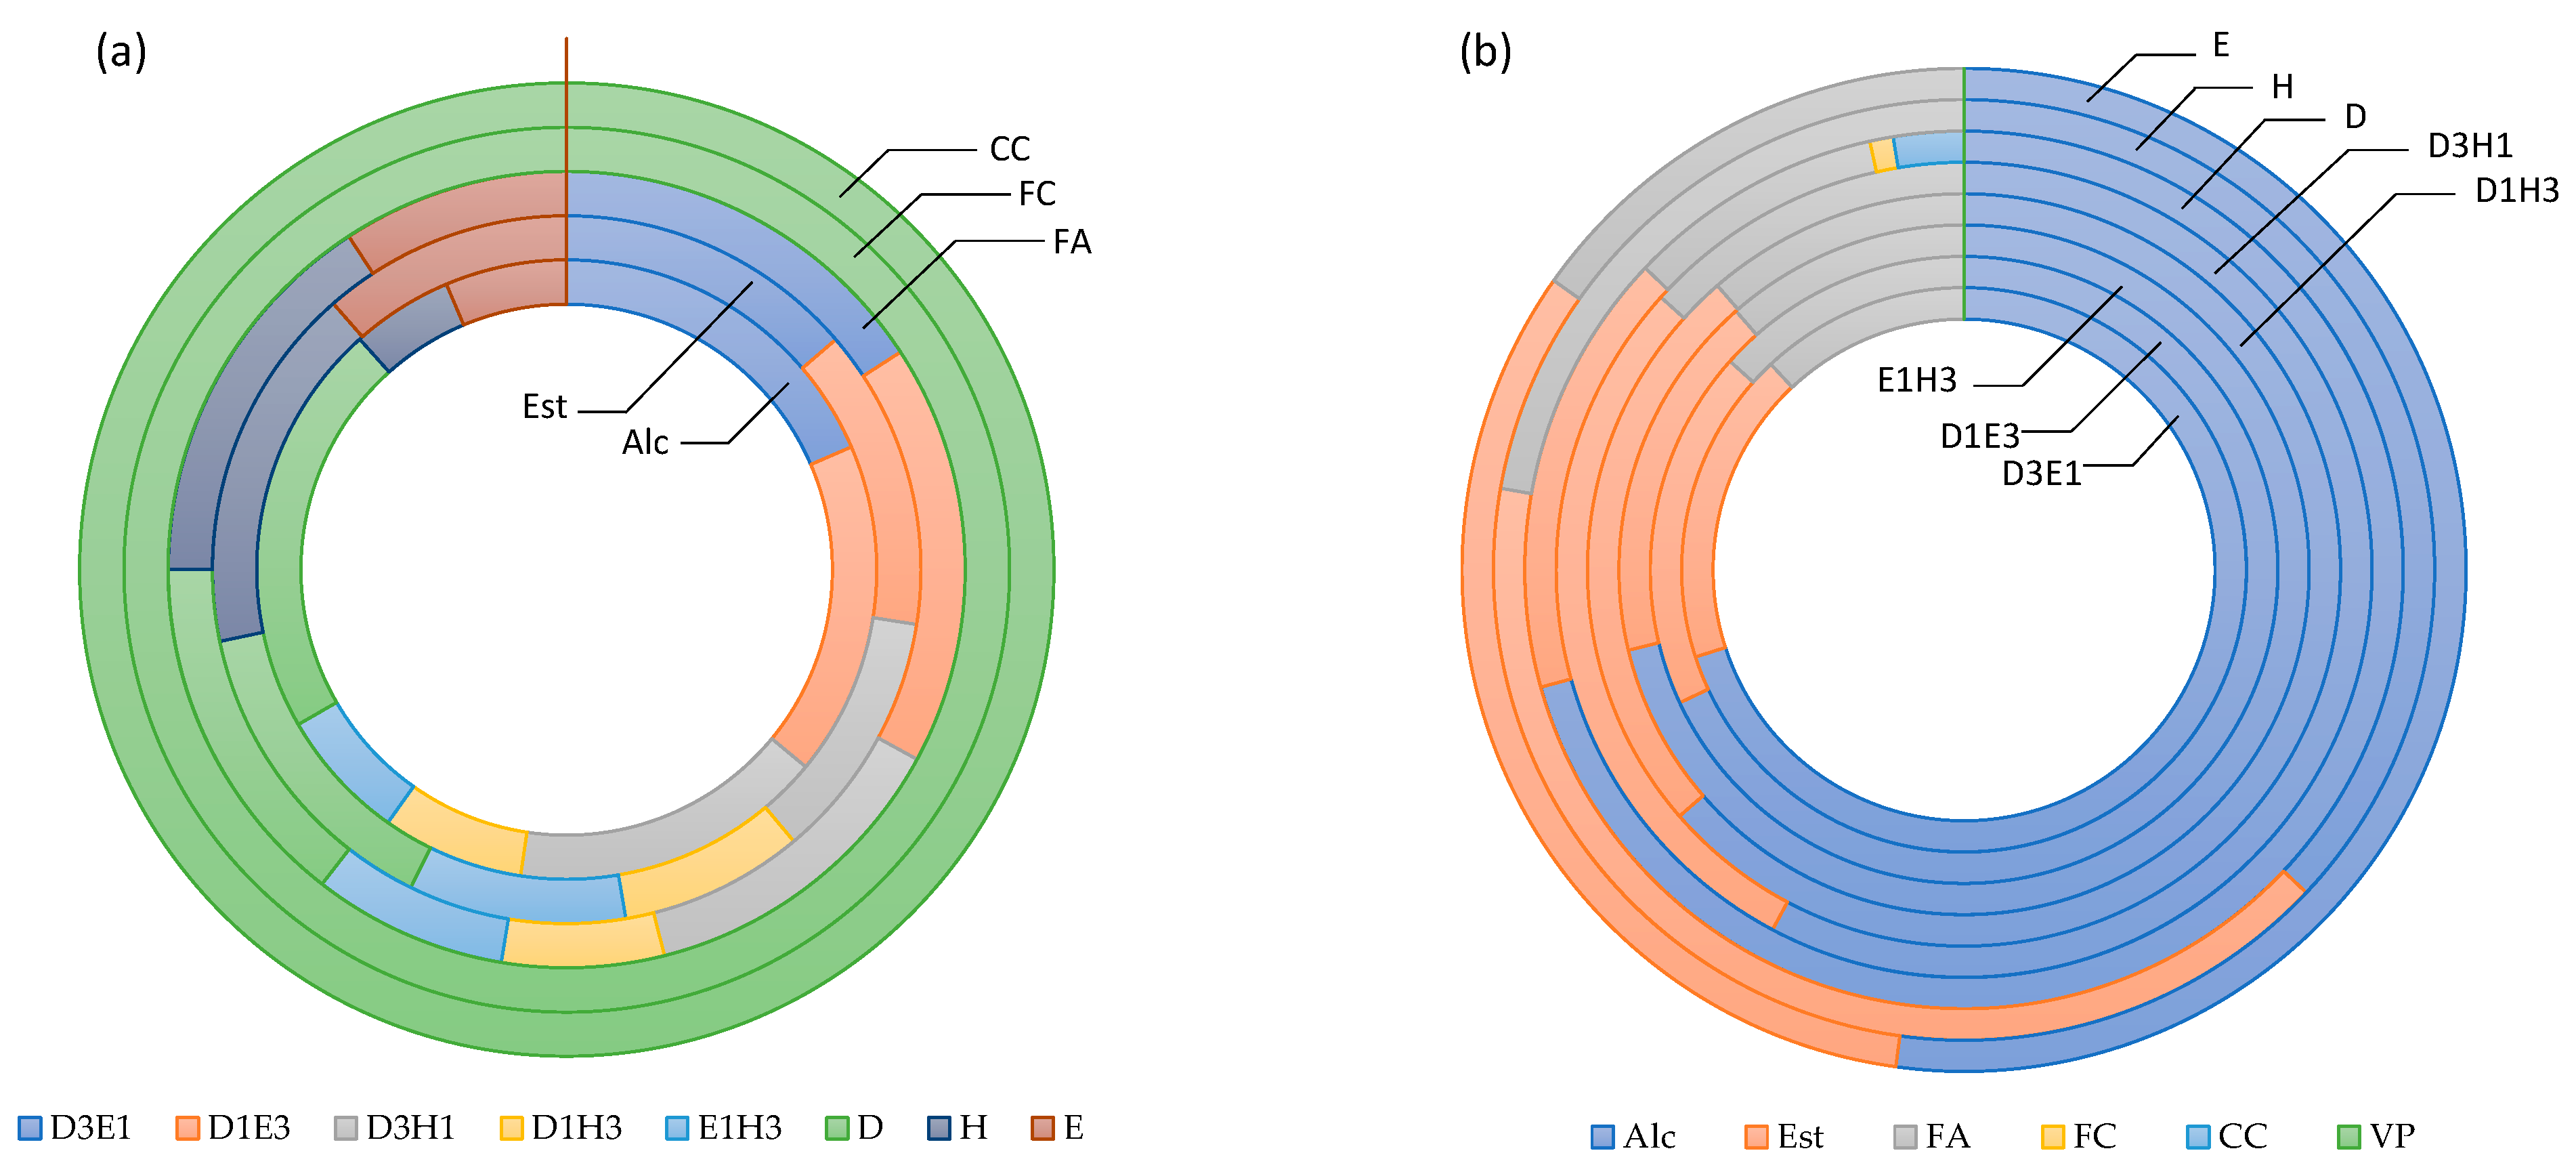
3.1. Selection of Extractor Solvent Using DLLμE/GC-MS

The first stage of this research addressed the identification of the best extractor solvent for isolation of the VOCs by DLLμE using acetone as the dispersive solvent. Acetone was used as the disperser solvent since it is soluble in the extractor solvent and miscible in the sample, enabling the extraction solvent to be dispersed as fine particles in the aqueous phase to form a cloudy solution. For this purpose, DLLμE combined with GC-MS was used to establish the volatilomic fingerprint of the FG12 whiskey. The best extractor solvent was selected based on the number of VOCs identified, the total relative peak area (extraction efficiency), and reproducibility (expressed as %RSD). Each extraction was conducted in triplicate and the reproducibility was lower than 20% for all extractor solvents used (Figure 1). According to the data obtained, dichloromethane (D) provided a higher extraction efficiency to the VOCs from FG12, whereas the poorest extraction efficiency was achieved using hexane (H), ethyl ether (E), and their mixture.
Regarding the chemical families (Figure 2), the alcohols (the most abundant one), furanic compounds, carbonyl compounds, and volatile phenols showed the highest extraction efficiency using dichloromethane (D) as the extractor solvent, whereas acetates and esters had better extraction efficiency using hexane. In addition, acids were better extracted using the mixture D:E (1:3 v/v). Nevertheless, no significant differences (p < 0.05) on extraction efficiency using dichloromethane (D) and hexane (H) as the extractor solvent was observed for the esters, the second most abundant chemical family identified in the FG12 whiskey. Based on these results, dichloromethane (D) was selected as the extractor solvent for the analysis of whiskeys.
Once the extractor solvent was selected, all whiskeys were analyzed by DLLμE/GC-MS to establish the volatilomic fingerprint. A total of 37 VOCs were identified using DLLμE/GC-MS including 12 alcohols, 11 esters, six acids, three carbonyl compounds, two furanic compounds, two volatile phenols, and one hydrocarbon. These VOCs were identified when the calculated RI and reported LRI did not differ by 10 units, and when the similarity between the mass spectrum of each VOC and spectrum of NIST 05 MS was at least 80%. Figure 3 shows the typical GC-MS profile of whiskeys using dichloromethane as the extractor solvent and acetone as the dispersive solvent.
Next, the DLLμE/GC-FID analytical approach was validated for the qualitative and quantitative analysis of a set of 37 VOCs with different physicochemical properties in all of the whiskeys investigated.

3.2. Method Validation

The performance of the DLLμE/GC-FID analytical approach for the quantification of the VOCs in whiskeys under study was assessed in terms of linearity, sensitivity (LOD, LOQ), trueness (% recovery), and precision (intra- and inter-day). The linearity was validated using seven calibration points of each authentic standard. The correlation coefficient (R2) achieved was higher than 0.993 for all standards investigated, with residuals lower than ±10%, which suggests a suitable linear correlation between relative area vs. concentration. Regarding the sensitivity, the DLLμE/GC-FID analytical approach demonstrated a great potential for the detection and quantification of VOCs in whiskeys, since low LODs (ranging from 0.50 to 63.1 ng/L) and LOQs (ranging from 1.67 to 210 ng/L) were achieved. The trueness (% recovery) and precision were assessed by spiking FG12 whiskey with a medium concentration of each standard. Recovery values ranged from 70% (acetaldehyde) to 99% (2-phenylethanol, 5-methylfurfural), whereas the intra- and inter- day precision for all standards considered in the method validation were lower than 15% (Table 1). The literature reports that a quantitative method should be validated since the presented mean recoveries ranged from 70 to 120%, and precision with a %RSD lower or equal to 20% [32].

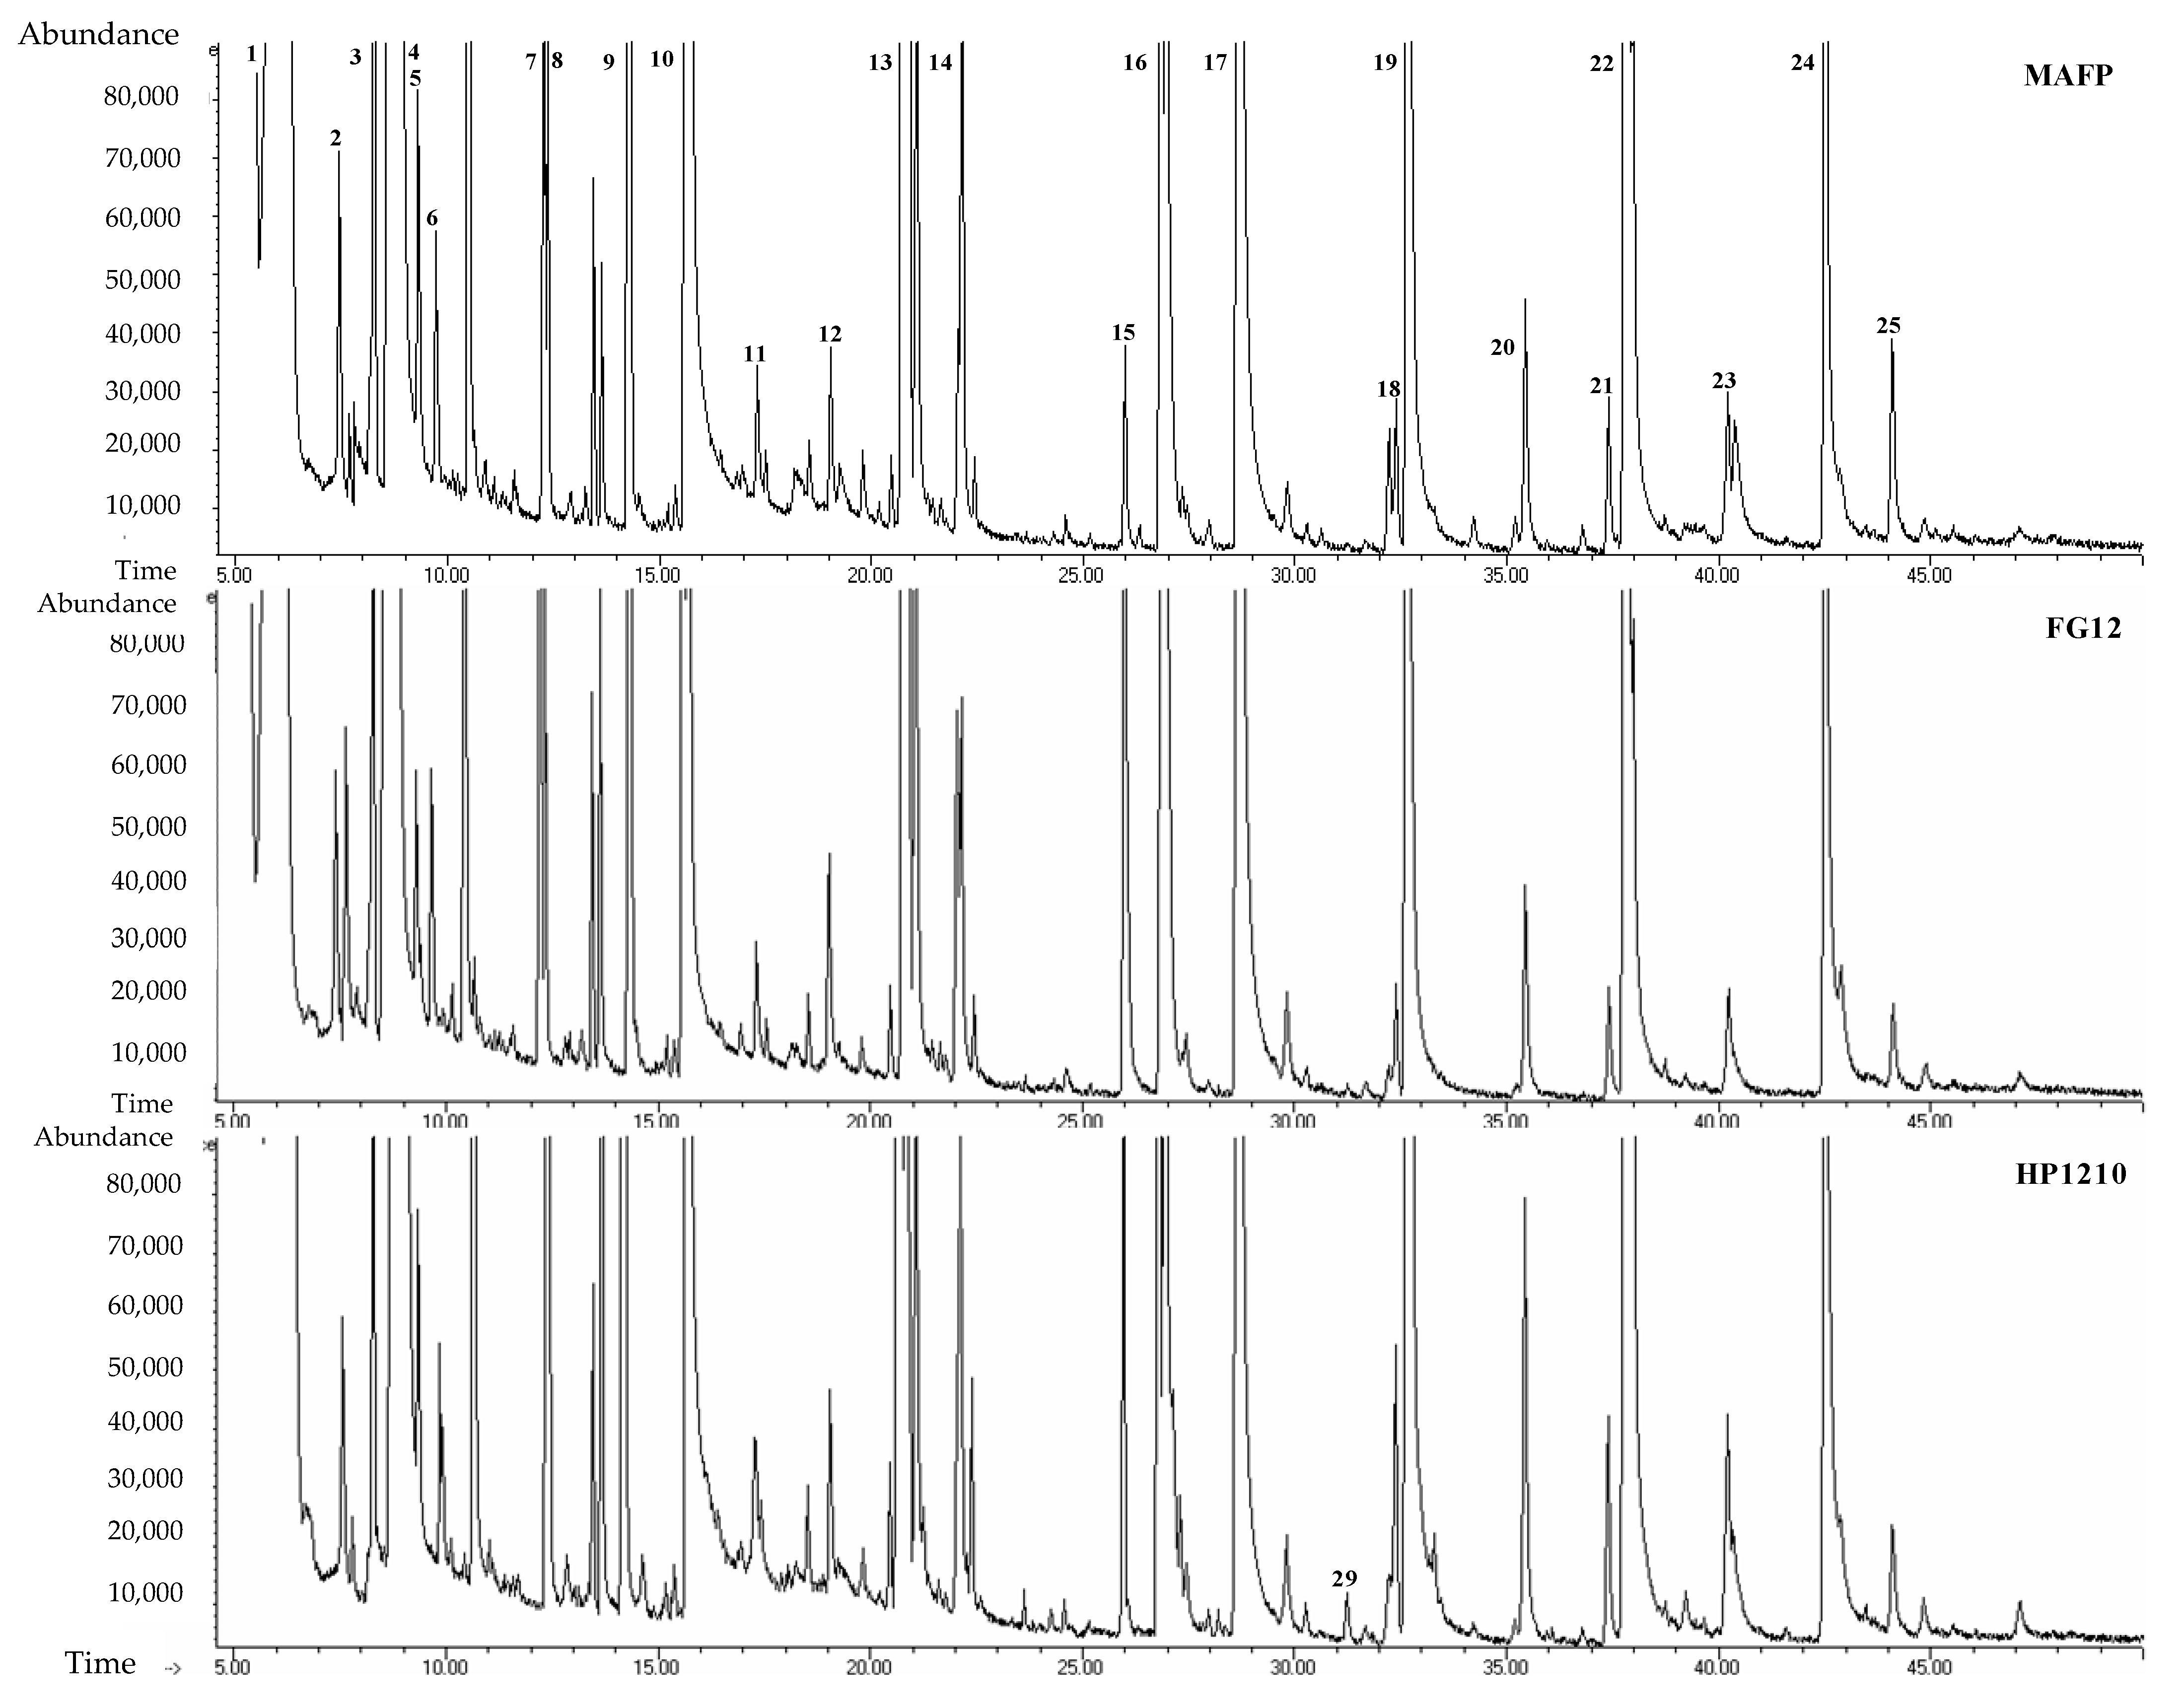
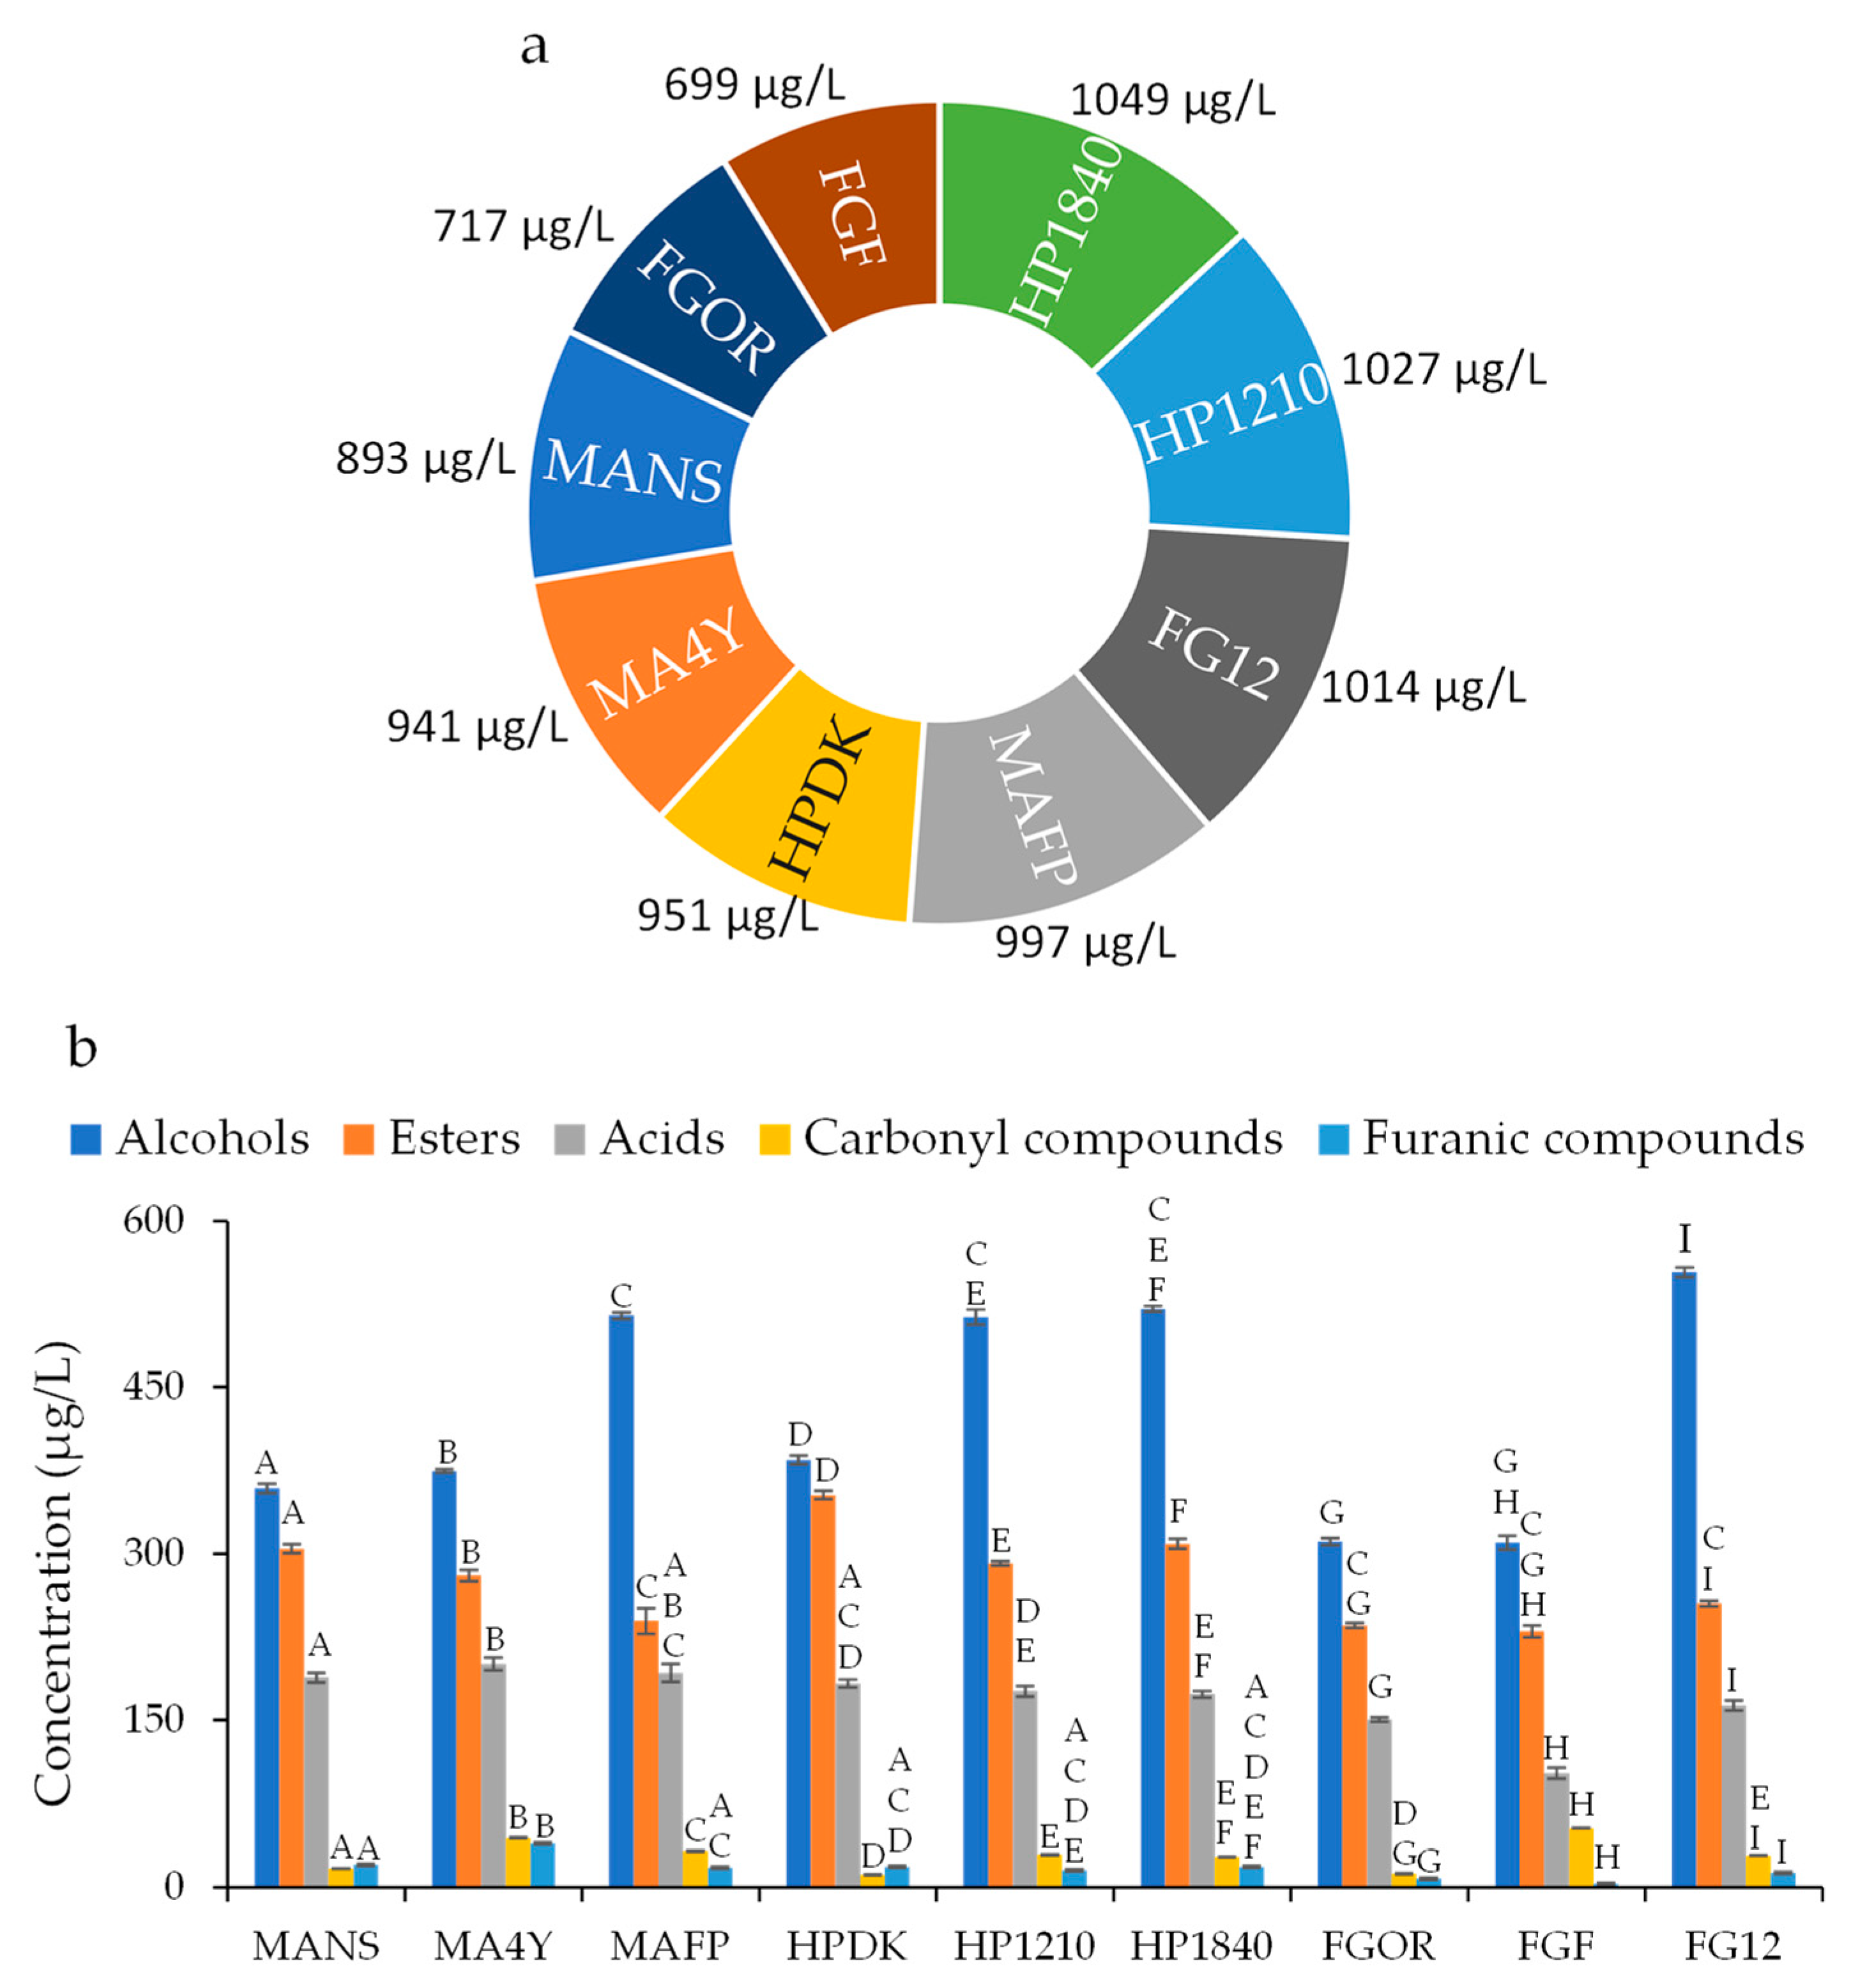
3.3. Analysis of Volatilomic Fingerprint of Whiskeys by DLLμE/GC-FID

The DLLμE/GC-FID allowed for the identification and quantification of 37 VOCs belonging to different chemical families, as can be observed in Table 2. These VOCs were identified by comparing the RI with LRI for similar columns, and by comparing the retention time (RT) of VOCs with standards injected in the same run conditions. Among the 37 VOCs identified in the whiskeys under study, most of them have been previously reported in whiskeys using different extraction procedures (e.g., solid phase microextraction, liquid–liquid extraction) and detection techniques (e.g., comprehensive two-dimensional gas chromatography (GC × GC) coupled with mass spectrometry (MS) and gas chromatography combined with a dielectric barrier discharge ionization detector (GC-BID)) [2,3,4,33].
Table 1 shows the mean concentration (expressed as µg/L) ± standard deviation of each VOC identified in whiskey analyzed by DLLμE/GC-FID. As expected, most of the VOCs identified were common to the whiskeys analyzed, but differed analytically in terms of mean concentration. However, some of these VOCs such as methionol and phenol were only detected in the HPDK and HP1210 whiskeys, respectively. In quantitative terms, HP1810 (total concentration 1049 µg/L) seemed to be the richest in volatilomic fingerprint, followed by HP1210 (1027 µg/L), FG12 (1014 µg/L), MAFP (997 µg/L), HPDK (951 µg/L), MA4Y (941 µg/L), MANS (893 µg/L), FGOR (717 µg/L), and FGF (699 µg/L), Figure 4a. A possible explanation for HP1810 (18 years), HP1210 (12 years), and FG12 (12 years) presenting the highest total concentration of volatile composition can be correlated with the aging of these whiskeys. It is well-documented that the ageing process of beverages in oak casks contributes to the enrichment of the volatile fingerprint, since several phenomena occur such as the extraction of wood components, the evaporation of beverage VOCs, the oxidation of compounds in the beverage, and the reaction between the wood and beverage components [34,35,36,37,38,39].
Regarding the distribution of the chemical families, alcohols (on average 45.6% of total volatilomic fingerprint), esters (30.6%), and acids (18.5%) were the predominant chemical families identified in the whiskeys investigated (Figure 4b). The contribution of the remaining chemical families to the total volatilomic fingerprint was lower than 4%. In addition, significant differences confirmed by the one-way ANOVA with post-hoc Tukey’s test at p < 0.05 level were observed in these chemical families among the whiskeys (Figure 4b).
Alcohols are derived from yeast amino acid metabolism via the Ehrlich pathway-transamination of amino acids to α-keto acids, which are decarboxylated to the corresponding aldehyde. An alcohol dehydrogenase promotes the reduction of the aldehydes to higher alcohols. This mechanism is highly dependent on several parameters such as fermentation conditions (temperature, pH) and the presence of oxygen [33]. The alcohols’ total concentration ranged from 359 to 515 µg/L for the Malt whiskeys (MANS, MA4Y, MAFP); from 385 to 521 µg/L for Highland Park (HPDK, HP1210, HP1840); and from 310 to 554 for Famous Grouse (FGOR, FGF, FG12). One-way ANOVA with the post hoc Tukey’s test at the p < 0.05 level showed that there was no significant difference in the total alcohol concentration between MAFP (515 µg/L), H1210 (513 µg/L), and HP1840 (521 µg/L) as well as between the FGOR (311 µg/L) and FGF (310 µg/L) whiskeys. This chemical family when present at concentrations below 300 mg/L contributes to the desirable complexity with fruity and sweet notes, but when the concentrations exceed 400 mg/L, alcohols are regarded as a negative quality factor [40]. The alcohol fraction in the analyzed whiskeys was mainly composed of 3-methylbutan-1-ol (327 µg/L) and propan-1-ol (56.1 µg/L). The presence of these alcohols in whiskeys make a positive contribution to the general quality of whisky, being responsible for their fruity and sweet sensory properties. Nevertheless, these two alcohols were found in the Malt (on average of 61.6 and 306 µg/L for propan-1-ol and 3-methylbutan-1-ol, respectively), Highland Park (61.4 and 366 µg/L), and Famous Grouse (45.4 and 309 µg/L) at similar concentrations, where a statistically significant difference was barely detected (p < 0.05), and consequently cannot be used to distinguish the whiskeys investigated.
Esters were the second most abundant chemical family identified in the whiskeys. Their concentration depends on several factors such as the yeast strain, fermentation temperature, aeration degree, and sugar content. This chemical family makes a positive contribution to the general quality of whiskeys, being responsible for their fruity and floral sensory notes. The highest and lowest concentrations of esters were determined in HPDK (353 µg/L) and FGF (230 µg/L), respectively. Similar concentrations of esters were determined in FGF (230 µg/L), FGOR (236 µg/L), FG12 (255 µg/L), and MAFP (239 µg/L), which were not significantly different (p < 0.05). Ethyl decanoate (on average, 109 µg/L), ethyl hexanoate (79.7 µg/L), and ethyl octanoate (48.5 µg/L) were the predominant esters identified in all of the whiskeys studied.
Acids arise during fermentation as secondary products of yeast metabolism, and they can inhibit the alcoholic fermentation. The total concentration of the alcohols ranged from 188 to 201 µg/L for the Malt whiskeys (MANS, MA4Y, MAFP); from 173 to 183 µg/L for Highland Park (HPDK, HP1210, HP1840); and from 102 to 183 for Famous Grouse (FGOR, FGF, FG12). There was a statistical difference at p < 0.05 for the acid concentration between FGF (102 µg/L), FGOR (151 µg/L), and FG12 (163 µg/L) as well as among the Famous Grouse whiskey and the other whiskeys investigated (Figure 4b). Decanoic acid (58.4 µg/L), octanoic acid (47.7 µg/L), and hexanoic acid (44.4 µg/L) were the predominant acids detected in all whiskeys, and their presence contribute with cheese-, fatty-, and sour-like sensory notes, respectively.
Regarding the minor chemical families, the total concentration of carbonyl compounds ranged from 11.1 µg/L (HPDK) to 52.8 µg/L (FGF). Acetaldehyde was detected in all whiskeys, whereas benzaldehyde was only detected in the MAFP (0.26 µg/L) and FG12 (3.75 µg/L) whiskeys. On the other hand, syringaldehyde was detected in all whiskeys, except for MANS and HPDK. In addition, the total furanic compound concentration ranged from 17.6 to 39.2 µg/L for the Malt whiskeys; from 15.3 to 18.4 µg/L for Highland Park; and from 3.1 to 13.0 µg/L for Famous Grouse. 2-Furfural was the predominant furanic compound identified in all of the whiskeys investigated.

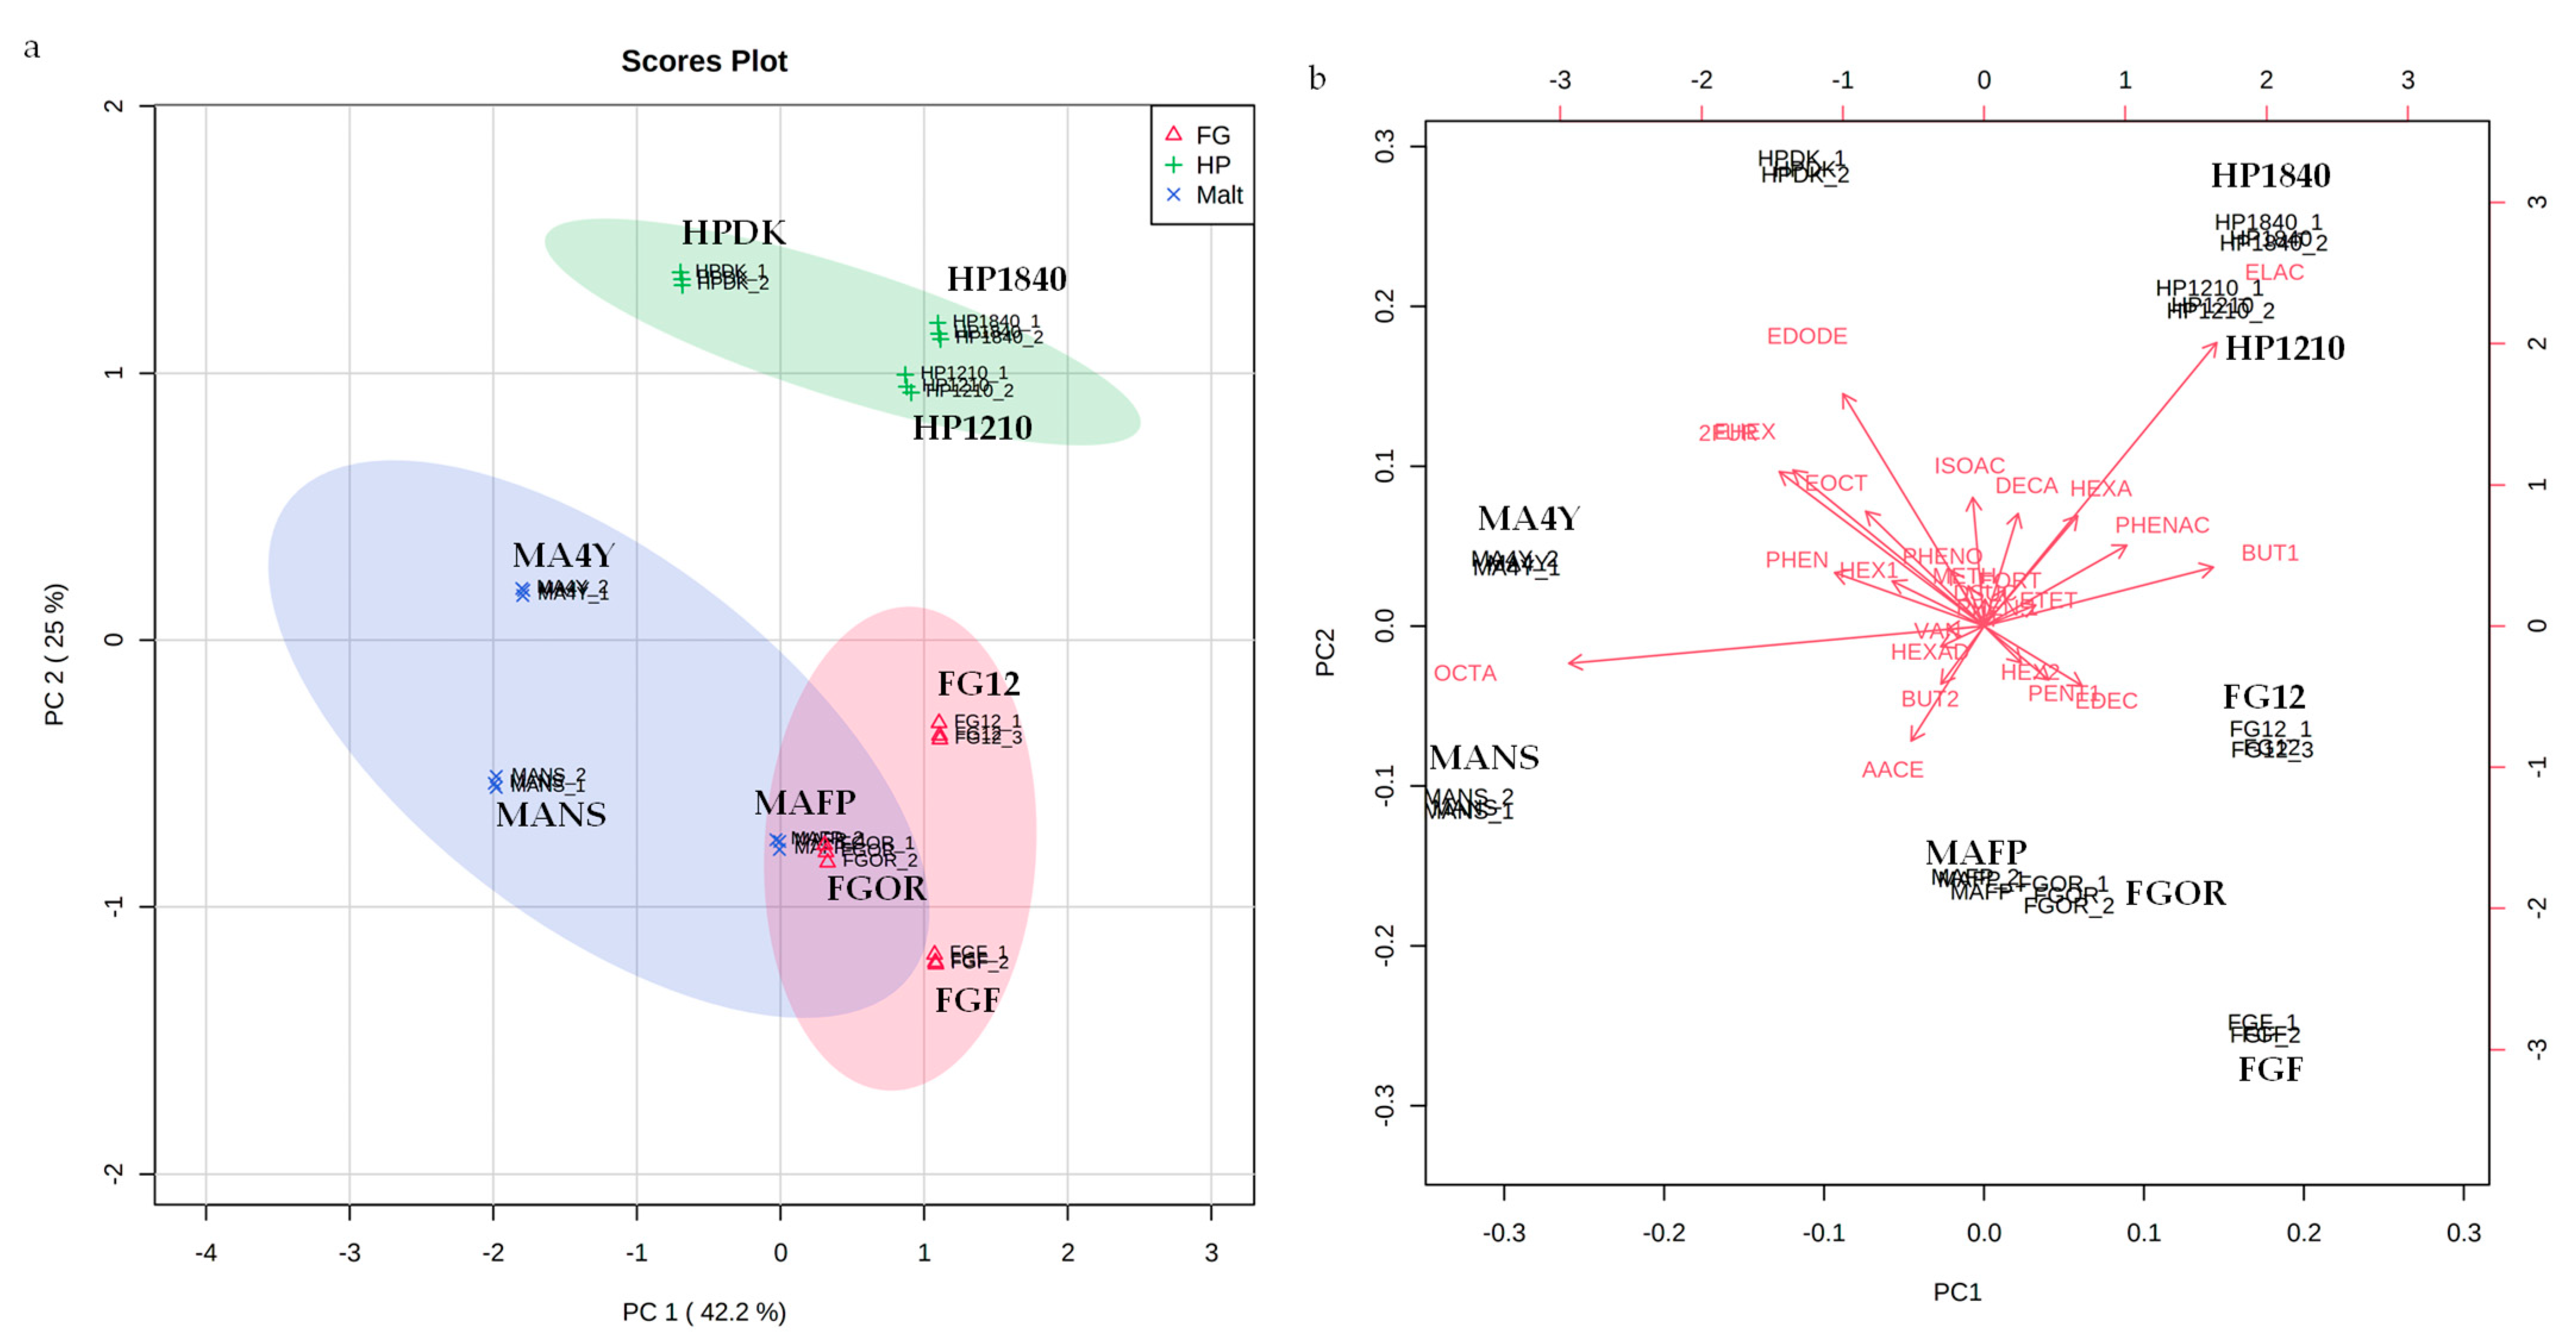
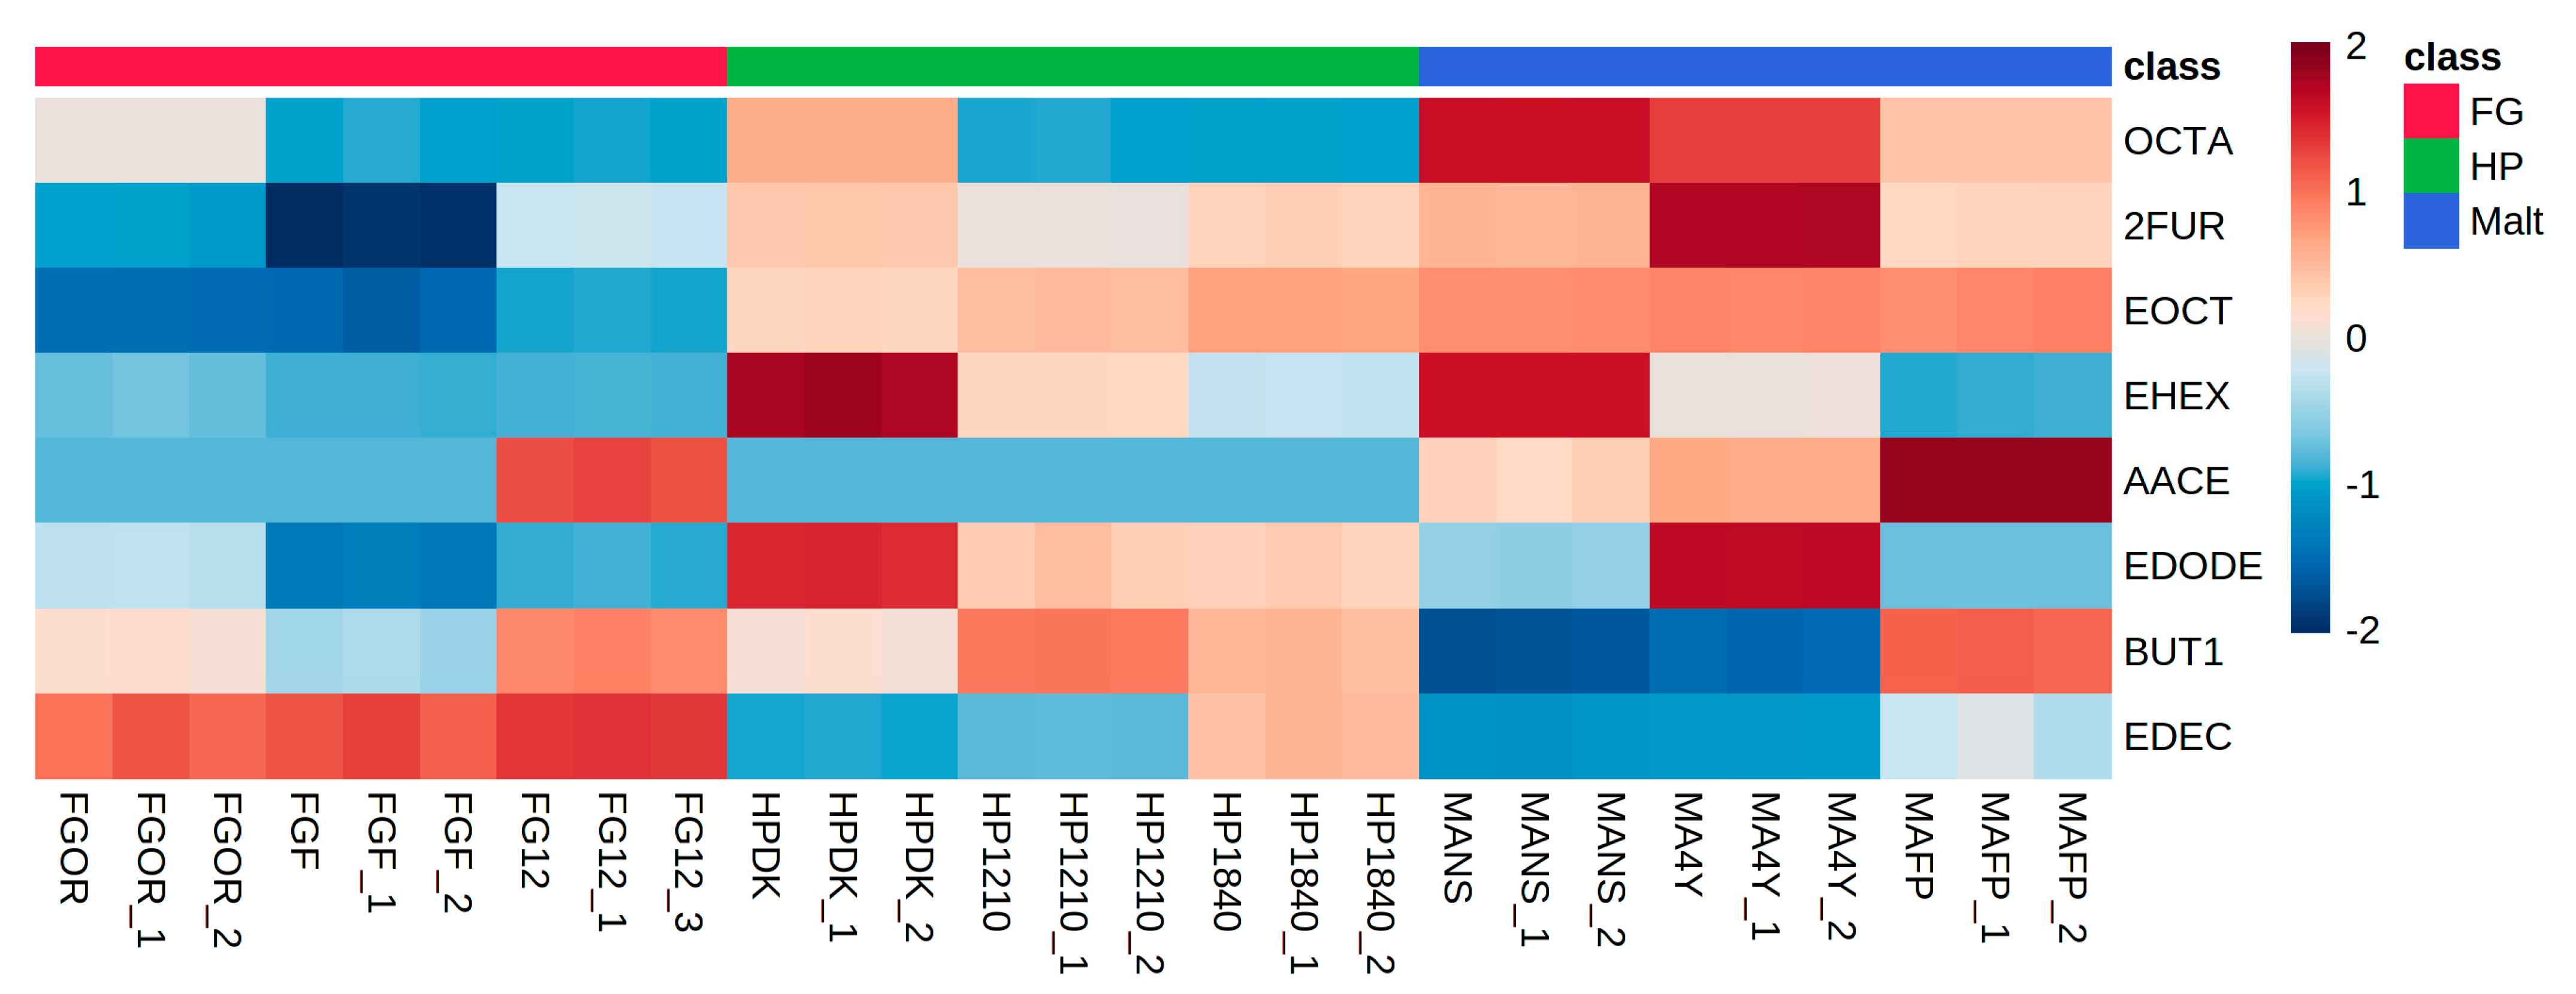
3.4. Statistical Analysis

The proposed DLLμE/GC-FID analytical approach was applied to nine different whiskeys. Evidently, the different concentrations of the VOCs quantified in these samples allowed for their characterization, but their differentiation was challenging. In this sense, multivariate statistical tools were used to achieve the discrimination among the whiskeys investigated.
The one-way ANOVA with post hoc Tukey’s test (p < 0.05) was carried out to select the VOCs that had statistically significant differences. Twenty-six of the identified VOCs presented significant differences between the Malt, Highland Park, and Famous Grouse whiskeys, whereas the propan-1-ol, 3-methylbutan-1-ol, benzyl alcohol, ethyl 9-decenoate, butanoic acid, dodecanoic acid, acetaldehyde, benzaldehyde, syringaldehyde, 5-methylfurfural, and cyclodecane were not significantly different (p < 0.05). Applying PCA to the normalized concentration of the 26 analytical variables (VOCs) was significantly different and 27 objects (whiskeys) and two factors were extracted, explaining 67.2% of the total variance of the initial dataset (Figure 5).
Figure 5b shows the corresponding biplot that establishes the relative importance of each variable, and it is therefore useful for the study of the relationships between VOCs and different whiskeys. From the plot of the 27 objects (whiskeys) on the plane defined by these first two principal components, the HP1840 and HP1210 appeared in PC1 and PC2 positive. Thus, ethyl lactate (ELAC) is the VOC most related to these whiskeys. The MAFP, FGOR, FGF, and FG12, projected in PC1 positive and PC2 negative, were characterized by ethyl decanoate (EDEC), 1-pentanol (PENT1), and hexan-2-ol (HEX2), whereas MANS was projected in PC1 and PC2 negative by octanoic acid (OCTA). To further understand the differences among the whiskeys studied, a PLS-DA model was developed (Figure 6) and the most significant VOCs (VIP score > 1) were octanoic acid (OCTA), 2-furfural (2FUR), ethyl octanoate (EOCT), ethyl hexanoate (EHEX), acetic acid (AACE), ethyl dodecanoate (EDODE), butan-1-ol (BUT1), and ethyl decanoate (EDEC). In addition, a random permutation test with 1000 permutations was carried out with PLS-DA to assess the robustness of the model. In Figure 6c, according to cross validation, it was observed for three significant components, a goodness of fit of 0.9694 (R2 = 96.94%), and a predicted ability of 0.9613 (Q2 = 96.13%). These data demonstrated that the model was not overfitted since the difference between R2 and Q2 was lower than 0.3, consequently, the PLS-DA model showed a suitable predictive ability to discriminate the whiskeys investigated.
The heatmap developed using Pearson’s correlation for the VOCs with VIPs higher than 1 is displayed in Figure 7. As can be observed, significant differences in terms of the VOC concentration were observed among the whiskeys investigated.

4. Conclusions

The DLLμE extraction procedure combined with GC-MS and GC-FID was demonstrated to be an efficient, simple, and economical analytical approach for the identification and quantification of VOCs in the nine whiskeys investigated. The extractor solvent was optimized, and the best extraction efficiency based on the total relative peak area, number of the identified, and reproducibility (%RSD) was achieved using dichloromethane.
The DLLμE/GC-FID method was validated, and a linear correlation (R2 ≥ 0.993) was achieved for the assessed ranges. In addition, this method had good sensitivity (low LODs, and LOQs) and recovery (ranging from 70 to 99%), which differed according to the chemical group of VOC. The intra- and inter-day precision for all VOCs considered in the method validation was lower than 15%. A total of 37 VOCs belonging to different chemical families, namely, 12 alcohols, 11 esters, six acids, three carbonyl compounds, two furanic compounds, two volatile phenols, and one hydrocarbon, were identified and quantified in the whiskeys investigated. These samples were mainly characterized by the presence of a higher concentration of alcohols, esters, and acids, which contribute with fruity, sweet, and cheese/fatty notes to whiskey sensory properties, respectively. The PCA and PLS-DA analysis applied to the DLLμE/GC-FID data represent a simple and efficient approach to discriminate the whiskeys investigated. The most significant VOCs (VIP score > 1) for this discrimination were octanoic acid, 2-furfural, ethyl octanoate, ethyl hexanoate, acetic acid, ethyl dodecanoate, butan-1-ol, and ethyl decanoate.

Author Contributions

Conceptualization: J.S.C. and R.P.; Methodology: M.C., R.P. and F.R.; Validation: M.C., R.P. and F.R.; Formal analysis: M.C., R.P. and F.R.; Investigation: M.C., R.P. and F.R.; Resources, J.S.C.; Data curation, M.C., R.P. and F.R.; Writing—original draft preparation, M.C., R.P., F.R. and J.S.C.; Writing—review and editing, J.S.C., J.A.M.P. and R.P.; Supervision, J.S.C. All authors have read and agreed to the published version of the manuscript.

Funding

This research was funded by FCT-Fundação para a Ciência e a Tecnologia through the CQM Base Fund—UIDB/00674/2020, and Programmatic Fund—UIDP/00674/2020, and by ARDITI-Agência Regional para o Desenvolvimento da Investigação Tecnologia e Inovação, through the project M1420-01-0145-FEDER-000005—Centro de Química da Madeira—CQM+ (Madeira 14-20 Program) and the Post-Doctoral fellowship given to J.A.M.P (Project M1420–09–5369-FSE-000001). The authors also acknowledge the FCT and Madeira 14-2020 program to the Portuguese Mass Spectrometry Network (RNEM) through the PROEQUIPRAM program, M14-20 M1420-01-0145-FEDER-000008.

Institutional Review Board Statement

Not Applicable.

Informed Consent Statement

Not Applicable.

Data Availability Statement

Not applicable.

Acknowledgments

The authors are grateful to Famous Grouse and Primedrinks SA for the supply of the samples used in this study.

Conflicts of Interest

The authors declare no conflict of interest.

References

  1. Camara, J.S.; Marques, J.C.C.; Perestrelo, R.M.; Rodrigues, F.; Oliveira, L.; Andrade, P.; Caldeira, M.; Ren, J.J.; Liu, H.Y.; Hao, Y.H.; et al. A Narrative Review of Sulfur Compounds in Whisk(e)Y. J. Chromatogr. A 2020, 6, 377–397. [Google Scholar]
  2. Caldeira, M.; Rodrigues, F.; Perestrelo, R.; Marques, J.C.; Câmara, J.S. Comparison of Two Extraction Methods for Evaluation of Volatile Constituents Patterns in Commercial Whiskeys. Elucidation of the Main Odour-Active Compounds. Talanta 2007, 74, 78–90. [Google Scholar] [CrossRef] [PubMed]
  3. Câmara, J.S.S.; Marques, J.C.C.; Perestrelo, R.M.M.; Rodrigues, F.; Oliveira, L.; Andrade, P.; Caldeira, M. Comparative Study of the Whisky Aroma Profile Based on Headspace Solid Phase Microextraction Using Different Fibre Coatings. J. Chromatogr. A 2007, 1150, 198–207. [Google Scholar] [CrossRef]
  4. Ferracane, A.; Manousi, N.; Tranchida, P.Q.; Zachariadis, G.A.; Mondello, L.; Rosenberg, E. Exploring the Volatile Profile of Whiskey Samples Using Solid-Phase Microextraction Arrow and Comprehensive Two-Dimensional Gas Chromatography-Mass Spectrometry. J. Chromatogr. A 2022, 1676, 463241. [Google Scholar] [CrossRef]
  5. Franitza, L.; Granvogl, M.; Schieberle, P. Influence of the Production Process on the Key Aroma Compounds of Rum: From Molasses to the Spirit. J. Agric. Food Chem. 2016, 64, 9041–9053. [Google Scholar] [CrossRef]
  6. Rodríguez Madrera, R.; Blanco Gomis, D.; Mangas Alonso, J.J. Influence of Distillation System, Oak Wood Type, and Aging Time on Composition of Cider Brandy in Phenolic and Furanic Compounds. J. Agric. Food Chem. 2003, 51, 7969–7973. [Google Scholar] [CrossRef] [PubMed]
  7. Liu, S.Q.; Holland, R.; Crow, V.L. Esters and Their Biosynthesis in Fermented Dairy Products: A Review. Int. Dairy J. 2004, 14, 923–945. [Google Scholar] [CrossRef]
  8. Kourkoutas, Y.; Bekatorou, A.; Banat, I.M.; Marchant, R.; Koutinas, A.A. Immobilization Technologies and Support Materials Suitable in Alcohol Beverages Production: A Review. Food Microbiol. 2004, 21, 377–397. [Google Scholar] [CrossRef]
  9. Flamini, R.; Panighel, A.; De Marchi, F. Mass Spectrometry in the Study of Wood Compounds Released in the Barrel-Aged Wine and Spirits. Mass Spectrom. Rev. 2021, e21754. [Google Scholar] [CrossRef]
  10. Guerrero-Chanivet, M.; Valcarcel-Munoz, M.J.; Garcia-Moreno, M.V.; Guillen-Sanchez, D.A. Characterization of the Aromatic and Phenolic Profile of Five Different Wood Chips Used for Ageing Spirits and Wines. Foods 2020, 9, 1613. [Google Scholar] [CrossRef]
  11. Gollihue, J.; Richmond, M.; Wheatley, H.; Pook, V.G.; Nair, M.; Kagan, I.A.; DeBolt, S. Liberation of Recalcitrant Cell Wall Sugars from Oak Barrels into Bourbon Whiskey during Aging. Sci. Rep. 2018, 8, 15899. [Google Scholar] [CrossRef] [PubMed] [Green Version]
  12. Roullier-Gall, C.; Signoret, J.; Coelho, C.; Hemmler, D.; Kajdan, M.; Lucio, M.; Schafer, B.; Gougeon, R.D.; Schmitt-Kopplin, P. Influence of Regionality and Maturation Time on the Chemical Fingerprint of Whisky. Food Chem. 2020, 323, 126748. [Google Scholar] [CrossRef] [PubMed]
  13. Roullier-Gall, C.; Signoret, J.; Hemmler, D.; Witting, M.A.; Kanawati, B.; Schafer, B.; Gougeon, R.D.; Schmitt-Kopplin, P. Usage of FT-ICR-MS Metabolomics for Characterizing the Chemical Signatures of Barrel-Aged Whisky. Front. Chem. 2018, 6, 29. [Google Scholar] [CrossRef] [PubMed]
  14. Winstel, D.; Gautier, E.; Marchal, A. Role of Oak Coumarins in the Taste of Wines and Spirits: Identification, Quantitation, and Sensory Contribution through Perceptive Interactions. J. Agric. Food Chem. 2020, 68, 7434–7443. [Google Scholar] [CrossRef]
  15. del Toro del Toro, N.; Fong Casas, F.; Ayan Rial, J.; Caridad Portuondo González, M.; Crespo Sariol, H.; Navarro Campa, J.; Yperman, J.; Vandamme, D.; Carleer, R. Boltzmann-Based Empirical Model to Calculate Volume Loss during Spirit Ageing. Beverages 2019, 5, 60. [Google Scholar] [CrossRef]
  16. Kyraleou, M.; Herb, D.; O’Reilly, G.; Conway, N.; Bryan, T.; Kilcawley, K.N. The Impact of Terroir on the Flavour of Single Malt Whisk(e)y New Make Spirit. Foods 2021, 10, 443. [Google Scholar] [CrossRef]
  17. Baltajiev, R.; Fartzov, K.; Dimov, S. The Effects of Oak Wood in Chardonnay Wine Production and Maturation, as Determined by High Performance Liquid Chromatography. J. Wine Res. 2007, 5, 147–151. [Google Scholar] [CrossRef]
  18. Monica Lee, K.Y.; Paterson, A.; Piggott, J.R.; Richardson, G.D. Origins of Flavour in Whiskies and a Revised Flavour Wheel: A Review. J. Inst. Brew. 2001, 107, 287–313. [Google Scholar] [CrossRef]
  19. Caldeira, M.; Rodrigues, F.; Perestrelo, R.; Marques, J.C.; Câmara, J.S.; Alves, M.A.; Marques, J.C.; Fitzgerald, G.; James, K.J.; MacNamara, K.; et al. Changes in Volatile Composition of Madeira Wines during Their Oxidative Ageing. Anal. Chim. Acta 2003, 563, 188–197. [Google Scholar]
  20. Liu, M.; Zeng, Z.; Tian, Y. Elimination of Matrix Effects for Headspace Solid-Phase Microextraction of Important Volatile Compounds in Red Wine Using a Novel Coating. Anal. Chim. Acta 2005, 540, 341–353. [Google Scholar] [CrossRef]
  21. Karásek, P.; Planeta, J.; Varad’ová Ostrá, E.; Mikesová, M.; Goliás, J.; Roth, M.; Vejrosta, J. Direct Continuous Supercritical Fluid Extraction as a Novel Method of Wine Analysis. Comparison with Conventional Indirect Extraction and Implications for Wine Variety Identification. J. Chromatogr. A 2003, 1002, 13–23. [Google Scholar] [CrossRef]
  22. Ren, J.J.; Liu, H.Y.; Hao, Y.H.; He, P.G.; Fang, Y.Z. Determination of Resveratrol in Red Wine by Solid Phase Extraction-Flow Injection Chemiluminescence Method. Chin. Chem. Lett. 2007, 18, 985–988. [Google Scholar] [CrossRef]
  23. Fitzgerald, G.; James, K.J.; MacNamara, K.; Stack, M.A. Characterisation of Whiskeys Using Solid-Phase Microextraction with Gas Chromatography–Mass Spectrometry. J. Chromatogr. A 2000, 896, 351–359. [Google Scholar] [CrossRef]
  24. Kúskús, P.M.; Czabaj, S.; Jerkovíc, I.J. Comparison of Volatile Profiles of Meads and Related Unifloral Honeys: Traceability Markers. Molecules 2022, 27, 4558. [Google Scholar] [CrossRef]
  25. Angioni, A.; Pintore, G.A.M.; Caboni, P. Determination of Wine Aroma Compounds by Dehydration Followed by GC/MS. J. AOAC Int. 2012, 95, 813–819. [Google Scholar] [CrossRef]
  26. Owens, J.E.; Zimmerman, L.B.; Gardner, M.A.; Lowe, L.E. Analysis of Whiskey by Dispersive Liquid−Liquid Microextraction Coupled with Gas Chromatography/Mass Spectrometry: An Upper Division Analytical Chemistry Experiment Guided by Green Chemistry. J. Chem. Educ. 2015, 93, 186–192. [Google Scholar] [CrossRef]
  27. Fontana, A.; Rodríguez, I.; Cela, R. Dispersive Liquid–Liquid Microextraction and Gas Chromatography Accurate Mass Spectrometry for Extraction and Non-Targeted Profiling of Volatile and Semi-Volatile Compounds in Grape Marc Distillates. J. Chromatogr. A 2018, 1546, 36–45. [Google Scholar] [CrossRef]
  28. El-Sayed, A.M. The Pherobase: Database of Insect Pheromones and Semiochemicals. Available online: http://www.pherobase.com (accessed on 20 May 2022).
  29. Spínola, V.; Perestrelo, R.; Câmara, J.S.; Castilho, P.C. Establishment of Monstera Deliciosa Fruit Volatile Metabolomic Profile at Different Ripening Stages Using Solid-Phase Microextraction Combined with Gas Chromatography–Mass Spectrometry. Food Res. Int. 2015, 67, 409–417. [Google Scholar] [CrossRef]
  30. Ferreira, L.; Perestrelo, R.; Caldeira, M.; Câmara, J.S. Characterization of Volatile Substances in Apples from Rosaceae Family by Headspace Solid-Phase Microextraction Followed by GC-QMS. J. Sep. Sci. 2009, 32, 1875–1888. [Google Scholar] [CrossRef]
  31. Pang, Z.; Chong, J.; Zhou, G.; De Lima Morais, D.A.; Chang, L.; Barrette, M.; Gauthier, C.; Jacques, P.É.; Li, S.; Xia, J. MetaboAnalyst 5.0: Narrowing the Gap between Raw Spectra and Functional Insights. Nucleic Acids Res. 2021, 49, W388–W396. [Google Scholar] [CrossRef]
  32. Reis, D.; Silva, P.; Perestrelo, R.; C mara, J.S. Residue Analysis of Insecticides in Potatoes by QuEChERS-DSPE/UHPLC-PDA. Foods 2020, 9, 1000. [Google Scholar] [CrossRef] [PubMed]
  33. Oliveira do Nascimento, H.; Zillene Franklin da Silva, M.; Beserra Alexandre, J.; Bastos Vidal, C.; Vieira Carvalho, T.; Ferreira do Nascimento, R. New HS-SPME-GC-BID Method for the Determination of Volatile Constituents in Distilled Beverages. Microchem. J. 2022, 181, 107669. [Google Scholar] [CrossRef]
  34. Perestrelo, R.; Barros, A.S.S.; Câmara, J.S.S.; Rocha, S.M.M. In-Depth Search Focused on Furans, Lactones, Volatile Phenols, and Acetals as Potential Age Markers of Madeira Wines by Comprehensive Two-Dimensional Gas Chromatography with Time-of-Flight Mass Spectrometry Combined with Solid Phase Microextraction. J. Agric. Food Chem. 2011, 59, 3186–3204. [Google Scholar] [CrossRef] [PubMed]
  35. Phetxumphou, K.; Miller, G.; Ashmore, P.L.; Collins, T.; Lahne, J. Mashbill and Barrel Aging Effects on the Sensory and Chemometric Profiles of American Whiskeys. J. Inst. Brew. 2020, 126, 194–205. [Google Scholar] [CrossRef]
  36. Wiśniewska, P.; Dymerski, T.; Wardencki, W.; Namieśnik, J. Chemical composition analysis and authentication of whisky. J Sci Food Agric. 2015, 95, 2159–2166. [Google Scholar] [CrossRef] [PubMed]
  37. Yang, K.; Somogyi, A.; Thomas, C.; Zhang, H.; Cheng, Z.; Xu, S.; Miller, C.; Spivey, D.; Blake, C.; Smith, C.; et al. Analysis of Barrel-Aged Kentucky Bourbon Whiskey by Ultrahigh Resolution Mass Spectrometry. Food Anal. Methods 2020, 13, 2301–2311. [Google Scholar] [CrossRef]
  38. Heller, M.; Vitali, L.; Oliveira, M.A.; Costa, A.C.; Micke, G.A. A rapid sample screening method for authenticity control of whiskey using capillary electrophoresis with online preconcentration. J. Agric. Food Chem. 2011, 59, 6882–6888. [Google Scholar] [CrossRef]
  39. Savchuk, S.A.; Palacio, C.; Gil, A.; Tagliaro, F.; Kuznetsov, R.M.; Brito, A.; Appolonova, S.A. Determination of the chemical composition of alcoholic beverages by gas chromatography-mass spectrometry. J. Food Proc. Preserv. 2020, 44, e14676. [Google Scholar] [CrossRef]
  40. Mateo, J.J.; Jiménez, M.; Pastor, A.; Huerta, T. Yeast Starter Cultures Affecting Wine Fermentation and Volatiles. Food Res. Int. 2001, 34, 307–314. [Google Scholar] [CrossRef]
Figure 1. The influence of the extractor solvent on the extraction efficiency of volatile compounds from the FG12 sample whiskey. Abbreviations: D—dichloromethane; E—ethyl ether; H—hexane; D3E1—solution of dichloromethane and ethyl ether at a 3:1 ratio; D1E3—solution of dichloromethane and ethyl ether at a 1:3 ratio; D3H1—solution of dichloromethane and hexane at 3:1 ratio; D1H3—solution of dichloromethane and hexane at 1:3 ratio; E1H3—solution of ethyl ether and hexane at a 1:3 ratio.
Beverages 08 00053 g001
Figure 2. (a) The influence of the extraction solvent on the extraction efficiency by chemical family, and (b) the distribution of chemical families according to the extraction solvent using the FG12 whiskey sample. Abbreviations: D—dichloromethane; E—ethyl ether; H—hexane; Alc—alcohols; Est—esters; CC—carbonyl compounds; FC—furan compounds; FA—acids; VP—volatile phenols.
Beverages 08 00053 g002
Figure 3. The TIC chromatogram of a whiskey by DLLμE/GC-MS using dichloromethane as the extractor solvent and acetone as the disperser solvent. Peak identification: (1) 2-methylpropan-1-ol; (2) butan-1-ol; (3) ethyl hexanoate; (4) 3-methylbutan-1-ol; (5) ethyl orthoformate; (6) pentan-1-ol; (7) ethyl lactate; (8) hexan-1-ol; (9) ethyl octanoate; (10) acetic acid; (11) benzaldehyde; (12) butanoic acid; (13) ethyl decanoate; (14) diethyl succinate; (15) phenethyl acetate; (16) ethyl dodecanoate; (17) 2-phenylethanol; (18) ethyl tetradecanoate; (19) octanoic acid; (20) cyclodecane; (21) ethyl hexadecanoate; (22) decanoic acid; (23) 1-hexadecanol; (24) dodecanoic acid; (25) vanillin.
Beverages 08 00053 g003
Figure 4. (a) The total concentration (µg/L) of the volatile composition of the whiskeys, and (b) the total concentration (µg/L) of the chemical families identified in the whiskeys. Different uppercase letters in the chemical family represent statistically significant differences among the whiskeys obtained by one-way ANOVA with the post hoc Tukey’s test at the p < 0.05 level. Legend: MANS—Malt Whisky A New Spirit; MA4Y—Malt Whisky A 4 years old cask; MAFP—Malt Whisky A Final Product; HPDK—Highland Park Malt; HP1210—Highland Park 1210 Malt; HP1840—Highland Park 1840 Malt; FGOR—Famous Grouse Old Reserve; FGF—Famous Grouse Finest; FG12—Famous Grouse 12 year old Malt.
Beverages 08 00053 g004
Figure 5. (a) The PC1 vs. PC2 scatter plot and (b) biplot of PCA of the main sources of variability among different whiskeys.
Beverages 08 00053 g005
Figure 6. The PLS-DA of the volatilomic fingerprint of whiskeys. (a) Score plot, (b) VIP scores, (c) 10-fold cross-validation performance, and (d) model validation by permutation test based on 1000 permutation of VOCs obtained by the GC-FID of the whiskeys. * Represent the highest Q2 value.
Beverages 08 00053 g006
Figure 7. The hierarchical cluster analysis of the investigated whiskeys.
Beverages 08 00053 g007
Table 1. The performance characteristics of the DLLμE/GC-FID for the volatile compounds identified in the whiskeys.
RI aLRI bChemical FamiliesLinear Range (µg/L)R2SlopeInterceptLOD c (ng/L)LOQ d (ng/L)TruenessPrecision (RSD %)
Rec. (%) ± % RSDIntra−DayInter−Day
Alcohols
10451046Butan-2-ol1.00–1200.9970.21−1.0421.471.490 ± 12.155.68
10561052Propan-1-ol1.00–1900.9960.04−0.5825.685.286 ± 31.562.72
11871173Butan-1-ol0.03–19.60.9980.080.000.561.8697 ± 22.023.61
124612443-Methylbutan-1-ol20.0–6000.9990.25−1.6328.896.074 ± 51.242.71
13801376Hexan-1-ol0.20–20.00.9990.160.010.501.6798 ± 33.754.70
16871686Methionol0.30–23.00.9950.140.021.956.5096 ± 58.7614.6
18491848Benzyl alcohol0.04–37.00.9970.330.191.444.8390 ± 30.991.26
195019472-Phenylethanol0.50–1200.9960.16−1.2335.211799 ± 21.732.85
21102103Phenoxyethanol0.20–50.50.9960.39−3.3031.810596 ± 12.034.13
Esters
11381137Isoamyl acetate0.10–24.00.9990.130.010.652.1489 ± 12.342.80
12231221Ethyl hexanoate0.10–2000.9990.34−2.468.6428.898 ± 22.083.81
13191312Ethyl lactate0.10–60.00.9960.10−2.085.5618.597 ± 30.941.51
14531458Ethyl octanoate0.10–2000.9970.41−5.4819.264.194 ± 10.671.56
16101610Ethyl decanoate0.10–2000.9980.58−0.041.204.0097 ± 42.144.18
16621668Diethyl succinate0.10–21.00.9990.42−0.030.632.0899 ± 31.954.65
18551850Ethyl dodecanoate0.10–1000.9990.43−3.086.1120.496 ± 32.693.89
Acids
14041408Acetic acid0.20–50.00.9980.05−1.4854.918393 ± 64.837.66
16691666Butanoic acid0.30–50.00.9970.01−0.4763.121089 ± 55.029.31
18151814Hexanoic acid0.20–1000.9980.28−3.6639.613287 ± 22.215.34
20802083Octanoic acid0.20–1000.9970.34−9.0534.711689 ± 310.313.7
22732276Decanoic acid0.20–1000.9980.30−9.3950.416794 ± 49.8512.9
Carbonyl compounds
741744Acetaldehyde0.30–50.00.9990.050.139.2331.070 ± 44.985.45
29012907Syringaldehyde0.30–50.00.9980.140.4836.912393 ± 87.669.44
Furan compounds
14441445Furfural0.30–50.00.9980.15−1.1923.879.486 ± 66.957.74
156515605-Methylfurfural0.30–50.00.9980.12−0.031.103.6799 ± 912.914.7
Volatile phenol
18801873Guaiacol0.10–30.00.9930.350.344.2312.391 ± 54.926.12
a RI—retention index calculated using a n-alkanes C7-C30 solution on the BP-20 column; b LRI—retention index from Adams; c LOD—limit of detection; d LOQ—limit of quantification. Rec.—Recovery.
Table 2. The concentration (mean ± standard deviation) of the volatile compounds (VOCs) identified in the whiskey samples using DLLμE/GC-FID.
Chemical FamiliesIDCodeConcentration (µg/L)
MANSMA4YMAFPHPDKHP1210HP1840FGORFGFFG12
Alcohols
Butan-2-olR, MSBUT213.1 ± 0.238.24 ± 0.118.71 ± 0.075.79 ± 0.046.78 ± 0.046.62 ± 0.038.52 ± 0.037.62 ± 0.049.19 ± 0.02
Propan-1-olR, MSPROP171.3 ± 0.0273.1 ± 0.0340.4 ± 0.0192.1 ± 0.1145.1 ± 0.0647.0 ± 0.0151.9 ± 0.0543.9 ± 0.0240.3 ± 0.02
Butan-1-olR, MSBUT10.45 ± 0.030.70 ± 0.0510.3 ± 0.024.64 ± 0.039.44 ± 0.056.78 ± 0.004.85 ± 0.002.75 ± 0.008.75 ± 0.01
Hexan-2-olMSHEX2--0.09 ± 0.01---0.08 ± 0.00-0.46 ± 0.07
3-Methylbutan-1-olR, MS3M1B232 ± 0.06256 ± 4.32430 ± 5.25239 ± 0.01425 ± 5.89433 ± 8.11221 ± 1.42235 ± 1.69472 ± 2.56
Pentan-1-olMSPENT1--0.40 ± 0.02-0.23 ± 0.01-0.14 ± 0.010.23 ± 0.010.38 ± 0.06
Hexan-1-olR, MSHEX11.61 ± 0.024.99 ± 0.052.36 ± 0.012.75 ± 0.021.22 ± 0.041.58 ± 0.021.39 ± 0.010.76 ± 0.001.38 ± 0.19
MethionolR, MSMETH---0.87 ± 0.01-----
Benzyl alcoholR, MSBENA-0.05 ± 0.01---0.12 ± 0.01--0.42 ± 0.03
2-PhenylethanolR, MSPHEN26.9 ± 0.4815.7 ± 0.039.77 ± 0.0722.9 ± 0.2411.5 ± 0.0511.1 ± 0.0410.9 ± 0.029.69 ± 0.019.86 ± 0.02
2-PhenoxyethanolR, MSPHENO12.9 ± 0.2315.3 ± 0.7212.1 ± 0.1615.5 ± 0.1713.8 ± 0.2814.3 ± 0.1611.3 ± 0.139.93 ± 0.1011.0 ± 0.09
Hexadecan-1-olR, MSHEXAD0.38 ± 0.010.52 ± 0.020.43 ± 0.010.20 ± 0.030.18 ± 0.010.25 ± 0.010.62 ± 0.260.15 ± 0.010.06 ± 0.01
Esters
Isoamyl acetateR, MSISOAC8.70 ± 0.015.21 ± 0.020.32 ± 0.0013.3 ± 0.088.38 ± 0.065.46 ± 0.115.07 ± 0.014.39 ± 0.0212.9 ± 0.03
Ethyl hexanoateR, MSEHEX129 ± 1.0176.9 ± 1.8053.5 ± 0.09136 ± 1.0583.8 ± 0.1369.7 ± 0.1358.3 ± 0.0354.8 ± 0.0255.3 ± 0.10
Ethyl ortoformateMSEORT0.14 ± 0.010.55 ± 0.030.73 ± 0.040.43 ± 0.020.57 ± 0.040.67 ± 0.010.39 ± 0.050.22 ± 0.010.26 ± 0.04
Ethyl lactateR, MSELAC2.15 ± 0.054.30 ± 0.107.81 ± 0.0122.7 ± 1.9825.2 ± 0.0635.1 ± 0.025.54 ± 0.008.92 ± 0.0111.7 ± 0.95
Ethyl octanoateR, MSEOCT60.5 ± 0.1061.4 ± 0.0460.3 ± 0.0451.0 ± 0.1354.6 ± 0.1158.1 ± 0.0628.3 ± 0.0727.9 ± 0.0034.2 ± 0.06
Ethyl decanoateR, MSEDEC92.6 ± 0.0093.2 ± 0.01105 ± 0.2294.7 ± 0.0597.2 ± 1.37115 ± 1.06124 ± 0.01127 ± 0.13130 ± 0.22
Diethyl succinateR, MSDSUC0.33 ± 0.011.09 ± 0.031.46 ± 0.020.29 ± 0.010.71 ± 0.041.30 ± 0.060.36 ± 0.000.28 ± 0.000.29 ± 0.00
Ethyl 9-decenoateMSE9DEC--0.11 ± 0.02-0.37 ± 0.11-0.14 ± 0.02-0.10 ± 0.01
Phenylethyl acetateMSPHENAC0.17 ± 0.020.23 ± 0.040.35 ± 0.010.45 ± 0.020.92 ± 0.134.57 ± 0.030.36 ± 0.060.67 ± 0.012.02 ± 0.11
Ethyl dodecanoateR, MSEDODE10.8 ± 1.4037.5 ± 0.979.46 ± 0.1733.8 ± 0.2419.1 ± 0.4818.6 ± 0.8212.7 ± 0.125.60 ± 0.158.22 ± 0.30
Ethyl tetradecanoateMSETET0.08 ± 0.060.12 ± 0.010.32 ± 0.010.28 ± 0.050.60 ± 0.040.38 ± 0.030.44 ± 0.060.19 ± 0.010.22 ± 0.03
Acids
Acetic acidR, MSAACE2.15 ± 0.023.09 ± 0.148.86 ± 1.05-----5.41 ± 0.14
Butanoic acidR, MSBUTA8.14 ± 0.0417.7 ± 0.1416.9 ± 0.1115.7 ± 0.0418.7 ± 0.0819.1 ± 0.1514.8 ± 0.0114.0 ± 0.0318.1 ± 0.21
Hexanoic acidR, MSHEXA27.7 ± 0.0342.8 ± 1.3150.3 ± 1.4339.2 ± 0.1059.5 ± 1.4561.5 ± 1.7535.8 ± 0.6427.5 ± 0.0355.6 ± 2.43
Octanoic acidR, MSOCTA99.7 ± 0.1386.5 ± 0.0954.3 ± 1.3460.4 ± 0.0921.9 ± 0.0121.0 ± 0.0042.6 ± 0.0821.4 ± 0.0021.3 ± 0.05
Decanoic acidR, MSDECA50.7 ± 0.7550.5 ± 1.7358.9 ± 2.8467.8 ± 1.0971.1 ± 2.1171.9 ± 2.0255.6 ± 1.4239.4 ± 0.6359.8 ± 2.80
Dodecanoic acidMSDODA--3.24 ± 2.45-4.87 ±1.47-1.77 ± 0.62-3.16 ± 0.46
Carbonyl compounds
AcetaldehydeR, MSACET16.7 ± 0.1132.4 ± 0.0626.1 ± 0.0811.1 ± 0.1024.7 ± 0.0825.9 ± 0.0611.3 ± 0.0621.7 ± 0.0420.2 ± 0.02
BenzaldehydeMSBENZ--0.26 ± 0.02-----3.75 ± 0.56
SyringaldehydeR, MSSYR-11.6 ± 0.015.91 ± 0.46-4.42 ± 0.161.35 ± 0.080.70 ± 0.0931.1 ± 0.584.47 ± 0.16
Furanic compounds
2-FurfuralR, MS2FUR20.2 ± 0.0637.2 ± 1.2616.8 ± 0.0318.4 ± 0.0314.5 ± 0.0317.4 ± 0.046.88 ± 0.032.65 ± 0.0212.4 ± 0.01
5-MethylfurfuralR, MS5M2F-1.99 ± 0.020.75 ± 0.00-0.76 ± 0.010.93 ± 0.010.53 ± 0.000.43 ± 0.000.62 ± 0.00
Volatile phenols
PhenolMSPHEN----0.12 ± 0.01----
VanillinMSVAN0.42 ± 0.040.54 ± 0.020.58 ± 0.080.14 ± 0.010.32 ± 0.060.27 ± 0.040.14 ± 0.070.13 ± 0.010.18 ± 0.03
Others
CyclodecaneMSCDEC3.53 ± 0.461.15 ± 0.160.12 ± 0.011.03 ± 0.021.42 ± 0.140.15 ± 0.030.53 ± 0.080.47 ± 0.040.28 ± 0.01
-—not detected; R—identified by comparing retention time and RI of VOCs with authentic standards injected in the same run conditions; MS—tentatively identified on the basis of RI with those from the NIST 05 MS Library; MANS—Malt Whisky A New Spirit; MA4Y—Malt Whisky A 4 years old cask; MAFP—Malt Whisky A Final Product; HPDK—Highland Park Malt; HP1210—Highland Park 1210 Malt; HP1840—Highland Park 1840 Malt; FGOR: Famous Grouse Old Reserve; FGF—Famous Grouse Finest; FG12—Famous Grouse 12 years old Malt.
Publisher’s Note: MDPI stays neutral with regard to jurisdictional claims in published maps and institutional affiliations.

